Article

Analysis of Combining Ability to Obtain Tropical Carrot Hybrids for Production Traits

by
Fernanda Gabriela Teixeira Coelho
1,
Gabriel Mascarenhas Maciel
2,*,
Ana Carolina Silva Siquieroli
3,
Camila Soares de Oliveira
2,
Nádia Nardely Lacerda Durães Parrella
4,
Amilton Ferreira da Silva
4,
José Magno Queiroz Luz
5 and
Ana Paula Oliveira Nogueira
6
1
Postgraduate Program in Agronomy, Institute of Agrarian Sciences, Federal University of Uberlândia, Uberlândia 38410-337, Brazil
2
Institute of Agrarian Sciences, Federal University of Uberlândia, Monte Carmelo 38500-000, Brazil
3
Institute of Biotechnology, Federal University of Uberlândia, Monte Carmelo 38500-000, Brazil
4
Department of Agricultural Sciences, Federal University of São João Del-Rei, Sete Lagoas 35701-970, Brazil
5
Institute of Agrarian Sciences, Federal University of Uberlândia, Uberlândia 38410-337, Brazil
6
Institute of Biotechnology, Federal University of Uberlândia, Uberlândia 38405-319, Brazil
*
Author to whom correspondence should be addressed.
Submission received: 15 March 2024 / Revised: 14 April 2024 / Accepted: 17 April 2024 / Published: 26 April 2024

Abstract

:
Carrots (Daucus carota L.), a globally significant vegetable, lack extensive research on heterotic groups and diallel analysis to generate hybrid combinations. Thus, the objective of this study was to assess combining abilities and identify optimal carrot parents for producing hybrids suitable for tropical climates with elevated metabolite levels. Twenty carrot hybrids, ten parent plants, and three commercial cultivars were evaluated during the summers of 2020/2021 and 2021/2022. Agronomic evaluations were carried out and chlorophyll and carotenoid levels were determined, followed by a diallel analysis using Griffing’s Method III and GGE biplot analysis. There were significant general combining ability (GCA) effects for various agronomic traits, suggesting additive genetic effects. Based on GCA, cultivars 5, 4, and 2 were the most promising parents. Specific combining ability (SCA) revealed that hybrids 1 × 2 and 3 × 5 stood out in environment 1, whereas hybrids 1 × 5 and 5 × 3 performed well in environment 2. The GGE biplot analysis showed that hybrids 1 × 2 and 3 × 2 displayed larger average root diameters, belonged to the group with the best bolting percentages, and exhibited stability across environments. Moreover, hybrids 2 × 4, 3 × 1, 4 × 1, and 4 × 2 exhibited higher metabolite levels. These findings suggest the feasibility of obtaining superior hybrids tailored for the tropical carrot market.

1. Introduction

Carrots (Daucus carota L.) are one of the most important vegetables globally, renowned for their extensive production area, market value, delightful taste, and rich nutritional composition. The vegetable serves as a remarkable reservoir of carotenoids, phenolic compounds, dietary fiber, vitamins, and carbohydrates [1,2,3]. With an annual production surpassing 41 million tons and covering 1.1 million hectares worldwide [4], its significance is undeniable. In Brazil, where production estimates exceed 480,000 tons annually, it reigns as the most economically valuable root vegetable in the country [5].
At present, the carrot seed market is predominantly centered on hybrid cultivars. Hybrid carrot varieties can solely be developed with the inclusion of cytoplasmic male sterility (CMS) in their genetic makeup [6]. As a result, heterosis emerges as a promising mechanism for augmenting commercial root yield, carotenoid content, and disease resistance [7]. Despite the economic promise associated with carrots, there remains a scarcity of hybrids well suited for summer cultivation, particularly in the tropical conditions prevalent in Brazil.
The study of hybrid production can be facilitated through a diallel analysis, which provides insights into genetic parameters and combining abilities. This valuable information aids in the selection of parent plants for hybridization and enhances our understanding of gene action in trait determination and the occurrence of heterosis, thus driving significant advancements in selection processes [8]. Diallel analysis finds wide application in assessing hybrid combinations across various species, such as maize [9], tomatoes [10], eggplants [11], and onions [12].
However, the development and adoption of heterotic groups in carrots remain limited [6]. There exists a gap in the utilization of diallel analysis in carrots, primarily due to the manner in which hybrids are derived through male sterility. Therefore, the objective of this study was to estimate combining abilities and identify optimal carrot parents for producing hybrids suitable for tropical climates, characterized by elevated levels of nutritional metabolites.

2. Materials and Methods

2.1. Genetic Material, Experimental Site, and Flow

The experiment was conducted at Bayer’s Horticultural Experimental Station in the municipality of Carandaí, MG, situated at an altitude of 1096 m. A sample analysis was conducted at the Monte Carmelo campus of the Federal University of Uberlândia (UFU). Five fertile male carrot genotypes along with their corresponding five sterile male isogenic lines, sourced from the Seminis Tropical Carrot Improvement Program in Brazil, were carefully selected. The crossing of these genotypes was meticulously performed in a controlled manner utilizing the balanced diallel model, Griffing method III (5 × 4), spanning from May to October 2020 (Figure 1).
The evaluation encompassed 20 carrot hybrids, 10 parent plants, and 3 commercial entries serving as controls (comprising 2 hybrids and a tropical open-pollinated cultivar), conducted across the summer seasons of 2020/2021 (environment 1) and 2021/2022 (environment 2). Both trials employed a randomized complete block design (RCBD) with three replications. The materials were sown in beds measuring 1.5 m in width, with plots consisting of five planting rows, each 2 m in length and spaced 20 cm apart. The effective plot area included all rows except for a 50 cm section at both the beginning and end of the plot. The average data regarding maximum, average, and minimum temperature and precipitation during the experiment are described in Figure 2.
The methodological steps for the agronomic evaluation, biochemical analysis, and data analysis are illustrated in the flowchart in Figure 3.

2.2. Assessment of Agricultural Traits in the Field

After 110 days of sowing, an agronomic evaluation of the entries was conducted. The bolting percentage of each genotype (BP) was evaluated, followed by the severity of leaf blight in the plots (DIS), using a grading scale from 1 to 5 (1 = >90% severity, 2 = 50–90%, 3 = 12.5–50%, 4 = 3.8–12.5%, and 5 = <3.8% severity) [13].
After harvesting, the fresh leaf weight (LW) was measured in kilograms (kg). The number and weight (kg) of marketable roots (ranging from 10 to 26 cm in length) and non-marketable roots (those less than 10 cm in length, broken, split, or forked) were evaluated. Subsequently, the data were converted into estimated marketable root yield (MYH) and estimated total yield (measured in t ha−1) (TYH). In a random sample comprising 10 roots, the average diameter (measured at the midpoint of each root) (RD) and the average length (RL) were determined.

2.3. Diallel Analysis

The diallel analyses for each environment were derived from the means of each location, following the statistical models of Griffing [14], specifically method 3, which accounts for the effects of F1 hybrids and their reciprocals, using the GENES software version 1990.2021.131 [15]. The statistical mathematical model [8] is given as follows:
Y ij = μ + g i + g j + s ij + r ij + e ij ¯
where Yij is the average value of the F1s and reciprocals; i, j = 1, 2…; µ is the fixed effect of the overall mean; gi and gj are the fixed effects of the general combining ability of the i-th and j-th parent, respectively; sij is the fixed effect of the specific combining ability for the crosses between parents i and j; rij is the reciprocal fixed effect, which measures the differences resulting from using parent i or j as male or female in the cross; and eij is the random effect of average experimental error.

2.4. GGE Biplot

The GGE biplot analysis (genotype main effect plus genotype-by-environment interaction) [16] was proposed for analyzing the multi-environment trial (MET) data through graphical representation. The GGE biplot is based on principal component analysis to interpret the two components (PC1 and PC2): genotype (G) and genotype-by-environment interaction (G × E). The graphical representation of the biplot is considered valid if it accounts for most (at least 70%) of the variance [17].
The data on bolting percentage and root diameter across all environments were analyzed using GGE biplot construction according to the model:
Yij = μ + βj + αi + θij + εij
where Yij is the value of the mixed effect of the grand mean (μ) modified by the genotype main effect (αi), the environment main effect (βj), and the genotype-by-environment interaction due to genotype i and environment j (θij), plus any random error (εij).
GGE biplot tools were used to identify highly adaptable carrot entries with a maximum mean by ‘Mean vs. Stability’ [16]. The GGE biplot, viewed through the average environment coordinate (AEC), highlighted the high mean yielders and stable entries via the AEC abscissa and AEC ordinate, respectively. Additionally, the ‘which-won-where’ pattern, an inherent feature of the GGE biplot resulting from the inner-product property of the genotype via the environment dataset biplot, was visually depicted. Furthermore, the ‘Discriminative vs. Representative’ graph visually illustrated associations within and among the genotypes and environments.
The analysis was conducted using the GGEBiplotGui package in the R software version 4.1.2 [18].

2.5. Biochemical Analysis of Pigment Extraction from Leaves and Root

To determine the nutritional value of each entry, the leaf content of total carotenoids (CTL), chlorophyll a (ChlA), chlorophyll b (ChlB), and total chlorophyll (ChlT) was assessed and evaluated. Additionally, the contents of total β-carotenoids (CTR) and lycopene (LP) in the roots were measured. Samples were obtained from the experiment conducted in 2020/2021, during which leaves and five roots from each plot were collected and subsequently sent to the laboratory for analysis.
The fresh leaves and roots were washed and crushed. We used 0.5 g of leaf in 5 mL of a 1:1 acetone and petroleum ether solution, and 1 g of root in 3 mL of a 1:1 acetone and petroleum ether solution. After 24 h of reaction in the absence of light, the absorbance of the supernatant was measured using a UV-5100 digital spectrophotometer (Kalstein Co., Paris, France). The wavelengths used included 470 nm for CTL and CTR; 645, 652, and 663 nm for ChlA, ChlB, and ChlT; and 450 nm for LP. The leaf pigment content (µg/g of fresh tissue) was calculated from the absorbance [19,20,21].
The mean levels of each pigment were grouped utilizing the Scott–Knott test at both the 1% and 5% significance levels, employing the GENES software version 1990.2021.131 [15].

3. Results and Discussion

3.1. Diallel Analysis
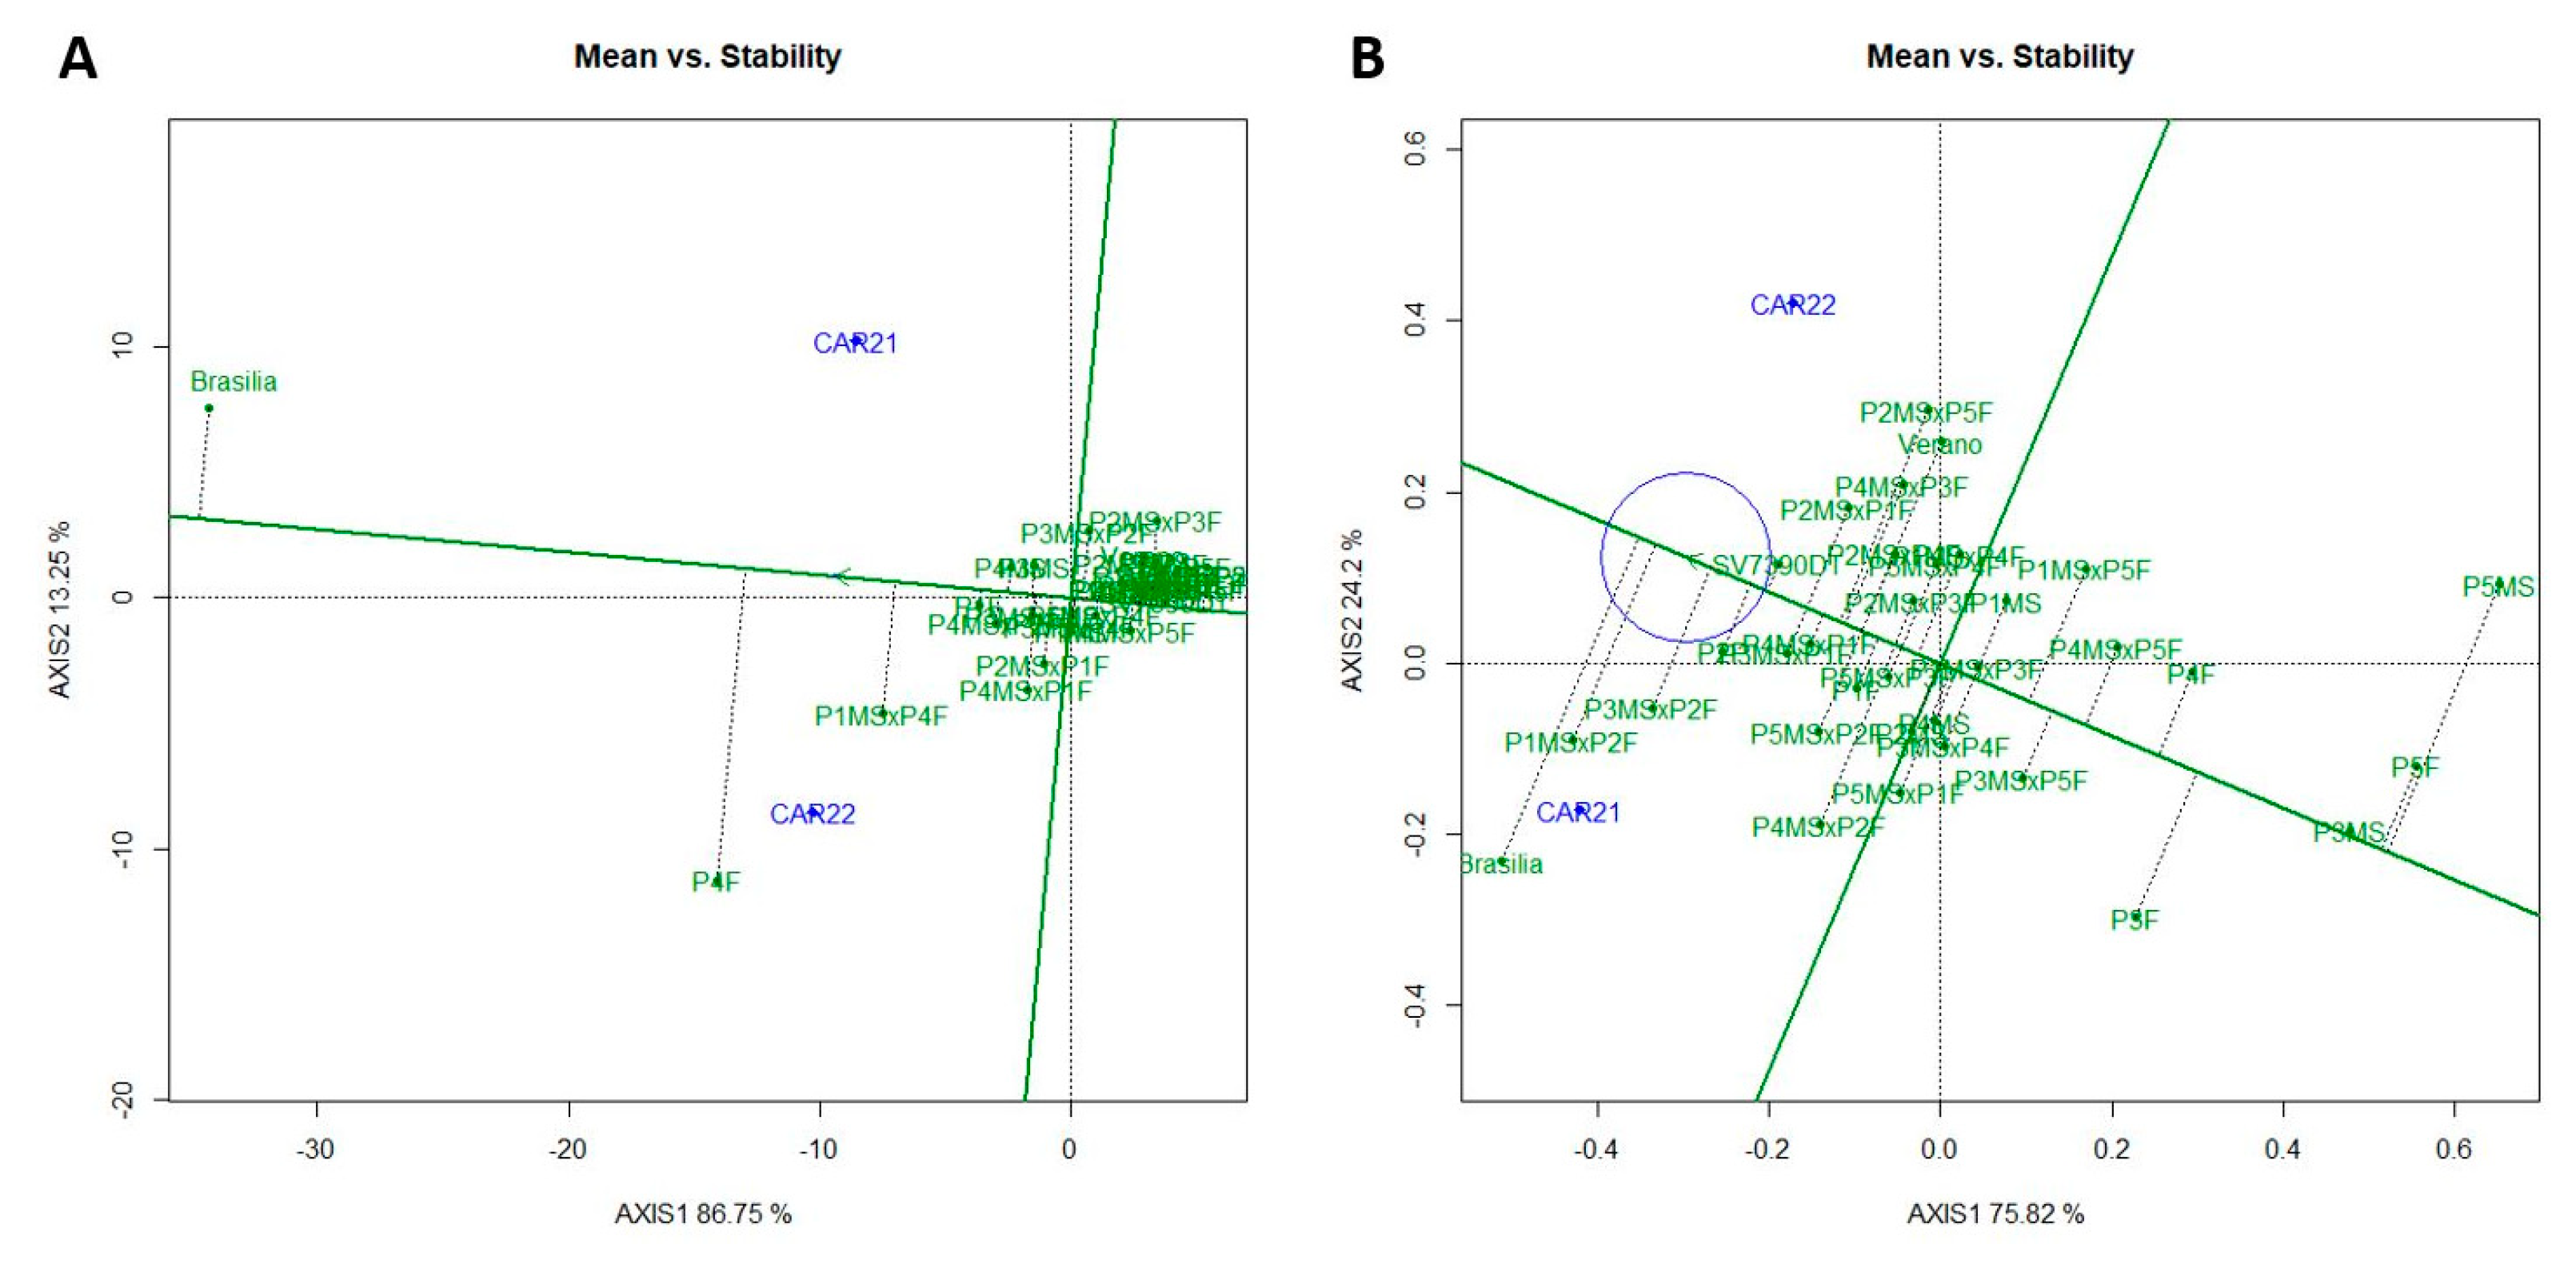
The genetic variability was observed among the carrot entries for all the traits evaluated, demonstrating the presence of phenotypic variability among them (Table 1).
The coefficient of variation (CV) of the root diameter was 5.85% and the CV of the bolting percentage was 58.30%. The agronomic traits of the bolting percentage, fresh leaf weight, and estimated total yield demonstrated high heritability (93.31%, 91.57%, and 80.84%, respectively), which is consistent with the CVg/CVe ratio values close to or exceeding 1. Similar to this study, another study found high heritability for the commercial root mass (82.18%) and total root mass (81.85%) traits [22].
There was a significant interaction between genotypes and environments (G×E) for the bolting percentage, severity of leaf blight, and root diameter. A study conducted in Distrito Federal, Brazil, involving carrots, observed a genotype-by-environment (G×E) interaction for all evaluated traits: the number and total mass of roots, the number and mass of marketable roots, and the severity of leaf blight [7]. Another study conducted in the United States involving carrots observed a genotype-by-environment (G×E) interaction for plant height and leaf weight [6].
In this study, as most traits exhibited a non-significant genotype–environment interaction, it was determined to conduct individual diallel analyses for each environment. Diallel analyses serve to assess the combining ability of parents, pinpointing those most adept at transmitting desirable traits to their progeny. Additionally, it facilitates the selection of the most promising crosses for further hybrid exploration [7].
GCA is estimated by evaluating the average performance of a parent when crossed with others, and it is associated with the presence of the additive effects of alleles and additive epistatic interactions. Conversely, SCA refers to a specific interaction between two parents whose performance is either higher or lower than expected based on the average performance of both parents. SCA is linked to the effects of dominance and epistasis, including dominance effects [14,23]. The predominance of additive gene action for a given trait supports genetic improvement through selection.
The diallel analysis of variance (Table 2) revealed that in environment 1, there was genetic variability among the carrot entries and a significant GCA effect, indicating additive effects for the bolting percentage, severity of leaf blight, root diameter, and fresh leaf weight traits. In environment 2, the significant effect of GCA was observed for bolting percentage, root length, fresh leaf weight, and estimated total yield. A significant SCA effect was observed for the bolting percentage and fresh leaf weight in environment 1 and the bolting percentage in environment 2.
Significant effects of GCA and SCA on the number and total mass of roots, the number and mass of commercial roots, and the severity of leaf blight were found [7]. The authors concluded that neither GCA nor SCA effects predominated in the different years evaluated, indicating that both effects were significant. In turn, other authors indicated that the phenotypes observed in their studies were largely under additive genetic control [6].
Hybrids derived from crosses between tropical and temperate lines were evaluated and a prevalence of non-additive effects on leaf blight was observed, while additive effects predominated in the expression of root yield traits [24]. Similarly, carrot lines originating from Europe were investigated and a predominance of additive effects on the total root yield was observed, with non-additive effects more pronounced on the commercial root yield [25]. It has been proposed that the prevalence of additive or non-additive genetic action in carrot hybrids depends on the specific heterotic groups under evaluation [7].
The GCA and SCA estimates can be analyzed for the variables where these effects were significant, according to an analysis of variance (Table 2). In reference to the GCA effects (Table 3), it is evident that in environment 1, entry 5 exhibited superior performance in terms of the bolting percentage and fresh leaf weight, whereas entry 2 excelled in the severity of leaf blight and root diameter. Conversely, in environment 2, entry 5 once again distinguished itself for its bolting percentage and fresh leaf weight, indicating the consistency of this entry across these traits. Additionally, entry 4 showcased notable effects on the root length, while entry 2 demonstrated better effects on estimating the total yield.
Regarding the effects of SCA (Table 4), it is important to note that for a cross to be recommended, at least one parent must have a high GCA [8]. Given that in environment 1 the key variables for SCA were the bolting percentage and fresh leaf weight (Table 2), and the entries with the highest GCA for these variables were entries 5 and 1 (Table 3), the most promising crosses for the bolting percentage were 1 × 2, 2 × 5, and 3 × 5, with bolting percentages of 0.51%, 0.00%, and 0.00%, respectively. The 1 × 2, 1 × 5, 3 × 5, and 4 × 5 crosses yielded the best results for the fresh leaf weight, with 3.60, 4.72, 4.37, and 3.86 kg, respectively. The effects of the reciprocals were not significant for these two variables (Table 2).
In environment 2, only the bolting percentage variable shows significant effects on SCA, with notable significant reciprocal effects (Table 2). Similar to environment 1, entry 5 showed the strongest GCA effect, while entry 3 also stood out (Table 3). This indicates that the most successful crosses for the bolting percentage in the summer of 2021/2022 were hybrids 1 × 5, 3 × 2, 3 × 4, 4 × 5, 5 × 3, and 5 × 4, with bolting percentages of 1.62, 2.73, 5.71, 4.00, 1.03, and 4.66%, respectively.
The results of these specific combinations suggest that gene complementarity in these crosses was due to both additive and non-additive genes [7].

3.2. GGE Biplot

Understanding the performance and stability of the best genotypes and hybrids across various environments is crucial. Tests conducted at multiple locations can provide valuable insights into this aspect. However, conventional genotype evaluations tend to emphasize primary effects, often neglecting genotype-by-environment interactions (GEI) as mere noise or confounding factors. It is essential to consider both G (genotypic) and GE (genotype-by-environment) effects simultaneously when evaluating genotypes. The GGE biplot method is particularly useful in this regard as it identifies interaction patterns and integrates the effects of G and GE from a genotype-by-environment dataset [26].
A GGE biplot analysis was then conducted for the bolting percentage and root diameter variables, revealing a significant genotype-by-environment interaction (G×E) in the analysis of variance (Table 1).
According to the GGE biplot methodology, the first two principal components (PCA1 and PCA2) are derived from the singular value decomposition of the genotype (G) and genotype-by-environment interaction effects (G×E). They accounted for 86.75% and 13.25% of the total variation in bolting percentage, respectively, and for 75.82% and 24.18% of the total variation in root diameter, respectively (Figure 4, Figure 5 and Figure 6). For both traits, PCA1 and PCA2 together explain 100% of the observed variation in the experiment.
The visualization of the GGE biplot, particularly the discriminative vs. representative graphs (Figure 4), aids in assessing the tested environments. The length of the vector, which represents the absolute distance from the marker of an environment to the origin in the plot, serves as a measure of discrimination. In essence, as the vector length increases, environmental discrimination improves [27]. Hence, the two environments under examination are distinct (informative) because they are positioned far from the main axis. Furthermore, they are discriminated to the same extent, as indicated by the vectors being of equal size.
The average environment (represented by the small circle at the end of the arrow) is defined by the average coordinates of all the test environments. The AEA (average environment axis) is the line passing through the environmental average and the origin of the biplot. A test environment that aligns more closely with the AEA is considered more representative than other test environments [27]. Therefore, the two environments are distinct, positioned at opposite ends of the graph. Furthermore, they are equally representative, forming the same angle as the AEA. As they are entirely different from each other, the environments are not correlated.
The genotype-by-environment interaction was investigated as well as the selection of maize hybrids, under varying moisture regimes [28]. They found that the discriminative vs. representative GGE biplot visualization could graphically represent the discrimination and representation among the seven tested environments. The performance and stability of the genotypes were confirmed graphically using the GGE biplot in the mean vs. stability view, as shown in Figure 5.
The first principal component (PCA1) indicates the adaptability of the genotypes, while the second principal component (PC2) indicates stability, meaning that the genotypes closest to the origin in the biplot are the most stable [26].
In the mean vs. stability graph, two lines are depicted: the green line represents the average environment axis (AEA) or average environment coordination (AEC) on the x-axis. On the y-axis, the ordinate is labeled AEC as well. The AEA is the line parallel to PCA1, traversing through the hypothetical average environment. The distance from the EEA points toward higher average values for the measured trait, indicating that entries situated farthest to the left on the graph possess the highest averages across environments [27].
For the bolting percentage, the Brasília cultivar, fertile entry 4, and hybrid 1 × 4 exhibited the highest values, at 28.37%, 12.94%, and 8.71% bolting, respectively. The remaining entries showed values very close to each other, ranging from 0 to 6.27% (Figure 5A). Concerning the root diameter, the Brasília cultivar, along with hybrids 1 × 2 and 3 × 2, demonstrated higher averages, measuring 3.6, 3.58, and 3.53 cm, respectively. In contrast, entries 3 (both fertile and sterile) and 5 (both fertile and sterile) displayed lower averages, with 3.10 for fertile and 2.97 for sterile in entry 3, and 2.93 for both sterile in entry 5 (Figure 5B). These observations align with the estimates of the GCA effect (Table 3), indicating that entry 2 was particularly noteworthy in its hybrid combinations for root diameter.
The second line, which runs parallel to PCA2 and is labeled AEC (average environment coordinate), is also referred to as the stability line. This line passes through the origin and is perpendicular to the AEA (average environment axis). Therefore, the smaller the projection or distance from the EEA (environment average), the more stable or less variable the performance of the genotypes across the tested environments [27].
For the bolting percentage, most entries demonstrated high stability across environments, closely aligning with the EEA, except for the cultivar Brasília, entry 4, and hybrid 1 × 4 (Figure 5A). For the root diameter, although the Brasília cultivar has the highest average, it shows low stability across environments, as the vector connecting the EEA is long. The 1 × 2 and 3 × 2 hybrids are more stable, with entry 3 in the sterile male version being highly stable yet having a low average root diameter. It was reported that high stability is desirable only when it is associated with high average performance [29].
The which-won-where graphs in Figure 6 depict the top-performing genotypes often termed “winners,” presented in the form of a polygon. This biplot polygon illustrates which genotypes excelled in one or more environments. Various sectors are delineated by lines perpendicular to the sides of the polygon and passing through the center of the biplot. These lines are known as lines of equality [16]. Genotypes situated at the vertices of the polygon signify the best or worst performers across one or more environments. Specifically, the genotype positioned at the vertex of the polygon demonstrates superior performance in the environment defined by the sectors [29]. The sectors formed by the line of equality facilitate visual comparison of the genotypes across the tested environments.
For the bolting percentage trait (Figure 6A), a sector was formed at the intersection of the two environments. The Brasília cultivar and the fertile entry 4 occupy the apices of this sector, displaying the highest bolting rates of 28.37% and 12.94%, respectively. However, for this trait, our interest lies in genotypes with the lowest values or those that do not bolt, rendering these two entries the least desirable in both environments. Conversely, the other entries were clustered closely to the origin between the two environments, with bolting values ranging from 0 to 8.71%, indicating better stability.
Regarding the root diameter (Figure 6B), the CAR21 environment is situated within a sector where the Brasília cultivar stands out, suggesting it exhibits the best performance in this environment, with an average root diameter of 3.6 cm. Conversely, the CAR22 environment is positioned in a distinct sector where the 2 × 5 hybrid emerges as the apex and winning genotype, boasting an average root diameter of 3.42 cm.
The GGE biplot mean vs. stability analysis was employed as well as which—won—where graphs to identify suitable regions in Punjab, India, for cultivating seeds of European carrot varieties [26]. Their findings indicated that European carrot cultivars are suitable for seed production in the submontane regions of Punjab. Conversely, in a study with the objective of evaluating the adaptability and stability of the carrot populations in Brazil, the AMMI, GGE biplot, and REML/BLUP methods were used [30]. They discovered that the graphical representation offered by the GGE biplot provided a more effective means of grouping environments based on root yield.

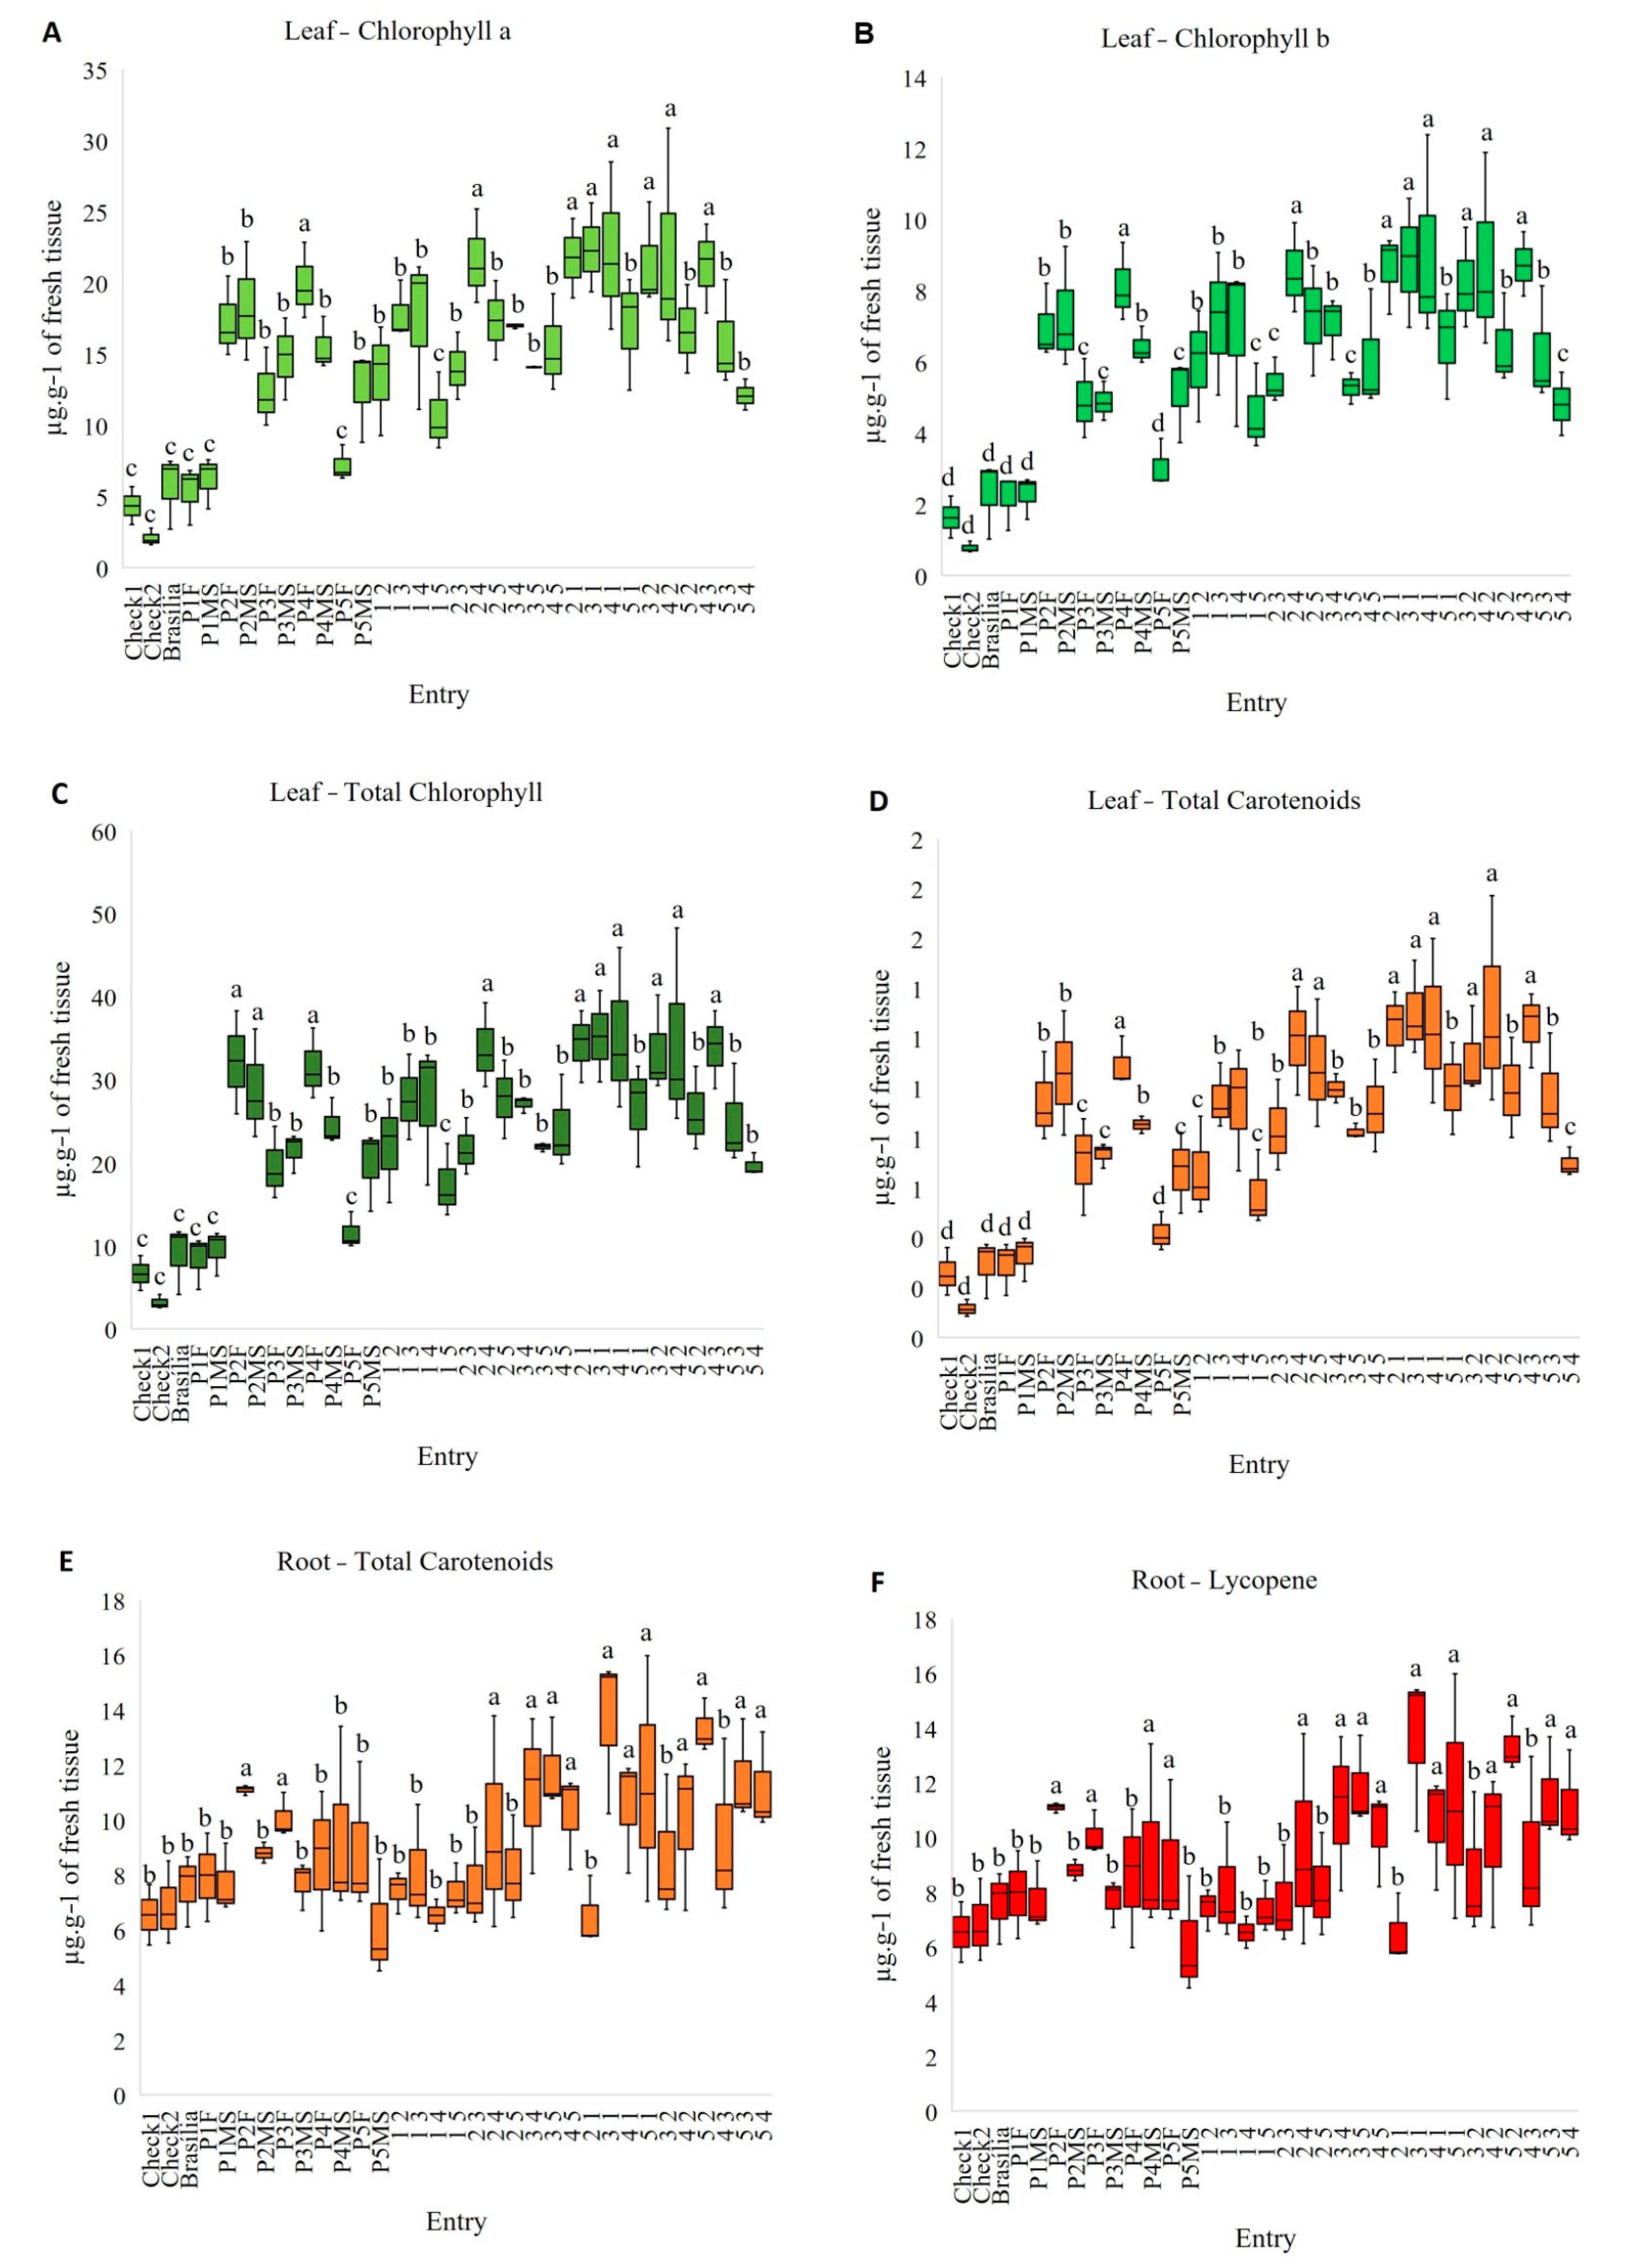
3.3. Biochemical Analysis

Nutritional and sensory qualities are paramount attributes of fruits and vegetables that are garnering increasing interest from consumers, producers, and improvement programs alike. Carrots, consumed globally, are esteemed as healthy vegetables owing to their substantial contents of carbohydrates, fiber, and a diverse array of specialized metabolites, notably their accumulation of carotenoids [3].
Assessing the magnitude of phenotypic variability across a broad spectrum of metabolites is pivotal for the advancement of carrot breeding efforts. Consequently, the contents of chlorophyll a, chlorophyll b, total chlorophyll, and total carotenoids in the leaves were quantified, alongside the contents of total carotenoids and lycopene in the roots (Figure 7).
Chlorophyll content plays a pivotal role in photosynthesis, which captures sunlight to produce glucose [31]. Therefore, they play an important role in the development of the carrot plant and root. Carotenoids in leaves are also important photosynthetic pigments that perform the function of protecting the photosynthetic system, preventing the photo-oxidation of chlorophylls by controlling the absorption of radiant energy. Carotenoids are antioxidant substances in plants and protect the plant from damage caused by stress [32]. Carotenoids in roots, on the other hand, provide numerous benefits to human health with through their consumption, acting as antioxidants, contributing to cancer prevention, and maintaining eyesight. Both α- and β-carotene serve as pro-vitamin A, producing one or two molecules of retinol (vitamin A) within the human body. Additionally, lycopene has been documented to possess antioxidant properties and aid in preventing cancer [2].
The levels of chlorophyll a in carrot leaves varied from 1.59 to 30.89 μg/g, delineating three distinct groups. Likewise, the levels of chlorophyll b ranged from 0.66 to 12.37 μg/g, forming four groups. For these two metabolites, the optimal outcomes were observed for entry 4 fertile and the following hybrids: 2 × 4, 2 × 1, 3 × 1, 4 × 1, 3 × 2, 4 × 2, and 4 × 3. The total chlorophyll concentrations spanned from 2.54 to 48.26 μg/g, resulting in three discernible groups. The same entries exhibiting the highest levels of chlorophyll a and b were notable, along with both entry 2 fertile and male sterile. In addition to genetic material, chlorophyll content can also be influenced by different doses of fertilizers [31].
The total carotenoid content in the leaf ranged from 0.08 to 1.77 μg/g, resulting in three distinct groups. Remarkably, the results for entry 4 fertile and the hybrids (2 × 4, 2 × 5, 2 × 1, 3 × 1, 4 × 1, 3 × 2, 4 × 2, 4 × 3) stood out, with most of these entries exhibiting prominence in chlorophyll a, b, and total contents as well. There are reports that the content of total carotenoids may present wide genetic variability in carrot germplasm [1,2].
The commercial checks, Brasília cultivar, and entry 1, in both their fertile and sterile male versions, exhibited the lowest averages for all extracted leaf pigments, including chlorophyll a, chlorophyll b, total chlorophyll, and total carotenoids.
The concentration of lycopene in the root ranged from 4.23 to 14.16 μg/g, resulting in two distinct groups. Optimal values were observed for entry 2 fertile, 3 fertile, 4 sterile male, 5 fertile, and hybrids 2 × 4, 3 × 4, 3 × 5, 4 × 5, 3 × 1, 4 × 1, 5 × 1, 4 × 2, 5 × 2, 5 × 3, and 5 × 4. Similarly, the levels of total beta-carotene ranged from 4.50 to 15.97 μg/g, also indicating the formation of two distinct groups. The superior group comprised entries 2 fertile and 3 fertile and hybrids 2 × 4, 3 × 4, 3 × 5, 4 × 5, 3 × 1, 4 × 1, 5 × 1, 4 × 2, 5 × 2, 5 × 3, and 5 × 4 (the same entries that excelled in terms of lycopene content, except for entry 4 sterile male and entry 5 fertile).
It is possible to verify that the best parents according to GCA—entries 5, 4, and 2—also provided hybrids with high pigment content. The hybrids 3 × 5 and 5 × 3 that stood out for SGA showed high levels of beta-carotene and lycopenes in the root.
Furthermore, a multi-site evaluation of phenotypic plasticity for specialized metabolites, some of which contribute to carrot quality and disease resistance, demonstrated that the accumulation of carotenoid types in carrots is moderately to highly influenced by the environment, contingent upon the variety [3].
In the present study, a definitive relationship between carotenoid content in leaves and roots was not observed, aligning with the findings of other authors [2]. However, additional analysis is warranted to ascertain the profiles and content of carotenoids in carrots comprehensively.

4. Conclusions

The results indicated significant general combining ability (GCA) effects for various agronomic traits in tropical carrots, suggesting additive genetic effects. This favors genetic improvement through selection. Based on GCA, cultivars 5, 4, and 2 were identified as the most promising parents for different traits.
The specific combining ability (SCA) analysis revealed that hybrids 1 × 2 and 3 × 5 excelled in bolting percentage and fresh leaf weight in environment 1, whereas hybrids 1 × 5 and 5 × 3 performed well in bolting percentage in environment 2. The hybrids 3 × 5 and 5 × 3 showed high levels of total carotenoids and lycopenes in the root.
The GGE biplot analysis showed that hybrids 1 × 2 and 3 × 2 displayed larger average root diameters, belonged to the group with the best bolting percentages, and exhibited stability across environments.
These data indicate that tropical carrot genotypes can be selected as parents to obtain hybrids for summer cultivation with good stability; low flowering percentage; greater leaf volume; greater root diameter; and high contents of chlorophyll, carotenoids, and lycopene. This enables the development of the tropical carrot market, improving the supply to the end consumer with a nutritional increase.

Author Contributions

Conceptualization, F.G.T.C. and G.M.M.; methodology, F.G.T.C. and C.S.d.O.; software, F.G.T.C., C.S.d.O. and A.P.O.N.; validation, F.G.T.C., N.N.L.D.P. and A.F.d.S.; formal analysis, G.M.M., A.C.S.S., J.M.Q.L. and A.P.O.N.; investigation, F.G.T.C. and G.M.M.; resources, G.M.M., A.C.S.S. and J.M.Q.L.; data curation, G.M.M. and A.C.S.S.; writing—original draft preparation, F.G.T.C.; writing—review and editing, G.M.M., A.C.S.S., N.N.L.D.P., A.F.d.S. and J.M.Q.L.; visualization, F.G.T.C., G.M.M. and A.C.S.S.; supervision, G.M.M.; project administration, G.M.M.; funding acquisition, G.M.M., A.C.S.S. and J.M.Q.L. All authors have read and agreed to the published version of the manuscript.

Funding

This research was funded by the Brazilian National Council for Scientific and Technological Development (CNPq), the Minas Gerais Research Foundation (FAPEMIG), the Coordination for the Improvement of Higher Education Personnel (CAPES), and the Federal University of Uberlândia (UFU).

Data Availability Statement

Data are contained within the article.

Conflicts of Interest

The authors declare no conflicts of interest.

References

  1. Selvakumar, R.; Kalia, P.; Raje, R.S. Genetic analysis of nutritional traits in tropical carrot (Daucus carota L.). Genetika 2019, 51, 641–660. [Google Scholar] [CrossRef]
  2. Yoo, K.S.; Bang, H.; Pike, L.; Patil, B.S.; Lee, E.J. Comparing carotene, anthocyanins, and terpenoid concentrations in selected carrot lines of different colors. Hortic. Environ. Biotechnol. 2020, 61, 385–393. [Google Scholar] [CrossRef]
  3. Chevalier, W.; Moussa, S.A.; Ottoni, M.M.N.; Dubois-Laurent, C.; Huet, S.; Aubert, C.; Desnoues, E.; Navez, B.; Cottet, V.; Chalot, G.; et al. Multisite evaluation of phenotypic plasticity for specialized metabolites, some involved in carrot quality and disease resistance. PLoS ONE 2021, 16, e0249613. [Google Scholar] [CrossRef] [PubMed]
  4. FAO. Food and Agriculture Organization of the United Nations Statistics Database. Available online: http://www.fao.org/faostat/en/#data (accessed on 2 May 2023).
  5. IBGE. Instituto Brasileiro de Geografia e Estatística. In Produção de Cenoura; 2017. Available online: https://www.ibge.gov.br/explica/producao-agropecuaria/cenoura/br (accessed on 14 February 2024).
  6. Turner, S.D.; Maurizio, P.L.; Valdar, W.; Yandell, B.S.; Simon, P.W. Dissecting the genetic architecture of shoot growth in carrot (Daucus carota L.) using a diallel mating design. G3 Genes Genomes Genet. 2018, 8, 411–426. [Google Scholar] [CrossRef] [PubMed]
  7. De Carvalho, A.D.F.D.; Silva, G.O.D.; Pereira, R.B. Capacidade de combinação de genitores de cenoura para caracteres de produtividade de raízes e tolerância à queima-das-folhas. Rev. Ceres 2016, 63, 183–190. [Google Scholar] [CrossRef]
  8. Cruz, C.D.; Regazzi, A.J.; Carneiro, P.C. Métodos Biométricos Aplicados ao Melhoramento Genético, 4th ed.; UFV: Viçosa, Brazil, 2012; p. 414. [Google Scholar]
  9. El-Azeem, A.; Aly, R.S.H.; El Sayed, W.M.; Hassan, N.A. Combining ability and gene action using 10 x 10 diallel crosses of ten maize inbred lines (Zea mays L.). J. Plant Prod. 2021, 12, 1205–1211. [Google Scholar] [CrossRef]
  10. Kumar, R.; Sharma, H.R.; Kumar, M. Heterosis for post harvest and nutritional quality traits in tomato (Solanum lycopersicum L.). J. Appl. Nat. Sci. 2016, 8, 1987–1991. [Google Scholar] [CrossRef]
  11. Datta, D.R.; Rafii, M.Y.; Misran, A.; Jusoh, M.; Yusuff, O.; Haque, M.A.; Jatto, M.I. Half diallel analysis for biochemical and morphological traits in cultivated eggplants (Solanum melongena L.). Agronomy 2021, 11, 1769. [Google Scholar] [CrossRef]
  12. Patil, D.G.; Subramaniam, V.R. Combining Ability Analysis for Yield and Processing Qualities in White Onion (Allium cepa L.). Curr. Agric. Res. 2020, 8, 18–24. [Google Scholar] [CrossRef]
  13. Pereira, R.B.; De Carvalho, A.D.F.; Pinheiro, J.B.; Da Silva, G.O.; Vieira, J.V. Resistência de populações de cenoura à queima-das-folhas com diferentes níveis de germoplasma tropical. Hortic. Bras. 2012, 30, 489–493. [Google Scholar] [CrossRef]
  14. Griffing, B.A. Concept of general and specific combining ability in relation to diallel crossing systems. Aust. J. Biol. Sci. 1956, 9, 463–493. [Google Scholar] [CrossRef]
  15. Cruz, C.D. Genes: A software package for analysis in experimental statistics and quantitative genetics. Acta Sci. Agron. 2013, 35, 271–276. [Google Scholar] [CrossRef]
  16. Yan, W. GGE biplot–A Windows application for graphical analysis of multi-environment trial data and other types of two-way data. Agron. J. 2001, 93, 1111–1118. [Google Scholar] [CrossRef]
  17. Yan, W.; Kang, M.S.; Ma, B.; Woods, S.; Cornelius, P.L. GGE biplot vs. AMMI analysis of genotype-by-environment data. Crop Sci. 2007, 47, 643–653. [Google Scholar] [CrossRef]
  18. R Development Core Team. R: A Language and Environment for Statistical Computing. Available online: http://www.R-project.org (accessed on 23 May 2023).
  19. Francis, F.J. Analysis of anthocyanins. In Anthocyanins as Food Colors, 1st ed.; Markakis, P., Ed.; Academic Press: New York, NY, USA, 1982; Volume 1, pp. 182–208. [Google Scholar]
  20. Cassetari, L.S.; Gomes, M.S.; Santos, D.C.; Santiago, W.D.; Andrade, J.; Guimarães, A.C.; Souza, J.A.; Cardoso, M.G.; Maluf, W.R.; Gomes, L.A. β-Carotene and chlorophyll levels in cultivars and breeding lines of lettuce. Acta Hortic. 2015, 1083, 469–473. [Google Scholar] [CrossRef]
  21. Rodriguez-Amaya, D.B.; Kimura, M. Harvestplus Handbook for Carotenoid Analysis; International Food Policy Research Institute (IFPRI): Washington, DC, USA; International Center for Tropical Agriculture (CIAT): Palmira, CO, USA, 2004; 58p. [Google Scholar]
  22. De Carvalho, A.D.F.; Da Silva, G.O.; Pereira, G.E. Direct selection for phenotypic traits in carrot genotypes. Hortic. Bras. 2019, 37, 354–358. [Google Scholar] [CrossRef]
  23. Cruz, C.D.; Vencovsky, R. Comparação de alguns métodos de análise dialélica. Rev. Bras. Genet. 1989, 12, 425–436. [Google Scholar]
  24. Carvalho, A.D.F.; Silva, G.O.; Pereira, R.B.; Pinheiro, J.B.; Vieira, J.V. Capacidade combinatória em cenoura para componentes de produção e tolerância à queima-das-folhas. Hortic. Bras. 2014, 32, 190–193. [Google Scholar] [CrossRef]
  25. Jagosz, B. Combining ability of carrot (Daucus carota L.) lines and heritability of yield and its quality components. Folia Hortic. 2013, 24, 115–122. [Google Scholar] [CrossRef]
  26. Kaur, K.; Dhillon, T.S.; Singh, R. GGE biplot analysis for seed production potential of European carrot (Daucus carota L.) genotypes in plains and submountenous zones of Punjab. Genetika 2022, 54, 233–254. [Google Scholar] [CrossRef]
  27. Frutos, E.; Galindo, M.P.; Leiva, V. An interactive biplot implementation in R for modeling genotype-by-environment interaction. Stochastic Environmental Research and Risk. Assessment 2014, 28, 1629–1641. [Google Scholar]
  28. Singamsetti, A.; Shahi, J.P.; Zaidi, P.H.; Seetharam, K.; Vinayan, M.T.; Kumar, M.; Singla, S.; Shikha, K.; Madankar, K. Genotype × environment interaction and selection of maize (Zea mays L.) hybrids across moisture regimes. Field Crops Res. 2021, 270, 108224. [Google Scholar] [CrossRef]
  29. Yan, W.; Tinker, N.A. Biplot analysis of multi-environment trial data: Principles and applications. Can. J. Plant Sci. 2006, 86, 623–645. [Google Scholar] [CrossRef]
  30. Silva, G.O.D.; Carvalho, A.D.F.D.; Vieira, J.V.; Benin, G. Verificação da adaptabilidade e estabilidade de populações de cenoura pelos métodos AMMI, GGE biplot e REML/BLUP. Bragantia 2011, 70, 494–501. [Google Scholar] [CrossRef]
  31. Yadav, A.; Jakhar, R.K.; Kumari, N.; Yadav, G.N.; Kant, R.; Sharma, S.L.; Kumar, A. Response of organic manures and fertilizers on yield and quality of carrot under sandy soil condition. Pharma Innov. J. 2022, 11, 1822–1827. [Google Scholar]
  32. Terletskaya, N.V.; Korbozova, N.K.; Kudrina, N.O.; Kobylina, T.N.; Kurmanbayeva, M.S.; Meduntseva, N.D.; Tolstikova, T.G. The influence of abiotic stress factors on the morphophysiological and phytochemical aspects of the acclimation of the plant Rhodiola semenowii Boriss. Plants 2021, 10, 1196. [Google Scholar] [CrossRef]
Figure 1. Crosses between 5 fertile carrot parents and their 5 respective male sterile isogenic lines, in a complete diallel model (5 × 4). P—parental; MS—male sterile; F—fertile.
Horticulturae 10 00442 g001
Figure 2. Climograph representing the experimental period in Carandaí, MG, Brazil (summers of 2020/2021 and 2021/2022).
Horticulturae 10 00442 g002
Figure 3. Flowchart of crossing stages, data collection in the field, biochemical analysis, and data analysis in tropical carrot entries in the city of Carandaí, MG.
Horticulturae 10 00442 g003
Figure 4. Discriminative vs. representative view of the GGE biplot for tropical carrot entries evaluated in Carandaí-Brazil (total 100%). CAR21—summer 2020/2021 and CAR22—summer 2021/2022. (A) Bolting percentage (%); (B) root diameter (cm).
Horticulturae 10 00442 g004
Figure 5. Mean vs. stability view of the GGE biplot for tropical carrot entries evaluated in Carandaí-Brazil (total 100%). CAR21—summer 2020/2021 and CAR22—summer 2021/2022. (A) Bolting percentage (%); (B) root diameter (cm).
Horticulturae 10 00442 g005
Figure 6. Polygon view of the GGE biplot for the which—won—where pattern for tropical carrot entries and environments in Carandaí, Brazil (total 100%). CAR21—summer 2020/2021 and CAR22—summer 2021/2022. (A) Bolting percentage (%); (B) root diameter (cm).
Horticulturae 10 00442 g006
Figure 7. Pigment contents in the leaf and root of tropical carrot entries evaluated in Carandaí, Brazil (µg·g−1 of fresh tissue). (A) Chlorophyll a content in the leaf. (B) Chlorophyll b content in the leaf. (C) Total chlorophyll content in the leaf. (D) Total carotenoid content in the leaf. (E) Total carotenoid content in the root. (F) Lycopene content in the root.
Horticulturae 10 00442 g007
Table 1. Joint variance analysis of tropical carrot entries in a complete 5 × 4 diallel, evaluated in Carandaí during the summers of 2020/2021 and 2021/2022.
SVDFMean Square
BPDISRLRDLWMYHTYH
Block/Environment445.371.118.840.155.12921.77824.70
Block260.161.5117.580.260.371423.261293.43
Block × Environment230.590.710.090.039.86420.28355.97
Genotypes2947.67 **1.45 **3.55 **0.16 **4.33 **242.98 **364.96 **
Environment1344.20 ns0.09 ns516.81 **0.23 ns6.08 ns8572.84 *3603.09 ns
Genotypes × Environment2926.11 **0.72 *2.49 ns0.06 *0.37 ns80.44 ns88.58 ns
Residual1163.190.421.590.040.3785.8069.92
Overall mean 3.063.3818.783.313.4430.9547.24
CV (%) 58.3019.226.725.8517.5829.9317.70
H2 (%) 93.3170.8755.1776.5291.5764.6980.84
CVg (%) 88.9012.243.044.3123.6516.5414.84
CVg/CVe 1.520.640.450.741.350.550.84
**, * significance at 1% and 5%, respectively, ns—not significant, using the F-test; SV—source of variation; DF—degrees of freedom; CV, CVg, and CVe—coefficients of general (%), genetic (%), and experimental (%) variation; H2—heritability; BP—bolting percentage (%); DIS—score for severity of leaf blight; RL—root length (cm); RD—root diameter (cm); LW—fresh leaf weight (kg); MYH—estimated yield of marketable roots (t ha−1); TYH—estimated total yield (t ha−1).
Table 2. Diallel variance analysis by environment, for tropical carrot entries in full 5 × 4 diallel evaluated in Carandaí in the summer of 2020/2021 and 2021/2022.
SVDFMean Square
BPDISRLRDLWMYHTYH
Environment 1
Genotype (G)195.40 **0.65 *2.78 ns0.08 *1.81 **158.17 ns89.44 ns
GCA411.15 **1.00 *4.10 ns0.13 *6.14 **43.92 ns55.02 ns
SCA55.49 *0.81 ns0.91 ns0.01 ns1.11 *265.84 ns184.16 ns
Reciprocal103.07 ns0.43 ns3.18 ns0.09 *0.42 ns150.03 ns55.86 ns
Residual381.760.332.640.030.43175.67 ns128.42 ns
Environment 2
Genotype (G)1936.15 **0.96 ns1.86 *0.04 ns1.76 **48.08 ns58.09 **
GCA4107.52 **1.52 ns3.82 **0.03 ns6.62 **60.57 ns100.23 **
SCA513.34 *0.39 ns1.75 ns0.03 ns0.57 ns16.09 ns13.79 ns
Reciprocal1019.02 **1.01 ns1.13 ns0.05 ns0.42 ns59.07 *63.38
Residual384.050.620.930.030.3927.3423.40
**, * significance at 1% and 5%, respectively, ns—not significant, using the F-test. BP—bolting percentage (%); DIS—score for severity of leaf blight; RL—root length (cm); RD—root diameter (cm); LW—fresh leaf weight (kg); MYH—estimated yield of marketable roots (t ha−1); TYH—estimated total yield (t ha−1).
Table 3. Estimates of GCA effects for tropical carrot entries in a complete 5 × 4 diallel, evaluated in Carandaí during the summers of 2020/2021 and 2021/2022.
EntryBPDISRLRDLWMYHTYH
Environment 1
10.110.170.290.030.172.052.02
20.45−0.33−0.760.12−0.84−0.78−0.22
30.380.280.340.020.140.340.99
40.46−0.060.31−0.06−0.22−2.13−0.13
5−1.38−0.06−0.18−0.100.750.53−2.66
Environment 2
12.230.23−0.460.020.13−1.03−1.17
2−1.18−0.43−0.230.06−0.892.753.36
3−1.490.29−0.23−0.03−0.010.080.74
42.98−0.100.690.00−0.04−2.17−3.02
5−2.540.010.24−0.050.810.380.09
BP—bolting percentage (%); DIS—score for severity of leaf blight; RL—root length (cm); RD—root diameter (cm); LW—fresh leaf weight (kg); MYH—estimated yield of marketable roots (t ha−1); TYH—estimated total yield (t ha−1).
Table 4. Estimates of SCA effects for tropical carrots entries in complete diallel 5 × 4 evaluated in Carandaí in the summer 2020/2021 and 2021/2022.
EntryBPDISRLRDLWMYHTYH
Environment 1
F1s
1 × 2−1.110.340.140.040.311.480.83
1 × 30.15−0.110.21−0.03−0.040.953.62
1 × 40.32−0.280.130.01−0.311.89−1.72
1 × 50.640.06−0.47−0.020.05−4.32−2.74
2 × 31.17−0.450.03−0.01−0.25−3.83−6.02
2 × 40.400.22−0.020.000.446.016.64
2 × 5−0.46−0.11−0.15−0.03−0.50−3.65−1.45
3 × 4−0.930.28−0.48−0.01−0.15−6.50−3.36
3 × 5−0.390.280.250.050.449.385.75
4 × 50.21−0.220.370.000.02−1.40−1.57
Reciprocal
2 × 1−0.330.01.270.200.4010.094.99
3 × 1−0.920.17−0.57−0.10−0.21−8.88−2.76
4 × 11.470.0−0.33−0.100.28−1.89−3.41
5 × 10.200.341.30−0.150.197.260.60
3 × 2−0.710.330.67−0.17−0.01−0.49−4.24
4 × 2−0.950.670.07−0.10−0.040.54−0.25
5 × 20.00.0−0.10−0.130.071.13−0.47
4 × 30.330.00.300.040.22−2.200.39
5 × 30.00.00.67−0.05−0.52−1.64−4.17
5 × 4−0.680.17−0.77−0.08−0.25−2.02−3.59
Environment 2
F1s
1 × 2−0.320.08−0.220.020.040.79−0.48
1 × 30.01−0.310.550.00−0.29−0.14−0.54
1 × 42.05−0.090.130.03−0.04−1.90−1.21
1 × 5−1.740.31−0.46−0.050.291.252.23
2 × 30.310.19−0.010.000.38−1.480.08
2 × 4−0.80−0.08−0.39−0.10−0.040.730.73
2 × 50.82−0.200.620.07−0.37−0.03−0.32
3 × 4−1.240.20−0.060.04−0.052.011.43
3 × 50.93−0.08−0.48−0.04−0.04−0.38−0.96
4 × 5−0.01−0.030.330.030.13−0.84−0.95
Reciprocal
2 × 1−2.86−0.17−0.17−0.07−0.111.13−0.28
3 × 1−1.95−0.17−0.34−0.05−0.04−0.77−0.45
4 × 12.510.670.500.020.24−2.10−2.30
5 × 1−0.240.500.200.080.17−1.75−1.30
3 × 2−1.20−0.670.530.000.656.506.74
4 × 2−3.030.000.940.130.021.691.63
5 × 20.460.33−0.170.150.152.261.87
4 × 31.57−0.330.47−0.15−0.37−3.49−4.47
5 × 3−0.240.17−0.13−0.09−0.02−4.64−3.17
5 × 4−0.33−0.50−0.20−0.09−0.16−2.30−4.11
BP—bolting percentage (%); DIS—score for severity of leaf blight; RL—root length (cm); RD—root diameter (cm); LW—fresh leaf weight (kg); TYH—estimated total yield (t ha−1); MYH—estimated yield of marketable roots (t ha−1).
Disclaimer/Publisher’s Note: The statements, opinions and data contained in all publications are solely those of the individual author(s) and contributor(s) and not of MDPI and/or the editor(s). MDPI and/or the editor(s) disclaim responsibility for any injury to people or property resulting from any ideas, methods, instructions or products referred to in the content.

