Article

Elevated Altitude and Limestone Soil Promoted Fungal Diversity in Rhizosphere Soil of Sophora japonica

1
Guangxi Key Laboratory of Plant Conservation and Restoration Ecology in Karst Terrain, Guangxi Institute of Botany, Guangxi Zhuang Autonomous Region and Chinese Academy of Sciences, Guilin 541006, China
2
College of Life Sciences, Guangxi Normal University, Guilin 541006, China
3
School of Pharmacy, Guilin Medical University, Guilin 541006, China
*
Author to whom correspondence should be addressed.
Submission received: 25 March 2024 / Revised: 18 April 2024 / Accepted: 23 April 2024 / Published: 26 April 2024
(This article belongs to the Special Issue Microbes and Plant Stress Tolerance)

Abstract

:
Soil microorganisms play a crucial role in mediating material transformation and nutrient cycling. However, little attention has been paid to the relationships between microbial communities and altitude and lithology in karst regions. Sophora japonica cv. Jinhuai is an officinal plant cultivated in karst areas, and there is a correlation between the dynamics of microbial community and ecological factors. This study examined the diversity of microbial communities in the rhizosphere of S. japonica under different lithologies and altitudes in karst regions of northern Guangxi, China using high-throughput sequencing technology. It was found that the bacterial community consisted of 37 phyla, including Proteobacteria. The fungal community mainly comprised 15 phyla, including Ascomycota. The fungal Shannon and Chao1 indices increased with altitude, while the bacterial Shannon index decreased. The fungal Shannon indices in limestone soil were higher than those in dolomite. The soil’s microbial Shannon and Chao1 indices were positively affected by pH, while the available phosphorus and potassium had the opposite effect. Research shows that altitude, lithology, pH, and available phosphorus were the crucial factors influencing the rhizosphere soil microbial community. This study provides references for understanding the relationship between plants and microorganisms and the microbial distribution strategy of rocky desertification habitats in the future.

1. Introduction

Soil microorganisms drive biogeochemical processes, such as decomposition of soil organic matter (SOM), ecological restoration of degraded soil, and regulation of nutrients in ecosystems [1]. The distribution modes, diversity patterns, and differences in the ecological niches of soil microorganisms are constrained by altitude, carbon, phosphorus, and other ecological factors. Research has found that, as altitude increases, microbial communities exhibit different trends, such as monotonic decline and linear increase in fungal diversity [2,3]. However, some results showed that the diversity and richness of bacteria decreased with the increase in altitude, while the contribution of soil factors to the distribution pattern of bacteria was different. And, the bacterial community did not necessarily follow the biogeographic distribution pattern of plants [1,4,5,6]. Therefore, the study of bacterial diversity in karst areas will help in understanding the microbial distribution strategy and ecological adaptability at low altitudes in rocky desertification areas.
In addition to altitude, lithology, and soil characteristics also directly or indirectly play a regulatory role in soil microorganism activity, community construction, and niche differentiation and have become the focus of community composition. The change of soil microorganisms is not only an index for detecting soil quality in karst areas but also is the basis for the evaluation of rocky desertification regions’ ecological recovery process [7]. Previous studies have indicated that pH may be associated with lithology [8]. The range of soil pH adapted to by bacteria is narrower than that of fungi, resulting in a stronger response of bacteria to pH compared to that of fungi [9]. Studies have shown that nitrogen (N) is closely related to plant photosynthesis, and plant photosynthetic products can lay a material foundation for the development of microbial communities [10,11]. Soil calcium (Ca) content is not only related to soil mother rock but also restricts the structure and homeostasis of the soil microenvironment, which in turn has different effects on soil fungal and bacterial community diversity [12,13]. Therefore, in karst limestone ecotopes, pH is related to SOM, Ca, magnesium (Mg), and other elements. Carbon (C), N, Ca, and other elements are key factors driving dynamic changes in microbial communities [7]. Lithology not only affects the circulation and transfer of soil elements under different site conditions but also restricts the acquisition of soil microbial resources, community construction, and other biological processes, and further shapes the structure and distribution pattern of the soil microorganisms. Therefore, exploring the composition and variation pattern of microbial communities under different soil mother rock will help in understanding the complex relationship between plants and microbial partners and the microbial distribution strategy of rocky desertification habitats.
Sophora japonica cv. Jinhuai is an officinal plant cultivated in the karst regions of Guangxi, China, with anti-inflammatory, antioxidant, and other properties [14]. Wild S. japonica resources are scarce in Guangxi, whereas the quality and plant growth status of cultivated S. japonica is quite different, which may be related to the dynamics of rhizosphere microbial community soils with different lithologies in karst areas, such as sandstone, dolomite, and limestone. This may affect the microorganism composition and diversity of the rhizosphere soil of S. japonica. Therefore, evaluating the response of bacterial and fungal diversity characteristics of rhizosphere soil of S. japonica under different altitudes and lithology treatments in karst areas of Guangxi to the driving factors of community changes, such as altitude, lithology, and soil nutrient conditions, will provide basic data for the future investigation of microbial distribution strategies and ecological functions of medicinal plants under different site backgrounds in karst areas.

2. Materials and Methods

2.1. Experimental Design

The study sites were located in Quanzhou, Jiantang, Baibao, Dongshan, Yanshan, Guilin City, and Guangxi Province, China. Quanzhou County (25°29′–26°23′ N, 110°37′–111°29′ E) has an annual temperature of 17.9 °C, annual rainfall of 1563.1 mm, and frost-free period of 294.6 days on average, indicating a subtropical monsoon climate [15].
Based on the geological backgrounds of the different lithologies and altitudes in the plot, three lithologies (sandstone, dolomite, and limestone) and seven altitudinal gradients were set up in the experiment. Two sandstone sampling sites were set up at altitudes of 100–200 and 600–700 m in Yanshan and Dongshan, represented by SY1 and SY2, respectively. Three dolomite sampling points were set up at altitudes of 100–200, 200–300, and 200–300 m in Jiantang and Quanzhou, represented by BY1, BY2, and BY3, respectively. Five limestone sampling sites were set up in Baibao and Dongshan at altitudes of 300–400, 400–500, 500–600, 600–700, and 700–800 m, represented by SH1, SH2, SH3, SH4, and SH5, respectively.
Remove the stones and other residues on the surface of the soil in the process of sampling, and 1 kg of the soil core was collected using a sterile shovel according to the five-point sampling method [16]. Three replicates were set up in each plot (250 m2), and three S. japonica were randomly selected for the collection of rhizosphere soil to form a biological composite sample. Samples were temporarily stored in ice boxes and transported to the laboratory. One set of soil samples was stored in a −20 °C refrigerator for DNA extraction and sequencing. One group was stored at 4 °C to be tested for soil physicochemical properties.

2.2. Experimental Equipment

The instruments and chemical reagents used in the test are shown in Table 1 and Table 2.

2.3. Determination of Physicochemical Properties of S. japonica Rhizosphere Soil

The soil samples were screened with a 100-mesh soil sieve. Dry soil was added to ddH2O [soil: water 1:2.5 (w/v)] and shaken for 15 min. The pH of the suspension was determined with a corrected pH meter (FE28; Mettler Toledo, Shanghai, China). The soil (100 mesh) was placed into a test tube, and 0.8 mol L−1 K2Cr2O7 and H2SO4 were added [17]. The soil was boiled at 180 °C for 5 min in a preheated oil bath (HH-S, Jiangsu Kexi Instrument, Changzhou, China), and titrated with 0.2 mol L−1 FeSO4 [17]. The SOM content was calculated based on the volume of FeSO4 used for titration [17]. The soil’s available nitrogen (AN) was measured by a Kjeldahl nitrogen analyzer (K1160, Shandong Hanon Scientific Instruments, Dezhou, China) after adding MgCl2 to the dried soil samples using a 10-mesh sieve [18]. The air-dried soil samples were added to a HCl/H2SO4 extractant [19]. After shaking and centrifugation, the supernatant was added to the indicator and display agent [19]. An ultraviolet–visible spectrophotometer (UV-1800PC; Shanghai Mapada Instruments, Shanghai, China) was used to measure the absorbance [19]. The soil’s available phosphorus (AP) content was calculated based on the constant volume during color development, and the phosphorus concentration was obtained from the standard curve [19]. Based on the exchange of NH4OAc and soil colloidal cations, the determination of the soil’s available potassium (AK) content was performed using a 1mol L−1 NH4OAc solution as the extractant. The soil was shaken after mixing with the solution, filtered with qualitative filter paper, and measured with a flame photometer (FP640, Shanghai Jingke Electronics, Shanghai, China) [20]. The AK content was calculated by a standard curve [20]. Air-dried soil was added to a 1 mol L−1 CH3COONH4 solution [21]. After shaking and centrifugation, the filtrate was collected, and the contents of available calcium (ACa) and available magnesium (AMg) in the soil were determined using ICAP (7200, Thermo Fisher Scientific, Waltham, MA, USA) [21].

2.4. Determination of Microbial Diversity of S. japonica Rhizosphere Soil

The experimental process mainly included DNA extraction, polymerase chain reaction (PCR) amplification, and product electrophoresis detection, pooling and gel purification, library construction, and sequencing. Soil microbial genomic DNA was extracted from the S. japonica rhizosphere soil using an ALFA soil DNA extraction kit (DZ302-02, Findrop, Guangzhou, China). And, NanoDrop One UV-visible spectrophotometer (Thermo Fisher Scientific, Waltham, MA, USA) was developed for the determination of DNA purity and concentration. Genomic DNA was used as a template, and specific primers with a barcode were selected for PCR amplification, according to the sequencing region. Primers 338F (5′-ACTCCTACGGGAGGCAGCA-3′) and 806R (5′-GGACTACHVGGGTWTCTAAT-3′) were used to amplify the 16S rRNA gene V3V4-1 region of bacteria [5]. The bacterial PCR amplification system consisted of 25 μL of TAKARA taq enzyme, 2.5 μL (10 μM) of each primer-F and primer-R, 50 ng of DNA, and ddH2O added to 50 μL. Amplification procedures were 94 °C for 5 min, 94 °C for 30 s, 53 °C for 30 s for 32 cycles, 72 °C for 30 s, and 72 °C for 8 min [22].
Using ITS3-F (5′-GCATCGATGAAGAACGCA-3′) and ITS4-R (5′-TCTCCGCTTATTGGATGC-3′) primers to amplify the fungi ITS2-1 gene [6], the fungal PCR amplification system consisted of Novoprotein taq enzyme 25 μL, Primer-F 2 μL (10 μM), Primer-R 2 μL (10 μM), DNA 50 ng, and ddH2O added 50 μL. The amplification procedures were 3 min at 95 °C,95 °C for 20 s, 53 °C for 20 s for 32 cycles, 72 °C for 30 s, and 5 min at 72 °C [22]. To detect the length of the amplified product and the purity, 1% agarose gel electrophoresis was used (the electrophoresis conditions were 100 V, 30 min). The samples with the main band length in the normal range can be used for further experiments. The sample volume of the PCR product was 3 μL, the product quality concentration was ≥15 ng/3 μL, and the band was clear as a qualified sample, which could be used for subsequent experiments. Dispersion of bands, contamination of miscellaneous bands, fragment size not in the range, or low concentration were unqualified samples. Using GeneTools (version 4.03.05.0, SynGene, Cambridge, The United Kingdom) to compare the PCR product concentration, calculate the samples’ volume and mix the products. TE buffer was used to recover the target DNA fragment. Using the Illumina Nova 6000 to amplify library sequencing. Guangdong Magigene Biotechnology (Guangzhou, China) was responsible for sample sequencing.

3. Data Analysis

3.1. Bioinformatics Analysis

The slide window quality clipping for the raw read was aided by Fastp (v 0.14.1, https://github.com/OpenGene/fastp, accessed on 25 June 2023). Cutadapt (v 1.14, https://github.com/marcelm/cutadapt/, accessed on 25 June 2023) was primarily used to remove primers to obtain paired-end reads. Usearch-fastq_ mergepairs (v 10.0.240, http://www.drive5.com/usearch/, accessed on 25 June 2023) was used to filter unqualified tags and obtain raw tags, using Fastp again for effective splicing fragments (clean tags). The sequences were classified by 97% similarity, and OTU clustering was performed using UPARSE. The sequences of bacteria and fungi were analyzed using SILVA (https://www.arb-silva.de/, accessed on 25 June 2023) and UNITE (https://unite.ut.ee/, accessed on 25 June 2023), respectively [23].

3.2. Statistical Analyses

Usearch-alpha_div (v 10.0.240, http://www.drive5.com/usearch/, accessed on 25 June 2023) was used to calculate the Chao1 index and the Shannon–Wiener index of soil microorganisms to reflect the alpha diversity [24]. The microorganisms’ operational taxonomic units (OTUs) numbers at different classification levels were analyzed by Excel. S. japonica’s rhizosphere soil physicochemical properties and microorganisms’ alpha index were analyzed by SPSS (v 26.0). The two groups were tested by two independent-sample t-tests. The three groups were tested by one-way ANOVA and LSD, and the Duncan multiple test (p < 0.05). R (v 4.2.3) was used to plot the species relative abundance.
According to the OTU level and the Bray–Curtis distance algorithm, R was used to perform a non-metric multidimensional scaling (NMDS) analysis [25]. Differences between groups were measured by analyses of molecular variance (AMOVA) and analysis of similarities (ANOISM). A canonical correlation analysis (CCA) was used to examine the relationship between environmental factors and microbial community species distribution. At the OTU level, variance partitioning canonical correspondence analysis (VPA) was used to determine the effects of environmental factors on the distribution of microorganisms. The Mantel test was used to analyze the Pearson relationship between environmental factors and dominant microorganisms.

4. Results

4.1. Physicochemical Properties of S. japonica Rhizosphere Soil

The physicochemical properties of S. japonica soil samples with different soil mother rock and altitude treatments are shown in Table 3. The soil was acidic, with an average pH of 5.61, ranging from 4.25 to 6.80. The average pH of the soil developed from dolomite (4.93) was lower than that of limestone (5.88) and sandstone (5.94). The average contents of AN, AMg, ACa, AK, and SOM in the soil developed from limestone are higher than those in dolomite and sandstone. The average content of pH, AN, ACa, and SOM increased with the increase in altitude. SOM, AN, ACa, AK, and pH were positively correlated with AMg content.

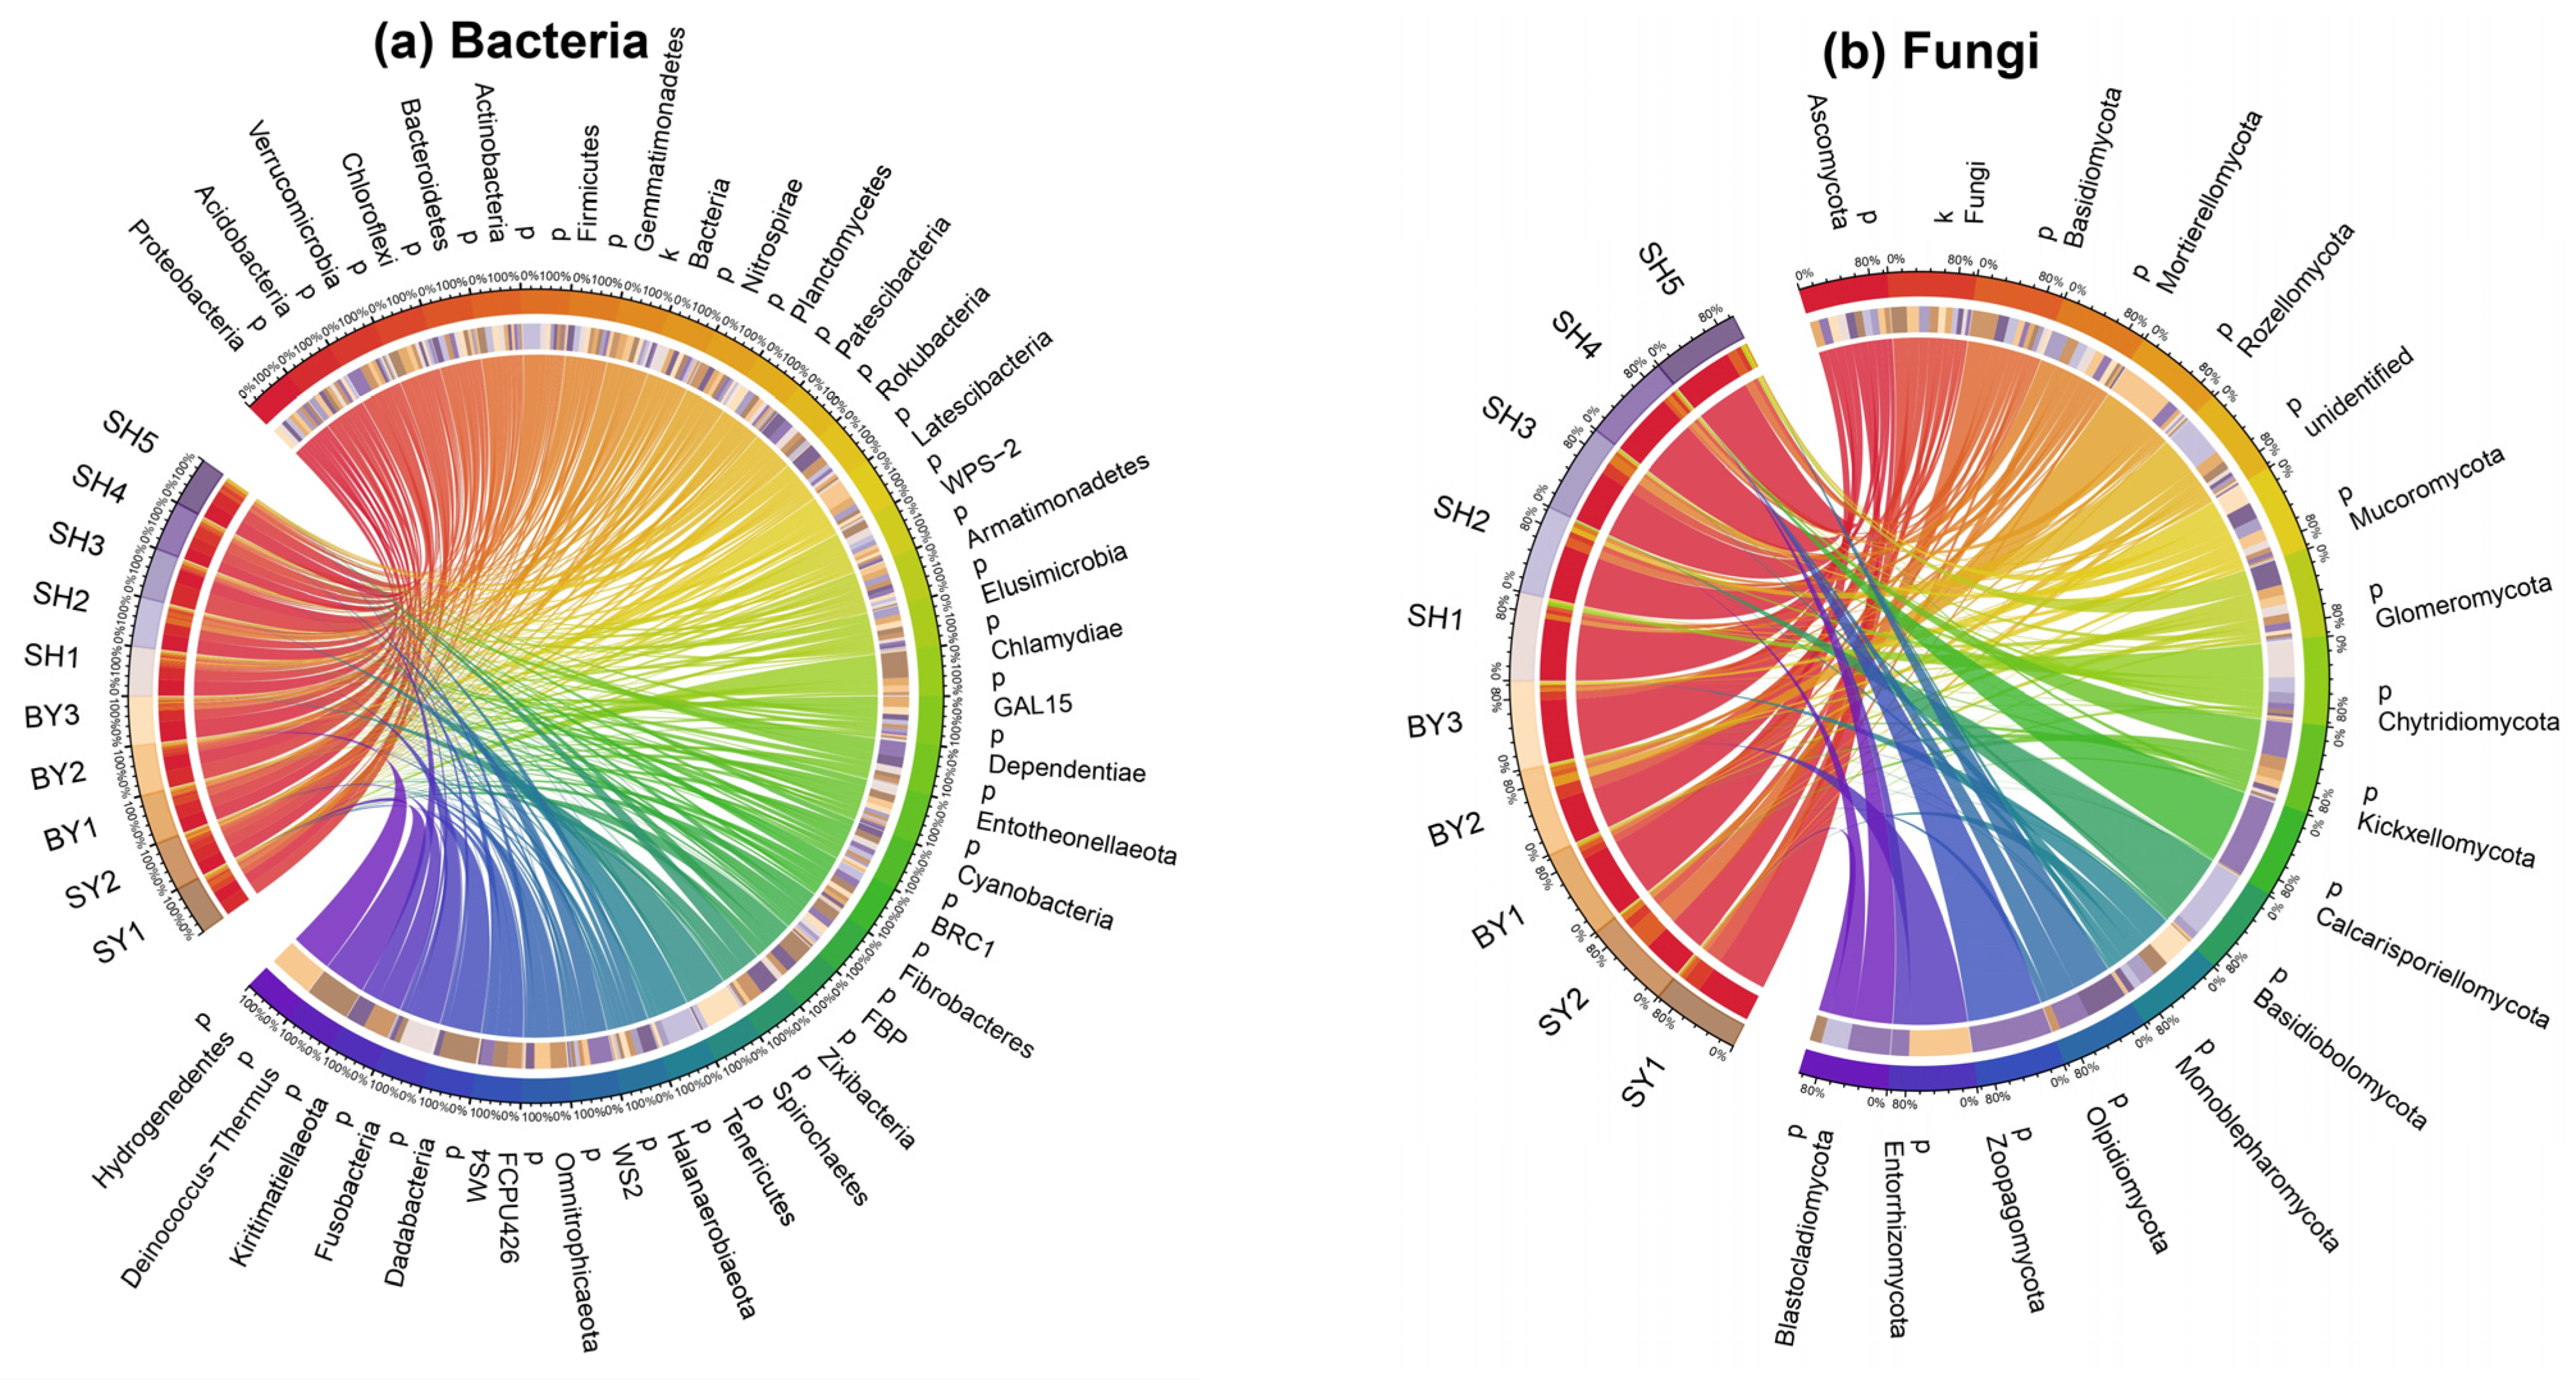
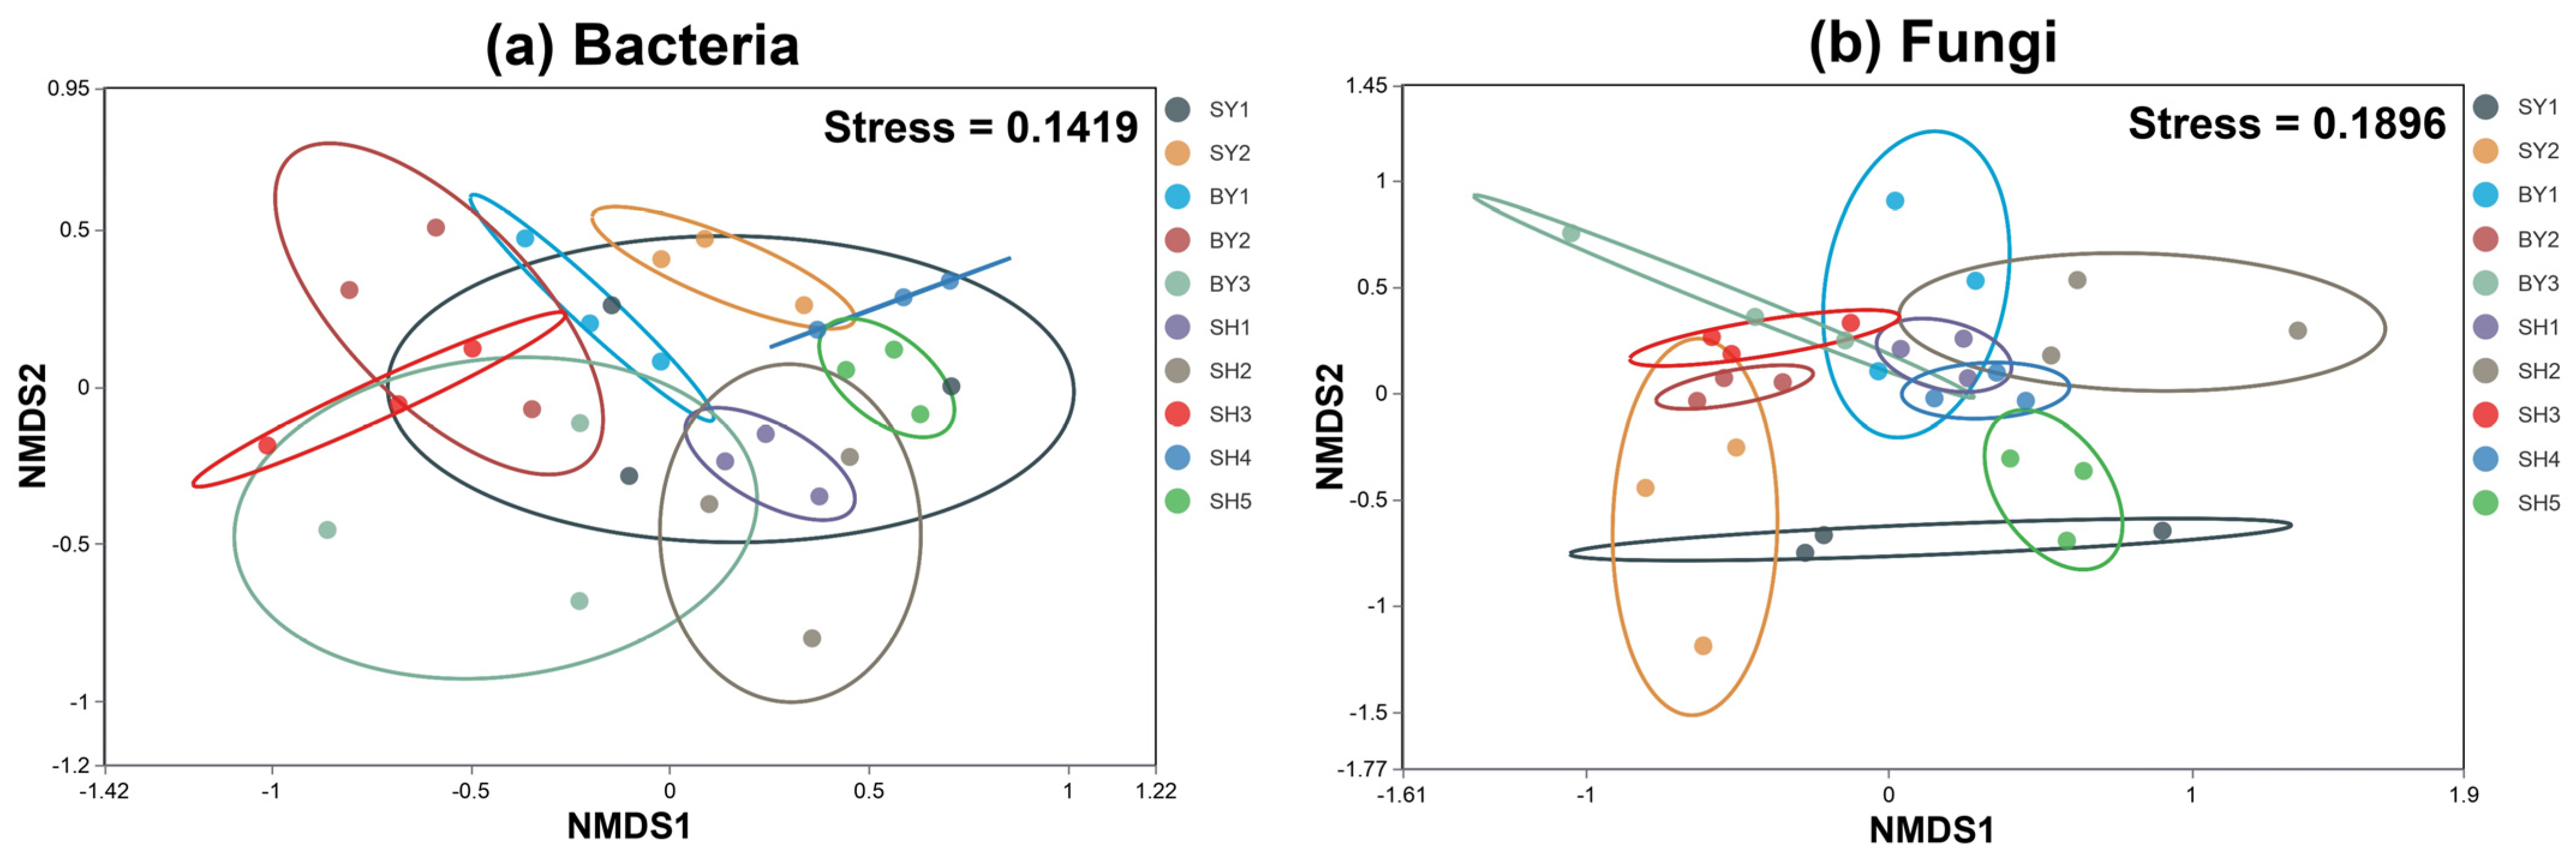
4.2. Rhizosphere Microbial Community Composition of S. japonica

The number of microorganisms identified under different lithologies and altitudes is shown in Table 4. After removing low-quality reads and comparing them with the database, a total of 3,705,426 raw total reads were obtained from the rhizosphere soil bacterial community of S. japonica. After filtering and optimizing low-quality reads, 3,665,355 clean total reads were obtained, and 3,087,417 clean total tags were obtained by splicing quality control. The reads were compared with the database to remove non-bacterial species, and 19,634 OTUs and 2,231,333 sequences were obtained. A total of 16,569 OTUs were identified at the phylum level, and a total of 37 phyla, 98 classes, 201 orders, 274 families, 531 genera, and 441 species were identified.
A total of 2,627,644 raw total reads were obtained from the rhizosphere soil fungal community of S. japonica. After filtering and optimizing low-quality reads, 2,611,680 clean total reads were obtained, and 2,218,325 clean total tags were obtained by splicing quality control. The reads were compared with the database to remove non-fungal species, and 4252 OTUs and 1,695,458 sequences were obtained. A total of 3438 OTUs of fungi were identified to the phylum level, including 15 phyla, 46 classes, 112 orders, 239 families, 359 genera, and 259 species were identified. The total OTUs of bacteria and fungi in the rhizosphere soil of S. japonica developed from limestone were higher than those developed from sandstone and dolomite.
The rhizosphere microbial community of S. japonica is shown in Figure 1. The bacterial community comprises 37 phyla, including Proteobacteria (5159 OTUs, 26.2%), Acidobacteria (2711 OTUs, 13.8%), Chloroflexi (1669 OTUs, 8.5%), Bacteroidetes (1188 OTUs, 6.0%), Firmicutes (970 OTUs, 4.9%), and Actinobacteria (957 OTUs, 4.8%). Proteobacteria was the dominant bacterial phylum of S. japonica rhizosphere. The fungal community consisted of 15 phyla, including Ascomycota (2087 OTUs, 49%), Basidiomycota (607 OTUs, 14.2%), Glomeromycota (365 OTUs, 8.5%), Chytridiomycota (107 OTUs, 2.5%), Rozellomycota (91 OTUs, 2.1%), and Mucoromycota (75 OTUs, 1.7%). The S. japonica rhizosphere’s dominant fungal phyla were Ascomycota and Basidiomycota.

4.3. Microorganism α Diversity of Rocky Desertification Degree and Altitude Gradient Pattern

The abundance and diversity of rhizosphere soil microorganisms varied with lithology and elevation (Table 5 and Table 6). The bacterial mean Shannon index and Chao1 index were 2.68 and 3790, respectively. The fungal mean values of the Shannon index and the Chao1 index were 1.63 and 769, respectively. Elevation increased the fungal Shannon and Chao1 indices. The increase in altitude increased the Chao1 index of the bacterial community and decreased the Shannon index. The Shannon index of the fungal community in the rhizosphere of the soil developed from limestone was higher than that of the soil developed from sandstone and dolomite, while the bacteria were the opposite.
The significance of the analysis of the community differences between the groups showed that the p-values of the AMOVA results of microorganisms were all 0.00, and the p-values of the ANOSIM results were all 0.001, indicating that there were differences in the S. japonica rhizosphere microorganism at the OTU classification level. The fungal community was relatively aggregated compared to the bacterial community. The community structure differed significantly between groups, and it was greater than the difference within groups (Figure 2). A Venn analysis showed that the number of OTUs shared by bacteria in the rhizosphere of S. japonica was 1318, whereas the number of OTUs shared by fungi was 275. The number of bacterial community-specific OTUs in each group was 751–1009, whereas that of fungal-specific OTUs was 95–252 (Figure 3).

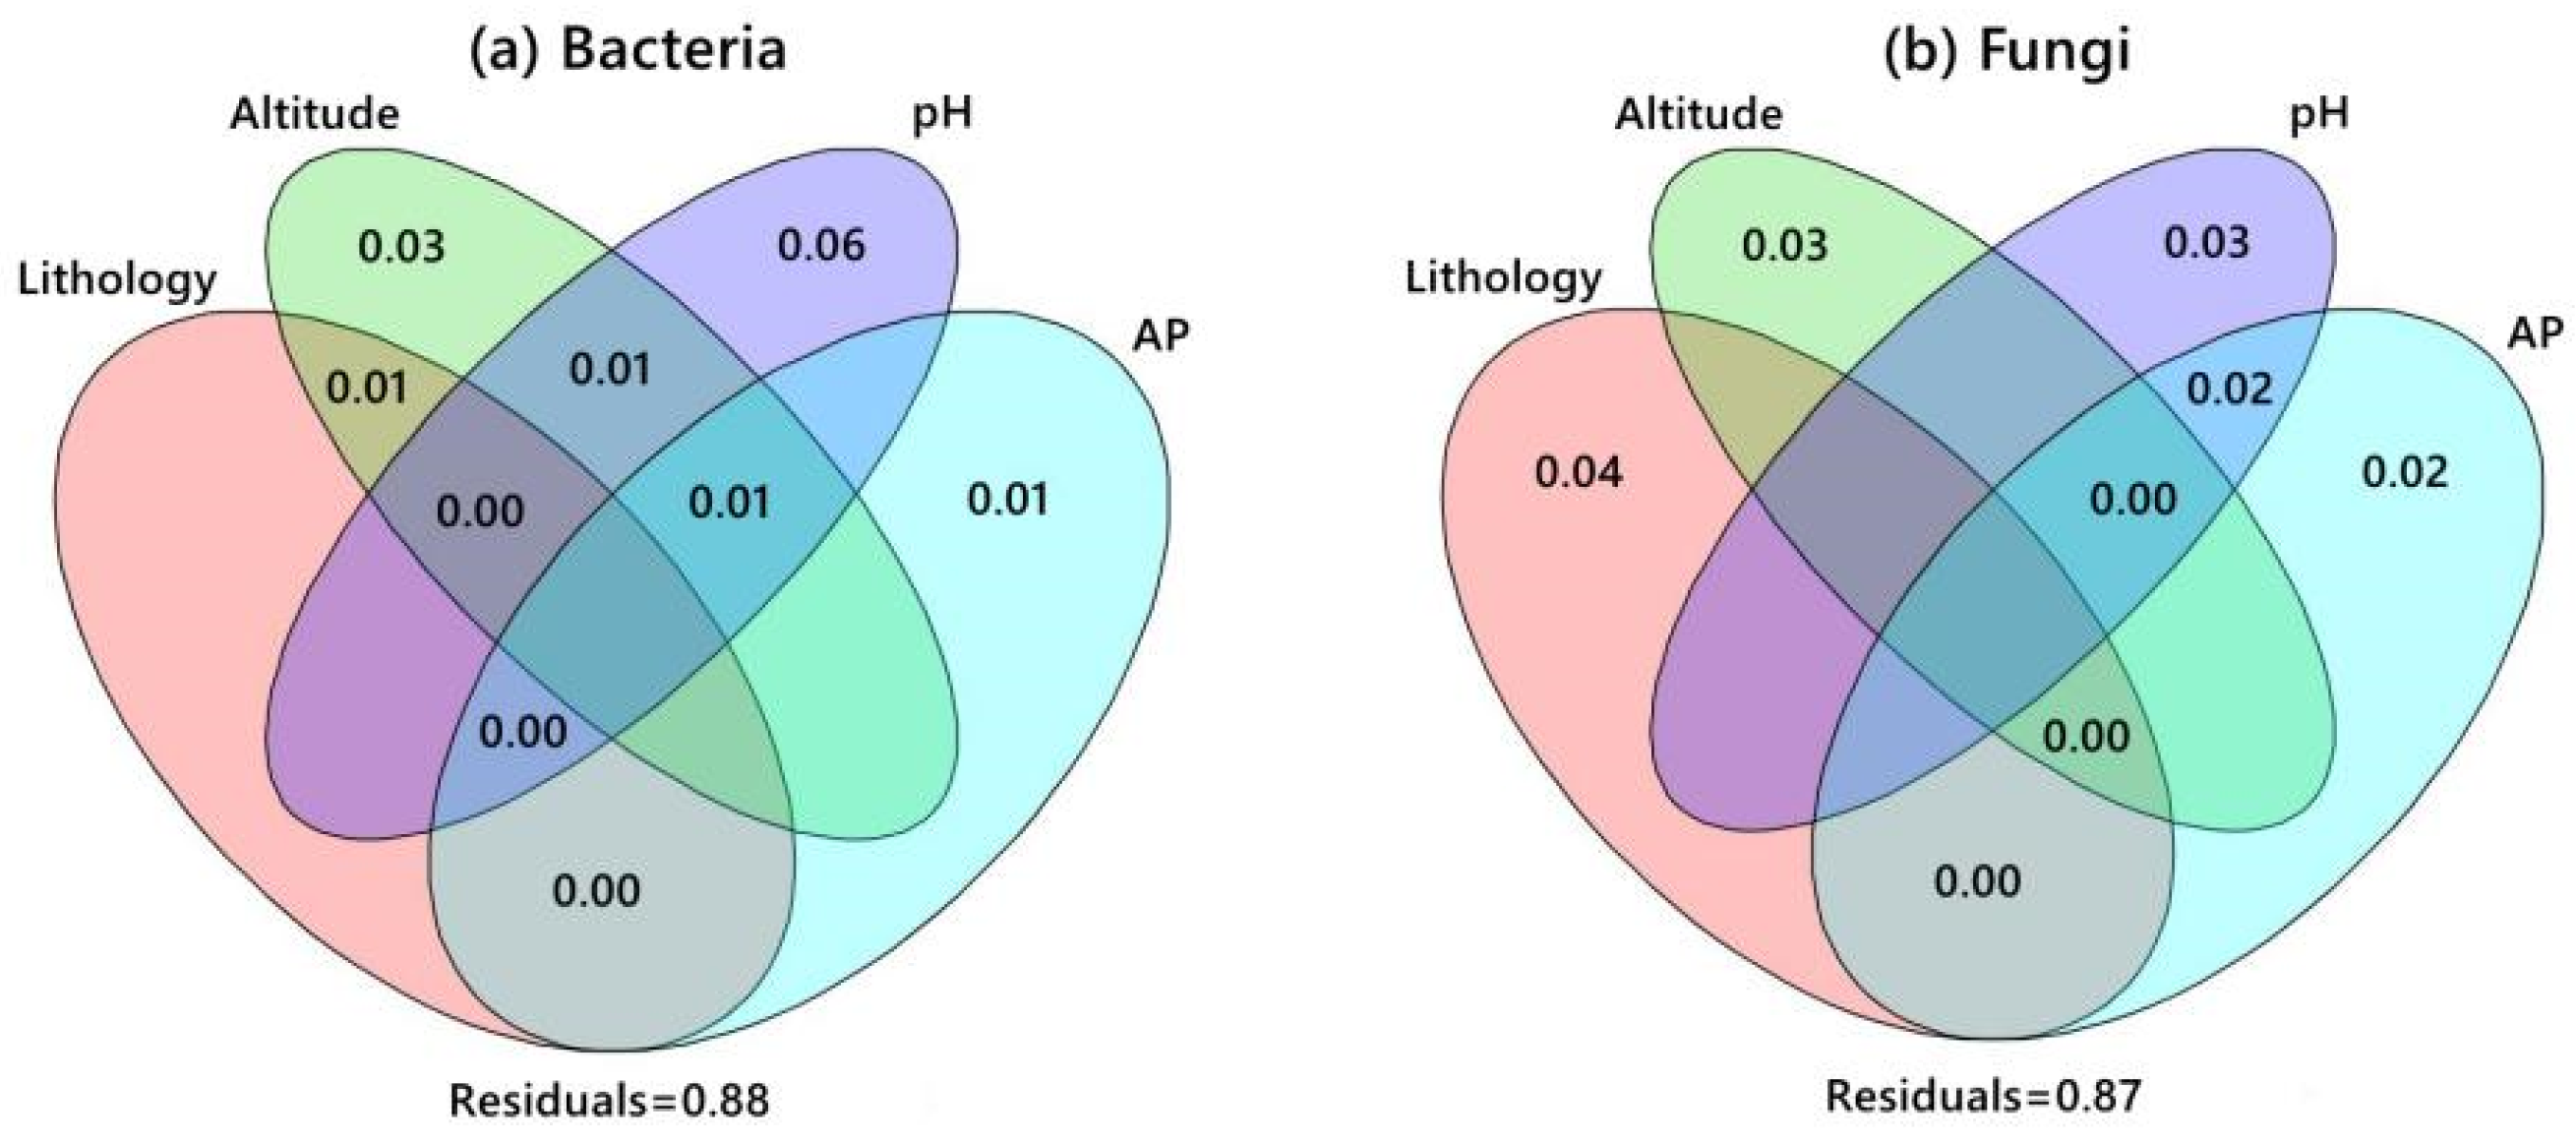
4.4. Relationship between External Factors and Microorganisms

Figure 4 shows the CCA between the environmental factors and S. japonica rhizosphere microorganisms. The CCA results for bacteria showed that CCA1 and CCA2 explained 22.2 and 16.8% of the total variable, respectively. The effects of pH and AP on bacterial communities were greater. The CCA results for fungi showed that CCA1 and CCA2 explained 17.7 and 15.4% of the total variables, respectively. Lithology, altitude, and pH were the key factors affecting the distribution of fungal communities. The VPA results (Figure 5) showed that pH and altitude explained 6% and 3% of the bacterial distribution, respectively, and they were important factors driving dynamic changes in bacterial communities. Lithology, altitude, and pH explained 4%, 3%, and 3%, respectively, and became the dominant factors affecting fungal community changes.

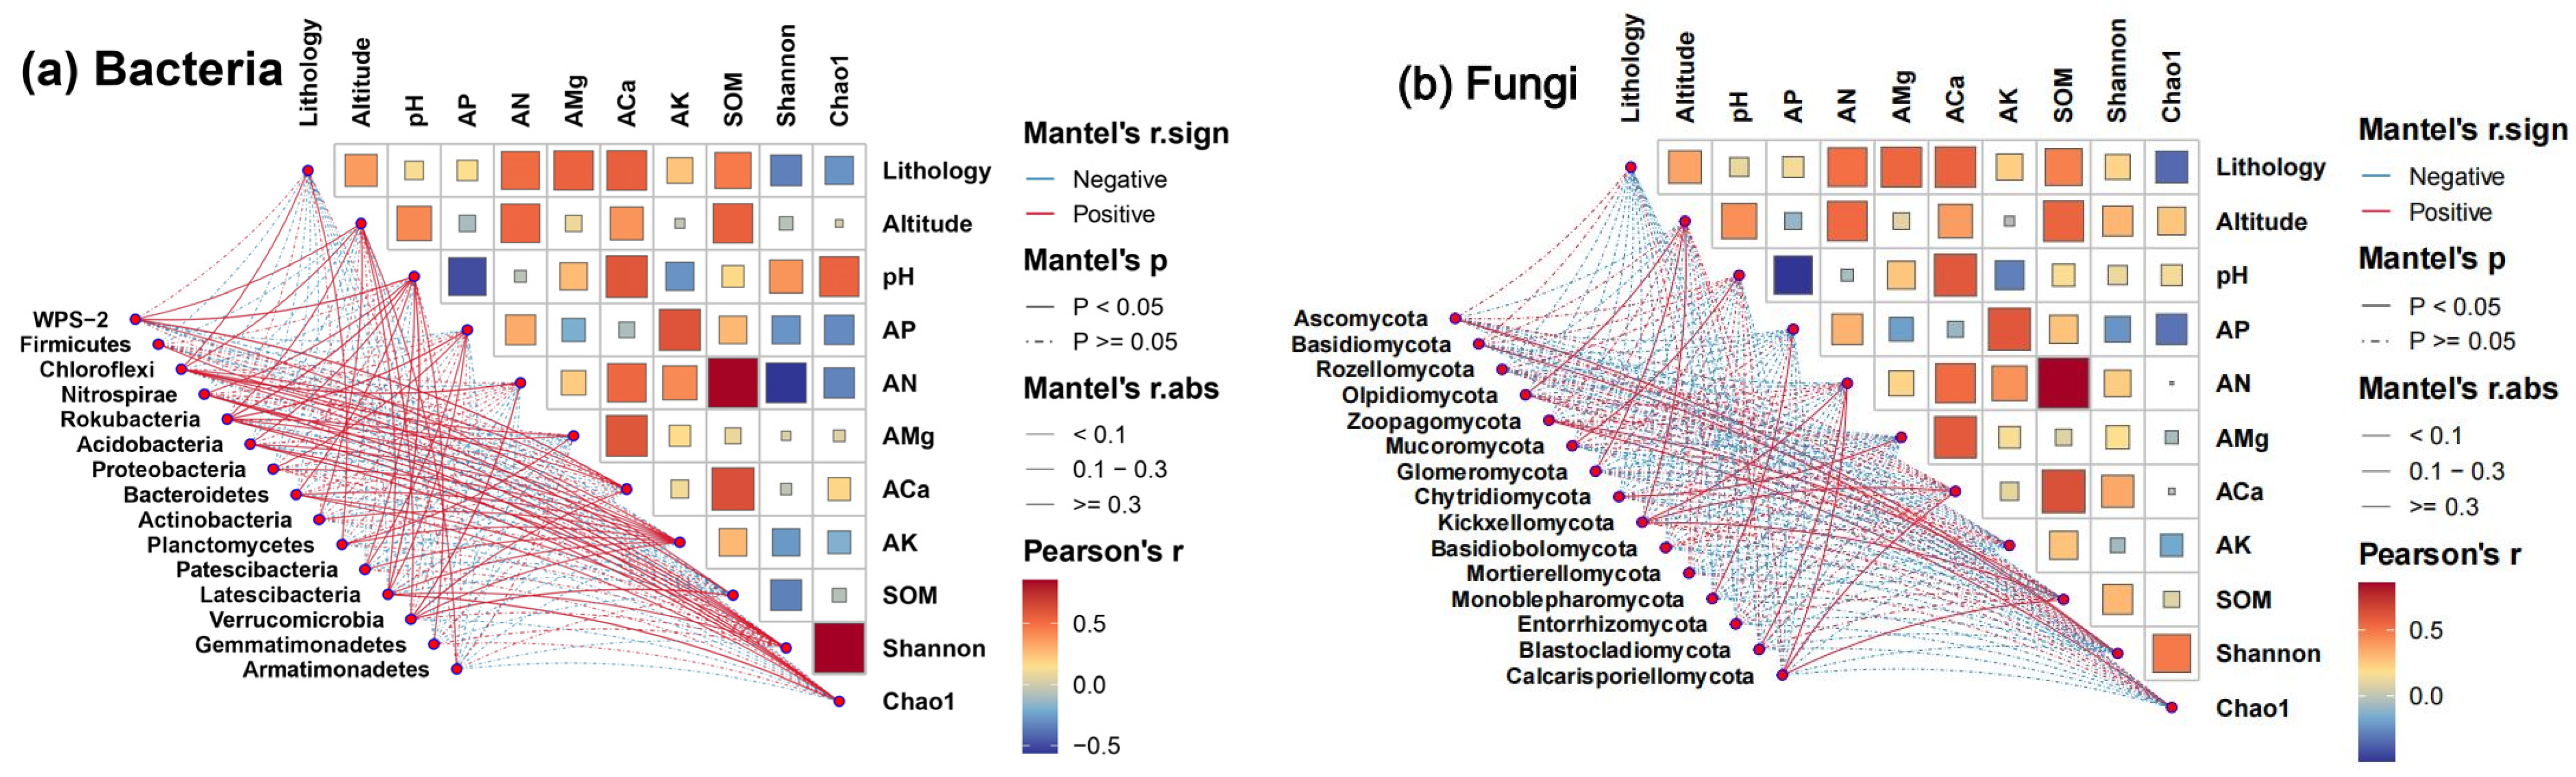
4.5. Correlation between Dominant Microorganisms and Ecological Factors

Altitude, lithology, and soil factors were related to S. japonica rhizosphere microorganisms, with different effects. The Pearson correlation between the rhizosphere microbial community and the ecological factors is shown in Figure 6.
The α diversity of rhizosphere fungi (Shannon and Chao1) was positively correlated with altitude. Elevation increased the abundance of dominant fungal phyla, such as Zoopagomycota, Glomeromycota, and Basidiomycota. Elevation decreased the bacterial Shannon index but increased the Chao1 index. An increase in altitude helps increase Chloroflexi abundance but reduces the abundance of Proteobacteria and Acidobacteria. The abundance of Basidiomycota and Mortierellomycota in soils developed from limestone was higher than that in soils developed from dolomite.
S. Japonica rhizosphere soil pH was positively correlated with microbial α diversity (Shannon and Chao1). pH was positively correlated with the abundance of Basidiomycota, Glomeromycota, and Acidobacteria. The contents of AP and AK were negatively correlated with the Shannon and Chao1 indices of rhizosphere soil microorganisms (bacteria and fungi), and negatively correlated with the abundance of Gemmatimonadetes and Ascomycota. The content of AP was negatively correlated with the abundance of Basidiomycota. ACa, SOM, and AN showed a significant positive correlation (p < 0.01), which jointly increased the fungal Shannon index and reduced the bacterial Shannon index. Together, AN and SOM increased the abundance of Rozellomycota, Olpidiomycota, and Proteobacteria, but had a negative impact on Firmicutes. The content of AMg was positively correlated with the Shannon and Chao1 indices of the bacterial community and the Shannon index of the fungal community and negatively correlated with the abundance of Proteobacteria and Mortierellomycota.

5. Discussion

5.1. Rhizosphere Microorganisms Composition of S. japonica

In the collected rhizosphere soil samples of S. japonica, the bacterial community mainly included Proteobacteria and Acidobacteria, which was similar to those found in the Changbai Mountain tundra and Arctic tundra grassland and shrub soil [26,27]. Proteobacteria have a high reproductive rate, can adapt to nutrient-rich areas, and play an important role in plant nitrogen uptake [28]. Acidobacteria can not only improve plant root status, promote plant nutrient uptake, and enhance plant resistance to drought, salinity, and other stresses but also survive in acidified soils [29,30]. Fungal communities mainly included Ascomycota, Basidiomycota, and other fungal phyla. The Guadiamar Green Corridor [1] and Gloria Mountain summits [9] showed similar dominant fungal patterns. Ascomycota were often found in semi-arid areas [31] and forest soils [1] because of their ability to degrade cellulose, while Basidiomycota can secrete substances that degrade complex polymers and are dominant in complex sites with plant succession and low soil nutrient quality [1,32]. The distribution pattern of soil microorganisms in the rhizosphere of S. japonica indicated that the microorganisms composition, although disturbed by external ecological factors, was not completely unique; however, there were certain similarities [26].

5.2. Pattern of Microbial Diversity with Altitude

This study found that the S. japonica rhizosphere fungal Shannon and Chao1 indices were positively correlated with altitude, whereas the bacterial community increased in the Chao1 index but decreased in the Shannon index with an increase in altitude. There were three possible reasons for this finding. First, researchers generally agree that altitude increases with the lower temperature, slowing the SOM decomposition speed, and promoting the litter accumulation of SOM [33,34]. In this study, altitude, SOM, and fungal α diversity were positively correlated. The abundance of dominant fungi like Glomeromycota, Basidiomycota, and Zoopagomycota increased with increasing altitude, which may have contributed to the changing pattern of the fungal altitude gradient. Second, an increase in temperature is conducive to the survival of Proteobacteria, Acidobacteria, and other bacteria that can adapt to extreme environments and promote the mineralization of organic matter [33,35]. This indirectly confirmed that the decrease in temperature caused by the increase in altitude in this study inhibited the dominant bacterial phylum, which may lead to a decrease in bacterial community diversity. Lastly, the different effects of altitude on bacterial community Shannon and Chao1 indices may be attributed to the different responses of bacterial phyla, such as Acidobacteria and Chloroflexi, to altitude. Both this study and Bryant’s findings suggested that altitude has a negative effect on Acidobacteria [4]. Chloroflexi abundance increased with an increasing altitude in this study. Chloroflexi is a highly metabolically diverse group of bacteria found in permafrost and low-nutrient soils [9]. In this study, the increase of Chloroflexi abundance with altitude may be attributed to the strong ecological adaptability of this phylum.
In summary, the soil microorganism diversity pattern does not predictably follow the biogeographic distribution pattern of terrestrial organisms on the altitudinal gradient but shows a diversified change pattern [9]. Similar to the distribution pattern of fungi, there are regional differences, for example, on Mount Kilimanjaro [3] and in Hawai’i [2]. Different microbial phyla and dominant species may have unique responses and complex regulatory mechanisms in response to altitudinal gradients [9]. Therefore, in the future, the authors should explore the response mechanisms of soil-dominant, indigenous, and endemic microorganisms to altitude and the niche differentiation mechanisms of communities at different classification levels.

5.3. Relationship between Microbial Community and Lithology

This study found that the total OTUs of bacteria and fungi in limestone habitats were higher than those in sandstone and dolomite habitats. For the fungal Shannon index, limestone was higher than dolomite, whereas the opposite was true for the bacteria. There were probably three reasons for this. First, the karst limestone area has a high calcium carbonate content, high porosity, and exposed bedrock. Strong karstification creates numerous crevices on the rock surface, providing breeding sites for microorganisms [36,37]. The weathering rate of rocks in the limestone area is higher than that of dolomite, which is conducive to the accumulation of SOM and AN [38,39], and provides sufficient amounts of nutrients for the development of terrestrial plants and soil microorganisms. Second, soil fertility is fundamentally limited and directly affected by the nature of the rock [40]. The average contents of AN, SOM, and ACa in soils developed from limestone were higher than those in soils developed from dolomite and sandstone. In this study, there was a significant positive correlation between SOM, ACa, and AN contents in the rhizosphere of S. japonica, which were closely related to the structure of the soil’s mother rock, and all of them were positively correlated with the Shannon index of the fungal community. This may be the reason why the Shannon index of the fungal community in the soil developed by limestone was higher than that in the soil developed by sandstone and dolomite. AN, SOM, and ACa were negatively correlated with bacterial diversity, indirectly reflecting the inferiority of bacterial community richness and diversity in the process of rock desertification. However, not all bacterial phyla were inhibited by rocky desertification. For example, the strong ecological adaptability of Chloroflexi makes it widely distributed across Gloria Mountain, permafrost, high-altitude barren soils, and other habitats [9]. Third, changes in fungal communities were inseparable from the adaptability of the flora to the environment. In this study, the abundance of Basidiomycota fungi in limestone-developed soils was higher than that in dolomite-developed soils. Basidiomycota species can produce spores in harsh environments and can migrate easily through the air [12], making this group a dominant fungal phylum in the rhizosphere of S. japonica. Simultaneously, the reproduction of the dominant fungal phylum may contribute to the improvement in fungal community diversity under rocky desertification conditions. The spread of dominant Basidiomycota spores has also been observed in extreme environments, such as glaciers [12].
Rocky desertification in karst areas is related to lithology [41], and the degree of rocky desertification in limestone areas is more severe than in dolomite areas [41]. The soil mother rock not only affects soil-elements circulation and transmission but also restricts the acquisition of soil microbial resources, community construction, and other biological processes, further shaping the structure and distribution pattern of microorganisms and ultimately leading to soil quality and productivity changes. The physiological adaptability and ecological strategies of microorganisms in response to rocky desertification and reverse development warrant further exploration.

5.4. Relationship between Microorganisms and Soil Factors

Soil acidity and alkalinity are important regulatory indicators of bacterial community composition [13]. pH had a positive effect on the microorganisms’ α diversity, which was consistent with the results of the study conducted in the Gloria Mountain summits [9]. The change of microbial community in the rhizosphere of S. japonica was not only related to the pH range but also related to the ecological adaptability of Acidobacteria, Glomeromycota, and other microbial groups. The preference of Acidobacteria for acidic soils has led to an increase in the abundance of the phylum [42]. The result of this study was in contrast to the conclusions of other papers in which the proportion of Acidobacteria increased with a decrease in pH [26,29,43]. The pH was positively correlated with the abundance of dominant fungi such as Glomeromycota based on mycorrhizal symbionts in the rhizosphere of S. japonica. Glomeromycota occupied a wide niche by relying on its strong ecological adaptability [12]. This may contribute to the positive effect of pH on the α diversity of the fungal community as a whole. These results indicated that the effects of soil acidity and alkalinity on different microbial groups were different and that soil acidity and alkalinity were the main factors that predicted changes in microbial community diversity.
Both AN and SOM in the rhizosphere soil of S. japonica had adverse effects on the bacterial Shannon index but contributed to the improvement in the fungal Shannon index. Liao et al. and Zhang et al. suggested that an increase in N content promoted plant photosynthesis, and increased litter and C input could provide N sources for microorganisms, with fungi using the C preferentially [10,44]. This helped to improve fungi community diversity but reduced bacterial diversity. AN and SOM in the rhizosphere of S. japonica jointly increased the abundance of Rozellomycota, Olpidiomycota, and other fungi. The inhibitory effects of AN and SOM on bacteria may be attributed to the negative effects of Firmicutes, which have acute requirements for resources and nutrient conditions such as organic carbon pools [11,44]. The large number of bacterial groups led to the lack of relative resources and reduced the relative abundance of the bacterial phylum [11,44]. However, this study found that AN and SOM increased the abundance of Proteobacteria and other bacteria. Proteobacteria consume volatile SOM with high nutritional requirements [42], and the proteins’ abundance, which is involved in lipid metabolism and transport, is related to carbon content. Low-carbon areas may have competitive advantages [45], and high-nutrient areas are more conducive to the development of this phylum. This was similar to the results obtained from semi-arid Mediterranean soils [46] and Anqing paddy fields [42].
Both S. japonica rhizosphere AP and AK had a negative impact on microbial α diversity. AP and AK affect microbial competitive behavior, survival strategies, and individual life cycles by combining other soil factors, which in turn leads to changes in the microorganisms’ structure in agricultural saline soil, tropical ecosystems, the Loess Plateau [47], and other regions [8,48,49]. Low AP and AK are premises for improving the microorganisms’ diversity, and nutrient enrichment may inhibit the development of dominant species in the community, limit the exchange of resources between microorganisms and the outside world, and adversely affect soil microorganisms. AP has been found to reduce Ascomycota, Gemmatimonadetes, and Basidiomycota abundance in the rhizospheres of S. japonica, grapes [50], and watermelons [51]. Gemmatimonadetes are oligotrophic bacteria found in low-humidity, low-oxygen, semi-arid and arid regions, and alpine regions [10,52]. Ascomycota and Basidiomycota are distributed in temperate forests, arid areas, cultivated lands, rainforests, and other areas with different ecological and environmental conditions [53,54]. Dominant species with a wide ecological range are stressed by nutrient enrichment, and the stress-resistance mechanisms of different strains and the response mechanisms to the diffusion and loss of soil elements require further study.
Elevated ACa and AMg in the S. japonica rhizosphere were associated with the bacterial community Chao1 index and the fungal community Shannon index. Ca is important for maintaining environmental homeostasis for spore formation, mycelial growth, and cell division [12,55]. Therefore, areas with high Ca content have high fungal diversity [12,55]. In this study, the content of ACa in soils developed from limestone was higher than that in soils developed from dolomite and sandstone, which may be the reason for the positive correlation between ACa and the Shannon index of the fungal community. The high mobility and filterability of Mg in the soil make the lack of Mg in the soil a prominent problem in acidic soils [56]. Mg can increase the bacterial Shannon and Chao1 indices in both S. japonica and tea-garden soil [56]. On the one hand, it may be because Mg promotes plant growth, increases soil litter, helps SOM decompose, and provides C sources for microbial growth [56,57]. On the other hand, the dissolution of Mg compounds can provide hydroxide ions [56,57], increase soil pH, alleviate acid stress, and then reduce the leaching, extraction, and transfer of K, Ca, and other elements [56,57] as well as increase nutrient input. In the S. japonica rhizosphere, AMg was positively correlated with pH, SOM, ACa, and AK content. In summary, Ca and Mg play important roles in improving nutrient conditions and shaping microbial communities. The differential response mechanisms of microorganisms to diverse environmental variables, such as soil calcium and magnesium, require further research.

6. Conclusions

In this study, S. japonica rhizosphere microorganism diversity at different altitudes and lithological conditions in the karst area of Guangxi, China, was investigated to provide basic data for the development of soil microbial community function in karst areas in the future. The rhizosphere bacteria of S. japonica covered 37 phyla of 441 species, including Proteobacteria, and the fungal community covered 15 phyla of 259 species, including Ascomycota and Basidiomycota. An elevated altitude increased the fungal Shannon and Chao1 indices in the rhizosphere soil of S. japonica while decreasing the bacterial Shannon index. Fungal diversity in limestone plots was higher than that in dolomite plots. There was a significant positive correlation between soil ACa, SOM, and AN (p < 0.01), which was positively correlated with the Shannon index of the fungal community. The results showed that altitude, lithology, pH, and AP were key factors driving changes in the microorganisms. Whether changes in the rhizosphere microorganisms are the cause of the differences in the growth and secondary metabolites of S. japonica must be explored.

Author Contributions

L.Y.: Conceptualization, Methodology, Software, Data curation, Visualization, Writing—original draft, Writing—review and editing. P.L.: Visualization, Software, Data curation. C.T.: Methodology. Y.L.: Methodology. L.Z.: Methodology. S.T.: Data curation. Z.Z.: Conceptualization, Methodology, Writing—review and editing, Supervision, Project administration, Funding acquisition. All authors have read and agreed to the published version of the manuscript.

Funding

This research was funded by the National Natural Science Foundation of China (grant numbers 31960272 and 32360322), the Basic Research Fund of the Guangxi Academy of Sciences (grant number CQZ-E-1909), the Basic Business Fee Project of Guangxi Institute of Botany (22010), and Guangxi Scientific and Technological Project (Guike AB18126065).

Data Availability Statement

The raw reads have been stored in the NCBI Sequence Read Archive (SRA) database (PRJNA1051012). Temporary Submission ID: SUB14144334, SUB14144467.

Conflicts of Interest

The authors declare no conflicts of interest.

References

  1. Gil-Martínez, M.; López-García, Á.; Domínguez, M.T.; Kjøller, R.; Navarro-Fernández, C.M.; Rosendahl, S.; Marañón, T. Soil fungal diversity and functionality are driven by plant species used in phytoremediation. Soil Biol. Biochem. 2021, 153, 108102. [Google Scholar] [CrossRef]
  2. Peay, K.G.; von Sperber, C.; Cardarelli, E.; Toju, H.; Francis, C.A.; Chadwick, O.A.; Vitousek, P.M. Convergence and contrast in the community structure of Bacteria, Fungi and Archaea along a tropical elevation-climate gradient. FEMS Microbiol. Ecol. 2017, 93, fix045. [Google Scholar] [CrossRef] [PubMed]
  3. Shen, C.; Gunina, A.; Luo, Y.; Wang, J.; He, J.; Kuzyakov, Y.; Hemp, A.; Classen, A.T.; Ge, Y. Contrasting patterns and drivers of soil bacterial and fungal diversity across a mountain gradient. Environ. Microbiol. 2020, 22, 3287–3301. [Google Scholar] [CrossRef]
  4. Bryant, J.A.; Lamanna, C.; Morlon, H.; Green, J.L. Microbes on mountainsides contrasting elevational patterns of bacterial and plant diversity. Proc. Natl. Acad. Sci. USA 2008, 105, 11505–11511. [Google Scholar] [CrossRef]
  5. Nottingham, A.T.; Fierer, N.; Turner, B.L.; Whitaker, J.; Ostle, N.J.; McNamara, N.P.; Bardgett, R.D.; Leff, J.W.; Salinas, N.; Silman, M.; et al. Microbes Follow Humboldt: Temperature drives plant and soil microbial diversity patterns from the Amazon to the Andes. Ecology 2018, 99, 2455–2466. [Google Scholar] [CrossRef] [PubMed]
  6. Shen, C.; Shi, Y.; Fan, K.; He, J.S.; Adams, J.M.; Ge, Y.; Chu, H. Soil pH dominates elevational diversity pattern for bacteria in high elevation alkaline soils on the Tibetan Plateau. FEMS Microbiol. Ecol. 2019, 95, fiz003. [Google Scholar] [CrossRef]
  7. Tang, J.; Tang, X.; Qin, Y.; He, Q.; Yi, Y.; Ji, Z. Karst rocky desertification progress: Soil calcium as a possible driving force. Sci. Total Environ. 2019, 649, 1250–1259. [Google Scholar] [CrossRef]
  8. Jing, X.; Chen, X.; Fang, J.; Ji, C.; Shen, H.; Zheng, C.; Zhu, B. Soil microbial carbon and nutrient constraints are driven more by climate and soil physicochemical properties than by nutrient addition in forest ecosystems. Soil Biol. Biochem. 2019, 141, 107657. [Google Scholar] [CrossRef]
  9. Adamczyk, M.; Hagedorn, F.; Wipf, S.; Donhauser, J.; Vittoz, P.; Rixen, C.; Frossard, A.; Theurillat, J.; Frey, B. The soil microbiome of Gloria mountain summits in the Swiss Alps. Front. Microbiol. 2019, 10, 447428. [Google Scholar] [CrossRef]
  10. Zhang, J.; Li, T.; Jia, J.; Zhang, J.; Zhang, F. Bacterial taxa and fungal diversity are the key factors determining soil multifunctionality in different cropping systems. Land Degrad. Dev. 2021, 32, 5012–5022. [Google Scholar] [CrossRef]
  11. Fierer, N.; Bradford, M.A.; Jackson, R.B. Toward an ecological classification of soil bacteria. Ecology 2007, 88, 1354–1364. [Google Scholar] [CrossRef]
  12. Hu, Y.; Fair, H.; Liu, Q.; Wang, Z.; Duan, B.; Lu, X. Diversity and co-occurrence networks of bacterial and fungal communities on two typical debris-covered glaciers, southeastern Tibetan Plateau. Microbiol. Res. 2023, 273, 127409. [Google Scholar] [CrossRef]
  13. Dzurendova, S.; Zimmermann, B.; Kohler, A.; Reitzel, K.; Nielsen, U.G.; Dupuy-Galet, B.X.; Leivers, S.; Horn, S.J.; Shapaval, V. Calcium affects polyphosphate and lipid accumulation in Mucoromycota fungi. J. Fungi. 2021, 7, 300. [Google Scholar] [CrossRef] [PubMed]
  14. Shu, W.; Liu, J.; Zou, R.; Tang, J.; Xiong, Z.; Jiang, Y. Determination of the effect of different producing areas and harvest time on the content of rutin in Sophora japonica by high performance liquid chromatography. Lishizhen Med. Mater. Med. Res. 2017, 28, 709–711. Available online: https://kns.cnki.net/kcms/detail/detail.aspx?FileName=SZGY201703074&DbName=CJFQ2017 (accessed on 15 August 2023).
  15. Xiao, D.; Tan, Y.; Liu, X.; Yang, R.; Zhang, W.; He, X.; Wang, K. Effects of different legume species and densities on arbuscular mycorrhizal fungal communities in a karst grassland ecosystem. Sci. Total Environ. 2019, 678, 551–558. [Google Scholar] [CrossRef]
  16. Carter, M.R.; Gregorich, E.G. Soil Sampling and Methods of Analysis; CRC Press: Boca Raton, FL, USA, 2007. [Google Scholar] [CrossRef]
  17. Mebius, L. A rapid method for the determination of organic carbon in soil. Anal. Chim. Acta. 1960, 22, 120–124. [Google Scholar] [CrossRef]
  18. Sheng, H.J.; Tian, L.Y.; Jiang, X.; Wang, X.L. Discussion on determination of available nitrogen in the greenhouse soil with alkali hydrolysis diffusion method. Res. Explor. Lab. 2022, 41, 5–7+35. Available online: https://link.cnki.net/doi/10.19927/j.cnki.syyt.2022.02.002 (accessed on 20 August 2023).
  19. Moonrungsee, N.; Pencharee, S.; Jakmunee, J. Colorimetric analyzer based on mobile phone camera for determination of available phosphorus in soil. Talanta 2015, 136, 204–209. [Google Scholar] [CrossRef]
  20. Cox, A.E.; Joern, B.C.; Brouder, S.M.; Gao, D. Plant-available potassium assessment with a modified sodium tetraphenylboron method. Soil Sci. Soc. Am. J. 1999, 63, 902–911. [Google Scholar] [CrossRef]
  21. Rajtor, M.; Piotrowska-Seget, Z. Prospects for arbuscular mycorrhizal fungi (AMF) to assist in phytoremediation of soil hydrocarbon contaminants. Chemosphere 2016, 162, 105–116. [Google Scholar] [CrossRef]
  22. Kubista, M.; Andrade, J.M.; Bengtsson, M.; Forootan, A.; Jonák, J.; Lind, K.; Sindelka, R.; Sjöback, R.; Sjögreen, B.; Strömbom, L.; et al. The real-time polymerase chain reaction. Mol. Asp. Med. 2006, 27, 95–125. [Google Scholar] [CrossRef] [PubMed]
  23. Wu, Y.N.; Feng, K.; Li, S.Z.; Wang, Z.J.; Zhang, Z.J.; Deng, Y. In-silico evaluation and improvement on 16S/18S/ITS primers for amplicon high-throughput sequencing. Microbiol. China 2020, 47, 2897–2912. [Google Scholar] [CrossRef]
  24. Tom, C.J.; Hill, K.A.; Walsh, J.A.; Harris, B.F. Moffett, Using ecological diversity measures with bacterial communities. FEMS Microbiol. Ecol. 2003, 43, 1–11. [Google Scholar] [CrossRef]
  25. Clarke, K.R.; Somerfield, P.J.; Chapman, M.G. On resemblance measures for ecological studies, including taxonomic dissimilarities and a zero-adjusted Bray-Curtis coefficient for denuded assemblages. J. Exp. Mar. Biol. Ecol. 2006, 330, 55–80. [Google Scholar] [CrossRef]
  26. Shen, C.; Xiong, J.; Zhang, H.; Feng, Y.; Lin, X.; Li, X.; Liang, W.; Chu, H. Soil pH drives the spatial distribution of bacterial communities along elevation on Changbai Mountain. Soil Biol. Biochem. 2013, 57, 204–211. [Google Scholar] [CrossRef]
  27. Wallenstein, M.D.; McMahon, S.; Schimel, J. Bacterial and fungal community structure in Arctic tundra tussock and shrub soils. FEMS Microbiol. Ecol. 2007, 59, 428–435. [Google Scholar] [CrossRef]
  28. Johnston-Monje, D.; Lundberg, D.S.; Lazarovits, G.; Reis, V.M.; Raizada, M.N. Bacterial populations in juvenile maize rhizospheres originate from both seed and soil. Plant Soil. 2016, 405, 337–355. [Google Scholar] [CrossRef]
  29. Dimitriu, P.A.; Grayston, S.J. Relationship between soil properties and patterns of bacterial β-diversity across reclaimed and natural boreal forest soils. Microb. Ecol. 2010, 59, 563–573. [Google Scholar] [CrossRef]
  30. Kielak, A.M.; Cipriano, M.A.P.; Kuramae, E.E. Acidobacteria strains from subdivision 1 act as plant growth-promoting bacteria. Arch. Microbiol. 2016, 198, 987–993. [Google Scholar] [CrossRef]
  31. Bastida, F.; Hernández, T.; Albaladejo, J.; García, C. Phylogenetic and functional changes in the microbial community of long-term restored soils under semiarid climate. Soil Biol. Biochem. 2013, 65, 12–21. [Google Scholar] [CrossRef]
  32. Djemiel, C.; Grec, S.; Hawkins, S. Characterization of bacterial and fungal community dynamics by high-throughput sequencing (HTS) metabarcoding during flax dew-retting. Front. Microbiol. 2017, 8, 294096. [Google Scholar] [CrossRef] [PubMed]
  33. Wu, X.; Cai, J.; Wang, C.; Li, W.; Chen, G.; Bai, Y. Altitude distribution characteristics of farmland soil bacteria in loess hilly region of Ningxia. Environ. Sci. 2023, 1–11. [Google Scholar] [CrossRef]
  34. Zhou, H.; Li, S.; Sun, J.; Qu, J.; Zhang, Z.; Ma, L.; Qin, R.; Wei, J.; Chang, T.; Su, H.; et al. The variation characteristics of plant community and soil physical and chemical properties of alpine meadow along altitude gradient in Sanjiangyuan region. Acta Agrestia Sin. 2023, 31, 1735–1743. Available online: https://kns.cnki.net/kcms/detail/11.3362.S.20230511.1052.004.html (accessed on 2 October 2023).
  35. Wu, Z.; Lin, W.; Chen, Z.; Fang, C.; Zhang, Z.; Wu, L.; Zhou, M.; Shen, L. Soil microbial community characteristics of different vegetation types in Wuyishan National Nature Reserve. Chin. J. Appl. Ecol. 2013, 24, 2301–2309. [Google Scholar] [CrossRef]
  36. Li, W.; Liu, Y.; Wu, G.; Xiang, J.; Li, M.; Yu, L. Migration characteristics of main elements in different geological backgrounds and their correlation with plant transpiration in Maocun Village. Guilin. Soils 2007, 5, 746–752. Available online: https://kns.cnki.net/kcms/detail/detail.aspx?FileName=TURA200705014&DbName=CJFQ2007 (accessed on 27 October 2023).
  37. Liang, Y.; Su, Y.; He, X.; Chen, X. Effects of lithology on community structure and abundance of nitrogen-fixing bacteria and arbuscular mycorrhizal fungi in karst shrub soil. Environ. Sci. 2017, 38, 1253–1261. [Google Scholar] [CrossRef] [PubMed]
  38. Eilers, K.G.; Debenport, S.; Anderson, S.; Fierer, N. Digging deeper to find unique microbial communities: The strong effect of depth on the structure of bacterial and archaeal communities in soil. Soil Biol. Biochem. 2012, 50, 58–65. [Google Scholar]
  39. Jia, S.; Yu, L. Analysis of soil physical and chemical properties of limestone and dolomite in karst rocky desertification area-A case study of Xingyi City, Guizhou Province. Guizhou Sci. 2010, 28, 29–33+55. Available online: https://kns.cnki.net/kcms/detail/detail.aspx?FileName=GZKX201003008&DbName=CJFQ2010 (accessed on 2 January 2024).
  40. Weemstra, M.; Peay, K.G.; Davies, S.J.; Mohamad, M.; Itoh, A.; Tan, S.; Russo, S.E. Lithological constraints on resource economies shape the mycorrhizal composition of a Bornean rain forest. New Phytol. 2020, 228, 253–268. [Google Scholar] [CrossRef] [PubMed]
  41. Li, R.; Wang, S.; Zhou, D.; Zhang, D.; Li, F.; Zhou, Z.; Xiong, K. Correlation analysis of lithology and land rocky desertification in karst area of Guizhou. Acta Geogr. Sin. 2003, 2, 314–320. Available online: https://kns.cnki.net/kcms2/article/abstract?v=LD-wYsOa3DgxakyuZUjGbLFEaXNOom2CD_BDByTft-eCZsHGhmkhAkVsUgRAIe_yAWhvAE-KasGOv-MX2HketpVSmJjXYYPQtzefKJSaCsfJnd5-1dufmQochb8Nm3rr&uniplatform=NZKPT&language=CHS (accessed on 10 January 2024).
  42. Wang, G.; Wang, L.; Ma, F. Effects of earthworms and arbuscular mycorrhizal fungi on improvement of fertility and microbial communities of soils heavily polluted by cadmium. Chemosphere 2022, 286, 131567. [Google Scholar] [CrossRef] [PubMed]
  43. Jones, R.T.; Robeson, M.S.; Lauber, C.L.; Hamady, M.; Knight, R.; Fierer, N. A comprehensive survey of soil acidobacterial diversity using pyrosequencing and clone library analyses. ISME J. 2009, 3, 442–453. [Google Scholar] [CrossRef] [PubMed]
  44. Liao, L.; Wang, X.; Wang, J.; Liu, G.; Zhang, C. Nitrogen fertilization increases fungal diversity and abundance of saprotrophs while reducing nitrogen fixation potential in a semiarid grassland. Plant Soil. 2021, 465, 515–532. [Google Scholar] [CrossRef]
  45. Lauro, F.M.; McDougald, D.; Thomas, T.; Williams, T.J.; Egan, S.; Rice, S.; DeMaere, M.Z.; Ting, L.; Ertan, H.; Johnson, J.; et al. The genomic basis of trophic strategy in marine bacteria. Proc. Natl. Acad. Sci. USA 2009, 106, 15527–15533. [Google Scholar] [CrossRef] [PubMed]
  46. Bastida, F.; Torres, I.F.; Moreno, J.L.; Baldrian, P.; Ondoño, S.; Ruiz-Navarro, A.; Hernández, T.; Richnow, H.H.; Starke, R.; García, C.; et al. The active microbial diversity drives ecosystem multifunctionality and is physiologically related to carbon availability in Mediterranean semi-arid soils. Mol. Ecol. 2016, 25, 4660–4673. [Google Scholar] [CrossRef] [PubMed]
  47. Gong, X.; Liu, C.; Li, J.; Luo, Y.; Yang, Q.; Zhang, W.; Yang, P.; Feng, B. Responses of rhizosphere soil properties, enzyme activities and microbial diversity to intercropping patterns on the Loess Plateau of China. Soil Tillage Res. 2019, 195, 104355. [Google Scholar] [CrossRef]
  48. Hou, Y.; Zeng, W.; Hou, M.; Wang, Z.; Luo, Y.; Lei, G.; Zhou, B.; Huang, J. Responses of the soil microbial community to salinity stress in Maize Fields. Biology 2021, 10, 1114. [Google Scholar] [CrossRef]
  49. Zhao, S.; Liu, J.; Banerjee, S.; Zhou, N.; Zhao, Z.; Zhang, K.; Hu, M.; Tian, C. Biogeographical distribution of bacterial communities in saline agricultural soil. Geoderma 2020, 361, 114095. [Google Scholar] [CrossRef]
  50. Liu, Q.; Wang, S.; Li, K.; Qiao, J.; Guo, Y.; Liu, Z.; Guo, X. Responses of soil bacterial and fungal communities to the long-term monoculture of grapevine. Appl. Microbiol. Biotechnol. 2021, 105, 7035–7050. [Google Scholar] [CrossRef]
  51. Tian, M.; Liang, J.; Liu, S.; Yu, R.; Zhang, X. Effects of watermelon cropping management on soil bacteria and fungi biodiversity. Agric 2023, 13, 1010. [Google Scholar] [CrossRef]
  52. DeBruyn, J.M.; Nixon, L.T.; Fawaz, M.N.; Johnson, A.M.; Radosevich, M. Global biogeography and quantitative seasonal dynamics of Gemmatimonadetes in soil. Appl. Environ. Microbiol. 2011, 77, 6295–6300. [Google Scholar] [CrossRef] [PubMed]
  53. Navarro-Noya, Y.E.; Montoya-Ciriaco, N.; Muñoz-Arenas, L.C.; Hereira-Pacheco, S.; Estrada-Torres, A.; Dendooven, L. Conversion of a high-altitude temperate forest for agriculture reduced alpha and beta diversity of the soil fungal communities as revealed by a metabarcoding analysis. Front. Microbiol. 2021, 12, 667566. [Google Scholar] [CrossRef] [PubMed]
  54. Yu, L.; Zhang, Z.; Zhou, L.; Huang, K. Effects of altitude and continuous cropping on arbuscular mycorrhizal fungi community in Siraitia grosvenorii rhizosphere. Agric 2023, 13, 1548. [Google Scholar] [CrossRef]
  55. Yang, W.; Ji, Z.; Wu, A.; He, D.; Rensing, C.; Chen, Y.; Chen, C.; Wu, H.; Muneer, M.; Wu, L. Inconsistent responses of soil bacterial and fungal community’s diversity and network to magnesium fertilization in tea (Camellia sinensis) plantation soils. Appl. Soil Ecol. 2023, 191, 105055. [Google Scholar] [CrossRef]
  56. Senbayram, M.; Gransee, A.; Wahle, V.; Thiel, H. Role of magnesium fertilisers in agriculture: Plant-soil continuum. Crop Pasture Sci. 2015, 66, 1219. [Google Scholar] [CrossRef]
  57. Yang, X.; Ni, K.; Shi, Y.; Yi, X.; Zhang, Q.; Fang, L.; Ma, L.; Ruan, J. Effects of long-term nitrogen application on soil acidification and solution chemistry of a tea plantation in China. Agric. Ecosyst. Environ. 2018, 252, 74–82. [Google Scholar] [CrossRef]
Figure 1. Rhizosphere microbial community composition of S. japonica. Notes: This connection indicates the presence of microbial phylum in the sample. The thicker the connection, the higher the species abundance is.
Horticulturae 10 00441 g001
Figure 2. NMDS analysis of bacterial and fungal communities in each group.
Horticulturae 10 00441 g002
Figure 3. Common and unique OTUs of bacterial and fungal communities. Note: The overlapping region represents the number of OTUs shared by the group, and the non-overlapping region represents the number of OTUs specific to the group.
Horticulturae 10 00441 g003
Figure 4. CCA of microbial community and environmental factors in rhizosphere soil of S. japonica.
Horticulturae 10 00441 g004
Figure 5. The contribution of environmental factors to the distribution of microbial communities. Note: Each circle represents an environmental factor. The percentage of overlapping parts of circles represents the degree of interpretation after the interaction of two (or several) environmental factors, excluding other effects. The percentage of nonoverlapping parts represents the degree of interpretation of the difference in the distribution of community species after the exclusion of other factors by a certain environmental factor. Outside the circle represents the proportion of all environmental factors that cannot be explained.
Horticulturae 10 00441 g005
Figure 6. Pearson correlation between rhizosphere microbial community and ecological factors of S. japonica. Note: The line color of the network diagram represents the correlation between the microbial phylum and ecological factors. Red represents a positive correlation, and blue represents a negative correlation. The line type of the network diagram represents the p-value range. Solid lines represent p < 0.05, and dashed lines represent p ≥ 0.05. The line thickness represents the absolute value of the correlation coefficient. The color of the correlation heat map represents the correlation coefficient. Red represents a positive correlation, and blue represents a negative correlation. A deeper color and a larger area indicate a stronger correlation.
Horticulturae 10 00441 g006
Table 1. Equipment related information.
EquipmentManufacturerCityCountry
pH meter (FE28)Mettler ToledoShanghaiChina
oil bath (HH-S)Jiangsu Kexi InstrumentChangzhouChina
Kjeldahl nitrogen analyzer (K1160)Shandong Hanon Scientific InstrumentsDezhouChina
Ultraviolet–visible spectrophotometer (UV-1800PC)Shanghai Mapada InstrumentsShanghaiChina
flame photometer (FP640)Shanghai Jingke ElectronicsShanghaiChina
ICAP (7200)Thermo Fisher ScientificWalthamAmerica
Table 2. Chemical reagents.
ReagentsConcentration
K2Cr2O70.8 mol L−1
H2SO498%
FeSO40.2 mol L−1
MgCl2analytical pure
HCl/H2SO44.0 mL HCl + 0.7 mL H2SO4
NH4OAc1 mol L−1
CH3COONH41 mol L−1
Table 3. Soil physicochemical properties of sampling points.
Sample
Code
Altitude
(m)
Longitude and LatitudepHAP
(mg kg−1)
AN
(g kg−1)
AMg
(mg kg−1)
ACa
(mg kg−1)
AK
(mg kg−1)
SOM
(g kg−1)
SY1171.4525°4′8″ 110°18′3″5.99 ± 0.52 a35 ± 12 a0.09 ± 0.00 a66 ± 17 a1062 ± 286 a175 ± 160 a14 ± 0.31 a
SY2672.2525°50′19″
111°12′27″
5.89 ± 0.37 a55 ± 39 a0.16 ± 0.05 a55 ± 12 a835 ± 126 a87 ± 26 a21 ± 6.21 a
BY1171.4525°53′25″
111°3′33″
5.44 ± 0.12 a73 ± 58 b0.13 ± 0.01 b47 ± 7 a698 ± 72 a52 ± 8 b19 ± 0.38 b
BY2230.4025°55′17″
111°0′52″
4.72 ± 0.32 b166 ± 121 b0.12 ± 0.02 b31 ± 17 a440 ± 143 a145 ± 85 b18 ± 4.34 b
BY325°49′26″
111°2′18″
4.62 ± 0.34 b825 ± 72 a0.21 ± 0.03 a49 ± 23 a1155 ± 661 a298 ± 33 a29 ± 3.16 a
SH1319.1025°52′28″
111°6′1″
5.65 ± 0.73 b67 ± 42 b0.18 ± 0.06 b306 ± 14 a2432 ± 242 b171 ± 125 a19 ± 2.01 c
SH2438.5025°51′36″
111°8′8″
6.48 ± 0.38 a181 ± 90 b0.16 ± 0.04 b136 ± 65 b2279 ± 347 b218 ± 119 a23 ± 7.17 bc
SH3537.4025°53′54″
111°10′41″
4.66 ± 0.34 c381 ± 19 a0.24 ± 0.10 b106 ± 16 b544 ± 128 d241 ± 79 a25 ± 4.71 bc
SH4672.2525°49′28″
111°15′37″
6.10 ± 0.25 ab182 ± 95 b0.35 ± 0.02 a115 ± 13 b3312 ± 145 a188 ± 49 a53 ± 0.53 a
SH5714.0025°50′19″
111°12′28″
6.51 ± 0.25 a195 ± 95 b0.19 ± 0.05 b93 ± 5 b1782 ± 347 c142 ± 83 a28 ± 5.21 b
Notes: Data are presented as mean ± standard deviation. The difference in physicochemical properties of soil samples at each sampling point of S. japonica was represented by different lowercase letters (p < 0.05). AP: available phosphorus. AN: available nitrogen. AMg: available magnesium. ACa: available calcium. AK: available potassium. SOM: soil organic matter.
Table 4. S. japonica rhizosphere microorganism statistics at different classification levels.
Sample IDPhylumClassOrderFamilyGenusSpeciesOTUs
SY133 (11)86 (35)150 (79)206 (153)352 (191)254 (116)6987 (1458)
SY231 (11)83 (36)154 (80)210 (137)324 (187)227 (93)6685 (1588)
BY127 (11)80 (35)148 (76)193 (146)311 (190)217 (100)6529 (1391)
BY230 (11)83 (31)150 (71)203 (130)330 (175)246 (79)6469 (1355)
BY331 (9)82 (29)156 (69)214 (128)375 (171)274 (101)6463 (1208)
SH128 (8)85 (31)160 (72)212 (130)380 (167)277 (92)6516 (1391)
SH228 (11)85 (30)161 (65)223 (121)379 (161)269 (91)6499 (1159)
SH329 (10)79 (32)142 (74)192 (127)315 (154)221 (86)5486 (1219)
SH429 (13)84 (35)143 (81)205 (140)319 (185)220 (97)6303 (1534)
SH534 (10)88 (34)171 (74)220 (134)352 (172)247 (97)6709 (1395)
Total37 (15)98 (46)201 (112)274 (239)531 (359)441 (259)19,634 (4252)
Notes: The number of bacteria and fungi at each classification level are identified outside and inside the brackets, respectively.
Table 5. Index of bacterial community diversity in rhizosphere soil of Sophora japonica.
Sample IDRichness IndexChao1 IndexShannon IndexSimpson Index
SY14215 ± 399 a4216 ± 399 a2.82 ± 0.07 a0.01 ± 0.00 a
SY24045 ± 63 a4046 ± 63 a2.83 ± 0.08 a0.01 ± 0.00 a
BY13864 ± 480 a3865 ± 480 a2.72 ± 0.14 a0.01 ± 0.00 a
BY23588 ± 726 a3589 ± 726 a2.61 ± 0.17 a0.01 ± 0.00 a
BY33551 ± 498 a3552 ± 498 a2.65 ± 0.16 a0.01 ± 0.00 a
SH13874 ± 303 a3875 ± 303 a2.77 ± 0.03 ab0.01 ± 0.00 a
SH23760 ± 321 ab3761 ± 321 ab2.68 ± 0.20 ab0.01 ± 0.01 a
SH33137 ± 575 b3138 ± 575 b2.43 ± 0.34 b0.03 ± 0.04 a
SH43813 ± 122 ab3814 ± 122 ab2.51 ± 0.12 ab0.02 ± 0.01 a
SH54047 ± 378 a4048 ± 378 a2.82 ± 0.09 a0.01 ± 0.00 a
Note: The value represents the mean ± standard deviation; The difference in the alpha index of bacterial community in the rhizosphere of S. japonica was expressed by different lowercase letters (p < 0.05).
Table 6. Index of fungal community diversity in rhizosphere soil of Sophora japonica.
Sample IDRichness IndexChao1 IndexShannon IndexSimpson Index
SY1816 ± 91 a817 ± 90 a1.62 ± 0.10 a0.07 ± 0.01 a
SY2926 ± 106 a927 ± 106 a1.61 ± 0.49 a0.13 ± 0.17 a
BY1776 ± 78 a777 ± 78 a1.49 ± 0.20 a0.12 ± 0.06 a
BY2735 ± 36 a736 ± 36 a1.66 ± 0.21 a0.07 ± 0.04 a
BY3676 ± 116 a677 ± 115 a1.43 ± 0.42 a0.15 ± 0.16 a
SH1779 ± 123 a780 ± 122 a1.78 ± 0.12 abc0.05 ± 0.02 ab
SH2647 ± 37 a649 ± 37 a1.51 ± 0.22 c0.11 ± 0.06 a
SH3695 ± 88 a696 ± 88 a1.54 ± 0.18 bc0.09 ± 0.04 ab
SH4827 ± 152 a829 ± 151 a1.88 ± 0.02 a0.04 ± 0.01 b
SH5797 ± 90 a798 ± 90 a1.82 ± 0.13 ab0.05 ± 0.02 ab
Note: The value represents the mean ± standard deviation; The difference in the alpha index of the fungal community in the rhizosphere of S. japonica was expressed by different lowercase letters (p < 0.05).
Disclaimer/Publisher’s Note: The statements, opinions and data contained in all publications are solely those of the individual author(s) and contributor(s) and not of MDPI and/or the editor(s). MDPI and/or the editor(s) disclaim responsibility for any injury to people or property resulting from any ideas, methods, instructions or products referred to in the content.

