
Optimization of Integrated Energy System Considering Electricity and Hydrogen Coordination in the Context of Carbon Trading
Abstract
:1. Introduction
- (1)
- An optimal scheduling model of CHP, CCS, P2G, and HFC joint operation in a carbon-trading mode is constructed which improves the flexibility of converting energy between electricity, hydrogen, and gas.
- (2)
- Considering the synergy of electricity and hydrogen, the traditional P2G operation process is replaced by the coupled operation of an electrolytic cell, a methane reactor, and a hydrogen fuel cell, forming a two-way flow of energy between electricity and hydrogen which can give full play to the advantage of the high energy efficiency of hydrogen energy and reduce the cascade loss of energy.
- (3)
- The adjustable thermoelectric ratio of CHP to HFC is beneficial to thermoelectric decoupling and enhances the flexibility of the system ‘s thermal–electric conversion.
2. The IES Operation Framework Considering CCS and Hydrogen Production in the Context of a Carbon Trading Mechanism
2.1. IES Model Establishment
2.1.1. Combined Heat and Power Model (CHP)
2.1.2. Electrolyzer (EL)
2.1.3. Methane Reactor (MR)
2.1.4. Hydrogen Fuel Cell (HFC)
2.1.5. Gas Boiler (GB)
2.1.6. Energy Storage System (ESS)
2.1.7. Carbon Capture System Model (CCS)
2.2. IES Optimization Model in Carbon Trading Mode
2.2.1. Carbon Emission Model
2.2.2. Total Cost of System Operation
3. Objective Functions and Constraint Conditions
3.1. Objective Function
3.2. Constraint Conditions
3.2.1. Energy Balance Constraints
3.2.2. Energy Storage Operation Constraint
4. Case Study
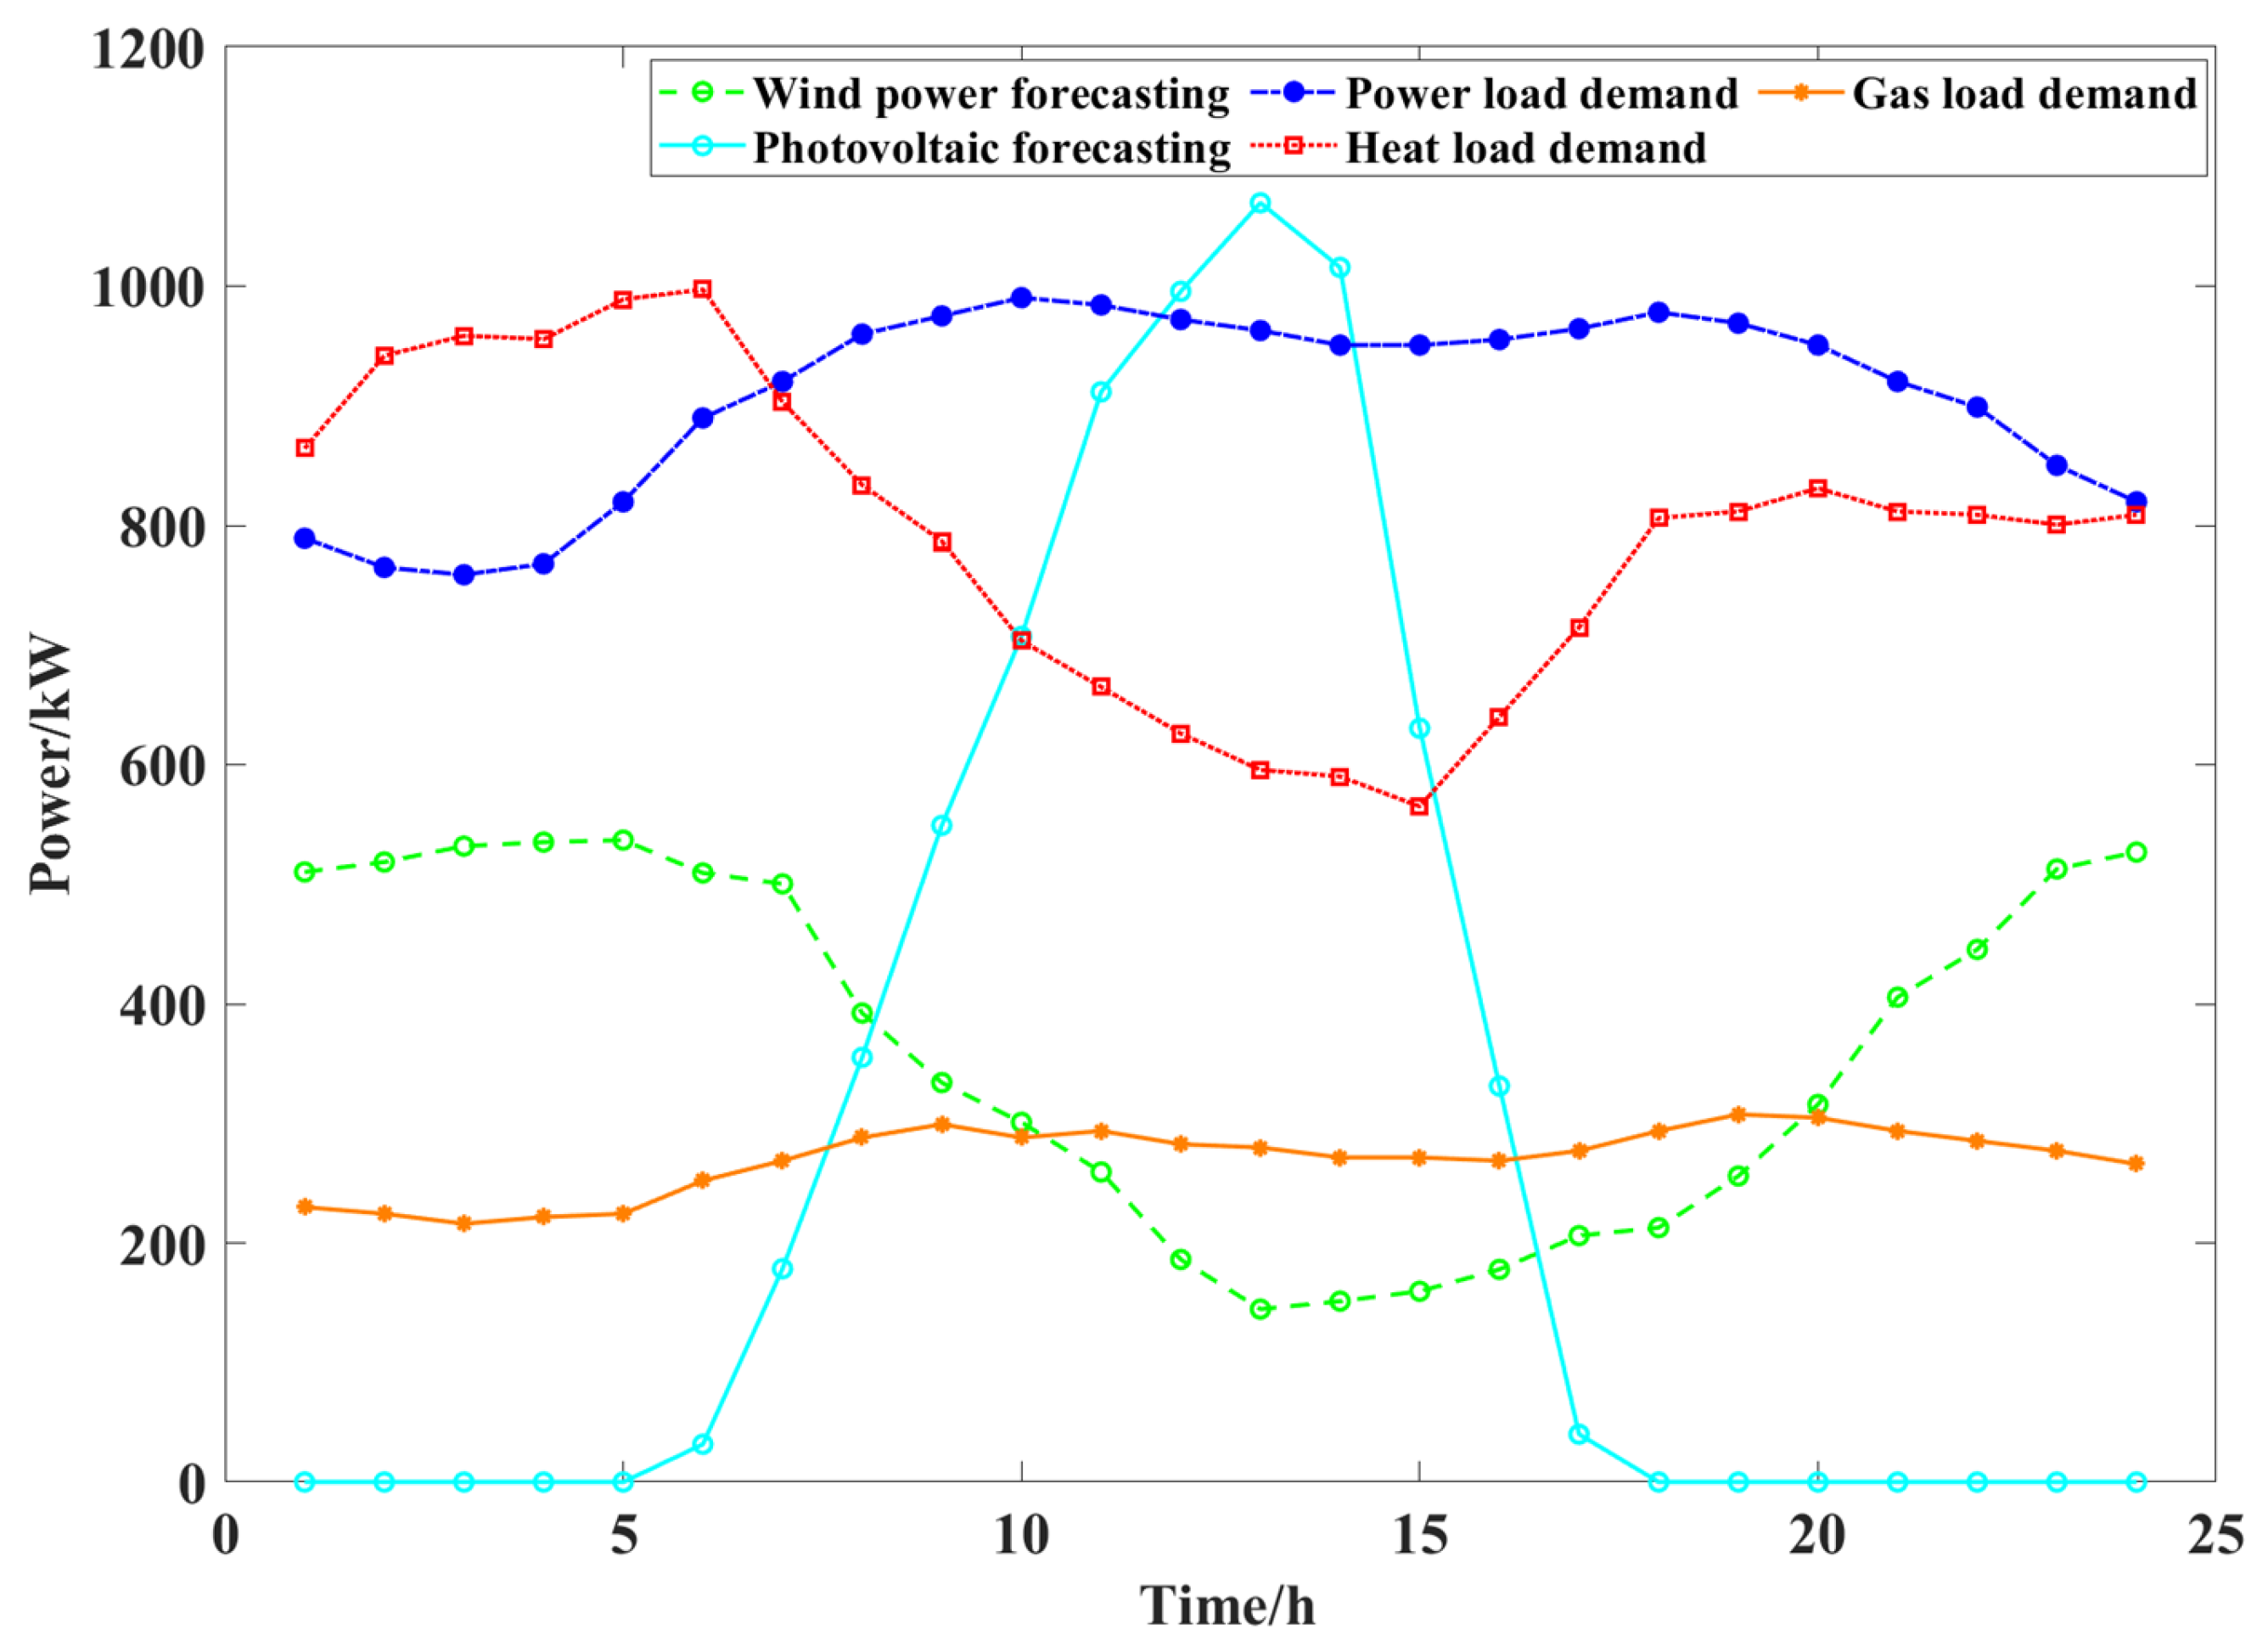
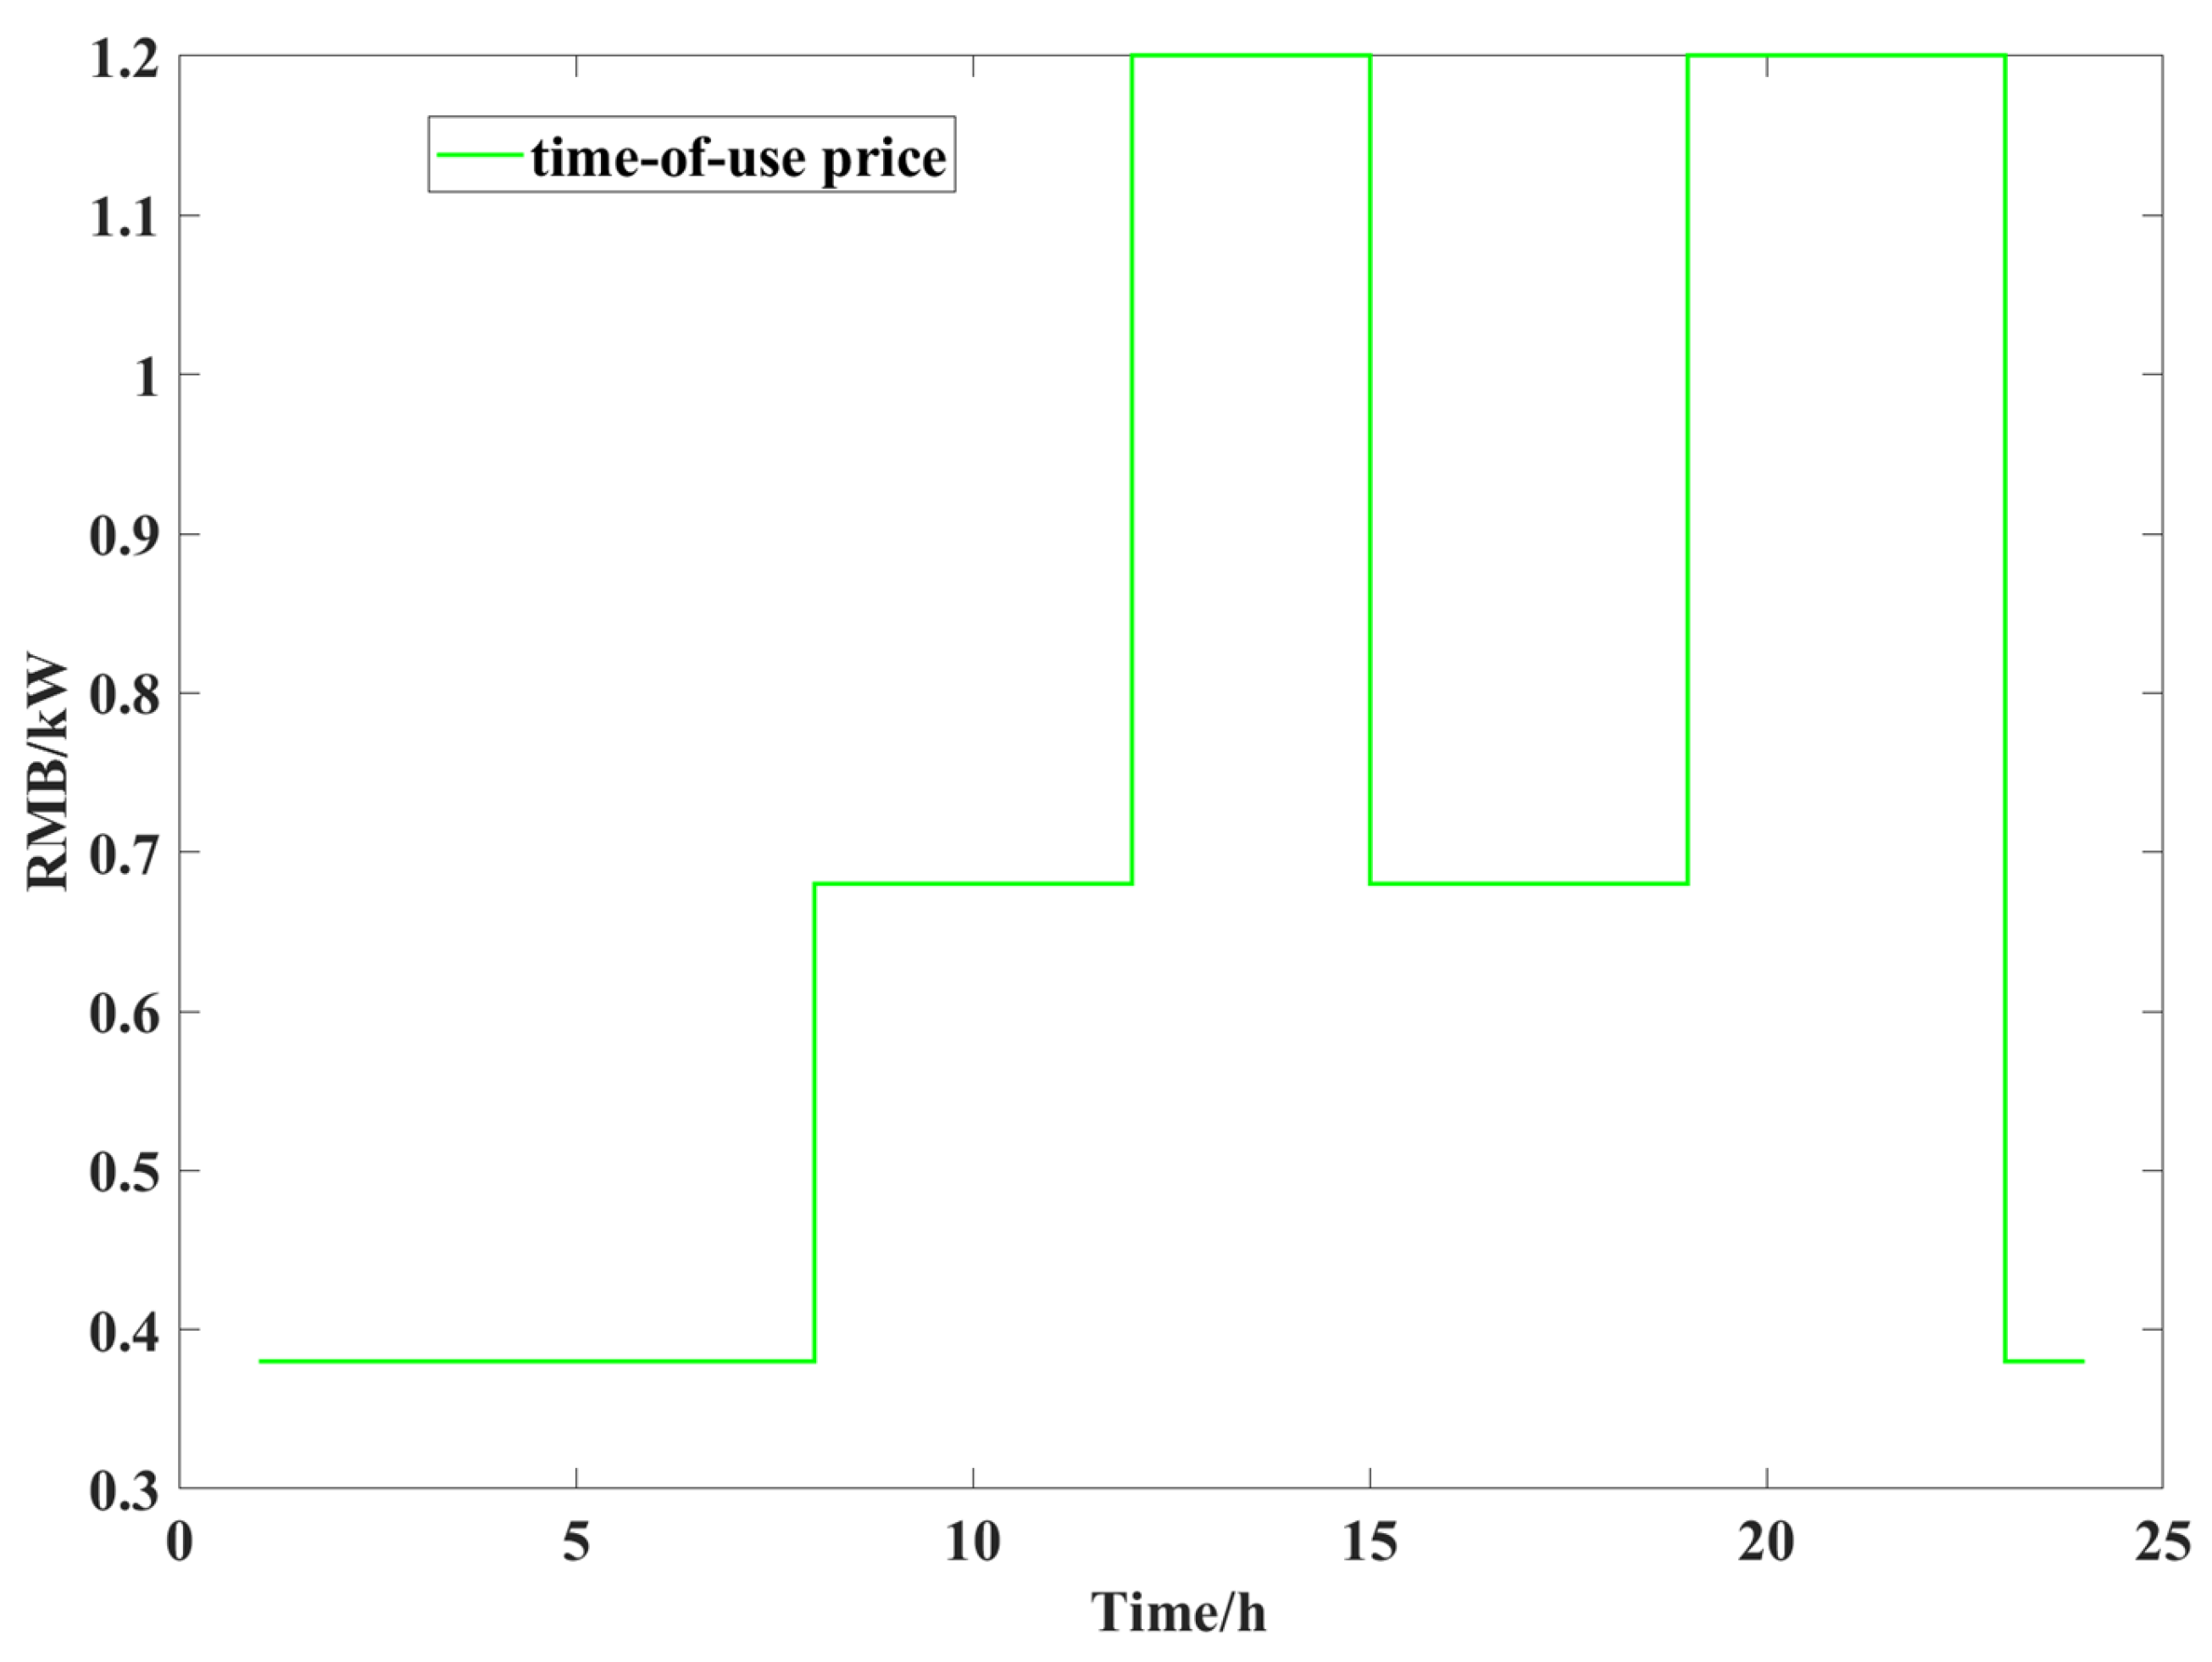
Basic Data
5. Conclusions
- (1)
- CCS coupled with P2G technology can achieve CO2 recycling and reduce gas purchases, effectively improving the low-carbon economic benefits of a system, reducing wind and light waste, and enhancing the renewable energy capacity of the IES.
- (2)
- By coupling the operation of an EL, MR and HFC, the synergy of electricity and hydrogen can be realized, which can give full play to the advantages of the high energy efficiency of hydrogen energy while promoting the consumption of wind power. Because the HFC can share part of the energy supply demand of the CHP system and GB, it can further reduce the carbon emissions of the system.
- (3)
- Considering the adjustable characteristics of the CHP system and HFC, according to the actual energy consumption, the output level of the CHP system and HFC can be adjusted in real time within an allowable range so as to realize the flexible conversion of heat and power and enhance the energy supply flexibility of the system.
Author Contributions
Funding
Data Availability Statement
Conflicts of Interest
References
- Shan, Y.; Guan, D.; Liu, J.; Mi, Z.; Liu, Z.; Liu, J.; Schroeder, H.; Cai, B.; Chen, Y.; Shao, S.; et al. Methodology and applications of city level CO2 emission accounts in China. J. Clean. Prod. 2017, 161, 1215–1225. [Google Scholar] [CrossRef]
- Zheng, X.; Streimikiene, D.; Balezentis, T.; Mardani, A.; Cavallaro, F.; Liao, H. A review of greenhouse gas emission profiles, dynamics, and climate change mitigation efforts across the key climate change players. J. Clean. Prod. 2019, 234, 1113–1133. [Google Scholar] [CrossRef]
- Ghaffour, N.; Bundschuh, J.; Mahmoudi, H.; Goosen, M.F.A. Renewable energy-driven desalination technologies: A comprehensive review on challenges and potential applications of integrated systems. Desalination 2015, 356, 94–114. [Google Scholar] [CrossRef]
- Liu, L.; Zhai, R.; Xu, Y.; Hu, Y.; Liu, S.; Yang, L. Comprehensive sustainability assessment and multi-objective optimization of a novel renewable energy driven multi-energy supply system. Appl. Therm. Eng. 2024, 236, e121461. [Google Scholar] [CrossRef]
- Dou, Z.; Zhang, C.; Wang, W.; Wang, D.; Zhang, Q.; Cai, Y.; Fan, R. Review on key technologies and typical applications of multi-station integrated energy systems. Glob. Energy Interconnect. 2022, 5, 309–327. [Google Scholar] [CrossRef]
- Zhai, Z.; Gao, Y.; Luan, T.; Yan, R.; Dou, H.; Yu, Z.; Liu, Z. Multi-objective operation optimization analysis based on distributed energy sources. J. Phys. Conf. Series. 2023, 2527, 012010. [Google Scholar] [CrossRef]
- Chen, Z.; Zhang, Y.; Ji, T.; Cai, Z.; Li, L.; Xu, Z. Coordinated optimal dispatch and market equilibrium of integrated electric power and natural gas networks with P2G embedded. J. Mod. Power Syst. Clean Energy 2017, 6, 495–508. [Google Scholar] [CrossRef]
- Zheng, Q.; Qinglai, G.; Hongbin, S. Review of modeling, planning and operation of power-natural gas coupling system. Glob. Energy Internet 2020, 3, 14–26. [Google Scholar]
- Saldarriaga-Cortés, C.; Salazar, H.; Moreno, R.; Jiménez-Estévez, G. Stochastic planning of electricity and gas networks: An asynchronous column generation approach. Appl. Energy 2018, 233–234, 1065–1077. [Google Scholar] [CrossRef]
- Zhang, X.; Chan, K.; Wang, H.; Hu, J.; Zhou, B.; Zhang, Y.; Qiu, J. Game-theoretic planning for integrated energy system with independent participants considering ancillary services of power-to-gas stations. Energy 2019, 176, 249–264. [Google Scholar] [CrossRef]
- Zeng, Q.; Fang, J.; Chen, Z.; Li, J.; Zhang, B. A multistage coordinative optimization for sitting and sizing P2G plants in an integrated electricity and natural gas system. In Proceedings of the 2016 IEEE International Energy Conference (ENERGYCON), Leuven, Belgium, 3–7 April 2016; pp. 1–6. [Google Scholar]
- Liu, E.; Lu, X.; Wang, D. A Systematic Review of Carbon Capture, Utilization and Storage: Status, Progress and Challenges. Energies 2023, 16, 2865. [Google Scholar] [CrossRef]
- Ma, Y.; Wang, H.; Hong, F.; Yang, J.; Chen, Z.; Cui, H.; Feng, J. Modeling and optimization of combined heat and power with power-to-gas and carbon capture system in integrated energy system. Energy 2021, 236, 121392. [Google Scholar] [CrossRef]
- Chen, M.; Lu, H.; Zheng, C. An integrated energy system optimization model coupled with power-to-gas and carbon capture. In Proceedings of the 2022 International Conference on Renewable Energies and Smart Technologies (REST), Tirana, Albania, 28–29 July 2022; Volume 1, pp. 1–5. [Google Scholar]
- Mazza, A.; Bompard, E.; Chicco, G. Applications of power to gas technologies in emerging electrical systems. Renew. Sustain. Energy Rev. 2018, 92, 794–806. [Google Scholar] [CrossRef]
- Alizad, E.; Rastegar, H.; Hasanzad, F. Dynamic planning of Power-to-Gas integrated energy hub considering demand response programs and future market conditions. Int. J. Electr. Power Energy Syst. 2022, 143, e108503. [Google Scholar] [CrossRef]
- Zhang, X.; Zhang, Y. Environment-friendly and economical scheduling optimization for integrated energy system considering power-to-gas technology and carbon capture power plant. J. Clean. Prod. 2020, 276, 123348. [Google Scholar] [CrossRef]
- Chen, M.; Lu, H.; Chang, X.; Liao, H. An optimization on an integrated energy system of combined heat and power, carbon capture system and power to gas by considering flexible load. Energy 2023, 273, e127203. [Google Scholar] [CrossRef]
- Ren, Z.Y.; Luo, X.; Qin, H.L.; Jiang, Y.P.; Yang, Z.X. Mid/long-term optimal operation of regional integrated energy systems considering hydrogen physical characteristics. Power Syst. Technol. 2022, 46, 3324–3332. [Google Scholar]
- Tao, Y.; Qiu, J.; Lai, S.; Zhao, J. Integrated Electricity and Hydrogen Energy Sharing in Coupled Energy Systems. IEEE Trans. Smart Grid 2020, 12, 1149–1162. [Google Scholar] [CrossRef]
- Ozturk, M.; Dincer, I. Development of renewable energy system integrated with hydrogen and natural gas subsystems for cleaner combustion. J. Nat. Gas Sci. Eng. 2020, 83, 103583. [Google Scholar] [CrossRef]
- Martinez-Frias, J.; Pham, A.-Q.; Aceves, S.M. A natural gas-assisted steam electrolyzer for high-efficiency production of hydrogen. Int. J. Hydrogen Energy 2003, 28, 483–490. [Google Scholar] [CrossRef]
- Wang, Y.; Liu, C.; Qin, Y.; Wang, Y.; Dong, H.; Ma, Z.; Lin, Y. Synergistic planning of an integrated energy system containing hydrogen storage with the coupled use of electric-thermal energy. Int. J. Hydrogen Energy 2023, 48, 15154–15178. [Google Scholar] [CrossRef]
- Li, Y.; Wang, R.; Zhao, Q.; Xue, Z. Technological advancement and industrialization path of Sinopec in carbon capture, utilization and storage, China. Energy Geosci. 2022, 5, 100107. [Google Scholar] [CrossRef]
- Varela, C.; Mostafa, M.; Zondervan, E. Modeling alkaline water electrolysis for power-to-x applications: A scheduling approach. Int. J. Hydrogen Energy 2021, 46, 9303–9313. [Google Scholar] [CrossRef]
- Deng, J.; Jiang, F.; Wang, W.; He, G.; Zhang, X.; Liu, K. Lowcarbon Optimized Operation of Integrated Energy System Considering Electric-heat Flexible Load and Hydrogen Energy Refined Modeling. Power Syst. Technol. 2022, 46, 1692–1704. [Google Scholar]
- Oyedepo, S.O.; Fakeye, B.A. Waste heat recovery technologies: Pathway to sustainable energy development. J. Therm. Eng. 2021, 7, 324–348. [Google Scholar] [CrossRef]
- Schaaf, T.; Grünig, J.; Schuster, M.R.; Rothenfluh, T.; Orth, A. Methanation of CO2–storage of renewable energy in a gas distribution system. Energy Sustain. Soc. 2014, 4, 2. [Google Scholar] [CrossRef]
- Li, Z.; Zhang, W.; Zhang, R.; Sun, H. Development of renewable energy multi-energy complementary hydrogen energy system (A Case Study in China): A review. Energy Explor. Exploit. 2020, 38, 2099–2127. [Google Scholar] [CrossRef]
- Zhang, X.; Zhang, Y. Multi-objective optimization of integrated power-thermal-gas energy system at campus level with P2G and CCS. Electr. Power Constr. 2020, 41, 90–99. [Google Scholar]
- Li, W.; Jia, Z. The impact of emission trading scheme and the ratio of free quota: A dynamic recursive CGE model in China. Appl. Energy 2016, 174, 1–14. [Google Scholar] [CrossRef]
- Liu, L.; Chen, C.; Zhao, Y.; Zhao, E. China’ s carbon-emissions trading: Overview, challenges and future. Renew. Sustain. Energy Rev. 2015, 49, 254–266. [Google Scholar] [CrossRef]
- Chen, J.; Hu, Z.; Chen, Y.; Chen, W. Thermoelectric optimization of integrated energy system considering stepwise carbon trading mechanism and electricity hydrogen production. Electr. Power Autom. Equip. 2021, 41, 48–55. [Google Scholar]


| Parameters | Values | Parameters | Values |
|---|---|---|---|
| 0 | 600 kW | ||
| 0.2 | 0.5 | ||
| 2.1 | 0.87 | ||
| 0 | 500 kW | ||
| 0 | 250 kW | ||
| 0.6 | 0 | ||
| 250 kW | 0.5 | ||
| 2.1 | 0.95 | ||
| 0 | 800 kW | ||
| 0.95 | 450 kW | ||
| 500 kW | 150 kW | ||
| 200 kW | 45 kW | ||
| 405 kW | 50 kW | ||
| 450 kW | 15 kW | ||
| 135 kW | 20 kW | ||
| 180 kW | 1.02 (kg/kWh) | ||
| 0.5 (kWh/kg) | 0.89 (kg/kWh) | ||
| 0.0017 (kg/kWh) | 26.15 (kg/kWh) | ||
| 0.728 (kg/kWh) | 0.798 (kg/kWh) | ||
| 0.798 (kg/kWh) | 3.672 (kg/kWh) | ||
| 3.672 (kg/kWh) | 30 (kg/kWh) | ||
| −0.38 (kg/kWh) | 0.0034 (kg/kWh) | ||
| 3 (kg/kWh) | −0.004 (kg/kWh) | ||
| 0.001 (kg/kWh) | 53 (RMB/t) | ||
| 0.1 (RMB/kWh) | 0.04 (RMB/kWh) | ||
| 0.5 (RMB/kWh) | 1.4 (RMB/kWh) | ||
| 0.1 (RMB/kWh) | 0.1 (RMB/kWh) | ||
| 0.1 (RMB/kWh) | 0.1 (RMB/kWh) |
| Cases | Conditions |
|---|---|
| Case 1 | An IES without electric and gas coupling equipment. |
| Case 2 | An IES with P2G in the traditional mode. |
| Case 3 | An IES with an EL, MR, and HFC coupling operation. |
| Indices | Case 1 | Case 2 | Case 3 |
|---|---|---|---|
| CO2 emissions (kg) | 12,861.64 | 11,263.23 | 1426.41 |
| Carbon transaction costs (RMB) | 678.84 | 595.68 | 75.29 |
| Wind power accommodation | 92.34% | 96.57% | 100% |
| PV power accommodation | 94.18% | 96.16% | 100% |
| Cost (RMB) | 14,322.43 | 13,617.34 | 10,093.00 |
| Subsystems | Case 1 | Case 2 | Case 3 |
|---|---|---|---|
| CO2 (kg) | CO2 (kg) | CO2 (kg) | |
| PV | −5128.70 | −5229.80 | −5377.50 |
| Wind | −6351.90 | −6650.10 | −6808.60 |
| CHP | +24,966.47 | +23,975.09 | +19,042.61 |
| GB | −2206.97 | −2175.86 | −893.16 |
| CCS | −186.23 | −4055.33 |
| Economic Analysis | Case 1 | Case 2 | Case 3 |
|---|---|---|---|
| Carbon transaction costs (RMB) | −678.84 | −595.68 | −75.29 |
| Gas purchasing cost (RMB) | −9418.13 | −9065.70 | −4818.70 |
| Electricity purchasing cost (RMB) | −3259.04 | −3384.70 | −5032.71 |
| Penalty Cost (RMB) | −1214.51 | −446.29 | 0 |
| Energy storage cost (RMB) | −119.84 | −125.80 | −166.30 |
Disclaimer/Publisher’s Note: The statements, opinions and data contained in all publications are solely those of the individual author(s) and contributor(s) and not of MDPI and/or the editor(s). MDPI and/or the editor(s) disclaim responsibility for any injury to people or property resulting from any ideas, methods, instructions or products referred to in the content. |
© 2024 by the authors. Licensee MDPI, Basel, Switzerland. This article is an open access article distributed under the terms and conditions of the Creative Commons Attribution (CC BY) license (https://creativecommons.org/licenses/by/4.0/).
Share and Cite
Li, X.; Wang, B.; Pan, D.; Yu, X.; Che, Y.; Lei, Q.; Yang, L.; Wang, B.; Lu, H. Optimization of Integrated Energy System Considering Electricity and Hydrogen Coordination in the Context of Carbon Trading. Processes 2024, 12, 873. https://0-doi-org.brum.beds.ac.uk/10.3390/pr12050873
Li X, Wang B, Pan D, Yu X, Che Y, Lei Q, Yang L, Wang B, Lu H. Optimization of Integrated Energy System Considering Electricity and Hydrogen Coordination in the Context of Carbon Trading. Processes. 2024; 12(5):873. https://0-doi-org.brum.beds.ac.uk/10.3390/pr12050873
Chicago/Turabian StyleLi, Xiaofeng, Bing Wang, Duoyu Pan, Xiong Yu, Yanling Che, Qianye Lei, Lijia Yang, Baofeng Wang, and Hao Lu. 2024. "Optimization of Integrated Energy System Considering Electricity and Hydrogen Coordination in the Context of Carbon Trading" Processes 12, no. 5: 873. https://0-doi-org.brum.beds.ac.uk/10.3390/pr12050873