1. Introduction
Propylene glycol methyl ether acetate (PGMEA), also known as PMA or methoxy propyl acetate, serves as a vital solvent with diverse applications across several industries. Its use ranges from electronic chemicals in semiconductor manufacturing to ultra-high purity applications [
1], ultra-low acidity [
2,
3], and reduced toxicity compared to ethylene glycol-based products [
4]. PGMEA is also used as a solvent in paints, inks, dyes, cleaning agents, and photoresists, making it a preferred choice due to its low toxicity profile and minimal particle formation. Notably, PGMEA is a key component in various coating formulations [
5]. PGMEA synthesis primarily involves the esterification reaction of propylene glycol methyl ether (PGME or methoxy propanol) with acetic acid (AA). However, this process encounters challenges due to chemical equilibrium limitations, resulting in low PGME conversion rates. The synthesis reaction is represented by the following equilibrium equation:
where
and
denote the forward and reverse reaction rate constants, respectively, and A through D are PGME, AA, PGMEA, and water, respectively. As an equilibrium reaction, it necessitates the use of an acidic catalyst to facilitate the reaction kinetics.
Homogeneous catalysts, such as sulfuric acid and hydrofluoric acid, have long been favored for their high catalytic activity and selectivity in various chemical reactions. However, their use comes with drawbacks, challenges in catalyst separation, process complexity, and corrosion issues. In contrast, heterogeneous acidic catalysts have emerged as promising alternatives due to their high catalytic activity, low corrosivity, and ease of separation [
6,
7]. Solid acids, in particular, have gained traction across a spectrum of chemical reactions, including esterification [
8,
9], alkanes isomerization [
10], aldol condensation [
11] and ketal reaction [
12]. Their utility lies in their ability to enhance kinetics inherent in esterification reactions. Recent studies have introduced innovative methods, such as reactive distillation (RD) and pressure swing techniques, aimed at improving energy efficiency and reducing production costs in PGMEA synthesis [
13,
14]. The RD reaction process, comprising a transesterification reaction coupled with a distillation column for azeotrope separation and energy optimization, offers a viable solution to enhance the efficiency of esterification processes [
4,
15].
Furthermore, the availability of heterogeneous catalysts enables the production of less-acidic electronic-grade PGMEA, contributing to the enhancement of product quality [
2,
3,
4]. Amberlyst
® 15 (Amberlyst-15) is a widely used catalyst in various chemical processes, renowned for its excellent physical, thermal, and chemical stability [
16]. Available in bead form, Amberlyst-15 is insoluble in water, making it suitable for non-aqueous catalysis—a crucial aspect, particularly in reactions where water is a byproduct and catalyst dissolution is undesirable. On the other hand, this catalyst can dissolve or swell in other types of liquid. For example, Amberlryst-15 will swell in acetone, so this catalyst should be used in reactions where the environment is favorable for the catalyst. Its proven stability in harsh environments, including acidic conditions, makes it an attractive option for catalytic reactions. Despite its established stability and compatibility, only limited studies have explored the use of Amberlyst-15 in synthesizing PGMEA. Further investigation into its catalytic performance in PGMEA synthesis could unveil its potential benefits.
Oh et al. [
17] conducted PGMEA synthesis with Amberlyst-15 catalyst using a batch system, exploring various [PGME]:[AA] ratios and temperatures to determine reaction kinetics. Subsequently, they applied these findings to design and operate reactive distillation processes. Despite observing two reaction sites inside the column with larger injection volumes, their study achieved nearly 100% conversion at lower flow rates and smaller injection volumes. However, the batch system model fitting was not sufficiently robust, warranting further clarification of parameter determination methods. Gadekar-Shinde et al. [
4] proposed an RD process for PGMEA production, exploring reaction rates at different temperatures and reactant mole ratios. They introduced toluene as an entrainer to enhance product purity without compromising catalyst stability, presenting a more compact and cost-effective process. Agrawal et al. [
2] optimized a simulated moving bed reactor (SMBR) for PGMEA synthesis using Amberlyst-15. Their model revealed that increased AA conversion negatively impacted PGMEA production rates, emphasizing the importance of process operation for high PGMEA recovery and reduced downstream separation costs. Utilizing kinetic model parameters from previous studies, they optimized the SMBR, observing similar phenomena of two reaction sites and enhanced conversion beyond equilibrium in chromatograph reactors.
Huang et al. [
18] investigated the synthesis of PGMEA using a solid acidic catalyst (SO
42−/TiO
2) and optimized its preparation. Their study demonstrated the catalyst’s high stability and consistent performance. Oh et al. [
3] and Wang et al. [
15] explored PGMEA synthesis via transesterification reactions using different catalysts, observing varying conversion rates and catalyst deactivation. Wang et al. [
15] utilized kinetic data to design and operate RD systems while Oh et al. [
3] investigated the synthesis of PGMEA using ethyl acetate instead of acetic acid as a precursor. Fan et al. [
13] investigated PGMEA synthesis via transesterification of methyl acetate and PGME using an RD process. They provided transesterification kinetics and thermodynamic parameters, validating the reaction feasibility experimentally in a batch RD column.
In this study, we utilized Amberlyst-15, with the aim of determining its reaction kinetics and investigating its applicability in continuous processes based on the kinetics. The catalyst was used in its commercially available form without any additional chemical treatment, mirroring common industrial practices. Our experimental approach involved studying the reaction kinetics of the process described in Equation (1) across a range of temperatures (60 to 100 °C) using a 1:1 ratio of PGME to AA and a fixed amount of Amberlyst-15 in a batch system. We developed an integrated reaction rate model, which was not available in previous studies, and extracted kinetic model parameters, including Arrhenius parameters, from the experimental data. Subsequently, we conducted additional experiments with different PGME to AA ratios and varied amounts of Amberlyst-15, comparing the resulting data with model predictions based on the earlier determined kinetic parameters. To account for the influence of catalyst amount on the reaction rate constant, we scaled the kinetic parameters using two distinct methods of expressing catalyst amount and showed which method is better. Finally, we employed the determined kinetic parameters to simulate the behavior of a plug flow reactor, informing the design process for reactor systems in potential industrial applications. Our study provides insights into the reaction kinetics of the PGME and AA synthesis process and highlights the potential utility of Amberlyst-15 as a catalyst in industrial settings. The novel features of this study are providing kinetic parameters with an explicit reaction equation, which are readily usable for designing reaction systems for PGMEA and suggesting the method to scale the amount of catalyst for better model predictions. Future research directions may involve further validation of the proposed kinetic model and exploration of alternative catalyst formulations for enhanced reaction efficiency.
2. Materials and Methods
All materials used were of laboratory reagent grade and employed without further purification. PGMEA (>99.5%), PGME (>99.5%), AA (>99.7%), and methanol (>99.9%) were procured from Sigma-Aldrich (St. Louis, MO, USA). The solid catalyst, Amberlyst® 15 hydrogen form (Amberlyst-15), was also obtained from Sigma-Aldrich (St. Louis, MO, USA). Helium (>99.999%) was supplied by Deokyang (Ulsan, Republic of Korea), and nitrogen (>99.8%) was provided by Air Products (Pyeongtaek, Republic of Korea).
Figure 1 illustrates the batch reaction system utilized to determine the reaction kinetics. The round-bottom flask has a 2 L volume with a 3-neck apparatus including a reflux condenser, heater, and magnetic stirrer. It also features a temperature controller and a sampling port, through which sampling took place regularly using a syringe with a needle. To minimize the loss of reactants and products during experiments, chilled water at 5 °C was circulated through the reflux condenser. We took a specified mass of each reactant, AA and PGME, to achieve a desired reactant ratio, along with approximately a 1 kg total mass. Each component was then introduced into the batch reactor accordingly. The ratio of the reactants varied for different tests. The reactor’s temperature was controlled to one of five predetermined temperatures: 60, 70, 80, 90, or 100 °C. Upon reaching the designated reaction temperature, a desired amount of catalyst was added to initiate the reaction. Stirring of the reaction mixture at 300 rpm commenced immediately after catalyst addition, with the stirring speed chosen based on previous studies indicating its minimal impact on reaction kinetics, especially the concentration of PGMEA [
17]. Samples were extracted from the reactor at specified time intervals to monitor the reaction progress. It was assumed that the reaction ceased in the sample due to the absence of catalyst. Gas chromatography (GC) analysis using a Varian CP3800 (Palo Alto, CA, USA) equipped with a flame ionization detector (FID) was employed to determine the composition of each sample. The GC conditions, summarized in
Table 1, included parameters such as column temperature, injection volume, and carrier gas flow rate. Before conducting the experiment, an external calibration was conducted using the same chemicals (AA, PGME, and PGMEA) with known concentrations. The resulting calibration curve was utilized to determine the concentrations of these chemicals during the experiments. No internal standard was employed. An example of chromatogram is shown in the
Supplementary Materials.
We conducted simulations using Aspen Plus 2006.5, employing a reactor model of RPLUG. Our aim was to design a plug flow reactor (PFR) by integrating kinetic parameters obtained from the batch system experiments performed in this investigation. The simulations were carried out at a temperature of 90 °C, with the bed porosity and density of the catalyst particles set at 0.3 and 0.5 g/cc, respectively. The reactor dimensions were specified with a diameter of 0.1 m and a length of 1.5 m. The flowsheet and conditions are detailed in the
Supplementary Materials. Accordingly, a PFR system (
Figure 2) was constructed, comprising a PFR reactor with dimensions of 0.1 m in diameter and 1.5 m in length. We replicated identical operational conditions to those used in the simulation to obtain the mole fractions of PGME and PGMEA at two sampling locations along the PFR: 0.5 m and 1.5 m (i.e., outlet) to compare the simulation and experimental results.
3. Kinetic Modeling
Activity coefficients, often estimated using UNIQUAC or UNIFAC methods, are utilized to correct for deviations from ideal behavior [
19,
20,
21]. For instance, Pöpken et al. [
22] demonstrated that utilizing activities obtained from UNIQUAC calculations, rather than mole fractions, provided a better representation of experimental values in the synthesis of methyl acetate using Amberlyst-15. Despite the prevalence of activity-based models, kinetic models frequently rely on concentrations rather than activities [
23,
24,
25,
26]. In our study, we adopted liquid concentrations (i.e., mole fractions) in the development of our kinetic model for simplicity, with a discussion of its predictive capabilities to follow.
We employed a pseudo-homogeneous model [
22], assuming the ion-exchange resin serves as a source of solvated protons. The differential molar balance governing the formation of PGMEA can be expressed as a second-order kinetic model, representing a first-order reaction with respect to each component. For our reversible reaction system, the reaction rate is modeled as
where [i] (mol/L) is the concentration of a component i, (A, B, C, or D), as a function of time, and subscripts 1 and 2 denote forward and reverse reactions, respectively. The forward and reverse reaction rate constants,
and
, are expressed in units of L/(mol min). The concentration of each component in the reaction system was determined at 20 °C within the total volume of all components, which amounted to 1034 mL. The equilibrium constant,
, is defined as the ratio of the forward and reverse reaction rate constants at equilibrium and can be expressed as
where the subscript
denotes equilibrium.
For the general case of
, we can derive the integrated rate equation for Equation (1), i.e., the concentration of a component at a certain time during the reaction
where
z,
a, and
b are defined as
where
and
are the initial concentrations of components A and B, respectively. Then, the concentration of the other components at a certain time can be modeled as follows:
We used and and measured and to calculate , , and with an initial guess of and eventually to obtain model (Equation (4)). Using the least square method to minimize the sum of squared error, which is the difference between model and data was obtained (and naturally as well).
For the case of
, while Equations (4) and (5) can be used as those are, Equations (6) and (7) simplify to
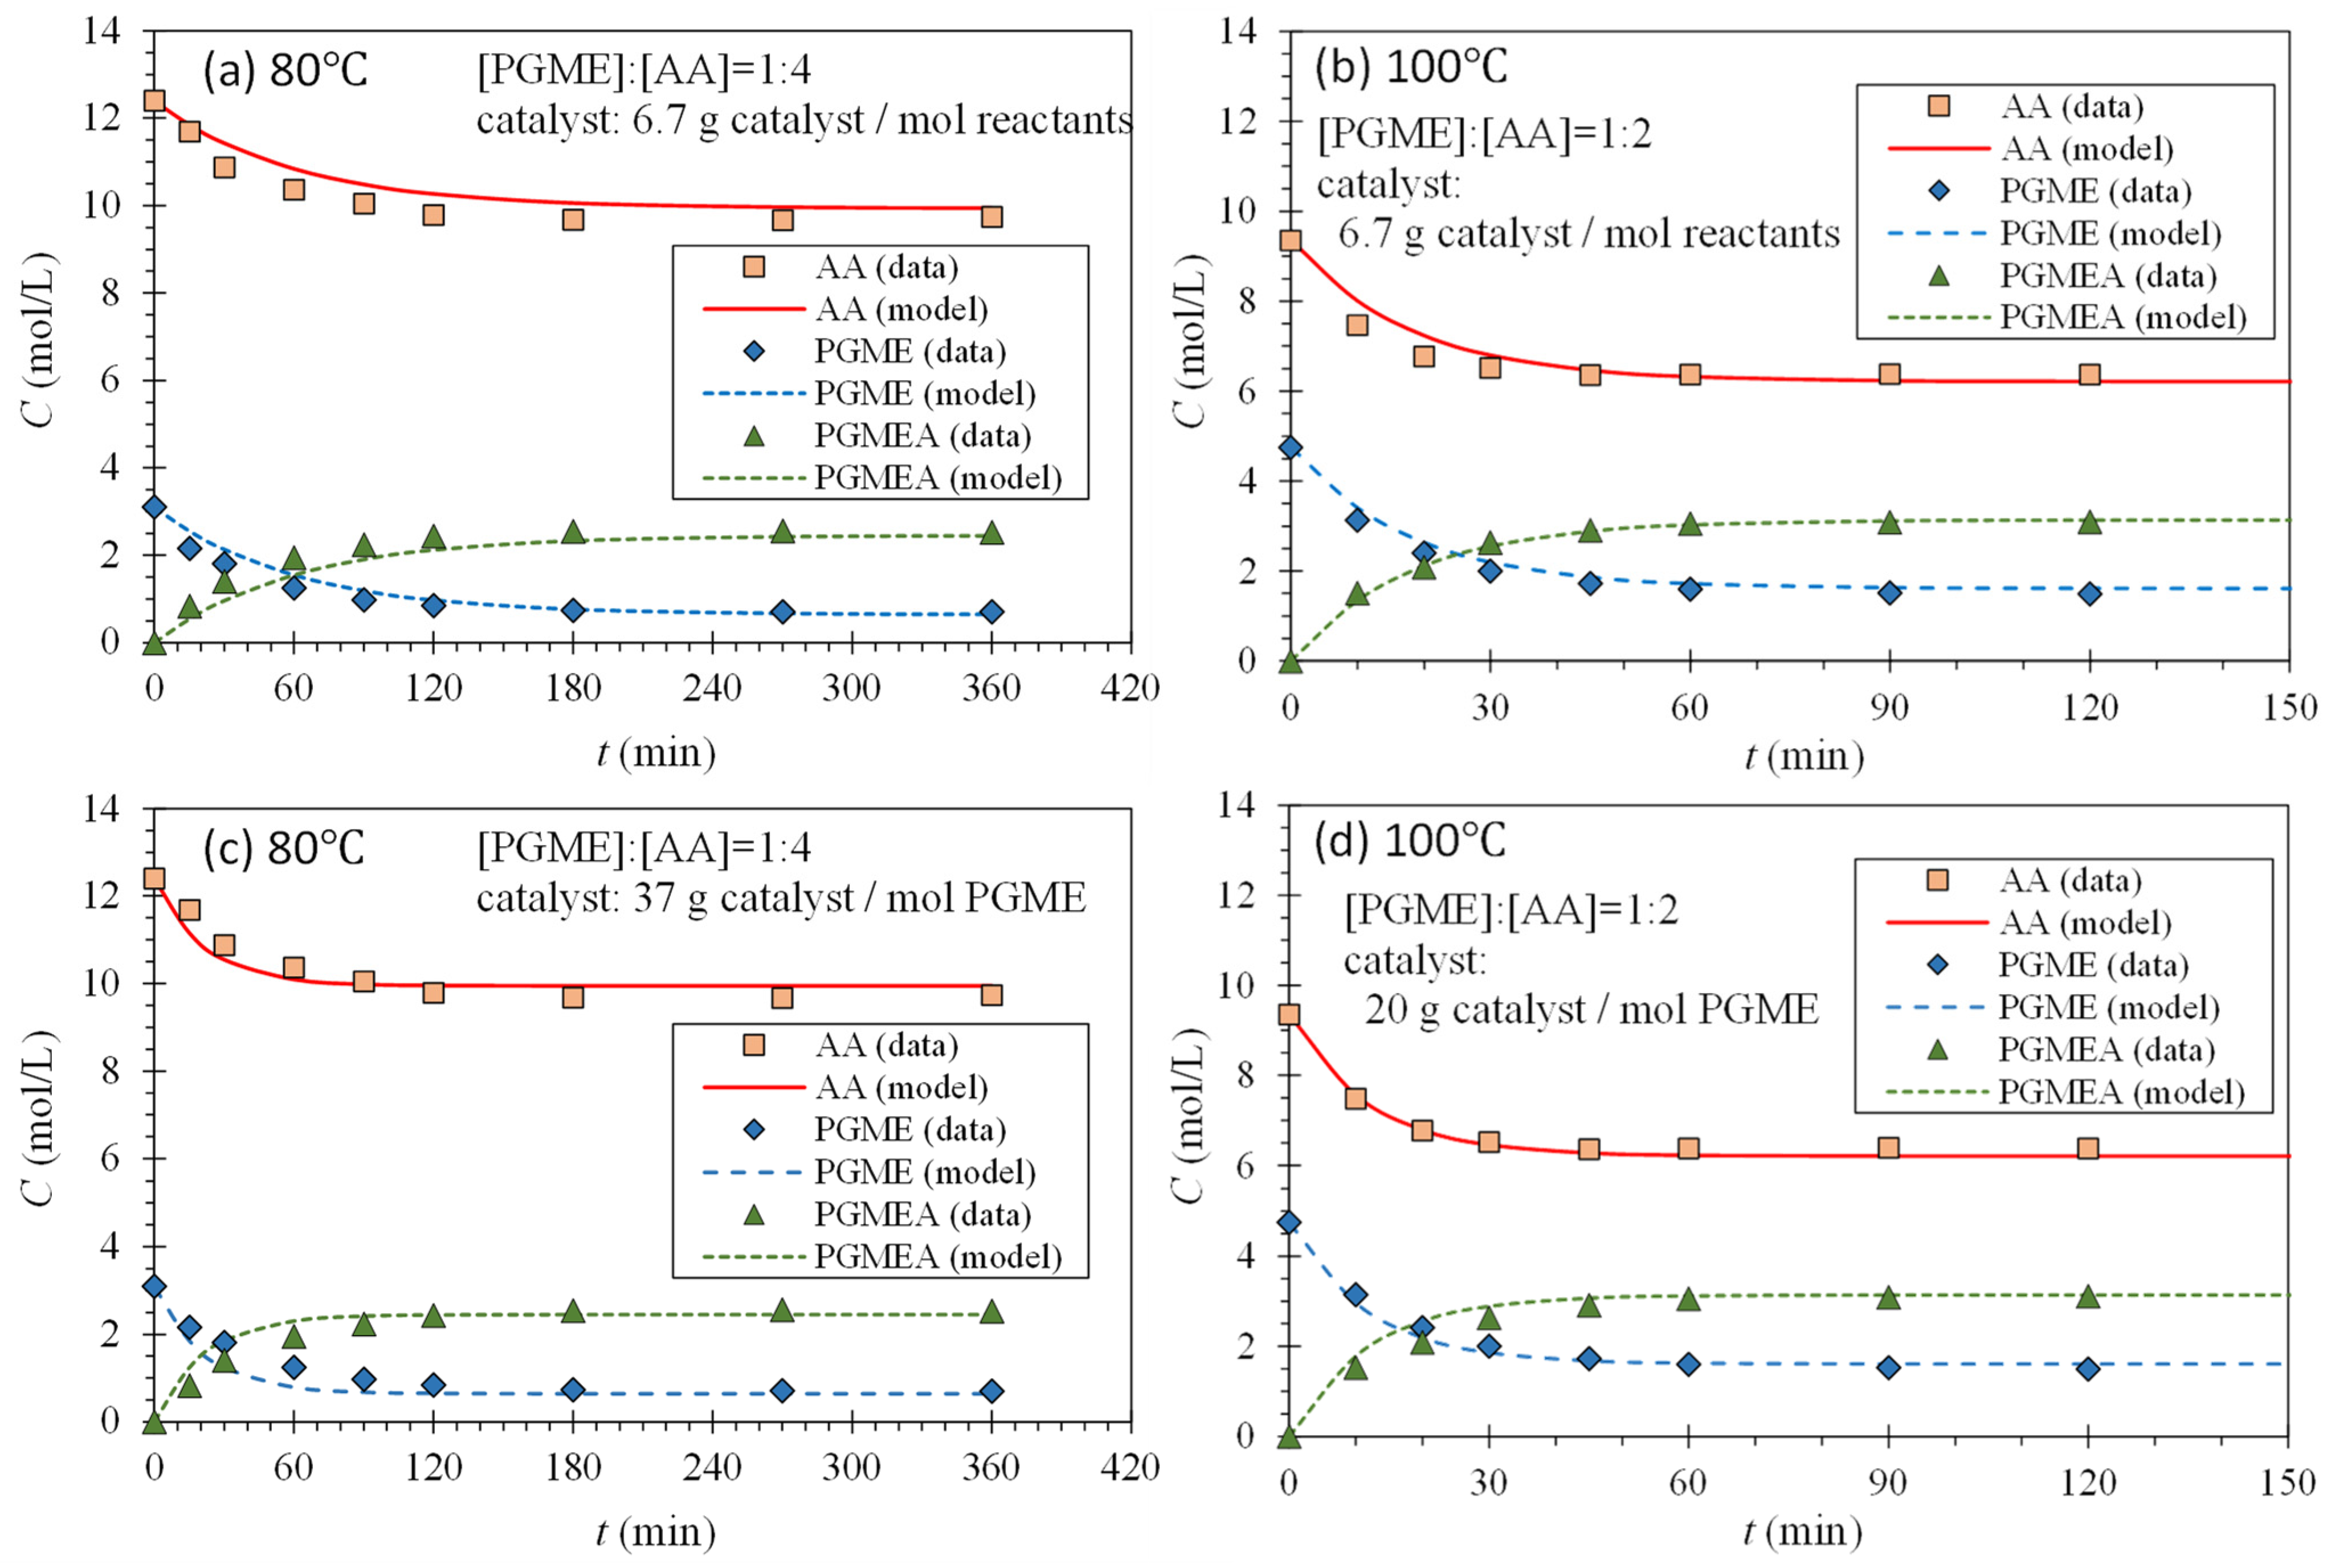
Equations (3) through (5) and (8) through (11) were utilized to determine the reaction rate constants by fitting experimental data obtained with a reactants’ mole ratio of 1:1 at various temperatures to the model represented by Equation (4). This fitting assumed a pseudo-homogeneous reaction. Subsequently, the same reaction rate constants and Equations (3) through (9) were employed to forecast the reaction kinetics with a reactants’ mole ratio other than 1:1, thereby validating the previously determined reaction rate constants.
The scaled forward and reverse reaction rate constants are expressed in units of L mol-PGME/(mol min g-catalyst). These constants are calculated using the following equations:
where
in g-catalyst/mol-reactant is the catalyst amount relative to the number of moles of reactant (either total or limiting reactant). The scaled reaction rate constants
and
should remain unchanged regardless of the specific amount of catalyst utilized in the reaction system. As long as the reactant amount is used consistently, whether it is divided by the total amount of all the reactants or the amount of the limiting reactant, these constants can be universally applied across different catalyst amounts without alteration. For reactions involving a different amount of catalyst, the prediction can be made using Equation (4) with the following updated reaction rate constants:
where
in g-catalyst/mol-reactant is the new amount of catalyst different from that used in this study,
in L/(mol min) represents the new forward reaction rate constant for the catalyst amount, and
in L mol-PGME/(mol min g-catalyst) is the scaled forward reaction rate constant determined in this study. The new reverse reaction rate constant can be obtained by
where
is the equilibrium constant obtained in the reaction with the catalyst amount,
. Thus, Equation (4) should be reduced to the following universal equation:
Again, Equations (5) through (9) and (16) were employed to forecast the reaction kinetics with catalyst amounts different from what used to determine and , thereby validating the previously determined reaction rate constants.
The effect of temperature on the reaction rate constants can be described by the Arrhenius equation:
where
and
represent the activation energies for the forward and reverse reactions, respectively,
is the gas constant, equal to 8.31446 J/(mol K),
and
in L/(mol min) are the pre-exponential factors for the forward and reverse reaction rate constants, respectively, and
and
in L mol-PGME/(mol min g-catalyst) are the pre-exponential factors for the scaled forward and reverse reaction rate constants, respectively, as follows:
5. Conclusions
Through our study, we conducted the synthesis of PGMEA using AA and PGME alongside a commercially available catalyst, Amberlyst-15. This endeavor aimed to elucidate the critical parameters governing reaction kinetics, alongside the development of an integrated kinetic model. These aspects are both novel and indispensable in the design of other types of reactors. Successfully modeling the reaction kinetics across various temperatures with a 1:1 reactant ratio, we employed an integrated second-order reversible reaction equation along with the Arrhenius model. This approach allowed for the natural determination of kinetic and Arrhenius parameters, pivotal for understanding reaction dynamics. Utilizing these parameters, we extended our analysis to predict reaction kinetics for scenarios involving different reactant ratios and catalyst amounts. Notably, our predictions aligned well with experimental data, particularly when the catalyst amount was scaled by the amount of PGME, the limiting reactant, rather than that of all the reactants. Interestingly, while the activation energy for the forward reaction mirrored findings from other studies, that of the reverse reaction displayed notable disparities.
Our proposed reaction rate model, coupled with the obtained model parameters, holds significant promise for reactor design and kinetics prediction. For instance, leveraging these insights, we conducted simulations of a plug flow reactor and constructed a PFR system based on the simulation results, showcasing its potential to optimize reactor design while considering variables such as energy cost and manufacturing expenses. In essence, our study contributes to the broader understanding of reaction kinetics and underscores its practical implications in reactor design and optimization.


