1. Introduction
The hydraulic sliding valve is one of the fundamental components within hydraulic systems, playing a key role in improving the performance of high-reliability hydraulic pumps and valves [
1]. The sliding valve, being the most commonly used valve structure in hydraulic control valves, relies on the flexible movement of the valve core to ensure its functionality [
2]. Servo valves, proportional valves, directional flow control valves, and control valves in variable pumps with sliding valve structures often experience sticking, which reduces the reliability of hydraulic systems. A micro-level understanding of the mechanism of valve contamination-induced sticking is crucial for the design and manufacture of high-reliability control valves [
3].
The clearance between the valve core and the valve body in sliding valves typically ranges from 3 to 20 μm [
4]. The solid pollutant particles in the working medium of hydraulic systems come in varying sizes. When appropriately sized particles find their way into the sliding valve clearance, they can cause the valve core to stick, affecting its flexible movement and, in severe cases, leading to the failure of the sliding valve’s control function [
5,
6,
7].
In response to hydraulic valve failure caused by contaminant particles in the hydraulic fluid, the Fluid Power Research Center (FPRC) at Oklahoma State University conducted early systematic studies. These experiments confirmed that different types of hydraulic valves are prone to failure due to particle interference. They summarized three failure modes: jamming, friction, and blockage, and introduced the concept of “sensitive size” for solid particles [
8,
9,
10,
11,
12]. FRITH [
13] provided an overview of the research related to failure issues involving hydraulic components caused by particle pollution from 1969 to 1992, explaining some classic models of particle pollution filtration. Liu Zhiqiang [
14] and Zhou Zheng [
15] established corresponding models of the jamming force of small particles in sliding valve clearances and explored the relationship between jamming force and valve structural parameters, explaining the mechanism of solid particle sticking in sliding valves. FAN [
7] designed a device for measuring the frictional force of contaminated hydraulic oil on the sliding valve core, analyzing the effects of pollutant particle content and particle size on the frictional force of valve core movement through experiments. Ji [
16] and Yuan [
17] discovered the rotational motion of particles in sliding valve clearance through numerical calculations and analyzed the movement of individual particles in the clearance and pressure equalization groove using model-based visual experiments. Chen [
18] modeled and analyzed the thermal deformation of the slide valve using COMSOL Multiphysics field coupling software. It was shown that at high temperatures, the heat of the slide valve is concentrated in the throttle groove and other regions of high-velocity gradient, leading to the expansion and deformation of these regions. In particular, the deformed homogeneous groove clearance becomes an area prone to solid particle accumulation. An analysis conducted by Lin [
19] et al. using the Euler–Euler solid–liquid two-phase flow model further detailed the flow characteristics within the valve and its interaction with particle behavior. It was found that the particles were unevenly distributed in the valve clearance, especially in the region of the homogeneous groove where the particle concentration was highest and the peak of the hysteresis force rose as the particle diameter increased. In particular, the spool hysteresis force reaches its maximum when the particle diameter is 12 μm.
Despite the analysis of the relevant publicly available literature, no reports were found on the transient process and regularity of micrometer-sensitive pollutant particle intrusion into sliding valve clearances. However, research on this type of problem relates directly to further enhancing the performance of sliding valves.
This paper presents a numerical method that applies fluid field and particle one-way coupling to calculate the motion trajectories of micrometer-sized spherical solid particles in the hydraulic fluid of sliding valve chambers. The study determines, under different valve opening and pressure differential conditions in steady-state flow, the trajectories of micrometer-sized solid particle groups released from various locations driven by fluid flow, as well as the number of particles intruding into the sliding valve clearance. Additionally, visual experiments using high-speed photography analyze particle motion within an enlarged clearance sliding valve chamber model, thus revealing the instantaneous phenomenon and regularity of micrometer-sized particle intrusion into the sliding valve clearance. This research is of significant importance for understanding the transient behavior of pollutant particle intrusion into sliding valve clearances and the microscopic mechanism of valve sticking.
2. Method and Verification
2.1. Research Methods
Figure 1 shows a schematic diagram of the hydraulic sliding valve. P represents the high-pressure port, A represents the load port, and T represents the return port. Between the inlet P and the load port A lies the sliding valve orifice. Depending on the functionality and operational state changes in the sliding valve, the opening size of the sliding valve orifice (i.e., the axial distance between the valve body throttle edge and the valve core throttle edge) varies within the range of a few micrometers to several millimeters. The radius of the valve core–valve sleeve clearance is generally within the range of a few micrometers to several tens of micrometers. The pollutant particles in the hydraulic fluid range from a few micrometers to several tens of micrometers. Therefore, the motion of particles in the sliding valve chamber presents a multiscale flow field problem.
This study employs visual experimental observations and computational fluid dynamics (CFD) methods to investigate the movement characteristics of contaminant particles in the sliding valve chamber and clearance clearances. Visual experiments for flow field visualization in the valve chamber primarily rely on high-speed cameras to capture flow characteristics. However, due to memory limitations, data can only be stored for a few hundred milliseconds, and under constraints on the depth of field of high-speed cameras, the captured thickness of the flow field is less than 2 mm. When studying the three-dimensional cross-scale flow fields and particle movement in the sliding valve using numerical methods, the grid scale for the main flow passage of the valve chamber ranges from tens to hundreds of micrometers, and the maximum grid scale in the clearance clearance is less than 1 micron. Smooth transition of the grid scale requires at least tens of millions of grids, making the calculation complex and difficult to converge. Considering both experimental and simulation conditions, a reasonable simplification of the actual model is performed within the two-dimensional sectional flow field outlined by the red box in
Figure 1.
In our simplified model, the valve core–valve sleeve clearance is set at 20 microns. Capturing micrometer-sized particle movement in extremely small clearances requires the use of a microscope lens. However, the maximum observation area diameter with a microscope lens is limited to 3 mm. Observing the main flow passage and the clearance clearance simultaneously presents challenges. Thus, during experimental observations, the clearance clearance size was enlarged to 1 mm while keeping the dimensions of the main flow passage unchanged, allowing for an enlarged clearance model. Given the poor visibility of hydraulic oil, and pure water offering better transparency, the main difference between water and hydraulic oil lies in viscosity. Viscous resistance weakens particle movement speed without significantly altering its trajectory. Therefore, pure water was used as the experimental medium to study the movement characteristics of solid particles intruding into the clearances.
Following the observation of particle movement characteristics, comparison and analysis were conducted against equivalent-scale numerical models to validate the feasibility of the numerical methods. Subsequently, the model scale was restored, and simulation calculations of particle motion in a fluid medium (hydraulic oil) were conducted, revealing the particle movement characteristics within the sliding valve chamber with original dimensions (clearance clearance size is 20 µm).
2.2. Model and System
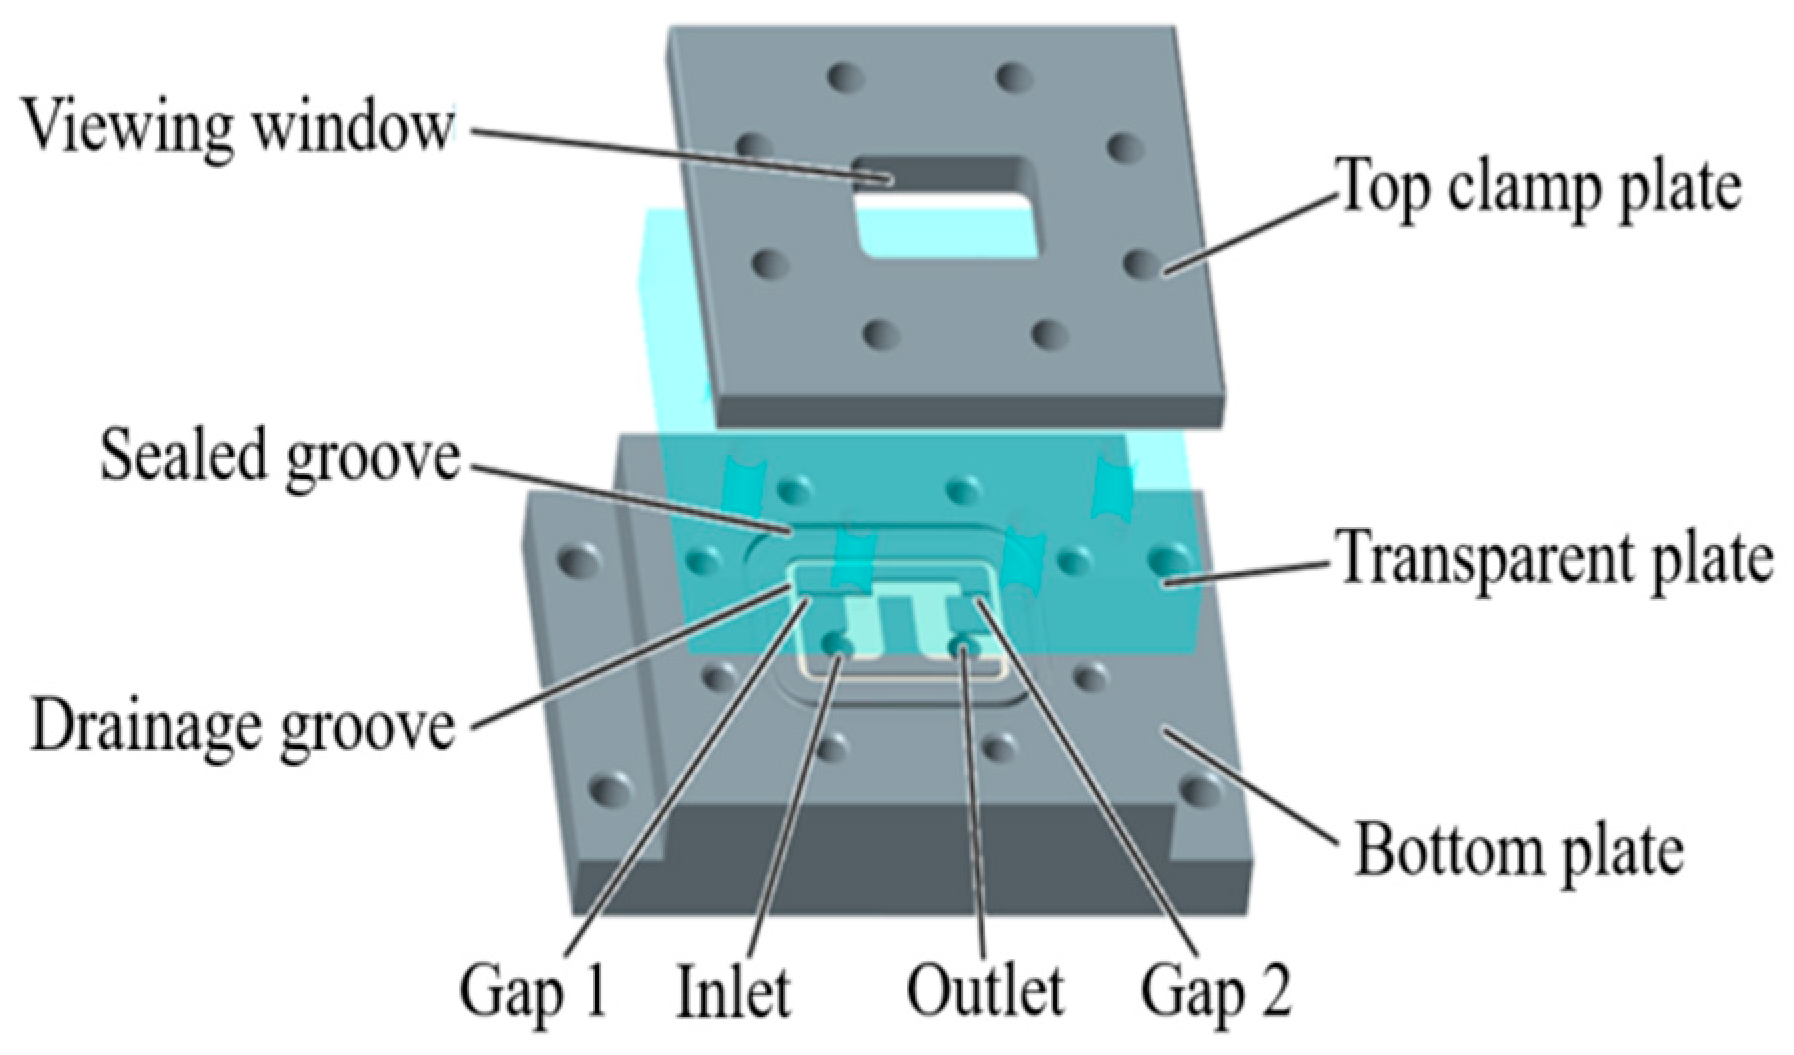
The three-dimensional experimental model construction is depicted in
Figure 2. This model consists of three layers.
The first layer is a steel base plate, milled with main channel grooves, drainage grooves, and sealing grooves and equipped with threaded connection ports for the working medium inlet and outlet. The second layer is an acrylic glass plate designed for observing the flow and particle movement within the channel grooves. The third layer is an upper pressure plate with observation windows and reinforced rib structures.
The assembly of the three-layered plate structure is connected using bolts, and a nitrile rubber sealing ring is used to seal between the base plate and transparent acrylic glass. The base plate is 30 mm thick, with inlet and outlet diameters of 10 mm, channel width of 8 mm, and length of 10 mm. The clearance width is 1 mm, the high-pressure cavity clearance length is 10 mm, the low-pressure cavity clearance length is 5 mm, and the rear cavity behind the valve port is 4 mm high and 22 mm wide. The transparent acrylic glass plate is 10 mm thick, and the upper pressure plate is also 10 mm thick. Except for the sealing groove, the drainage groove and main channel groove both have a depth of 1 mm. The main channel dimensions of the base plate are shown in
Figure 3.
The high-speed visualization experimental setup is depicted in
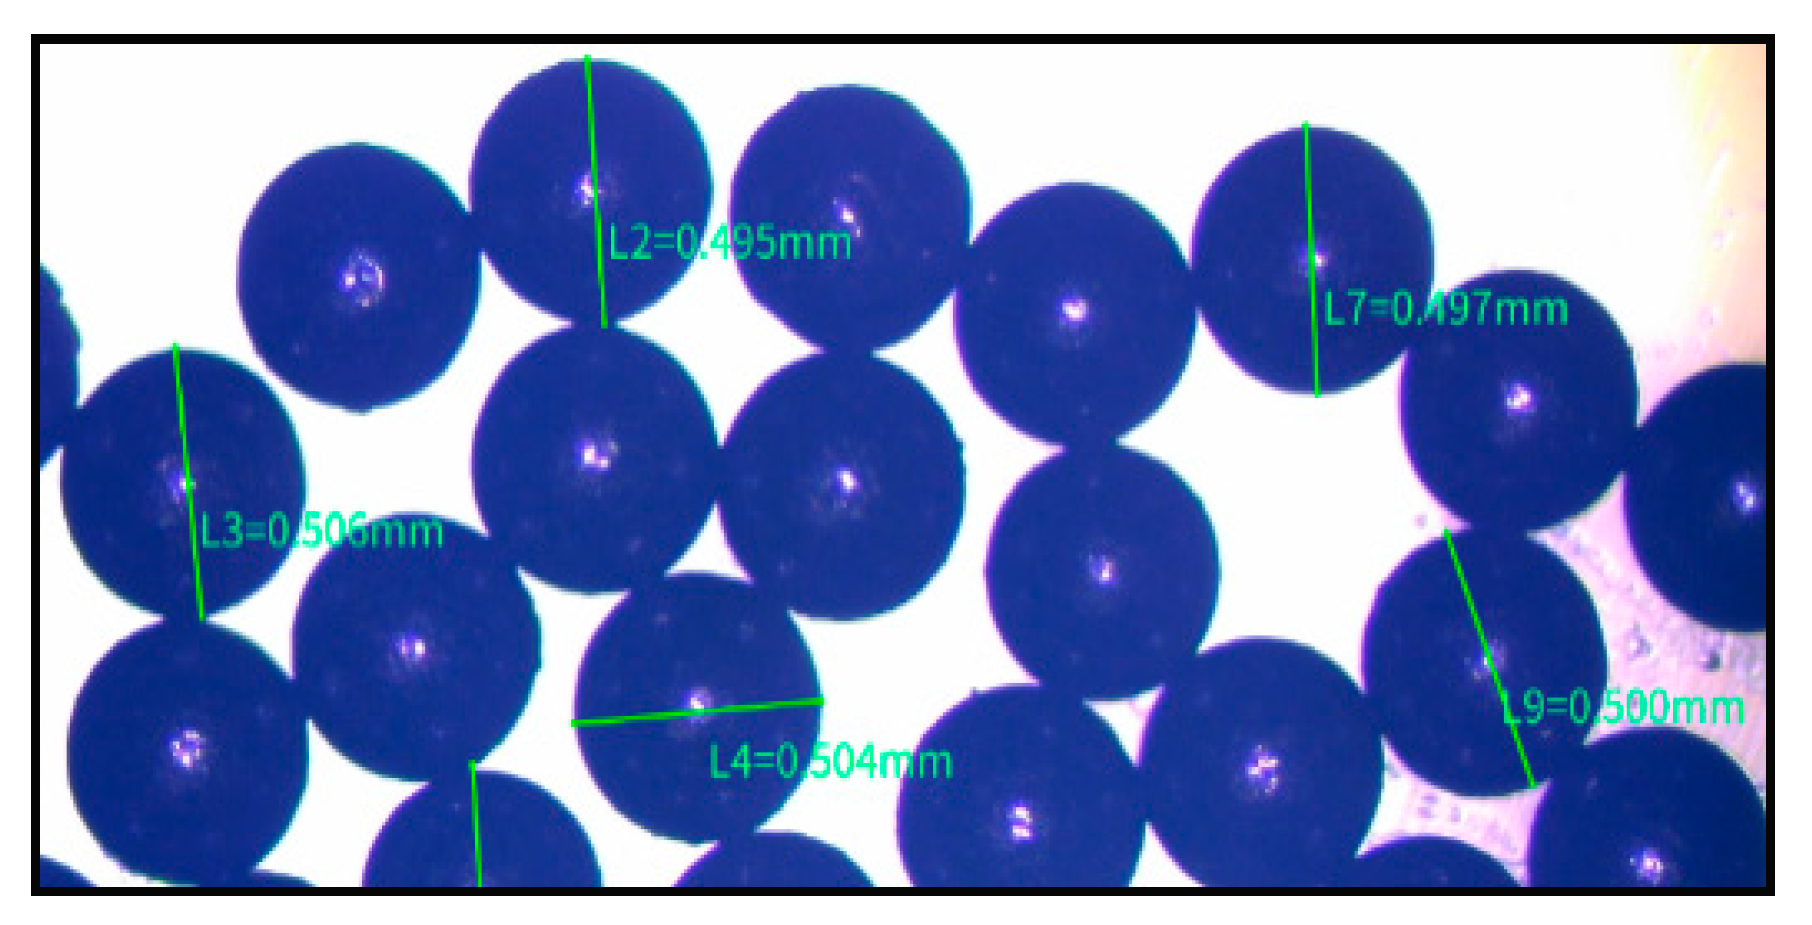
Figure 4. A centrifugal pump injects water from the supply tank into a constant-pressure water tank, with an overflow tube in the constant-pressure water tank maintaining a constant pressure within the system, controlling the inlet pressure at 9.6 kPa and the outlet at atmospheric pressure. A high-speed camera (maximum sampling frequency of 4000 fps) records the particle movement process within the model. Spherical iron particles with a diameter of 0.5 mm were used as contaminated particles, with a structural thickness of 1 mm. The particle size error was determined using a microscope (as shown in
Figure 5). Measurement results from three repeated experiments consistently demonstrated that the range of errors in particle size was less than 0.1 mm, validating the scientific selection of particle scale.
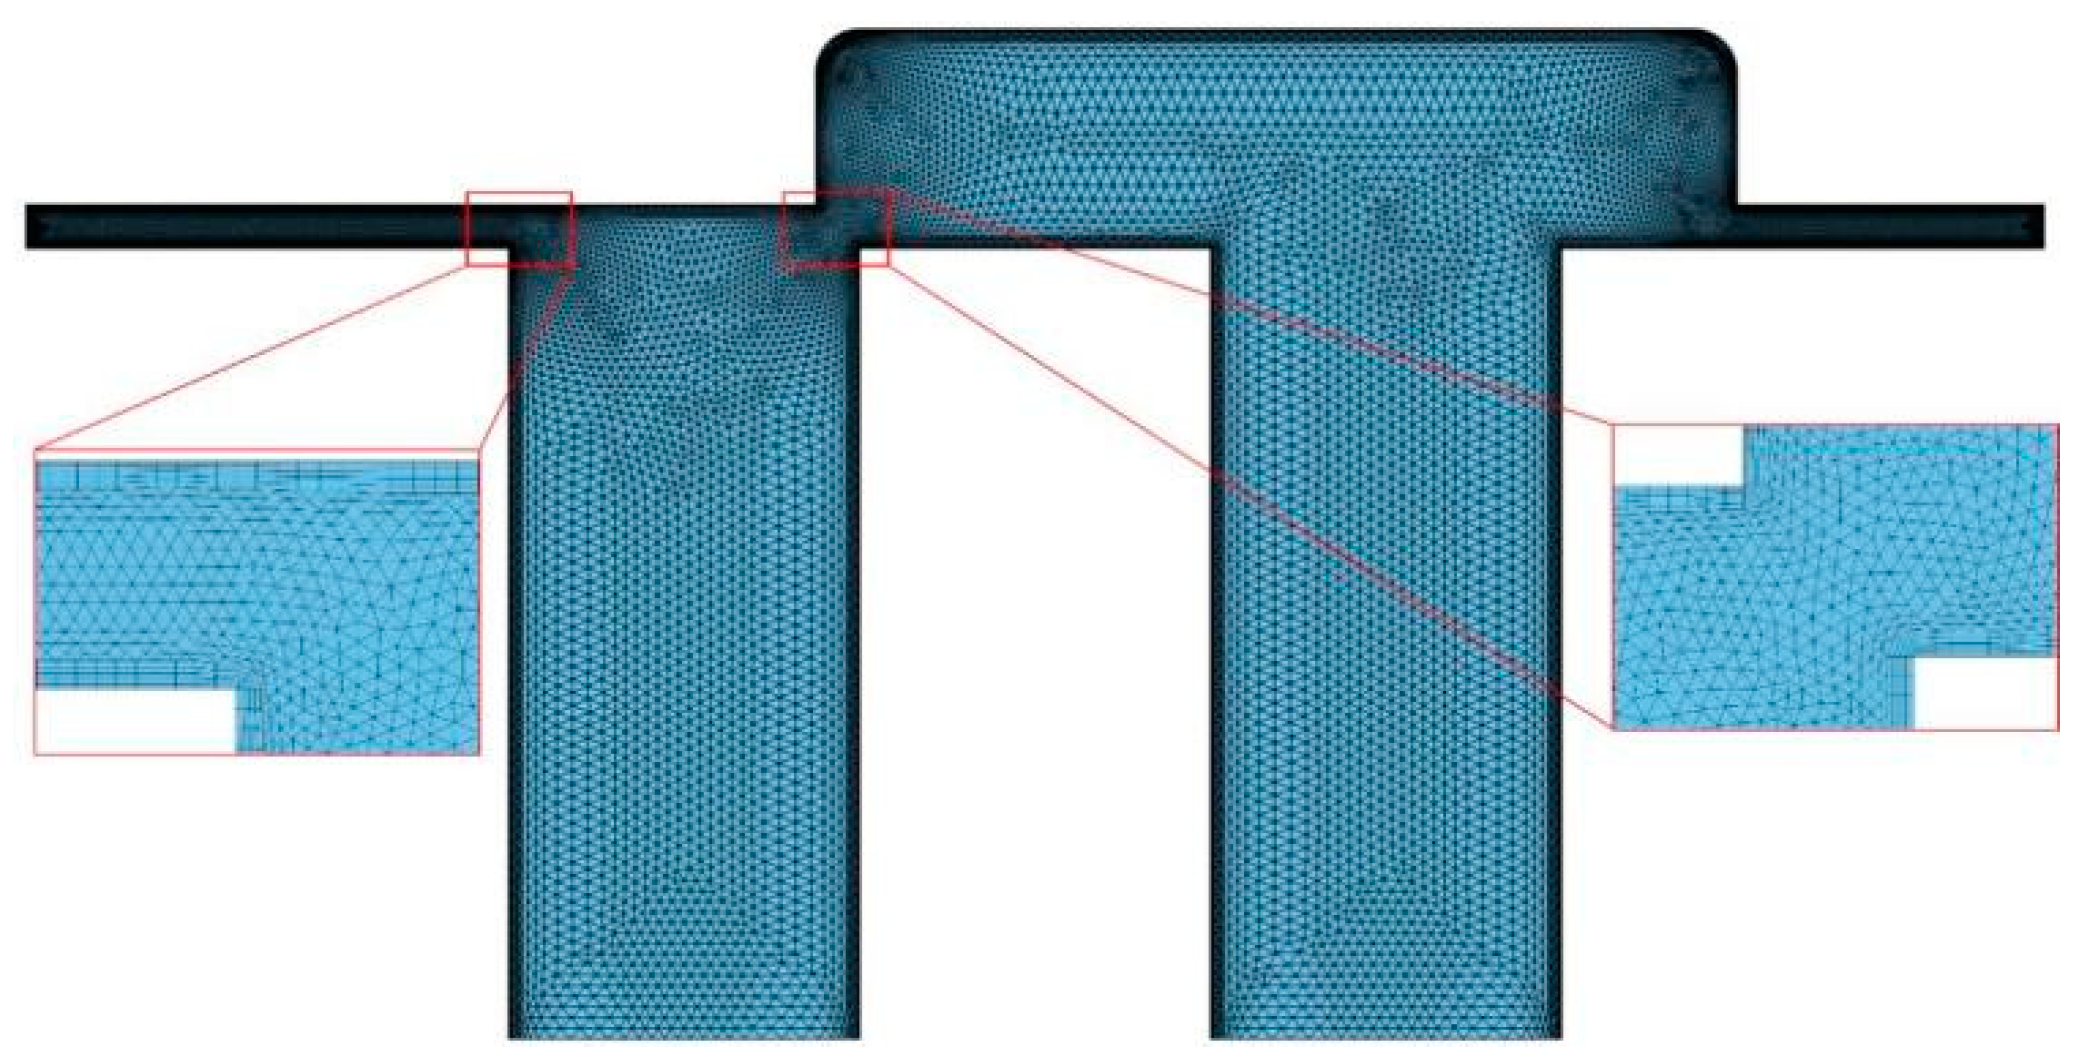
In the numerical model construction, the two-dimensional geometric model of the enlarged clearance clearance in the sliding valve chamber and the boundary conditions were consistent with the experimental setup. The fluid region is divided into triangular meshes as shown in
Figure 6. When fluid flows through the valve chamber, there are significant velocity and pressure gradient changes around the valve port. Therefore, the mesh size near the valve port and in the clearance clearance was set to be smaller than in other regions (less than 0.1 mm), while the maximum mesh size in the remaining areas was approximately 0.5 mm. Five layers of grids (with a growth rate of 1.1) were placed near the boundary layer on the wall surface.
Steady-state simulations of the flow field were calculated using COMSOL Multiphysics v3.0 software. By comparing the inlet flow rate of steady-state flow fields at an inlet pressure of 1 MPa and an outlet pressure of 0, with the maximum flow velocity at the left-hand side clearance outlet, the influence of mesh size on simulation accuracy was studied.
Figure 7 depicts the relationship between monitored physical quantities and the number of grids. When the number of grids was greater than 38,000, the deviation of the effect of the number of grids on the inlet flow rate and the maximum flow rate at the outlet of the left clearance was within 5%, and in order to strike a balance between numerical accuracy and computational speed, the number of model grids was chosen as 38,000 grids, and the integrated quality of the grids was 0.54.
3. Theoretical Analysis
The simulation calculation of oil flow in the sliding valve chamber uses the Reynolds-averaged Navier–Stokes (RANS)
k-
ε turbulence model, The turbulence model is computationally inexpensive and capable of accurately calculating steady-state flow in geometric structures. In contrast to the general form of the N-S equation, the physical quantities in the RANS equations are all averaged (including temporal and spatial averages). The RANS equations are as follows [
20,
21,
22,
23].
where
ρ is density,
is the mean velocity,
is the mean pressure,
μ is the mean dynamic viscosity,
i is the directional variable, where
i = 1, 2, 3, is the velocity fluctuation,
is the volume force,
, and
t represents time.
After computing the steady-state flow field in the valve chamber, the particle trajectories are calculated using a fluid–particle one-way coupling method. This approach overlooks particle–particle collisions and the effect of particles on the fluid, concentrating instead on the drag force exerted by the fluid on the particles. The governing equation for particle motion is defined according to Newton’s second law and is expressed as follows:
where
x is the particle displacement,
V is the particle velocity,
mp is the particle mass, Σ
F denotes the total force acting on the particle.
The drag force of the fluid on the particle is related to the particle’s size, mass, velocity, and the viscosity and velocity of the fluid, and is expressed as follows [
24]:
where
FD represents the drag force of the fluid on the particle,
u denotes the fluid velocity,
v represents the particle velocity,
τp signifies the particle velocity response time (indicating how quickly the particle accelerates to the fluid velocity),
ρp is the particle density,
dp indicates the particle diameter, the drag coefficient
CD is related to the relative Reynolds number
Rer, which is calculated using Equation (4).
4. Experimental Verification
In the experiment, 16 spherical iron particles are pre-set in the inlet flow channel, and a particle trapping device is placed at the outlet of the left-hand side clearance, to ensure consistency with actual working conditions, and at the same time, the enlarged size of the fit clearance would not have a significant effect on the movement of particles in the valve cavity [
25]. The motion process of the particles being driven by the liquid flow is recorded using a high-speed camera, as shown in
Figure 8. From the figure, it can be observed that the particle-trapping device retains the particles invading the left-hand side clearance. Through statistical analysis, out of the pre-set 16 spherical particles, 8 particles invaded the left-hand side clearance, accounting for 50% of the total particles. In the enlarged experimental model of the sliding valve chamber, both the valve port and the clearance size are 1 mm. Consequently, the liquid flow in the inlet channel roughly separates from the middle of the channel, driving eight particles on the left-hand side into the left-hand side clearance, while the right-hand flow drives the other eight particles through the valve port. When the particles invade the clearance, they collide and rebound with the upper and lower surfaces of the clearance.
In the simulation model matching the experimental model, 16 spherical iron particles with a diameter of 0.5 mm are uniformly distributed at a distance of 4 mm below the lower edge in the clearance, under the same experimental conditions. Through fluid–particle one-way coupling, the trajectories of the movement of the 16 particles in the steady-state flow field under a pressure drop of 9.6 kPa were calculated.
Figure 9 shows the pressure distribution and streamline diagram of the flow field in the enlarged valve cavity model. The high-pressure area in the valve cavity is mainly located in the inlet flow passage, the left clearance, and between the valve ports, reaching a maximum value of 10 kPa. A large pressure drop is formed between the inlet flow passage, the left clearance, and the valve port. Local negative pressure is generated at the lower inlet of the left clearance and the upper inlet of the right clearance, with a maximum negative pressure of 5.7 kPa. From the streamlines, it can be seen that the flow velocity of the fluid was uniform and low at the inlet flow passage, about 1.3 m/s. The fluid velocity in the left clearance increased, with a maximum velocity of 5 m/s, and the velocity at the valve port also increased sharply, with a maximum velocity of 4.6 m/s, while the velocity in other regions was relatively low. There are three obvious vortex zones in the flow field, mainly distributed on both sides of the valve port jet and on the right side of the outlet flow passage.
Figure 10 shows the simulation results of the particle trajectories in the enlarged clearance model. In
Figure 10a at 0.01 s, the particle trajectories indicate that under the action of the liquid flow, particles move upward. Thirteen particles collide and rebound with the valve core, while the other three particles directly pass through the valve port and collide with the bottom surface of the valve core groove. In
Figure 10b, all particles reach the outlet and are frozen in the outlet position. It can be observed that at 0.01 s, after the 13 particles that did not pass through the valve port collide and rebound with the valve core, they move downward by approximately 2 mm. They then split into two directions: seven particles on the left enter the left clearance, with a velocity of about 1.6 m/s upon entering the entrance of the left clearance, and collide and rebound with the upper and lower walls of the left clearance. The remaining six particles pass through the valve port, with an instantaneous velocity ranging from 1 m/s to 1.4 m/s. The particles passing through the valve port first collide with the bottom surface of the valve core groove, but the collision positions are scattered, resulting in chaotic trajectories after rebound. Eventually, six particles reach the outlet, and three particles enter clearance 2.
From the above analysis, it can be seen that the simulation results of the enlarged model are highly consistent with the experimental results, as detailed below:
- (1)
The number of particles entering the left clearance: experimental results show eight particles, while simulation results show seven particles. The number of particles passing through the valve port without colliding with the valve core surface: experimental results show four particles, while simulation results show three particles. This discrepancy is due to the initial cavity flow domain in the experiment being empty, and the flow after water injection is not stable. In contrast, the simulation calculates the transient motion trajectories of particles based on a stable flow field, resulting in inevitable errors within an acceptable range.
- (2)
Among the particles entering the left clearance, two particles on the left directly enter the left clearance, while the remaining particles collide and rebound with the valve core surface before moving upward again and entering the left clearance. This consistency between experimental and simulation results is observed.
- (3)
Observing the motion of particles entering clearance 1, a high level of consistency between experimental and simulation particle trajectories is evident.
In conclusion, the adoption of a fluid–particle one-way coupling calculation method for simulating the trajectories of solid particles in the valve cavity is feasible.
7. Conclusions
In this paper, we addressed the issue of particulate contamination in hydraulic fluid causing stiction of the valve core in the sliding valve by first establishing a fluid–particle one-way coupled computational method for simulating the movement of contaminant particles in the sliding valve cavity. We then verified the accuracy of the simulation method through high-speed visualization experiments that magnified the clearance clearance. Finally, we conducted simulations to analyze the motion process of micrometer-scale spherical iron particles within the sliding valve cavity featuring micron-level clearances, summarizing the regularities and instant phenomena of particle invasion into the sliding valve clearance. Based on the research findings, the following conclusions can be drawn:
- (1)
By comparing experimental and numerical methods, it is demonstrated that the numerical model of fluid–particle one-way coupling can be used to study the regularity of particulate contamination invading clearance clearances in the sliding valve cavity. In the steady-state flow field of the cavity under different valve openings and pressure differentials, solid particles in the hydraulic fluid mainly migrate along the main valve flow stream, with approximately 1% to 27% of particles potentially invading the clearance.
- (2)
Under conditions of a narrow opening sliding valve, as the valve opening decreases, the probability of particle invasion into the clearance sharply increases. Particles located near the entrance of the sliding valve clearance are more likely to invade the clearance under the driving force of the fluid flow field, while a larger valve pressure differential leads to a greater number of particles invading the sliding valve clearance.
- (3)
At the entrance of the sliding valve clearance, the influence of inertia on particle motion increases, and the trajectories of particles do not perfectly align with the fluid flow lines.
- (4)
Particles entering clearance 1 adopt a motion pattern involving inclined contact with the valve core wall before rebounding into the sliding valve clearance, and these particles exhibit relatively concentrated positions upon their first collision with the valve core wall.
The above findings not only improve the understanding of the law of particle intrusion in slide valve clearance but also provide practical guidance for improving the reliability of hydraulic control valves, which could directly impact the improvement of system reliability and efficiency in industrial applications.


