Article

Continual Monitoring of Respiratory Disorders to Enhance Therapy via Real-Time Lung Sound Imaging in Telemedicine

1
James Watt School of Engineering, University of Glasgow, Glasgow G12 8QQ, UK
2
Global Technology and Innovation Department, Hill-Rom Services Pte Ltd., Singapore 768923, Singapore
*
Author to whom correspondence should be addressed.
Submission received: 11 March 2024 / Revised: 21 April 2024 / Accepted: 24 April 2024 / Published: 26 April 2024
(This article belongs to the Special Issue Smart Communication and Networking in the 6G Era)

Abstract

:
This work presents a configurable Internet of Things architecture for acoustical sensing and analysis for frequent remote respiratory assessments. The proposed system creates a foundation for enabling real-time therapy and patient feedback adjustment in a telemedicine setting. By allowing continuous remote respiratory monitoring, the system has the potential to give clinicians access to assessments from which they could make decisions about modifying therapy in real-time and communicate changes directly to patients. The system comprises a wearable wireless microphone array interfaced with a programmable microcontroller with embedded signal conditioning. Experiments on the phantom model were conducted to demonstrate the feasibility of reconstructing acoustic lung images for detecting obstructions in the airway and provided controlled validation of noise resilience and imaging capabilities. An optimized denoising technique and design innovations provided 7 dB more SNR and 7% more imaging accuracy for the proposed system, benchmarked against digital stethoscopes. While further clinical studies are warranted, initial results suggest potential benefits over single-point digital stethoscopes for internet-enabled remote lung monitoring needing noise immunity and regional specificity. The flexible architecture aims to bridge critical technical gaps in frequent and connected respiratory function at home or in busy clinical settings challenged by ambient noise interference.

1. Introduction

Chronic obstructive pulmonary disease (COPD), asthma, and pneumonia are examples of lung-related disorders that place significant financial responsibility on society [1,2]. Chest X-rays or computed tomography (CT) are used only during periodical medical visits to check the patient’s lung function. As a result, adapting medical therapy to each patient’s unique medical progression is challenging. The therapy result may be strengthened by frequent or continuous observation of lung functions throughout the patient’s everyday tasks. Therefore, personalized therapy approaches are crucial for managing and improving respiratory diseases [3,4].
Currently, in the management of respiratory conditions such as COPD and cystic fibrosis, high-frequency chest wall oscillation (HFCWO) therapy is widely employed. Patients are typically instructed to use HFCWO devices such as Monarch- and Vest-airway clearance systems for a prescribed duration without real-time monitoring or feedback on the therapy’s effectiveness [3,5]. This approach lacks personalization and the ability to adjust the treatment based on the patient’s response.
Telehealth or remote monitoring technologies may enhance healthcare delivery to patients with lung diseases, resulting in the early detection of the condition worsening, adjusting to the therapy, achieving a higher quality of life, and decreased hospitalization rates [5,6]. Many systems for remote recording of physiological signals associated with lung function have recently been developed [7]. Respiratory sounds produced from the patient’s chest wall are one of the critical assessment parameters in the setting of respiratory diseases. One method of conducting sound-based remote monitoring is to teach patients how to use digital stethoscopes, which send the recorded sounds to a healthcare expert for additional analysis. Technologies, including digital communications, telemedicine, electronic medical records, and innovative biometric sensors, must be used for home-based continuous patient monitoring programs. Even though the majority of these components have reached a level of development that meets the needs of continuous monitoring applications, the biometric sensors used to capture lung sound signals still need to be developed significantly [7]. Additionally, the literature finds that there is no accurate, noninvasive, affordable, or simple-to-use biometric sensor to measure some challenging but clinically significant characteristics, such as the changes in airway obstructions [7,8].
Since lung sound signals can be used to accurately detect pulmonary edema early, as a follow-up for treatment in chronic respiratory illnesses therapy, and for patients in the intensive care unit (ICU), airway obstruction is an essential metric in lung health assessment. Although the assessments of airway obstructions offer instrumental clinical data, there is currently no accurate and noninvasive method of determining the obstructed region. The location and severity of lung problems can be determined using a digital stethoscope, an example of a biometric sensor for collecting lung sound components [7,9,10]. Examples of digital stethoscopes with filtering capabilities for automated analysis, quality improvement, and an increased frequency range are the Thinklabs One and Littmann 3200 [10,11].
In this study, to the best of our knowledge, an array of MEMS microphones utilized in the assessment of lung function through imaging in the context of the Internet of Things (IoT) is presented for the first time. This real-time feedback enables doctors to dynamically modify the therapy protocol based on the patient’s response, enhancing the effectiveness of the treatment and providing a personalized, closed-loop approach to respiratory disease management. The proposed monitoring system is based on an array (flexible) of MEMS microphones and can be used as a remote continual assessment of lung function, as shown in Figure 1, enabling smarter and optimal therapy with real-time analysis by doctors or clinicians. Furthermore, the study proposes an efficient technique to capture lung sound signals for transferring the lung signals as imaging data to clinicians remotely from outside medical centers, addressing the lack of accurate systems for obtaining and displaying the graphical representation of acoustic lung imaging. The proposed acoustic signal acquisition unit demonstrated a similar time-domain waveform trend and frequency of interest in frequency spectrum analysis compared to commercial digital stethoscopes and has demonstrated more accuracy in detecting airway obstruction compared to commercial digital stethoscopes [12,13,14], in terms of converting acoustic signals to acoustic imaging for the intuitive assessment of lung function.
The growing clinical interest in contactless or virtual lung function assessment has highlighted the need for an adaptable, flexible, and multifunctional device capable of capturing lung sound signals and converting them to acoustic imaging. This research aimed to develop a system that could enable remote lung examinations or virtual lung function assessment, thereby reducing infection concerns associated with intra-hospital patient transportation and lowering equipment operating expenses [5,6,15,16]. Moreover, with the advent of 6G technology and its potential for enhanced connectivity, ultra-fast speeds, low latency, and massive network capacity, such a system could transform and revolutionize lung telemedicine by enabling e-screening for respiratory disorders by remotely located clinicians, home monitoring, and gating controls for radiological imaging procedures [17,18].
This paper is organized as follows: A concise review on lung function assessment is described in Section 2. The hardware data acquisition and the design setup are presented in Section 3. The performance index and setup of the proposed system signal acquisition in relation to noise and the accuracy of acoustic imaging are presented in Section 4. The experimental results and discussion are presented in Section 5. Lastly, Section 6 presents the conclusion and future work.

2. Literature Review

For home-based lung health assessment and enhancing therapy initiatives, biometric sensors still require significant development to satisfy the requirements of home-based monitoring applications [7,19]. Biosignals of interest for lung function assessment are respiration rate and volume and, most notably, sound signals generated from the chest wall with regard to chronic lung-related diseases. Abnormal lung sound signals captured through a digital stethoscope can provide valuable information, including the location and severity of lung disorders [5,6,7,9].
Digital stethoscopes such as Thinklabs One [11] and 3 M Littmann [10] have shown good performance in picking the acoustic lung signals and have proprietary signal conditioning to enhance the captured signals for analysis. However, the technology is limited by its large size and poor uniformity in the sensing area [19,20]. Although digital stethoscopes can serve as a recording device, which can show useful acoustic signal information in a time-domain waveform, a computer algorithm must be developed to remove noise to retain critical data and convert the waveform into an image for an intuitive assessment so that the doctor or clinicians can easily identify obstructions in the airway to save time locating and assessing the obstructed area in the lungs. Leveraging on the size and its performance, recent work with various smart MEMS sensors, such as microphones [21] and accelerometers [22], has been adopted to capture acoustic signals. However, the patient’s lung and environmental sounds had to be captured for the acoustic signal conditioning to improve the noise resolution and signal accuracy, which may pose privacy issues. The sensor utilized in most studies [7,21,23,24,25] provides a single data point, which may be insufficient for an in-depth analysis [8,14,26,27,28,29,30], and the repositioning of the sensor is required if more data points are required and also advanced patient compliance and position accuracy. The MEMS acoustic sensor can be further expanded to an array and provide intuitive and continual assessment remotely. Developing a more inexpensive, accurate, and wearable array of sensors compared to commercial digital stethoscope devices can enable telemedicine and other forms of remote medical assessment through continual monitoring. Thus, a monitoring system with distinguished features of compact size, that can be easily worn by patient, and eliminates the need for precise positioning of the acoustic sensor is critical for wearable healthcare applications in remote monitoring.
There have been a variety of alternative methods for the remote monitoring of lung function, such as vibration response imaging (VRI). In the quantitative forms of lung sound presentation, VRI uses simultaneous multimicrophone recordings from vibration energy generated during breathing and converts the acoustic signal to an image [31,32,33]. The visual representation enhances clinical relevance by providing localized data on breath sounds between various lung locations [31,32,33]. There is a positive quantitative data link between acoustic imaging and lung problems, such as smoking index and the buildup of excess fluid between layers of the pleura outside the lungs [31,32,33]. However, no positive data correlation exists between VRI and airway-related diseases, such as asthma and COPD [31]. Furthermore, these techniques interfere with and are impractical to integrate with a body sensor network for frequent home-based monitoring. Therefore, designing a portable lung function assessment platform is needed, and accurate data representative of the patient’s lung functions would be vital in this paper.

3. Monitoring System for Remote Assessment

This study implements a remote acoustic imaging system incorporating an array of MEMS microphones. The controller and data processing algorithm are also essential elements in the monitoring system other than the sensing unit and the MEMS microphone, to collect and process the captured data and to minimize the noise interference to improve the signal-to-noise ratio (SNR) and collect accurate data, in terms of the root mean square error (RMSE). The overall theoretical representation of the proposed continual and real-time monitoring system consists of several units, such as control, sensing, and a computer for signal analysis and cloud service, as shown in Figure 1 and Figure 2.

3.1. Hardware Design

The following sub-sections discuss the hardware components utilized for the proposed system, including the data acquisition module, the digital pin connections between the acoustic sensor array, and the Bluetooth Low Energy (BLE) to transmit the data wirelessly into the computer for remote analysis, as shown in Figure 3a,b. The developed wearable sensor module (see Figure 3c) consists of a digital MEMS microphone array, microcontroller, and Bluetooth module as the key components for multichannel lung sound acquisition and remote analysis. The microcontroller and sensor module components are enclosed in a customized 3D-printed enclosure to protect the components during use. As shown in Figure 3d, flexible cabling connects the microcontroller board to the microphone array to maintain user comfort and conformability when worn on the body.

3.1.1. Microphone Array

The proposed system’s digital MEMS microphone array (see Figure 4) features TDK InvenSense ICS-52000 MEMS microphones (InvenSense, San Jose, CA, USA) to record lung signals [14,20,34] in an omnidirectional way to provide equal sensitivity from the sensor area, which also allows for flexible sensor positioning on the body. The number of MEMS microphones and their sensing diameter impact an acoustic imaging system’s detectable obstructed airway length. More microphones with an overlap in sensitivity enable the detection of smaller obstructions. For example, with a 50 mm diameter, around 4 microphones can detect 73 mm obstructions, while 24 microphones can detect 25 mm obstructions. Hence, the number of MEMS microphones utilized in the proposed system can range from 6 to 32 [12,14,20,26,27,28], as the proposed system is designed for flexibility. As each microcontroller supports up to 16 daisy-chained microphones, multiple boards can be used for arrays with more elements, as illustrated in Figure 4. These microphones were selected for their high 65 dB SNR, along with a comprehensive 50 Hz to 20 kHz frequency response similar to the commercial digital stethoscopes [10,11], covering the range of typical lung sounds ranging between 100 Hz to 2000 Hz.
The array of MEMS microphones is arranged in a linear orientation with equal spacing between sensors to be positioned over the chest area for recording lung sounds, as illustrated in Figure 3c. As presented in Figure 4, the microphones are interfaced using a daisy-chain configuration and time-division multiplexed (TDM) digital signaling to synchronize their sampling clocks. This TDM approach reduces wiring complexity compared to separate analog-to-digital converters for each microphone while maintaining timing synchronicity between the microphone channels during multichannel data acquisition. The microphones have a ±1 dB sensitivity tolerance, eliminating the need for individual calibration of each element in the array [35]. Integrated analog front-end signal conditioning circuits and 24-bit sigma-delta analog-to-digital converters (ADCs) in each microphone provide calibrated and low-noise digitized outputs [35].

3.1.2. Microcontroller and BLE

The MEMS microphone [35], with its proprietary in-built ADC signal condition and power management, is soldered to a printed circuit board (PCB) with a voltage regulator to convert the 5 V to 3.3 V. Similarly, the microcontroller is soldered onto a PCB, which is utilized for the activation of the array of MEMS microphones to capture acoustic lung signals. The multichannel data acquisition microphone array is interfaced to a 32-bit Teensyduino Teensy 3.6 microcontroller, featuring a 180 MHz ARM Cortex-M4 core. The microcontroller synchronizes the sampling process across the microphone array by coordinating the frame sync signals used in the TDM digital interface. The 32-bit microcontroller was selected to interface with the TDM microphone array due to its compact design suited to wearable applications. The microcontroller offers flexibility for customized programming, parameter adjustment, and algorithm updates. It was soldered to a printed circuit board with a voltage regulator, as shown in Figure 3a, to provide a stable 3.3 V supply to the microphone array. A 100 kΩ pull-down resistor at the serial data (SD) discharges the output line during the microphone’s tri-state logic on the data bus.
Wireless connectivity can be achieved using an nRF52832 (Nordicsemi, Oslo, Norway) BLE system-on-chip. The nRF52832 has multirole support, such as peripheral and central, and is implemented by the Nordic SoftDevice—a precompiled and linked binary software implementing a BLE protocol stack. Hence, the nRF52832 BLE chip can be programmed to function as either a central or peripheral device to provide a wireless universal asynchronous receiver–transmitter bridge. The nRF52832 interfaces with the universal asynchronous receiver–transmitter Serial 1 port on the Teensy microcontroller, which consists of receiving and transmitting signal, as illustrated in Figure 3a. For gateway applications to a computer, a second Teensy 3.6 with a central/master role integrated with a nRF52832 add-on can be utilized to receive and forward data wirelessly [36]. The gateway Teensy can simply read the incoming data off its own universal asynchronous receiver–transmitter lines connecting to the nRF52832 and simultaneously write this data out over USB to a computer [36,37].
nRF52832 has a 1 to 2 Mbps data rate, a 2.4 GHz radio transceiver, and −96 dBm sensitivity, which can be integrated into the Teensy 3.6 microcontroller. The BLE system operates at 1.7 V to 3.6 V, within the voltage required for the microcontroller and MEMS microphone. The BLE module has also been rigorously implemented with the selected microcontroller in prior works [36]. Timeslots of 1 ms can also be allocated to avoid dropout due to packet loss [36,37]. The microcontroller synchronizes the sampling across the TDM microphone array by coordinating the frame sync signals. A 128-bit AES encryption can also be applied on the wireless link for data security and privacy.
The acoustic signals can be collected in real-time on the patient’s computer for signal filtering and then transmitted to the doctor’s computer through the cloud platform for lung signal and image processing and conditioning. From the received lung signals through the cloud platform-specific software or equipment, the authorized doctor or clinicians can optimize respiratory therapy through real-time adjustments of parameter settings, in particular for high-frequency chest wall oscillation devices.

3.1.3. Data Acquisition System Design

The microphones are synchronized using a word select (WS) signal to ensure simultaneous sampling across the array. A delay is added to the WS signal startup to allow the microphone circuits to initialize before beginning data acquisition. The microphones are daisy-chained, with one microphone’s WS output connected to the next WS input. The microcontroller supplies the WS signal to the first microphone. The first timeslot in the TDM frame outputs data from the first microphone, the second timeslot outputs data from the second microphone, and so on. The microphones output 24-bit data words in the most significant bit first, two’s complement format. With 5–8 microphones in the array, the serial clock frequency is 256 × WS frequency fWS, typically around 8 kHz. The microphone array enables lung function assessment through acoustic imaging of the multichannel sound data, similar to techniques used in other modalities.
The microphones have low ±1 dB sensitivity tolerance, eliminating the need for per-element calibration. The package integrates signal conditioning, ADCs, filters, and power management. Synchronized sampling enables accurate array signal processing for beamforming and imaging. In summary, the daisy-chained TDM microphone array with synchronized sampling and integrated signal conditioning provides a configurable platform for multichannel lung sound acquisition and analysis. The programmable microcontroller coordinates the array sampling to achieve simultaneous, calibrated inputs without per-sensor calibration.

3.2. Software Design

The following sub-sections illustrate the software data acquisition module, signal processing module, and acoustic lung image processing from the acquired lung signal.

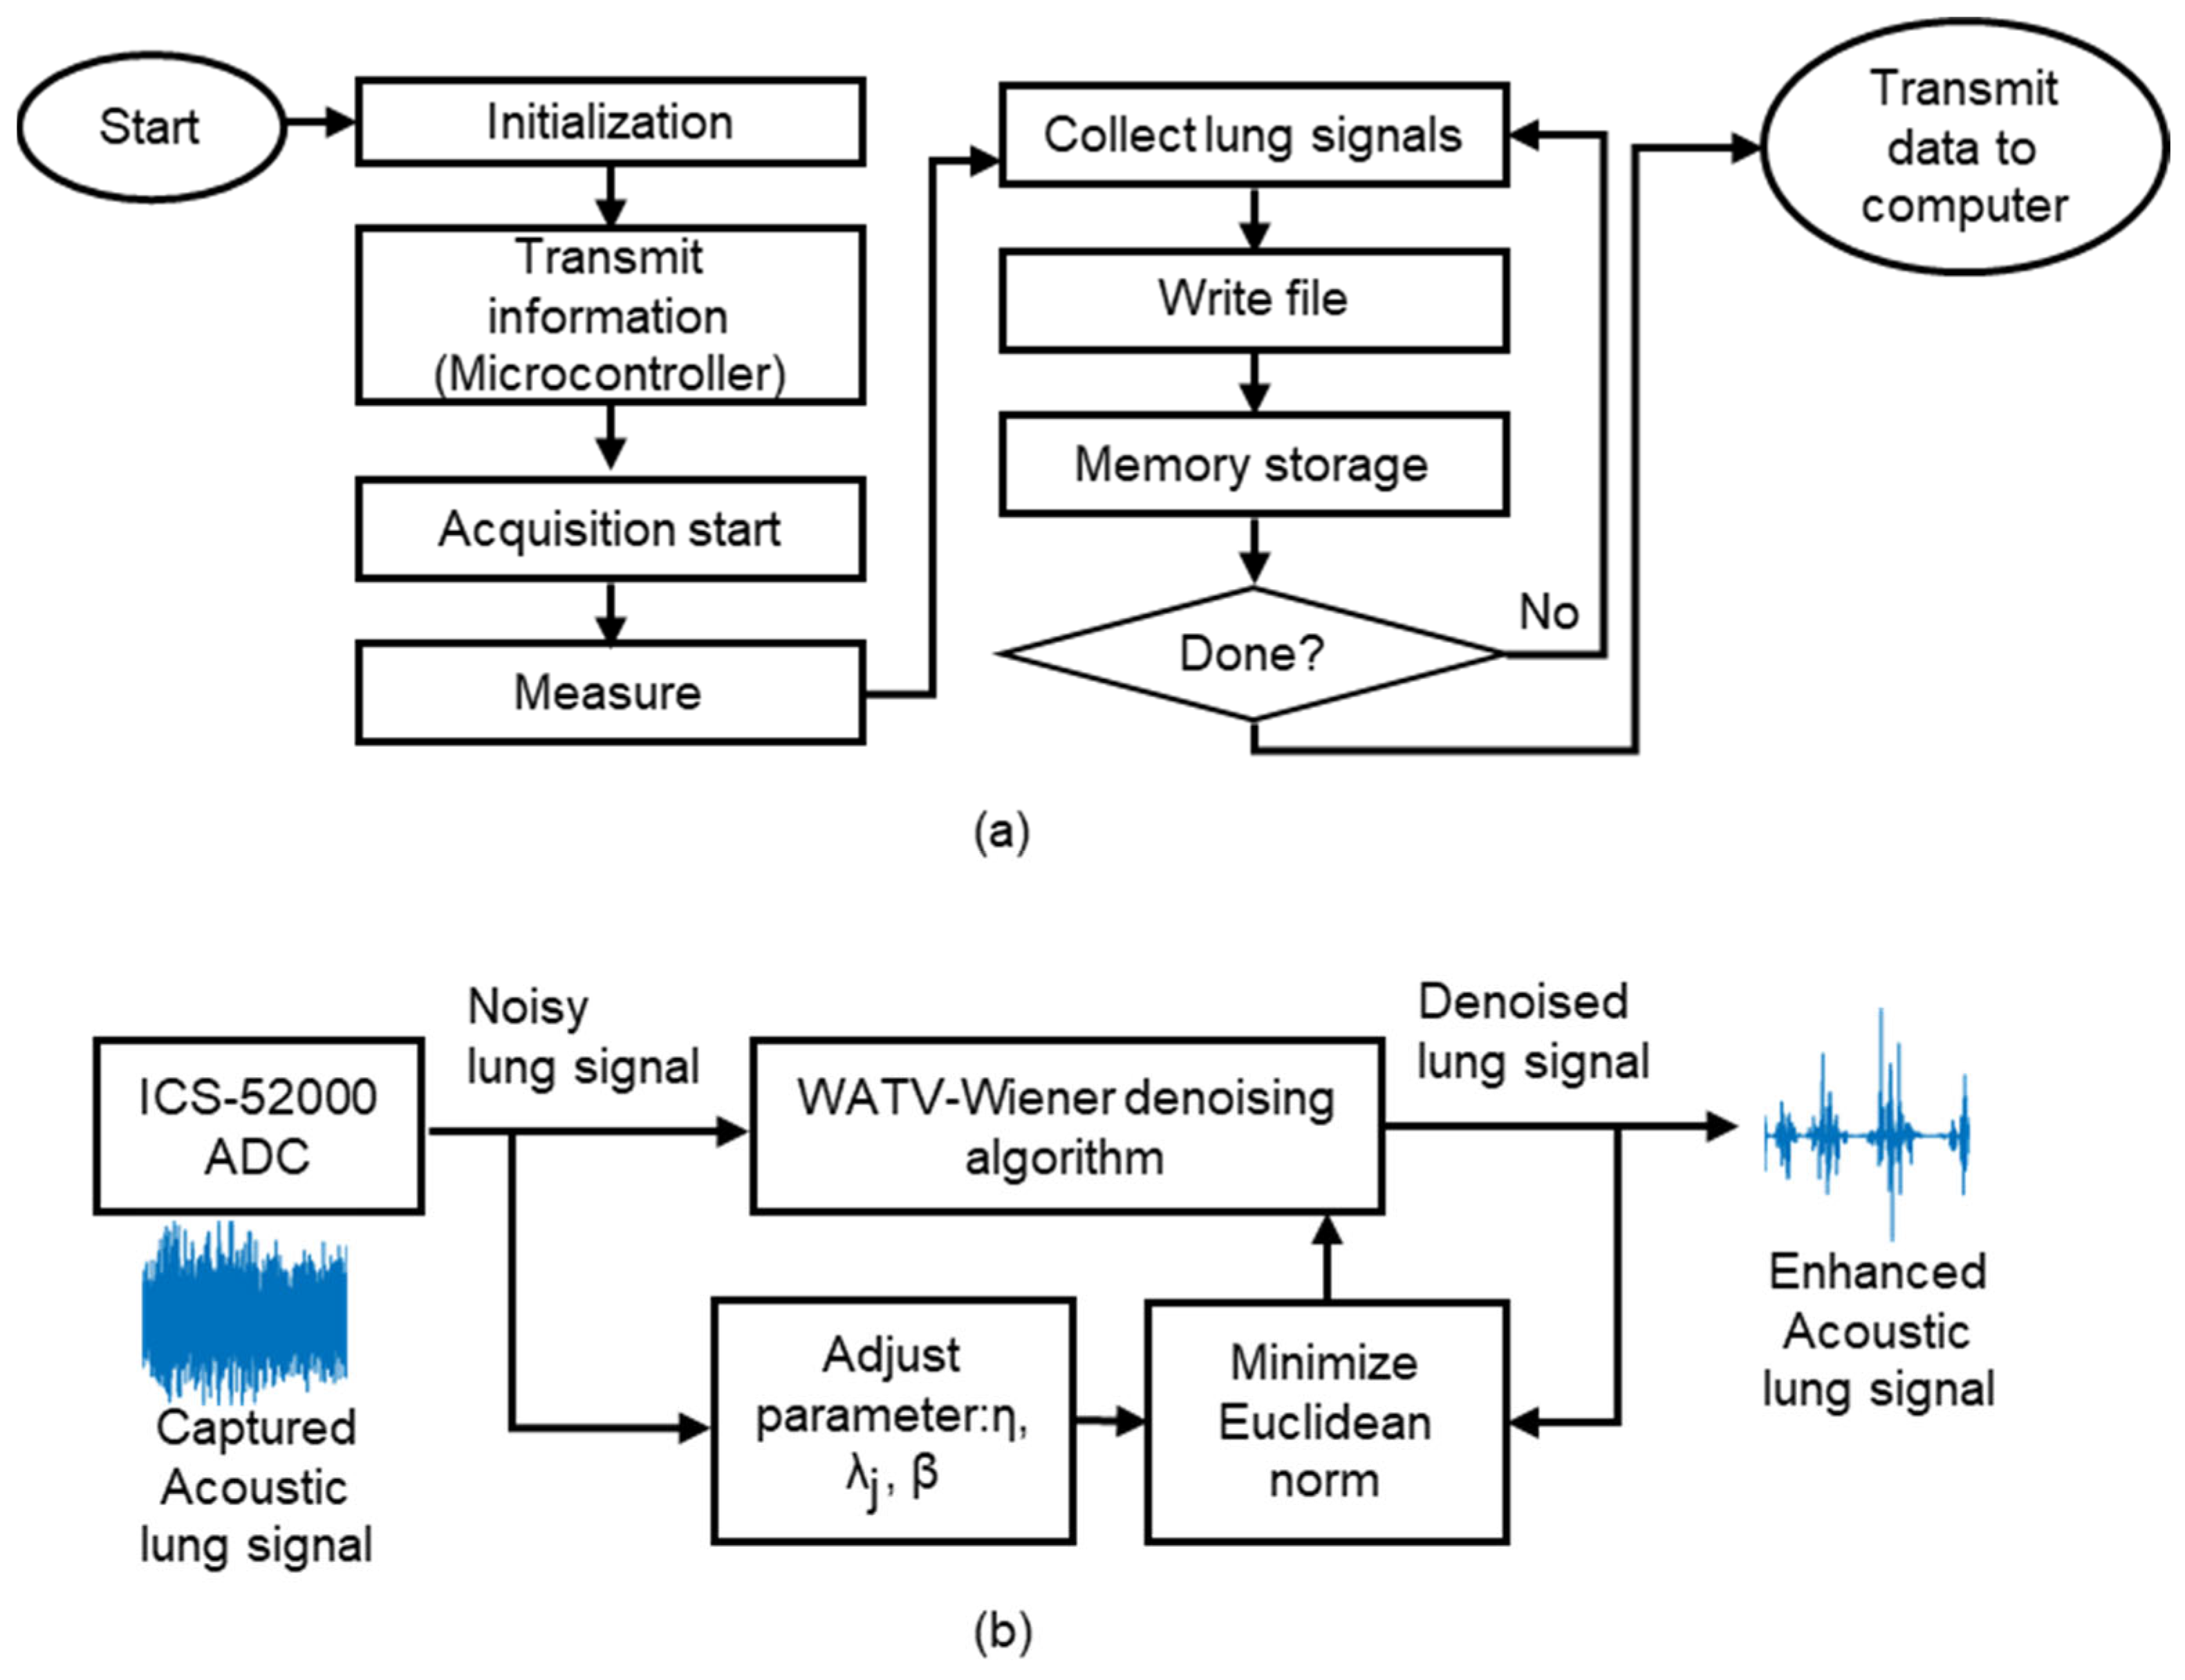
3.2.1. Data Acquisition Software Design

The software architecture centers around data acquisition from the microphone array, and the acoustic signal processing and analysis can be performed through MATLAB R2023a. The microcontroller can be interfaced with a computer over a wireless connection as shown in Figure 1, Figure 2 and Figure 3. The proposed system’s microcontroller waits for a data transmission command from the computer to initiate acoustic signal collection using the array of MEMS microphones. As the digital microphone data stream in, the microcontroller buffers it in internal flash storage. The buffered data can be logged to a file in XLS spreadsheet format, with separate columns containing the data samples from each microphone in the array. This facilitates subsequent processing and analysis of the synchronized multichannel inputs. The configurable software data collection process enables acoustic capture tailored to study requirements.

3.2.2. Signal Processing Denoising Module

The system applies a multi-stage software filtering pipeline to process and condition the raw microphone inputs, as shown in the signal flow diagram (see Figure 5). The lung sounds are digitized at an 8000 Hz sampling rate FS based on the microphone’s internal proprietary sigma-delta ADC technology, which operates at a high oversampling ratio [35]. An integrated proprietary digital low-pass filter [35] in each microphone suppresses high-frequency noise. The in-built filter characteristics scale with sampling frequency FS. For example, the microphone’s lower cutoff frequency is set to 50 Hz, while the high cutoff frequency is a fraction of the 8 kHz sampling rate given as the formula 0.417 × FS in the MEMS microphones datasheet [35], providing a passband from 50 Hz to 3336 Hz [35] covering typical lung sounds. This takes advantage of the high oversampling ratio of the microphone’s ADC.
First, the integrated digital low-pass filter in each microphone removes high-frequency noise above the range of typical lung sounds and converts the analog to digital signal internally, as shown in Figure 5b. Next, from Figure 5b, a wavelet-domain denoising algorithm leveraging empirical Wiener filtering further reduces ambient and electronic noise while retaining desired auscultation features. This configurable conditioning provides filtered multichannel data ready for additional analysis and processing algorithms. The software filtering aims to improve the SNR and normalize the microphone array data to generate clean inputs that retain the relevant respiratory acoustic components. The parameters of each stage can be tuned to optimize noise reduction versus bandwidth for different lung sound-sensing needs. The pipeline takes advantage of integrated microphone filtering before applying more advanced wavelet techniques to balance noise removal with preserving subtle acoustic signatures needed for diagnosis. This multi-stage approach implemented in software enhances the array data quality while providing flexibility.
A key challenge in lung sound denoising is removing ambient noise while retaining subtle auscultation features indicative of respiratory conditions. Basic filters like FIR designs may inadequately address this, cancelling useful signal components. To overcome this, a wavelet-based denoising method that combines empirical Wiener filtering with wavelet thresholding is implemented, as presented in Figure 5b. The pseudocode (see Algorithm 1) of the denoising algorithm is presented below.
Algorithm 1. WATV-Wiener denoising algorithm [38]
Input: Noisy data (y); Number of vanishing moment (km); Regularization parameter
   ( λ j ); TV parts ( β ); Step size ( μ ); Number of wavelet scale ( j ); Number of iterations
   ( n i t e r ); Threshold function ( θ ); Wavelet transform (W); Wavelet coefficient (ωc)
Output:
1:   Initialization: ω c = W y ;
2:   Identifying an estimated wavelet coefficient ω ^ c by iteratively minimizing with respect to
   ωc and u with variable splitting and augmented Lagrangian approach.
3:    u = ω c ; d = ω c ;   c = 0 ;
4:   Iteration till convergence between ω c and u .
5:   For  i = 1: n i t e r
6:    p j , k = W y + μ u d / 1 + μ
7:   Finding the wavelet coefficient ω c for all j , k m with the input from θ , p , λ j , μ ,
    a j = 1 / λ j
8:    ω c ( j , k ) = θ p j , k ; λ j / ( 1 + μ ) ; a j
9:    c = d + ω c
10:   Total variation denoising ( t v d ) requires data input from c , length of the data in
   put ( N ) and TV parts
11:    d = W W 1 v t t v d W 1 c ; N ; β / μ
12:    u = c d
13:    d = d u ω c
14:   end For
15:   Denoised wavelet coefficient ( ω ^ c ), where the signal x ^ t = W 1 ω ^
16:   Empirical Wiener filter design for smoothing: H
17:    H = ω ^ c 2 / ω ^ c 2 + σ 2
18:   Smooth denoised output: x ^ a = W 1 H W x ^ t
This technique leverages pilot coefficient estimation and inverse filtering to smooth the signal and minimize mean squared error. The approach attenuates noise while retaining desired lung sounds by adjusting control parameters. It has been previously validated on real patient recordings in noisy clinical environments. The algorithm models the captured microphone signal as containing the desired lung sound plus ambient and electronic noise components. It then applies the wavelet filtering to estimate the noise-free lung sound signal. The dual-stage technique balances noise reduction with preserving the acoustic signatures needed for diagnosis. The tunable parameters provide optimization for different background noise levels and auscultation targets. This selective denoising improves signal quality for respiratory sound analysis. Refer to studies in [11,38,39,40,41] for detailed denoising filter implementation. The denoising filter approach and the implementation are summarized below.
The captured signal y(n) from the sensor contains the desired signal xa(n) and noise v(n), such as the ambient noise and the inherent noise from electronic devices, as shown in (1),
y(n) = xa(n) + v(n),
where n is the sample index n = 1, 2, 3, …, N, and the total number of samples N is given as N = FST, where FS is the sampling frequency and T is time.
Before attempting to achieve a sufficient denoised signal coefficient from the lung sounds, WATV is first utilized to lessen the interference noise, achieving adequate denoised signal coefficients by adjusting a control parameter 0.95 ≤ η < 1. The control parameter η influences the total variation parts β and the regularization parameter λj, where β and λj control the pilot estimation of the denoised wavelet coefficients in the denoising algorithm [38,39]. Following the pilot estimation, the estimated signal coefficient is sent into the empirical Wiener filter for smoothing by minimizing the denoised signal’s overall mean square error through inverse filtering.

3.2.3. Image Processing

The acquired multichannel lung sound data transmitted from the patient’s computer through the cloud platform can be processed into acoustic images Q for analysis on the doctor’s computer, where the MEMS microphone outputs are normalized arrays of digital amplitude values similar to commercial digital stethoscopes. The signals are then put into an array (MATRIX) form in MATLAB R2023a for signal analysis and imaging processing. The signal intensity P ¯ at each microphone location i in an x- and y-axis coordinate plane is computed by accumulating the sensor readings over a time t interval of t1 to tk,
P ¯ x , y , t 1 , t k = t = t 1 t k P i ( t ) 2
The acoustic lung imaging Q projected from lung signals is then the following,
Q P ¯ , h = t = t 1 t k P i ( t ) 2 h i .
where Q( P ¯ , h) comprises the acoustic signal P ¯ (x, y, t1, tk) and interpolation function h(i), with i containing the sensor position in the (x, y) coordinate plane.
An interpolation function h(i) is applied to estimate the acoustic intensity between the discrete microphone positions, generating a spatial mapping of sound levels across the chest area. Hermite polynomial interpolation is used for its accuracy, given the limited number of physical sensors placed on the body [26]. Refer to [26] and its reference therein for the Hermite interpolation function the in-depth analysis, computation, and application in acoustic lung imaging. A cone-based lung shape is applied to (3) to output an esthetic and intuitive appearance for the end-users in the lung function assessment.
The interpolated intensity map is rendered as a colormap image, with maroon, grey, and white indicating the highest, intermediate, and lowest acoustic levels, respectively. This imaging process transforms the discrete multichannel audio data into a continuous acoustic-level visualization of the spatial respiration characteristics. The software reconstruction aims to provide insights into regional lung functionality and localization of anomalous sounds. The configurable processing can be tailored to optimize the tradeoff between sensor density, interpolation accuracy, and image resolution for different respiratory monitoring needs.

4. System Evaluation and Comparative Analysis

The quality of our proposed system’s captured lung sound signals was benchmarked against two commercially available digital stethoscopes—the Littmann 3200 and Thinklabs One models. The Littmann 3200 [10] and Thinklabs One [11] were chosen due to their optimized designs impacting sound transmission and the utilization of advanced denoising technologies [10,11] for precision acoustic measurements. Benchmarking the proposed system’s signal acquisition unit against these state-of-the-art devices provides insights into how well our system design acquires accurate lung sound signals and localizes anomalies.
Hence, the key metrics chosen in this study for evaluating signal quality and noise resilience include RMSE, SNR, and acoustic imaging representation. The modular sub-system validation aims to build towards complete evaluation with clinical populations remotely in future work. The performance metrics quantify the fidelity of captured lung sounds, ambient noise suppression, and regional assessment capabilities compared to commercial systems [10,11]. By benchmarking RMSE, SNR, and acoustic images, the aim is to validate that the proposed system’s signal acquisition unit can collect and transmit accurate lung signals for the remote assessment of lung function across key factors of signal accuracy, ambient noise reduction, and respiratory mapping. Furthermore, an experiment was conducted to validate the detection of airway obstruction in terms of nidi length. The resulting output from the proposed system and the two digital stethoscopes were characterized and analyzed using MATLAB R2023a.

4.1. Acoustic Signals Acquisition and Setup

The following sub-sections describe the simulation and experimental setup for acquiring acoustic lung signals and lung imaging in this study.

4.1.1. Acoustic Signals Acquisition

A lung sound simulator was used to provide repeatable test signals for evaluating noise performance when comparing multiple acquisition systems, as shown in Figure 6. This enables consistent benchmarking that is not subject to variability between real patient recordings [19,40]. The simulator played back digitized lung sounds from a respiratory disease database [42]. Ten recordings containing crackles and wheezing from patients with asthma or COPD were chosen [42] to represent abnormal sounds. Ten additional samples from healthy patients provided normal breath sounds [42]. The shortlisted lung sounds contained 15 s audio samples that were output at realistic auscultation amplitudes [19,43] with the simulator and had a frequency of interest in the range of around 200 Hz to 400 Hz. Playing back the same calibrated test signals through different acquisition systems allows for a standardized comparison of their noise robustness in detecting known pathologies.
The 20 lung sound samples (10 healthy and 10 unhealthy) were selected from a large respiratory database using the following process, similar to the literature in [19]:
  • Recordings collected from the posterior chest were chosen as the region of interest.
  • Samples were separated into healthy and unhealthy groups based on annotated labels.
  • Unhealthy sounds lacking clinician labels for crackles/wheezing were excluded. Similarly, healthy sounds with annotated anomalies were omitted.
Ten recordings were randomly chosen from each group for the final selection.
Frequency analysis with MATLAB R2023a showed a frequency of interest at 255 ± 60.53 Hz for healthy samples and 349 ± 52.39 Hz for unhealthy samples, agreeing with the literature ranges [7,44]. The screening process above aimed to provide a non-biased and accurate test set representing normal and adventitious respiratory sounds.
The following setups were applied to simulate the actual recording in the experiment studies. The lung sound simulator used a 15 mm silicone layer (Baoblaze, Houston, TX, USA) resembling human tissue over an S1 Pro portable Bluetooth speaker system (BOSE, Framingham, MA, USA) representing the chest cavity. The speaker has a 62 Hz to 17 kHz response covering typical lung sound bands and resembles a typical adult chest wall in terms of its overall size [7]. The speaker system has a flat frequency response ranging between 150 Hz and 1000 Hz [45] despite the reported large frequency response bandwidth. Experimental testing occurred in 59 ± 0.54 dBA background noise resembling clinical environments [46], with a reference microphone—an omnidirectionally sensitive and high-SNR MP34DT04 MEMS microphone (STMicroelectronics, Plan-les-Ouates, Switzerland) monitoring ambient noise levels. ICU noise [47] was played through a secondary JBL Xtreme 3 speaker (Harman, Stamford, CT, USA) about 1 m adjacent to the lung sound simulator, and the SNR was maintained from −20 to 20 dB, with 5 dB intervals relative to calibrated lung sounds, similar to studies in [19,38,39,41,43]. The setup allowed for a direct comparison between the proposed and commercial systems across lung sounds and noise conditions. The adjustable noise and repeatable phantom recordings enabled standardized benchmarking of the proposed system and digital stethoscope performance in recording lung sound signals in a simulated clinical environment. Digital stethoscopes, such as the 3 M Littmann and Thinklab Ones, are also used to record the lung sound signals emitted from the customized chest simulator for system benchmarking purposes.
The maximum bandwidth settings were utilized on the Littmann 3200 and Thinklabs One commercial digital stethoscopes in order to provide a fair comparison of their noise-filtering capabilities relative to the proposed system. The Littmann 3200 was set to “Extended Mode”, which provides an amplified frequency response from 20 Hz to 2000 Hz. This mode also enhances the low-frequency response in the 50 Hz to 500 Hz [10] range of typical lung sounds, similar to the spectrum provided by a diaphragm but with additional gain for the important low-frequency components. The digitally filtered sounds are recorded by the accompanying computer software for the Littmann device. For the Thinklabs One stethoscope, “Filter Mode 5” was chosen, a wideband setting that passes frequencies between 20 Hz and 2000 Hz [11,48]. This mode provides broad spectral coverage without additional gain tuning. The recorded lung sounds are transmitted to the paired mobile device by the Thinklabs stethoscope. The 20 Hz to 2000 Hz bandwidth configured on both commercial devices covers the frequency ranges of interest for the test sounds, which contained spectral peaks at 255 ± 60.53 Hz for healthy samples and 349 ± 52.39 Hz for unhealthy samples. Selecting these extended response modes allowed the Littmann 3200 and Thinklabs One to capture the crucial frequency content needed for analysis and comparison. This aimed to provide a reasonable best-case acquisition benchmark to evaluate if the multi-microphone approach could further enhance noise filtering and detectability.
To enable a valid and aligned analysis between the three systems, the sampling rate mismatch was addressed through resampling (see Figure 6b) the test sounds as follows. The 10 healthy and 10 unhealthy lung sound samples utilized for broadcast had an original sampling rate of FS = 44,100 kHz based on their source in the respiratory sound database. To align with the native sampling rates of the commercial stethoscopes and proposed system, these sounds were resampled prior to being played through the simulator. The Littmann 3200 records at 4000 Hz, so the 44,100 kHz shortlisted respiratory sounds were resampled down to 4000 Hz for a fair comparison. The Thinklabs One and proposed system both operate at 8000 Hz; thus, the sounds were resampled to 8000 Hz before being acquired. Resampling the calibrated test sounds avoids distortion to the key spectral content and allows the analysis to focus specifically on the noise robustness of each system. Since the crucial frequency information is below 500 Hz, the process of resampling down to 4000 Hz or 8000 Hz does not significantly impact the audible components [7,44]. By comparing each system’s recorded sounds to the appropriately resampled inputs, the detection accuracy can be assessed and analyzed in a standardized way. This aims to isolate the effects of ambient noise interference and analog front-end filtering from sampling rate mismatches. Each system is benchmarked using aligned digitized inputs containing identical critical frequency information. This helps characterize the robustness of noise and pathology identification capabilities.

4.1.2. Acoustic Imaging Generation

To emulate an airway obstruction in a controlled manner, water-filled bags of various diameters were placed on the right middle section of the lung sound simulator, as depicted in Figure 7. The water bag presents an acoustic damping effect that models the sound attenuation caused by a pulmonary nidus in actual airways [27,28,49]. Using a phantom obstruction allows for standardization versus variability between human subjects. The healthy lung sound sample played through the simulator provides a baseline reference for comparison. Testing on the phantom simulator aims to demonstrate the proposed system’s ability to detect and spatially localize the obstruction through translated acoustic lung images, before progressing to evaluations on patients with confirmed respiratory diseases.
The MEMS microphone array and the two commercial digital stethoscopes independently acquired lung sound data by positioning their sensors sequentially in an identical array layout without overlap, as depicted in Figure 7a. This ensured that recordings were obtained from equivalent spatial locations between the systems to allow for an aligned comparison. The multi-sensor microphone array system acquired simultaneous readings at each point, while the single-sensor stethoscopes acquired sequential temporal readings.
The lung sound data recorded by the microphone array and stethoscopes were converted into acoustic images using a mapping and interpolation algorithm based on techniques reported in the prior acoustic imaging literature. Separate healthy lung sound reference images were constructed individually for the microphone system and each stethoscope by obtaining baseline measurements without an obstructing water bag. Figure 7b shows an example healthy reference image—the results from the three systems appear visually similar for the homogeneous phantom case. Comparing images generated for the obstructed case to these healthy baselines helps highlight the system’s capability to detect and localize introduced attenuations caused by the water bag nidus.
Since commercial digital stethoscopes are inherently single-sensor devices, the breathing cycle [50,51] information was leveraged to reconstruct a simulated spatial array of lung sounds for generating acoustic images [28,29,52]. This aimed to evaluate obstruction localization using temporal features to emulate a multi-sensor imaging system. The respiration phase detection approach [51] has been shown to achieve accuracy within 0.2 s in prior studies, even with noisy lung sound inputs. A fifth-order FIR bandpass filter [51] with cutoff frequencies of 150 Hz and 1400 Hz was applied to extract predominant airway sounds by removing heart sounds, muscle noise, and aliasing components. Next, the Hilbert transform was used to obtain an analytic envelope of the filtered signal. Minima and maxima points of the envelope signify transitions between the inspiration and expiration phases of the breathing cycle. It provides phase synchronization cues to simulate spatial array data from the single stethoscope sensor timeline, as shown in Figure 8.

4.2. Signal Acquisition and Identification of Nidi Performance Index

The following sub-sections present the performance metrics for the acquired signal quality and identification of nidi length through imaging translated from the received lung signals.

4.2.1. Signal Acquisition Performance Index

Two quantitative metrics, RMSE and SNR, were used to evaluate signal accuracy and noise robustness. In this work, RMSE compares the normalized digital amplitude of the acquired signal r to the reference input signal x. It is calculated as the root mean square of the error between r and x, as shown in (4). A lower RMSE indicates better signal acquisition fidelity, where 0 indicates exact similarity. SNR measures the ratio between the desired signal and noise components in this work. SNR is computed by taking the logarithmic ratio of the normalized signal amplitude r and noise amplitude an in decibels, as shown in (5). A higher SNR indicates more robust noise suppression.
RMSE = 1 N i = 1 N x i r i 2 ,
where N is the total number of samples collected given as the sampling frequency multiplied by a known time.
SNR = 20 log 10 r a n ,
where an is the digital amplitude of the collected noise signals without the lung sound.

4.2.2. Acoustic Imaging Performance Index

Nidus detection through imaging was compared by analyzing the size and location of obstructed regions. The acquired acoustic images were converted into binary maps by using (2) and (3), presented in Figure 8. High-intensity data areas are indicated as 1 s, while obstructed zones with low-intensity data areas are represented as 0 s in the binary image with locally adaptive image thresholding [53]. By comparing the binary pixel differences between healthy η (control) and unhealthy images μ, the missing area (ημ) provides an estimate of the nidus length using prior pixel-area correlation methods given as Ln = 2 ( η μ ) / π . Smaller localization length differences versus ground truth obstructed sizes represent more accurate imaging. This analysis aims to quantify how precisely introduced attenuations and airway blockages are identified from the microphone and stethoscope recordings.

5. Results and Discussion

The sub-system performance, for example, the acquired signal quality between our system data acquisition and digital stethoscopes, is presented in Section 5.1. The identification of nidi through translating the acquired signals into imaging is shown in Section 5.2, and a general discussion and limitations of this work are presented in Section 5.3.

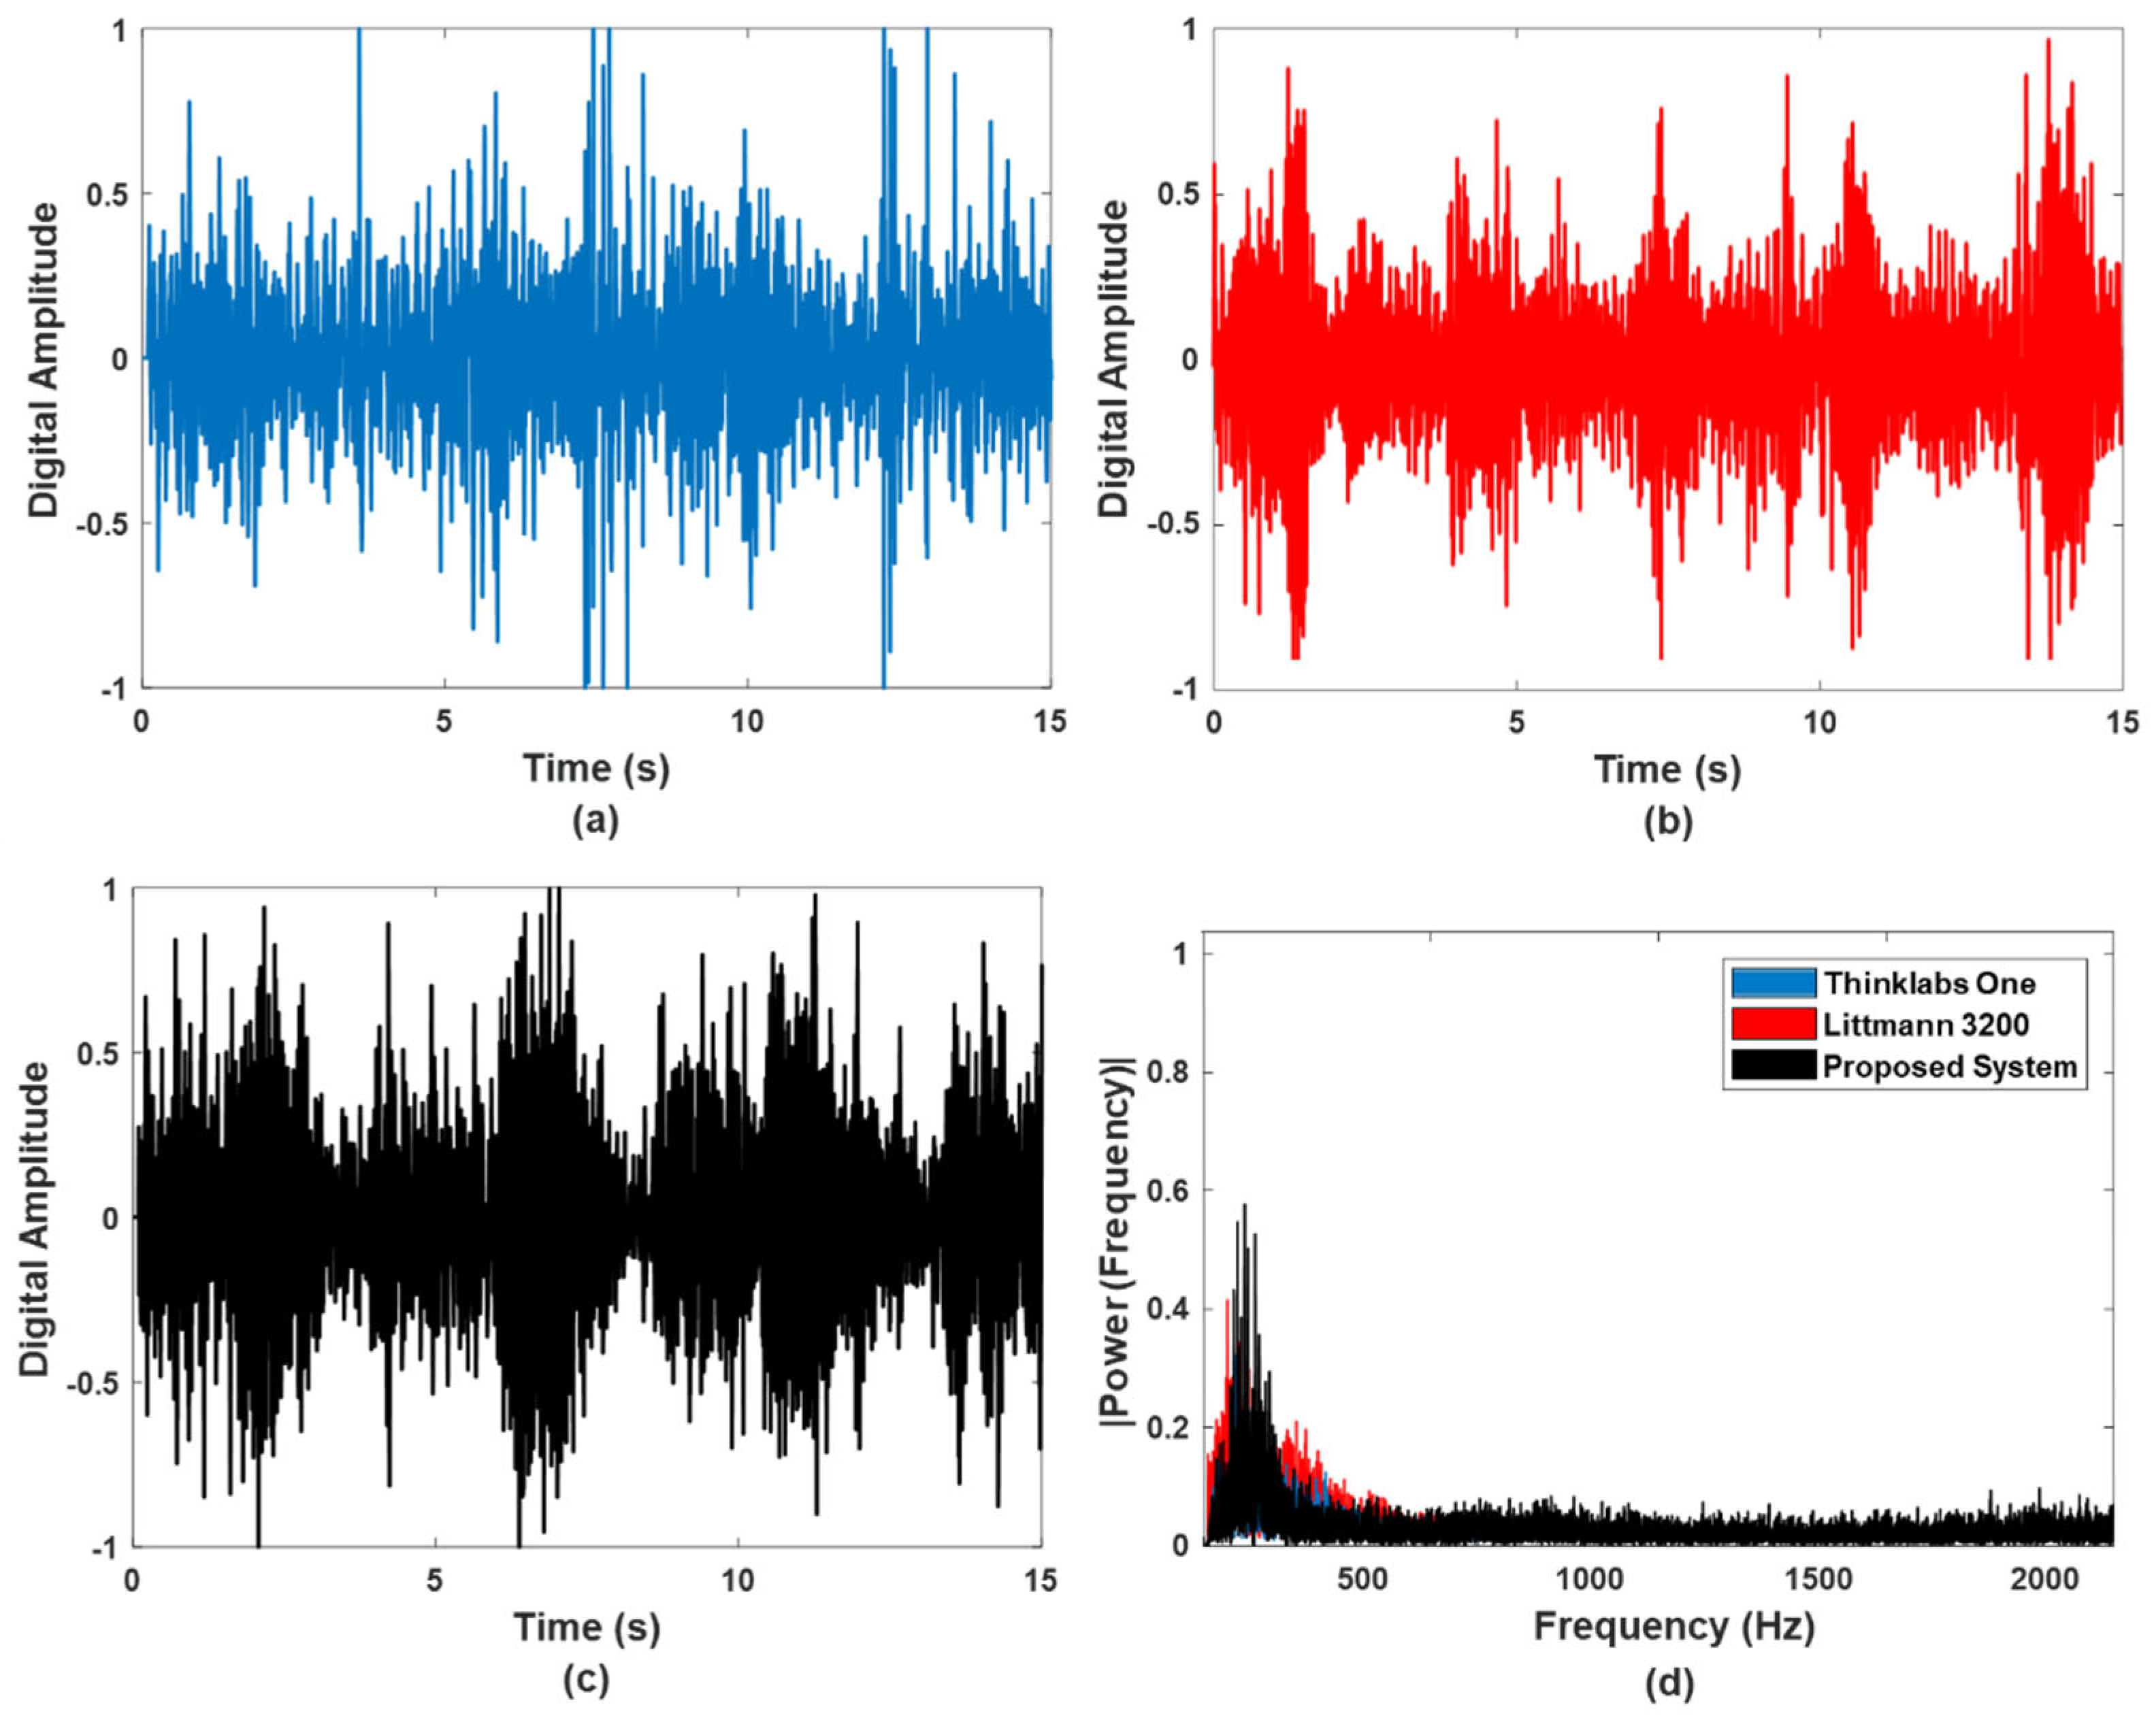
5.1. Signal Accuracy and Noise Robustness

Figure 9a presents the average RMSE results across the systems. RMSE evaluates signal accuracy by measuring the error between the acquired signal and reference input. A lower RMSE indicates better preservation of the key lung sound components, while higher values suggest distortion introduced by filtering or other effects. An ideal system balances noise suppression, shown by higher SNR, with minimizing signal errors as measured by lower RMSE. Unlike the commercial stethoscopes, the proposed microphone array system demonstrated both higher SNR and lower RMSE. The optimized denoising approach attained 0.15 better RMSE on average compared to the Littmann 3200 0.42 (0.02) and Thinklabs One 0.43 (0.02). This shows that the microphone array architecture using the configurable denoising algorithm can more accurately capture the relevant lung sound signatures while still rejecting noise.
Figure 9b displays the estimated signal-to-noise ratio (SNR) values averaged across all trials, lung sound samples, and background noise conditions for each system. SNR represents the ratio between the desired signal and unwanted noise components. Lower SNR values indicate more contamination from noise, resulting in poorer signal quality. Higher SNR values suggest the system has suppressed ambient interference and acquired the key lung sound signal components accurately. As shown in Figure 9b, all three systems demonstrated noise resilience in terms of preserving the SNR of the input signals, aligning with trends reported in prior works [19]. The commercial Littmann 3200 and Thinklabs One digital stethoscopes incorporate proprietary filtering techniques [10,11,38] to reduce noises from sources like ambient interference and body movement. The proposed microphone array system implements a configurable denoising algorithm to reject noise. Average SNRs (standard deviation) of around 25 (0.11) dB, 18 (0.07) dB, and 18 (0.08) dB were achieved by the proposed system, Littmann 3200, and Thinklabs One, respectively. The proposed system provided optimization of the denoising [38,39] approach for the highest SNR performance.
Figure 10 presents the time-domain performance of the proposed system and the commercial digital stethoscopes. The output waveform of the acquired lung sound signals in the time domain showed similar trends consistent with the known respiratory signals, as shown quantitatively in the RMSE results. All three systems provided consistent amplitude (intensity) without introducing significant variations that could distort the lung sound signals.
The comparable time domain output, SNR, and RMSE from Figure 9 and Figure 10 provide evidence that the proposed system demonstrates equivalent signal acquisitions compared to the commercial digital stethoscopes’ benchmark across relevant respiratory sound frequencies. In summary, the addition of the optimized denoising technique enabled the proposed system to surpass the commercial stethoscopes in both noise robustness, as measured by higher SNR, and signal accuracy, as measured by lower RMSE. This demonstrates the potential of the programmable multi-microphone array approach to balance noise suppression and lung sound fidelity through tailored filtering algorithms.

5.2. Acoustic Imaging

Figure 11 shows the binarized acoustic images representing obstructed airways for the proposed system and commercial stethoscopes. The imaging algorithm presented in (2) and (3) was applied to the acquired signals as the commercial digital stethoscopes do not natively output images. Water bags of 50 to 80 mm in diameter simulated airway obstructions.
An imaging system was demonstrated in the context of IoT, as shown in Figure 2 and Figure 3, where the patient wears the wearable sensor module consisting of the MEMS microphone array, microcontroller, and Bluetooth module, and the acoustic data can be transmitted over the cloud for the doctor’s analysis, and eventually, images can be formed after the lung signals’ analysis and conditioning on the doctor’s computer. The acquired lung sound signals can then be transmitted wirelessly via BLE to a gateway device like a smartphone or tablet. The gateway device then securely transmits the filtered data from the patient’s computer over the internet or a cloud server to the doctor’s computer and executes the signal processing and acoustic imaging algorithms.
To preserve the image and data quality for lung function assessment by the clinicians, the signal and image processing are recommended to be performed on a computer, as shown in Figure 2 and Figure 3. The signal data are about 8.64 MB for a sampling frequency of 8000 Hz and 3 bytes (24-bit MEMS microphone output) per sample, assuming 24 MEMS microphones and a recording duration of 15 s to enable real-time imaging through signal data transmission to the computer. More sensors can be deployed for higher resolution requirements, for example, increasing to 1000 sensors [12] with the same sampling rate and duration would produce approximately 360 MB of data. The higher throughput could be supported by 5G networks, enabling even more detailed real-time acoustic signals transmitted to the doctor’s computer for lung signal and image processing and analysis. Low-latency transmission from the 5G/6G capabilities can facilitate remote respiratory assessment with dense sensor arrays and allow for large acoustic data to be streamed continuously for real-time analysis and adjustment of therapy.
Figure 12 illustrates the relationship between sensor number and detectable obstruction size. The accuracy of the measured nidus length Ln compared to the known nidus length Lt is defined and shown in (6),
L n ( accuracy ) = 1 L n L t L t × 100 % .
As shown in Figure 11 and Figure 12, the proposed system achieved a 91% mean accuracy in detecting the true nidus length from the microphone array signals. The stethoscopes had an 85% mean accuracy. This suggests that multi-sensor noise resilience provides higher fidelity imaging and reliable signals that translate to more accurate acoustic representations [12,13,14,52]. The results in Figure 11 and Figure 12 demonstrate the potential for frequent regional lung assessments and targeted therapy via imaging. Thus, the reported MEMS microphone array system can be widely used in the IoT or IoMT-driven remote monitoring system for continual monitoring of the respiratory signals, which vastly reduces the frequency of contact between patients and doctors/clinicians and the transportation risk as described in Section 1 and Section 2.

5.3. General Discussion and Limitations

The study area of focus is the utilization of an array of MEMS microphones to record accurate acoustic lung signals to identify obstructions in the lung and improve the SNR with a wavelet-based denoising algorithm, minimizing the circuitry to make the proposed system more compact and wearable with applications in continual remote monitoring and IoT. The array of MEMS microphones offers a design guideline for developing acoustic imaging to assess airway obstructions. The MEMS microphones displayed accurate and good-quality captured acoustic signals in terms of RMSE and SNR. The wearable system also demonstrates similar trends to the commercial digital stethoscopes in terms of frequency and time-domain waveform.
The telemedicine approach addresses the limitations of current HFCWO practices by providing personalized, real-time feedback and facilitating dynamic therapy optimization based on the patient’s unique response. However, the system’s performance may be influenced by factors such as network connectivity, latency, and bandwidth constraints, which could impact the real-time transmission and visualization of acoustic images or videos for remote respiratory assessments. Ongoing improvements to network infrastructure will enable more immersive and effective telemedicine capabilities.
The proposed system’s sensor nodes are based on a MEMS microphone array, and the recorded data can be transmitted to a computer or mobile terminal via Bluetooth, as illustrated in Figure 1, Figure 2, Figure 3, Figure 4 and Figure 5. Adequate sensor geometry is needed [7,12,13,14,26,27,28,52,54] for reliable imaging despite per-sensor placement flexibility. Single sensors cannot localize obstructions, but the minimum 12-sensor array could detect an 80 mm nidus based on the acoustic field of view modeling [12,13,14]. Heart sound separation was not addressed since the focus was external noise rejection and accuracy in obtaining lung sound signals. Heart sound separation could be considered in future work to provide full lung exam capabilities. Furthermore, the current study did not specifically address the challenge of filtering out signals generated from internal organs, which could potentially interfere with the accurate analysis of lung sounds. Internal organ noises, such as those from the heart, digestive system, and other physiological processes, can introduce false positives or inaccuracies in the lung sound analysis. Future work could explore advanced signal processing techniques to effectively isolate and remove these unwanted signal components, ensuring the quality of lung sound data provided to clinicians.
The current manuscript lacks a thorough discussion of the ethical considerations and patient data privacy implications associated with such a system. This is an important limitation that must be addressed to ensure the responsible development and deployment of the technology. A strong emphasis on incorporating robust ethical frameworks and data privacy protocols into the design and implementation of the remote lung monitoring system can be included in future work, which will help to address the evolving ethical challenges and ensure the responsible deployment of the technology.
Variations in system performance are expected due to differences in physical design, architecture, and filtering approaches. The proprietary noise reduction methods of the commercial stethoscopes were utilized without additional processing. In contrast, the proposed system implements an adaptive denoising algorithm to suppress noise while retaining lung sounds. Furthermore, the microphone array provides uniform sensitivity versus a 10 dB drop towards the edges for the stethoscopes, likely due to transducer design tradeoffs. Overall, the proposed system combines specialized hardware and signal processing to enhance noise robustness and fidelity. While the experimental noise conditions aimed to simulate typical busy clinic levels, real-world environments contain unpredictable non-additive noise that may impact performance. Further testing in live clinical settings could provide additional insight.
The intention is not to definitively rank these systems based solely on the metrics presented. Rather, the goal is to benchmark the proposed array-based system against established digital stethoscopes and demonstrate feasibility for frequent regional lung assessments remotely via translated acoustical imaging. Without extensive clinical validation, the results should not be overinterpreted as direct evidence of diagnostic capabilities. The stethoscope models were chosen as representative cases, not as a comprehensive evaluation. The variations in noise response highlight differences in design approaches rather than overall quality.

6. Conclusions and Future Work

The continual monitoring of lung function through acoustic imaging, where the data are transmitted from the patient’s computer to the doctor’s computer for analysis, is presented in this study for the first time, using an array of MEMS microphones and a remote monitoring platform based on IoT. Acoustic signals collected from the array of MEMS microphones are transmitted via a Bluetooth module, and the signals are analyzed using MATLAB. The proposed system showed good acoustic sensing area sensitivity, high noise resolution in terms of SNR, and the accurate output of acoustic signals. Acoustic signals are uploaded to the cloud, enabling remote patient lung function monitoring and enabling the patient’s optimal respiratory therapy experience. Simulation studies were conducted using our proposed system and benchmarked with commercial digital stethoscopes to monitor acoustic lung signals from healthy patients and patients with respiratory diseases. The proposed system correlated with the actual lung signals. The feasibility of the proposed system for the continual remote assessment of lung function through acoustic imaging has been demonstrated from the measurement results, and it demonstrated potential in real-time monitoring and early detection of the worsening of respiratory disease conditions. Furthermore, the proposed system presented good potential usage as a lung imaging system in wearable healthcare applications due to the cost and straightforward fabrication (upscaling) options.
As part of future work, the proposed solution can be evaluated further via end-to-end systems (i.e., from the patient to doctor wirelessly) using upcoming 6G-related platforms. While 6G’s potential for telemedicine, in general, is promising, specific applications for lung acoustic imaging are still emerging at the time of writing as the technology is still in its early stages. However, based on the anticipated capabilities of 6G, there are some possibilities through ultra-high-fidelity lung auscultation. 6G’s high bandwidth could transmit intricate acoustic data without compression, allowing for a nuanced analysis of breath sounds, wheezing, crackles, and other abnormalities that might be missed with stethoscopes or lower-fidelity transmission. Another possibility exists through AI-powered lung analysis. With 6G’s immense data processing power, AI algorithms could analyze lung sounds and ultrasound images in real-time, providing doctors with insights and potential diagnoses during remote consultations. This could expedite diagnosis, improve accuracy through close to real-time digitalization, and potentially even enable the early detection of lung diseases.

Author Contributions

All authors contributed equally to the drafting of this paper, selection of the study, and the problem statement. M.M. contributed to the software integration and analysis in this study. C.-S.L. and Y.L. fabricated the hardware device and performed the simulation and experiment in this study. All authors analyzed the data in this study. M.L. was the alternative reviewer for the extracted data in the event where C.-S.L., Y.L. and M.M. could not agree on the analysis of the extracted data. M.M., M.L. and Y.L. contributed to the valuable discussions and revisions. Additionally, M.L. and Y.L. took on the supervisory role in this study. All authors have read and agreed to the published version of the manuscript.

Funding

This research was sponsored by Economic Development Board of Singapore.

Institutional Review Board Statement

Not applicable. The study did not involve humans or animals.

Informed Consent Statement

Not applicable. The study did not involve humans.

Data Availability Statement

Data are contained within the article.

Acknowledgments

The authors would like to take this opportunity to thank the editor, editorial team, and all anonymous reviewers for their effort and time in reviewing the manuscript, providing valuable comments and suggestions, and helping in improving the quality of the manuscript.

Conflicts of Interest

Author Yaolong Lou and Chang-Sheng Lee was employed by the company Hill-Rom Services Pte Ltd., Singapore. The company does not have influence on the data collected and analyzed. All authors declare that the research was conducted in the absence of any commercial or financial relationships that could be construed as a potential conflict of interest.

References

  1. Wang, D.Y.; Ghoshal, A.G.; Muttalif, A.R.B.A.; Lin, H.-C.; Thanaviratananich, S.; Bagga, S.; Faruqi, R.; Sajjan, S.; Brnabic, A.J.; Dehle, F.C.; et al. Quality of life and economic burden of respiratory disease in Asia-Pacific burden of respiratory diseases study. Value Heal. Reg. Issues 2016, 9, 72–77. [Google Scholar] [CrossRef]
  2. Bahadori, K.; Doyle-Waters, M.M.; Marra, C.; Lynd, L.; Alasaly, K.; Swiston, J.; FitzGerald, J.M. Economic burden of asthma: A systematic review. BMC Pulm. Med. 2009, 9, 24. [Google Scholar] [CrossRef] [PubMed]
  3. McIlwaine, M.; Bradley, J.; Elborn, J.S.; Moran, F. Personalising airway clearance in chronic lung disease. Eur. Respir. Rev. 2017, 26, 160086. [Google Scholar] [CrossRef]
  4. Franssen, F.M.; Alter, P.; Bar, N.; Benedikter, B.J.; Iurato, S.; Maier, D.; Maxheim, M.; Roessler, F.K.; Spruit, M.A.; Vogelmeier, C.F.; et al. Personalized medicine for patients with COPD: Where are we? Int. J. Chronic Obstr. Pulm. Dis. 2019, 14, 1465–1484. [Google Scholar] [CrossRef] [PubMed]
  5. Ohashi, C.; Akiguchi, S.; Ohira, M. Development of a remote health monitoring system to prevent frailty in elderly home-care patients with COPD. Sensors 2022, 22, 2670. [Google Scholar] [CrossRef] [PubMed]
  6. Janjua, S.; Carter, D.; Threapleton, C.J.; Prigmore, S.; Disler, R.T. Telehealth interventions: Remote monitoring and consultations for people with chronic obstructive pulmonary disease (COPD). Cochrane Database Syst Rev. 2021, 7, CD013196. [Google Scholar] [CrossRef] [PubMed]
  7. Rao, A.; Huynh, E.; Royston, T.J.; Kornblith, A.; Roy, S. Acoustic methods for pulmonary diagnosis. IEEE Rev. Biomed. Eng. 2018, 12, 221–239. [Google Scholar] [CrossRef] [PubMed]
  8. Lee, C.-S.; Li, M.; Lou, Y.; Abbasi, Q.H.; Imran, M.A. Acoustic lung imaging utilized in continual assessment of patients with obstructed airway: A systematic review. Sensors 2023, 23, 6222. [Google Scholar] [CrossRef] [PubMed]
  9. Ward, J.J.; Wattier, B.A. Technology for enhancing chest auscultation in clinical simulation. Respir. Care 2011, 56, 834–845. [Google Scholar] [CrossRef]
  10. 3M Littmann Electronic Stethoscope Model 3200. Available online: https://multimedia.3m.com/mws/media/594115O/3m-littmann-electronic-stethoscope-model-3200-user-manual.pdf (accessed on 23 November 2023).
  11. ThinklabsOne. Available online: https://www.thinklabs.com/ (accessed on 23 November 2023).
  12. Lee, C.S.; Lou, Y.; Li, M.; Abbasi, Q.H.; Imran, M.A. Locating nidi for high-frequency chest wall oscillation smart therapy via acoustic imaging of lung airways as a spatial network. IEEE Access 2023, 11, 109408–109421. [Google Scholar] [CrossRef]
  13. Lee, C.S.; Li, M.; Lou, Y.; Dahiya, R. Modeling and simulation of pulmonary acoustic signal and imaging for lung function assessment. In Proceedings of the 2023 IEEE International Conference on Consumer Electronics (ICCE), Las Vegas, NV, USA, 6–8 January 2023; pp. 1–6. [Google Scholar]
  14. Lee, C.S.; Li, M.; Lou, Y.; Dahiya, R. The Effect of sensor array design on acoustic imaging for enhancing HFCWO therapy. In Proceedings of the 2023 20th International Multi-Conference on Systems, Signals & Devices (SSD), Mahdia, Tunisia, 20–23 February 2023; pp. 887–892. [Google Scholar]
  15. Szem, J.W.; Hydo, L.J.; Fischer, E.; Kapur, S.; Klemperer, J.; Barie, P.S. High-risk intrahospital transport of critically ill patients: Safety and outcome of the necessary “road trip”. Crit. Care Med. 1995, 23, 1660–1666. [Google Scholar] [CrossRef] [PubMed]
  16. Beckmann, U.; Gillies, D.M.; Berenholtz, S.M.; Wu, A.W.; Pronovost, P. Incidents relating to the intra-hospital transfer of critically ill patients. Intensiv. Care Med. 2004, 30, 1579–1585. [Google Scholar] [CrossRef] [PubMed]
  17. De Alwis, C.; Pham, Q.-V.; Liyanage, M. 6G for healthcare. In 6G Frontiers: Towards Future Wireless Systems; Wiley-IEEE Press: Hoboken, NJ, USA, 2023; pp. 189–196. [Google Scholar]
  18. William, M.; Sharif, S.; Ejaz, W. Enabling communication and networking technologies for 6G in healthcare sector. In Proceedings of the 2023 Second International Conference on Smart Technologies for Smart Nation (SmartTechCon), Singapore, 18–19 August 2023; pp. 699–704. [Google Scholar]
  19. McLane, I.; Emmanouilidou, D.; West, J.E.; Elhilali, M. Design and comparative performance of a robust lung auscultation system for noisy clinical settings. IEEE J. Biomed. Heal Inform. 2021, 25, 2583–2594. [Google Scholar] [CrossRef] [PubMed]
  20. Lee, C.S.; Li, M.; Lou, Y.; Dahiya, R. Design of a robust lung sound acquisition system for reliable acoustic lung imaging. In Proceedings of the 2023 IEEE International Ultrasonics Symposium (IUS), Montreal, QC, Canada, 3–8 September 2023; pp. 1–4. [Google Scholar]
  21. Liu, H.; Barekatain, M.; Roy, A.; Liu, S.; Cao, Y.; Tang, Y.; Shkel, A.; Kim, E.S. MEMS piezoelectric resonant microphone array for lung sound classification. J. Micromech. Microeng. 2023, 33, 044003. [Google Scholar] [CrossRef] [PubMed]
  22. Gupta, P.; Moghimi, M.J.; Jeong, Y.; Gupta, D.; Inan, O.T.; Ayazi, F. Precision wearable accelerometer contact microphones for longitudinal monitoring of mechano-acoustic cardiopulmonary signals. npj Digit. Med. 2020, 3, 19. [Google Scholar] [CrossRef]
  23. Duanmu, Z.; Kong, C.; Guo, Y.; Zhang, X.; Liu, H.; Zhao, C.; Gong, X.; Cai, C.; Ho, C.; Wan, C. Design and implementation of an acoustic-vibration capacitive MEMS microphone. AIP Adv. 2022, 12, 065309. [Google Scholar] [CrossRef]
  24. Shah, M.A.; Shah, I.A.; Lee, D.-G.; Hur, S. Design approaches of MEMS microphones for enhanced performance. J. Sens. 2019, 2019, 9294528. [Google Scholar] [CrossRef]
  25. Zawawi, S.A.; Hamzah, A.A.; Majlis, B.Y.; Mohd-Yasin, F. A review of MEMS capacitive microphones. Micromachines 2020, 11, 484. [Google Scholar] [CrossRef]
  26. Charleston-Villalobos, S.; Cortés-Rubiano, S.; González-Camerena, R.; Chi-Lem, G.; Aljama-Corrales, T. Respiratory acoustic thoracic imaging (RATHI): Assessing deterministic interpolation techniques. Med. Biol. Eng. Comput. 2004, 42, 618–626. [Google Scholar] [CrossRef]
  27. Charleston-Villalobos, S.; Gonzalez-Camarena, R.; Chi-Lem, G.; Aljama-Corrales, T. Acoustic thoracic images for transmitted glottal sounds. In Proceedings of the 2007 29th Annual International Conference of the IEEE Engineering in Medicine and Biology Society, Lyon, France, 22–26 August 2007; pp. 3481–3484. [Google Scholar]
  28. Kompis, M.; Pasterkamp, H.; Wodicka, G.R. Acoustic imaging of the human chest. Chest 2001, 120, 1309–1321. [Google Scholar] [CrossRef] [PubMed]
  29. Lev, S.; Glickman, Y.A.; Kagan, I.; Shapiro, M.; Moreh-Rahav, O.; Dahan, D.; Cohen, J.; Grinev, M.; Singer, P. Computerized lung acoustic monitoring can help to differentiate between various chest radiographic densities in critically ill patients. Respiration 2010, 80, 509–516. [Google Scholar] [CrossRef] [PubMed]
  30. Manwar, R.; Zafar, M.; Xu, Q. Signal and image processing in biomedical photoacoustic imaging: A review. Optics 2020, 2, 1–24. [Google Scholar] [CrossRef]
  31. Dellinger, R.P.; Parrillo, J.E.; Kushnir, A.; Rossi, M.; Kushnir, I. Dynamic Visualization of lung sounds with a vibration response device: A case series. Respiration 2007, 75, 60–72. [Google Scholar] [CrossRef] [PubMed]
  32. Shi, C.; Boehme, S.; Bentley, A.H.; Hartmann, E.K.; Klein, K.U.; Bodenstein, M.; Baumgardner, J.E.; David, M.; Ullrich, R.; Markstaller, K. Assessment of regional ventilation distribution: Comparison of vibration response imaging (VRI) with electrical impedance tomography (EIT). PLoS ONE 2014, 9, e86638. [Google Scholar] [CrossRef] [PubMed]
  33. Yigla, M.; Gat, M.; Meyer, J.-J.; Friedman, P.J.; Maher, T.M.; Madison, J.M. Vibration response imaging technology in healthy subjects. Am. J. Roentgenol. 2008, 191, 845–852. [Google Scholar] [CrossRef] [PubMed]
  34. Lee, C.S.; Li, M.; Lou, Y.; Abbasi, Q.H.; Imran, M. An acoustic system of sound acquisition and image generation for frequent and reliable lung function assessment. IEEE Sens. J. 2023, 24, 3731–3747. [Google Scholar] [CrossRef]
  35. C. TDK Group. ICS-52000. Available online: https://invensense.tdk.com/products/ics-52000/ (accessed on 23 November 2023).
  36. Gregtomasch. Bluetooth Low Energy (BLE) Connectivity for Teensy 3.X Boards. Available online: https://github.com/gregtomasch/Tlera_nRF52_MCU_Add_On_Board/tree/master/ble_app_uart_c_Add_on (accessed on 22 November 2023).
  37. NORDIC. Versatile Bluetooth 5.4 SoC supporting Bluetooth Low Energy, Bluetooth Mesh and NFC. Available online: https://infocenter.nordicsemi.com/index.jsp (accessed on 22 November 2023).
  38. Lee, C.S.; Li, M.; Lou, Y.; Dahiya, R. Restoration of lung sound signals using a hybrid wavelet-based approach. IEEE Sens. J. 2022, 22, 19700–19712. [Google Scholar] [CrossRef]
  39. Ding, Y.; Selesnick, I.W. Artifact-free wavelet denoising: Non-convex sparse regularization, convex optimization. IEEE Signal Process. Lett. 2015, 22, 1364–1368. [Google Scholar] [CrossRef]
  40. Meng, F.; Wang, Y.; Shi, Y.; Zhao, H. A kind of integrated serial algorithms for noise reduction and characteristics expanding in respiratory sound. Int. J. Biol. Sci. 2019, 15, 1921–1932. [Google Scholar] [CrossRef] [PubMed]
  41. Ulukaya, S.; Serbes, G.; Kahya, Y.P. Performance comparison of wavelet based denoising methods on discontinuous adventitious lung sounds. In Proceedings of the 2017 39th Annual International Conference of the IEEE Engineering in Medicine and Biology Society (EMBC), Jeju Island, Republic of Korea, 11–15 July 2017; pp. 2928–2931. [Google Scholar]
  42. Rocha, B.M.; Filos, D.; Mendes, L.; Serbes, G.; Ulukaya, S.; Kahya, Y.P.; Jakovljevic, N.; Turukalo, T.L.; Vogiatzis, I.M.; Perantoni, E.; et al. An open access database for the evaluation of respiratory sound classification algorithms. Physiol. Meas. 2019, 40, 035001. [Google Scholar] [CrossRef] [PubMed]
  43. Kraman, S.S. Transmission of lung sounds through light clothing. Respiration 2007, 75, 85–88. [Google Scholar] [CrossRef] [PubMed]
  44. Gupta, P.; Wen, H.; Di Francesco, L.; Ayazi, F. Detection of pathological mechano-acoustic signatures using precision accelerometer contact microphones in patients with pulmonary disorders. Sci. Rep. 2021, 11, 13427. [Google Scholar] [CrossRef] [PubMed]
  45. Frequency Response Graph (Bose S1 Pro System). Available online: https://www.rtings.com/speaker/0-8/graph#6982/4559 (accessed on 22 November 2023).
  46. Darbyshire, J.L.; Müller-Trapet, M.; Cheer, J.; Fazi, F.M.; Young, J.D. Mapping sources of noise in an intensive care unit. Anaesthesia 2019, 74, 1018–1025. [Google Scholar] [CrossRef] [PubMed]
  47. British Broadcasting. Corporation. (BBC). Sound Effects. Available online: https://sound-effects.bbcrewind.co.uk/search?q=Intensive%20care%20unit (accessed on 22 November 2023).
  48. The Audio Filter in Your One. Available online: http://thinklabsone.com/downloads/Stethoscope_Filters.pdf (accessed on 22 November 2023).
  49. Salehin, S.A.; Abhayapala, T.D. Lung sound localization using array of acoustic sensors. In Proceedings of the 2008 2nd International Conference on Signal Processing and Communication Systems (ICSPCS 2008), Gold Coast, Australia, 15–17 December 2008; pp. 1–5. [Google Scholar]
  50. Messner, E.; Hagmüller, M.; Swatek, P.; Pernkopf, F. A Robust multichannel lung sound recording device. In Proceedings of the 9th International Conference on Biomedical Electronics and Devices, Rome, Italy, 21 February 2016; pp. 34–39. [Google Scholar]
  51. Skalicky, D.; Koucky, V.; Hadraba, D.; Viteznik, M.; Dub, M.; Lopot, F. Detection of respiratory phases in a breath sound and their subsequent utilization in a diagnosis. Appl. Sci. 2021, 11, 6535. [Google Scholar] [CrossRef]
  52. Bing, D.; Jian, K.; Long-Feng, S.; Wei, T.; Hong-Wen, Z. Vibration response imaging: A novel noninvasive tool for evaluating the initial therapeutic effect of noninvasive positive pressure ventilation in patients with acute exacerbation of chronic obstructive pulmonary disease. Respir. Res. 2012, 13, 65. [Google Scholar] [CrossRef] [PubMed]
  53. Bradley, D.; Roth, G. Adaptive thresholding using the integral image. J. Graph. Tools 2007, 12, 13–21. [Google Scholar] [CrossRef]
  54. Dellinger, R.P.; Jean, S.; Cinel, I.; Tay, C.; Rajanala, S.; Glickman, Y.A.; Parrillo, J.E. Regional distribution of acoustic-based lung vibration as a function of mechanical ventilation mode. Crit. Care 2007, 11, R26. [Google Scholar] [CrossRef] [PubMed]
Figure 1. Proposed IoT system architecture transmitting acoustic lung signals from a wearable microphone array via Bluetooth to the patient’s computer for processing, then over a 5G/6G network to the doctor’s computer for analysis and real-time therapy adjustment through cloud connectivity.
Electronics 13 01669 g001
Figure 2. The process flow of the proposed system for remote and continual lung function monitoring.
Electronics 13 01669 g002
Figure 3. Overview of the proposed system hardware components. (a) Digital pin connection between nRF52832, MEMS microphone, and the Teensy 3.6 microcontroller for capturing lung sound signals; (b) the ICS-52000 MEMS microphone digital pin and its modules; (c) the proposed system overview; and (d) the interconnection between the array of MEMS microphones and the flexible printed cable.
Electronics 13 01669 g003
Figure 4. Overview of the connections between daisy-chained MEMS microphones and microcontroller. (a) System block diagram of digital pin connections for an array of MEMS microphones; (b) Teensy 3.6 boards’ connection for multiple arrays of a maximum of 16 MEMS microphones each, with the first Teensy 3.6 board as a control (master) with an activation switch and the subsequent Teensy 3.6 boards as slaves. Grey represents the ground connection, and blue represents the interconnection of digital pin 4 (SDA2).
Electronics 13 01669 g004
Figure 5. Proposed system’s input and output flow of the acoustic signal. (a) The proposed system’s software process flow chart; and (b) the proposed system’s acoustic signal processing flow chart.
Electronics 13 01669 g005
Figure 6. The setup for acquiring lung sound signals. (a) The lung sound simulator and its block diagram; and (b) the capturing of resampled lung sound signals flow chart.
Electronics 13 01669 g006
Figure 7. The experimental set for the acquisition of lung signals and imaging. (a) The schematic diagram of the experimental setup for capturing lung sound signals and nidus detection in the airways with waterbags. x denotes the positions of the acoustic sensors, such as MEMS microphones and digital stethoscopes. The blue circular block presents an obstruction in the airways. (b) Binarized acoustic imaging is used to analyze experimental results, and the control (healthy) is shown for comparison purposes.
Electronics 13 01669 g007
Figure 8. Synchronization of an array of lung signals captured at different times via the breathing phase. Blue denotes the asynchronous lung signals captured due to single point data. Red represents the synchronized lung signals via the breathing phase.
Electronics 13 01669 g008
Figure 9. The captured signal quality with commercial digital stethoscopes as a benchmark. (a) The mean RMSE result between the three sensors capturing lung sound signals in a noisy environment. RMSE is unitless as all three sensors output normalized digital amplitude. (b) The mean SNR performance between various sensors capturing lung sound signals in a noisy environment.
Electronics 13 01669 g009
Figure 10. Recorded digital amplitude in relation to the respiratory sound signals and the frequency spectrum of the recorded lung signals. (a) Thinklabs One time-domain respiratory signals’ output, (b) Littmann 3200 time-domain respiratory signals’ output, (c) proposed system time-domain respiratory signals’ output, and (d) the frequency of interest for the three devices.
Electronics 13 01669 g010
Figure 11. Acoustic imaging of obstructed airway translated from acquired lung signals with 50 mm nidus length via the waterbag simulation, where the encircled dotted line indicates the actual waterbag size. (a) Thinklabs One, (b) Littmann 3200, and (c) the proposed system.
Electronics 13 01669 g011
Figure 12. Comparison between the proposed system and digital stethoscopes in detecting a nidus through acoustic imaging with (a) 18 and (b) 30 sensors.
Electronics 13 01669 g012
Disclaimer/Publisher’s Note: The statements, opinions and data contained in all publications are solely those of the individual author(s) and contributor(s) and not of MDPI and/or the editor(s). MDPI and/or the editor(s) disclaim responsibility for any injury to people or property resulting from any ideas, methods, instructions or products referred to in the content.

