Article

Urban Flood Risk Assessment Based on a Combination of Subjective and Objective Multi-Weight Methods

1
College of Hydrology and Water Resources, Hohai University, Nanjing 210098, China
2
State Key Laboratory of Hydrology-Water Resources and Hydraulic Engineering, Hohai University, Nanjing 210098, China
3
Design and Research Institute Co., Ltd., Hohai University, Nanjing 210098, China
4
Ningbo Hong Tai Water Conservancy Information Technology Co., Ltd., Ningbo 315000, China
*
Author to whom correspondence should be addressed.
Submission received: 22 February 2024 / Revised: 22 April 2024 / Accepted: 23 April 2024 / Published: 26 April 2024

Abstract

:
Against the backdrop of global warming and rising sea levels coupled with increasing urbanization, flood risks for plain cities have intensified. This study takes Liaocheng City as its research object and constructs a regional flood risk assessment model based on a combination of subjective and objective multi-weight methods. The model sets weights according to different return periods from three perspectives: the severity of disaster-causing factors, the exposure of disaster-prone environments, and the vulnerability of disaster-bearing bodies. It also uses a subjective–objective combination of weights for the severity of disaster-causing factors, adopts CRITIC-entropy weights for the exposure of disaster-prone environments and vulnerability of disaster-bearing bodies, and adopts AHP subjective weights for the criterion layer. Based on GIS spatial analysis technology, the examination and zoning of flood disasters at a county scale were carried out. The results show that, unlike the existing weighting methods and machine learning methods, this multi-weight combination method can simultaneously avoid the subjectivity of the results and the uncertainty of parameters, thus enabling more accurate decision-making results to be obtained. The spatial distribution of the comprehensive risk is high in the central and western parts and relatively low in the south and north, while the area characterized by very high risk is concentrated in Dongchangfu District and Guanxian County. With the gradual increase in return periods, the overall spatial distribution of medium-to-very-high-risk areas in risk zoning gradually shrinks, and the spatial distribution of very-high-risk areas gradually moves south but maintains a stable distribution rule. Flood risk assessment is an important basic process for disaster prevention and mitigation in plain cities, and the results of this study can provide a reference for similar plain cities.

1. Introduction

Global warming is increasing the incidence of catastrophic weather and extreme weather events [1,2,3,4]. Of these, flooding is one of the most destructive, widespread, and frequent natural disasters [5,6,7]. Flooding has also become one of the most serious natural disasters in plain cities in terms of loss of life, property, and frequency of occurrence [8]. At the same time, the frequency and intensity of floods are expected to continue to increase in the coming years as a result of sea-level rise and more frequent extreme precipitation events [9,10,11,12,13]. Urban flood disasters have become an outstanding problem affecting urban public safety and a significant factor restricting the country’s economic and social development. With rapid urbanization, the form and mechanism of urban flooding in the plains are undergoing drastic changes, and the risk of urban flooding is showing a rising trend. Flood risk assessment and zoning constitute an important part of the implementation of risk management [14]; it is a complex, systematic project to analyze, assess, prevent, and respond to urban flood risks. The results can provide a scientific basis for disaster relief and mitigation, raising awareness of flood risk prevention among the public and helping flood prevention and mitigation departments take effective measures to deal with floods [15]. Therefore, it is imperative to strengthen systematic research on urban flood risk assessment.
Flood risk has always been a key area of concern for the international community. At present, many scholars at home and abroad have used a variety of methods to carry out research on urban flooding and have achieved certain research results [16,17,18,19,20,21,22,23]. In terms of assessment methods, the existing studies can be broadly classified into the following types: First, a flood scenario simulation is carried out with a hydrological–hydraulic model. For example, V. Anselmoa et al. used a two-dimensional hydrodynamic model to simulate floods for risk assessment in flood-prone areas [24,25,26]. Ye et al. used Infoworks ICM to establish a coupled hydrological–hydrodynamic model for flood simulation and risk evaluation of the Baima River area in Fuzhou City, China [27]. Wu et al. carried out a flood disaster risk assessment on Haidian Island with different rainfall intensity combinations based on a PCSWMM model [28]. Second, high-resolution measurement technology is used to collect data and carry out flood disaster risk assessment. For example, Wang et al. used radio frequency technology (RF) for regional flood hazard risk assessment [13]. Islam et al. assessed flood zones and flood risk in Bangladesh based on NOAA AVHRR data using remote sensing technology (RS) and GIS systems [29]. Salandra et al. combined unmanned aerial vehicles (UAVs) and structure from motion (SfM) photogrammetry technology to collect and process high-resolution data as needed for flood disaster risk assessment [30]; Trepekli et al. used miniaturized light and detection ranging (LiDAR) scanners mounted on unmanned aerial vehicles (UAVs) to generate a digital terrain model (DTMs) with ultra-high-altitude resolution and simulate the flooded area through the hydrological screening model (Arc-Malstrom), thus achieving the purpose of flood disaster risk assessment [31]. Thirdly, the indicator system is constructed by using the AHP method, the entropy weighting method, the CRITIC weighting method, etc., for flood risk assessment. For example, Liu et al. used the GIS and AHP methods for flood risk assessment in the Huaihe River Basin and employed the formula of the “Plus” model to obtain a comprehensive risk evaluation map of flood disasters [32]. Bathrellos et al. quantitatively analyzed the drainage network of a river, applied AHP in a GIS system, examined the effect of uncertainty in the factor values on the results of the flood hazard evaluation, and produced a corresponding urban flood hazard evaluation map [33]. Li et al. applied the entropy weight and gray target evaluation model methods to construct a risk evaluation model of heavy rainfall and flooding in southern Shaanxi and combined GIS spatial analysis technology to zone the risk of heavy rainfall and flooding in southern Shaanxi [34]. Sun et al. proposed a multi-criteria decision analysis (MCDA) model for urban flood risk evaluation, using the fuzzy hierarchical analysis method (FAHP), the entropy weighting method (EWM), and a subjective–objective combination of weighting methods to determine the weights, and drew a map of the flood risk distribution in Beijing City [35]. Cheng et al. evaluated the flood vulnerability of 76 cities in the Yellow River Basin from 2009 to 2018 using the CRITIC-entropy weighting method and the fuzzy comprehensive evaluation method [36]. Jia et al. assigned weights to various flooding factors through the AHP-entropy weighting method and analyzed and carried out a risk assessment of heavy rainfall and flooding in Guangxi with the help of GIS technology [37]. Fourthly, random forests, neural networks, and other machine learning methods are used to evaluate the risk of flood disasters. For example, Bahram et al. considered the return period in spatial modeling using machine learning (ML) models to determine flood hazard areas [38]. Asiri et al. used multi-criteria decision-making for coastal flood risk assessment using a machine learning approach [39]; Wang et al. used a random forest model to calculate the contribution rate of each indicator, optimized the indicator system based on the ranking results, and used the XGBoost model to assign weights to the optimized indicator system and assess the flood risk of Yichang City [40].
However, existing studies have given insufficient consideration to the extent of flooding caused by different factors when assigning weights to indicators, and the lack of optimization of the indicator system has limited the objectivity of the assessment results. The scenario simulation method based on hydrodynamic models cannot provide a comprehensive risk assessment of flooding due to the lack of potential surface and socio-economic factors; remote-sensing-based techniques require high classification accuracy and data matching [8]. Using a single-weighting method can easily lead to insufficient accuracy in assessing urban flood risk characteristics. The optimal values of the indicators it determines are somewhat subjective and uncertain. The modeling method of the machine learning model requires a large number of parameters, and insufficient or incorrect parameters can affect the accuracy of the data. The indicator system approach is the most widely used because it can show the flood risk situation in macro-regions or larger-scale regions, and the calculation method is relatively simple. In the indicator system method, the allocation of indicator weights is a key step in determining the accuracy of risk assessment, and the commonly used indicator assignment methods can be divided into two types: subjective and objective assignment methods. The subjective assignment method represented by the AHP method analyzes more from a qualitative perspective and relies too much on expert knowledge, which limits the objectivity of the assessment results; the objective assignment method represented by the entropy weight method is easily affected by the distribution of the original data, and it is difficult to ensure the stability of the assessment results. This study adopts the subjective–objective combination assignment method to assess the risk of disaster-causing factors, the CRITIC-entropy weighting method to measure the exposure of disaster-containing environments and the vulnerability of disaster-carrying bodies, and the AHP subjective assignment method to examine the criterion layer. Additionally, the subjective–objective combination of the assignment method means that subjective factors can be combined with objective factors so as to arrive at a quicker and more accurate decision-making result [41,42,43]. Compared with the scenario simulation method of the hydrodynamic model, the subjective–objective combination assignment method has a wide calculation range and can include surface and social factors. Compared with the use of remote sensing technology to collect data for the assessment of flood disasters, the subjective–objective combination assignment method does not need high-precision data to complete the assessment of flood disaster risk. Compared with the single-assignment method, the subjective–objective combination assignment method has fully taken into account the role of experts’ experience and objective data to make the results more accurate, and compared with the machine learning model, it does not need a large amount of parameter support to complete the assessment quickly and accurately. Compared with the single assignment method, the subjective–objective combination assignment method can complete the assessment quickly and accurately without the support of a large number of parameters. However, combined assignment methods still cannot completely avoid the influence of the original data distribution, so there are potential limitations.
In view of this, this study takes Liaocheng City as the research object and constructs a regional flood risk assessment model based on a combination of subjective and objective multi-weight methods. The model sets weights according to different return periods from three perspectives: the severity of disaster-causing factors, the exposure of disaster-prone environments, and the vulnerability of disaster-bearing bodies. It also adopts subjective–objective combination of weights for the severity of disaster-causing factors, adopts CRITIC-entropy weights for the exposure of disaster-prone environments and vulnerability of disaster-bearing bodies, adopts AHP subjective weights for the criterion layer, establishes an evaluation index system of urban flood disaster risk, and evaluates the multi-year flood disaster risk of the city using GIS spatial analysis technology. It combines this with the process of urbanization, analyzes urban flood disaster risk at the county scale, and employs zoning with the goal of providing relevant managers with important disaster risk information. This urban flood risk assessment model based on a combination of subjective and objective multi-weight methods fully considers the role of expert experience and objective data, makes up for the shortcomings brought by single weighting and machine learning models, and can simultaneously avoid the subjectivity of results and uncertainty of parameters, thus obtaining more accurate decision-making results and evaluating urban flood disaster risks more scientifically. This study represents an important basic work for disaster prevention and mitigation in plain cities. To date, the application of subjective and objective assignment methods in flood disaster assessment is uncommon; therefore, it is necessary to use this method to carry out research on flood disaster risk assessment, which is of great significance for achieving improvements in urban flood disaster prevention, risk level classification, and the promotion of economic development. Meanwhile, the application of such innovative combination methods also provides ideas for urban flood risk assessment in similar plain cities.

2. Materials and Methods

Considering the natural environment and socio-economic characteristics of Liaocheng City, this study adopts GIS spatial analysis and the flood risk assessment model to analyze and zone urban flood disasters at the county scale [8].

2.1. Source of Data

According to the evaluation index system, this study relies on yearbook information and the Internet to collect data, which are divided into four categories: meteorological and hydrological data, basic geographic data, remote sensing image data, and socio-economic data [44]. See Table 1.

2.2. Indicator Selection

Based on the hydrological yearbook, national meteorological data, the statistical yearbook, GIS extracted data, etc., for this study, we screened out 19 urban flood risk evaluation indicators from three perspectives: disaster-causing factors, exposure to the disaster-bearing environment, and vulnerability of the disaster-bearing body. Thus, we constructed the Liaocheng City Flood Risk Assessment Indicator System. See Table 2.
Disaster-causing factors refer to the various factors that may cause casualties, property damage, social unrest, etc., in various environments. Heavy precipitation is one of the main causes of flooding in Liaocheng City. Based on the day-by-day precipitation data collected between 1950 and 2020, the P-III frequency curve was used to fit the line, and the weights were set for each of the four return periods: 10 years, 50 years, 100 years, and 200 years. Seven indicators, namely, maximum 24 h rainfall, maximum 3-day rainfall, flood frequency, average annual precipitation, and precipitation variability of light rainfall, moderate rainfall, and heavy rainfall, were selected as the causative factors.
A disaster-prone environment is a natural and human environment that nurtures the occurrence of disasters, such as floods. The natural environment exposed to the influence of disaster-causing factors has an indirect influence on the occurrence of internal floods, and it is this environment that reflects the formation of waterlogging. Among them, changes in the type of subsurface, river and lake systems, and topography are the keys to the risk of an urban flood disaster and its degree. To determine the disaster-prone environment of Liaocheng City, we mainly took into account the hydrological and geomorphological environments as well as four indicators, namely, the river network density, average elevation, average slope, and vegetation coverage.
A disaster-bearing body can be characterized by various disaster risk factors, such as the population; people represent the main body affected and damaged by disasters. These factors also include urban roads, agriculture, industry, and other aspects. For this study, eight indicators, including population density, road density, and economic density, were selected to identify disaster-bearing bodies according to the aspects of population, urban roads, economy, agriculture, and healthcare. Among them, changes in population density, road density, and rural population were positively related to the vulnerability of disaster-bearing bodies, while changes in economic density, the average production value of primary, secondary, and tertiary industries, and the density of medical institutions were inversely related to the vulnerability of disaster-bearing bodies.

2.3. Combination of Multi-Weight Methods

To address the problem of insufficient accuracy of urban flood risk characteristics caused by a single assignment, the subjective–objective combination assignment method was adopted for the risk of disaster-causing factors, the CRITIC-entropy weight objective assignment method was adopted for the exposure of disaster-containing environments and the vulnerability of disaster-bearing bodies, and the AHP subjective assignment method was adopted for the criterion layer. This assignment makes up for the shortcomings of single assignments, achieves unity and complementarity between the subjective and objective assignments, and enables the risk of urban flooding to be evaluated in a more scientific way.
Due to the different data sources and their dimensions and large range of values, it is necessary to standardize the data between 0 and 1. The Grid Calculator in ARCGIS 10.0 is used to standardize rainfall grid data, topographic standard deviation data, etc. Therefore, prior to the assignment, the data matrix was constructed, and the data were normalized. The specific calculation method is as follows:
(1)
Construction of data matrix
By constructing m samples and n evaluation indicators, we obtained the original data matrix ( x i j is the evaluation value of the i th item under the j th indicator):
X = ( x i j ) m × n
Among them, i = 1, 2, …, m ; j = 1, 2, …, n .
(2)
Numerical standardization
Individual evaluation factors were quantified without outlines to eliminate unit effects between different variables. If the i th indicator factor value of the j th evaluation object was as high as possible, i.e., when the j th indicator x j was a positive indicator, it was transformed as follows:
r i j = x i j min x i j max x i j min x i j
If the i th indicator factor value of the j th evaluation object was as low as possible, i.e., when the j th indicator x j was a negative indicator, it was transformed as follows:
r i j = max x i j x i j max x i j min x i j
where i = 1, 2, …, m ; j = 1, 2, …, n , r i j is the standardized value of the i th indicator in the evaluation metrics, x i j is the original value of the i th indicator in the evaluation metrics, min ( x i j ) is the minimum value of the i th indicator in the evaluation metrics, and max ( x i j ) is the maximum value of the i th indicator in the evaluation metrics.

2.3.1. Entropy Weighting Method to Determine Objective Weights

The concept of “entropy” was first proposed by Clausius, a German physicist, and in 1948, Shannon integrated entropy with information theory and called it “information entropy”. Using information entropy, entropy can be calculated, and the entropy law was born as a result. The entropy weight method is a multi-indicator system of objective assignment methods. The basic idea is to use the concept of information entropy to measure the uncertainty of the indicators and determine their weights. In the entropy weight method, the relationship between information entropy and weight is usually used to calculate the weight.
The greater the entropy of the indicator, the smaller the degree of change in the indicator value. The less information available, the smaller the role and the lower the weight of the comprehensive evaluation [45]. The smaller the entropy of the indicator, the greater the degree of change in the indicator value. The more information available, the greater the role and the higher the weight in the comprehensive evaluation. The entropy value reaches its maximum when the indicator values of the selected indicators are exactly the same, which means that the indicator does not contain valid information, and deleting the indicator from the evaluation indicator system has no effect on the final evaluation [46]. The use of the entropy weighting method to determine the weights can maximize the elimination of the interference of subjective human factors, enabling more objective indicator weights to be obtained. The specific calculation method is as follows:
(1)
Determination of entropy value
The entropy value was calculated as follows:
e j = k i = 1 m p i j ln p i j
where k = 1 / ln m , p i j = r i j / i = 1 m r i j , i = 1, 2, …, m ; j = 1, 2, …, n , m is the number of indicators in each column; and r i j is the standardized value of the i th indicator in the evaluation metrics.
(2)
Calculation of entropy weights based on entropy values
The information entropy redundancy of the j th indicator was calculated as follows:
d j = 1 e j
The weights of the indicators were calculated as follows:
w E j = d j j = 1 n d j
where j = 1, 2, …, n , e j is the entropy value under the j th indicator.

2.3.2. CRITIC Weighting Method to Determine Objective Weights

The CRITIC weighting method is an objective weighting method proposed by Diakoulaki, which combines independence weight and information weight [47]. The CRITIC weighting method is an objective weighting method that takes advantage of the variability of and correlations between the data to determine the weights, mainly through the two aspects of the comparative strength of and conflict between the indicators [48].
(1)
The comparative strength of indicators was calculated.
In the CRITIC weighting method, a standard deviation analysis can be used to judge and express the internal values of and data difference changes in each indicator. The greater the difference value, the greater the change in the number and difference of the indicator, and the more information can be reflected from it. The stronger the evaluation intensity of the indicator itself, the more weight should be allocated to the indicator itself. The formula is as follows:
s j = 1 m 1 i = 1 m ( r i j r j ¯ ) 2
where r j ¯ is the mean value of the j th indicator after standardization and m is the number of evaluation objects.
(2)
Indicator conflictability was calculated.
In the CRITIC weighting method, if the correlation coefficient is used to express the information correlation between indicators, the information correlation with other indicators is stronger. It can be explained that the smaller the information conflict between the indicator and other indicators, the more the same amount of information will be reflected and the more repetitive the evaluation content can be, which will weaken the comprehensive evaluation intensity of the indicator to a certain extent. The distribution of the comprehensive weight of the indicator should be reduced as much as possible. The formula is as follows:
R j = i = 1 p 1 cov j , i s i s j
where i = 1, 2, …, p , cov j , i is the covariance between the j th indicator and the i th indicator, and p is the number of indicators.
(3)
The integrated information was calculated.
C j = S j R j   ( j   =   1 ,   2 ,   ,   p )
(4)
A larger C j means that the j th evaluation index has a greater impact on the whole comprehensive evaluation index system and that more weight should be assigned to it.
(5)
CRITIC method indicator weights were determined.
w C j = C j j = 1 p C j ( j   =   1 ,   2 ,   ,   p )
Through CRITIC-entropy weight combination assignment, the combined weight of each secondary indicator was obtained as follows:
w j = w C j × w E j j = 1 p w C j × w E j

2.3.3. Analytic Hierarchy Process to Determine Subjective Weights

The analytic hierarchy process (AHP) is a combination of qualitative and quantitative methods for weighting analysis and decision-making, as proposed by Saaty [49]. The AHP uses mathematical relationships to express human subjective judgment, reducing the influence of subjective factors on the weights to a certain extent and, thus, making the assessment results more scientific. This method is more suitable for decision-making problems that have a target system with hierarchical interlocking evaluation indicators and for which the target values are difficult to describe quantitatively. AHP is an effective risk assessment method based on qualitative and quantitative analyses of multiple indicators and has been widely used for flood risk assessment in recent years [39,50,51,52]. The specific steps for determining the weights are as follows:
(1)
Construct a hierarchical structure model
When choosing AHP for problem-solving, the problem is first stratified to create a hierarchical structural model. The model is divided into three layers, namely the task layer, the criterion layer, and the indicator layer. The task level represents the final problem to be solved, the criterion level represents the factors to be considered, and the indicator level represents the alternatives in decision-making. In the criterion level of the hierarchical model, the factors at the same level are called target criteria, and the indicators at the indicator level are governed by the influencing factors at the criterion level based on their characteristics, while the lower-level criteria are governed by the criteria at the upper level, so this kind of tree-type progression is regarded as a multilayered structural analytical model [53].
(2)
Use 1~9 and its reciprocal scale method to construct an index judgment matrix
In order to improve the accuracy of the constructed matrix, relative scales were used to compare the assessment factors two by two to minimize the difficulty of comparing factors of different natures with each other. The judgment matrix R = ( r i j ) n × n is defined using 1 to 9 and its reciprocal as the scale, and the method of constructing the judgment matrix is shown in Table 3 below.
(3)
Hierarchical ordering of items in a list
The eigenvector corresponding to the largest eigenroot of the judgment matrix, λ max , is normalized and recorded as W . The elements of W are the ranking weights of the elements of the same level with respect to the relative importance of a factor in the previous level, a process known as hierarchical single ranking. The synthetic weights of the elements of each level on the system goal are calculated, and the total ranking is performed to determine the importance of each element of the lowest level in the recursive structure diagram in the total goal.
(4)
Consistency check
The consistency indicator C I is calculated using the following formula:
C I = λ max n n 1
where n is the dimension of the matrix.
If C I = 0, there is perfect consistency; if C I is close to 0, there is satisfactory consistency; the larger C I is, the more serious the inconsistency is. To measure the magnitude of C R , the random consistency index R I is introduced, as shown in Table 4 below.
The consistency ratio is calculated by the following formula:
C R = C I R I
When C R < 0.1, the consistency of the judgment matrix is reasonable; however, it is necessary to re-test the consistency.
Since this study discusses the impact of precipitation intensity on storm flooding levels over different return periods, a total of six experts (the authors of this paper) were invited to participate in the decision-making process when setting up the guideline layer indicators. This involved setting up the weights according to the different return periods, taking into account the quantitative relationship between precipitation intensities under the four scenarios of return periods and the degree of change between the indicators. Additionally, tailored judgment matrices were constructed in a targeted manner to obtain the results of the weight allocation of risk indicators under the different return periods. The results of assigning weights to the hazard indicators under different scenarios are as follows: With the change in the return period, the dominant precipitation intensity gradually increases, which directly affects the frequency of floods, while the other indicators are hardly affected by it. Therefore, the judgment matrix is constructed by focusing on the change in risk.

2.3.4. Evaluation Methodology

The flood risk of Liaocheng City, as studied here, is a comprehensive function of three aspects, namely the severity of disaster-causing factors ( H ), the exposure of the disaster-prone environment ( E ), and the vulnerability of the disaster-bearing body ( V ). The “H-E-V” framework [10,54,55,56] is comprehensive and clear, yet operational, and is widely used by scholars and research organizations [57].
The comprehensive flood risk assessment model for Liaocheng City can be calculated using the following equation:
F D R I = X H W H + X E W E + X V W V
X = j = 1 n w j r i j
where F D R I (flood disaster risk index) is a composite flood risk index; X H , X E , and X V denote the values of the evaluation indexes for severity, exposure, and vulnerability, respectively; W E , W H , and W V denote the respective weights; r i j and w j are the standardized value and corresponding weight of the i th indicator in the evaluation index, respectively; and j is the number of indicators for each individual evaluation.

2.4. Overview of Study Area

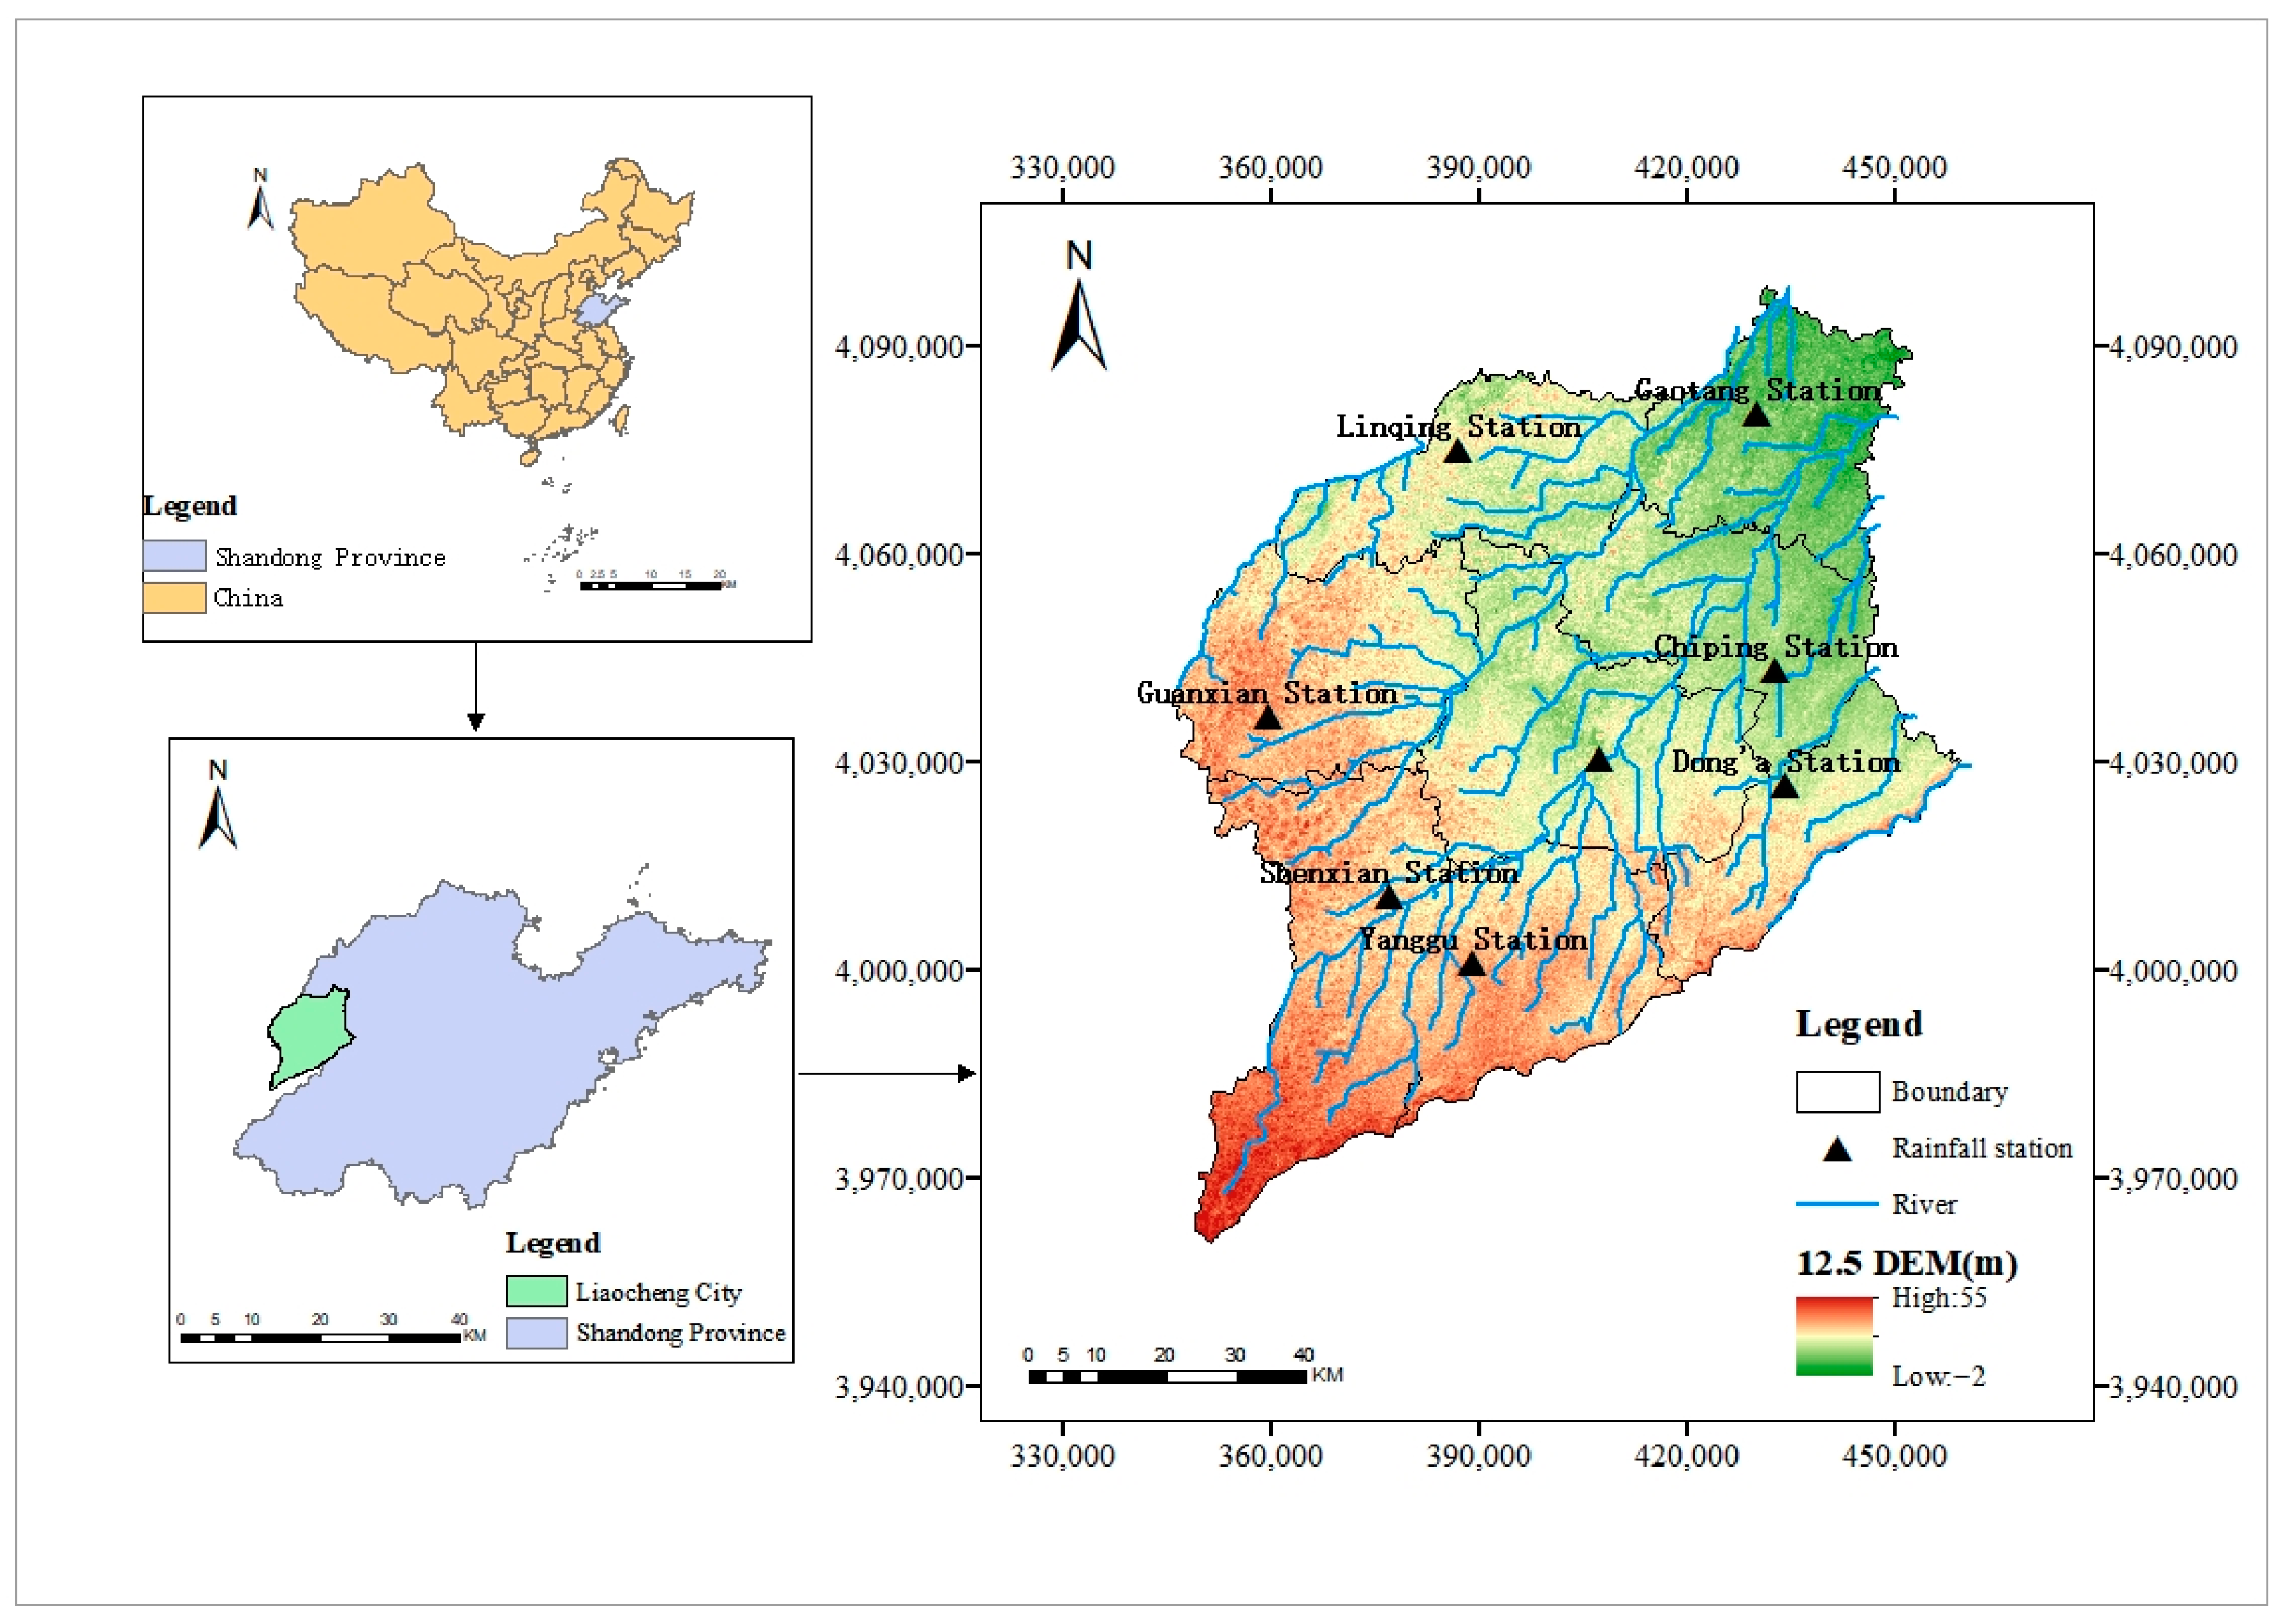
Liaocheng City is located in the western part of Shandong Province, with a geographical location of 35°47′ N~37°02′ N, 115°16′ E~116°32′ E. It is situated in the yellow flood plain of northwestern Shandong Province, with a gentle topography, high in the southwest and low in the northeast. There is a ground slope drop of 1/6500~1/7500 and a ground elevation of approximately 22.80~47.80 m, as shown in Figure 1.
Liaocheng City undergoes significant seasonal changes and has monsoon climate characteristics, with a multi-year average precipitation of 555.9 mm. Of the annual precipitation, 60% is concentrated in the summer, when the city is prone to local flooding. The city’s spatial and temporal distribution of precipitation is extremely uneven; from a temporal point of view, precipitation is mainly concentrated in the flood season, in July and August. From a spatial point of view, Dongchangfu District, Chiping District, and Gaotang County receive more precipitation, while Yanggu County receives less.
Liaocheng City is one of the areas in Shandong Province that has suffered the most frequent and heaviest floods in history. Its floods have the following characteristics: periodicity, continuity, suddenness, and seasonality. Generally, inter-annual summer and autumn floods occur during the frequent-flood years and mega-flooding years, when there is a concentration of heavy rainfall with summer and autumn flooding characteristics. In recent years, Liaocheng City has been seriously affected by flooding. There have been five major rain and flooding disasters since 1990 in 2010, 2013, 2015, 2016, and 2018. On 9–10 August 2010, there was moderate to heavy rainfall in Liaocheng City, with an average precipitation of 145.4 mm in the city, causing serious urban flooding and waterlogging of farmland due to the high intensity of precipitation. In July–August 2013, heavy rainfall and torrential rains hit Liaocheng’s territory, causing serious waterlogging in cities and farmland. A total of seven counties, except Xin County, were affected. In July–August 2015, Liaocheng was hit by heavy rainfall and storms, and crops were severely affected. In mid-July 2016, under the influence of heavy rainfall over a large area in the Wei and Zhanghe River basins upstream of the Zhangwei River, the flooding of the Zhangwei River in Liaocheng was severe, resulting in the flooding of a large number of trees and crops on the river beaches. In 2018, heavy rainfall resulted in more severe waterlogging on urban roads and some agricultural land, as well as damage to some bridges and ditches. During 2010–2018, heavy rainfall and flooding disasters caused 9,614,800 mu of crops to be affected, 17,221 damaged and collapsed houses, and a population of 3,496,000 people to be affected, resulting in a direct economic loss of CNY 511.1 million [58].

3. Results and Analysis

3.1. Empowerment Results

Through the combination of subjective and objective weighting, the weights of the indicators under different return periods in Liaocheng City were calculated and are shown in Table 5, Table 6, Table 7 and Table 8.
We used Equations (14) and (15) to calculate the risk, exposure, vulnerability, and comprehensive risk of flooding in Liaocheng City. We also adopted the natural discontinuity grading method. The risk, exposure, vulnerability, and comprehensive risk of flooding in Liaocheng City were divided into five grades, and the grading results are shown in Table 9.

3.2. Hazard Assessment of Disaster-Causing Factors

Using the ARCGIS 10.0 inverse distance weighting method, the related impact indicator information was interpolated and extracted, and the factors were spatially superimposed to obtain a vector map of each evaluation factor. Combined with the grading criteria in Table 7, the risk distribution of flood disasters in different return periods in Liaocheng City was derived. The area share of each grade is shown in Table 10.
The results of the hazard assessment of disaster-causing factors in Liaocheng City are shown in Figure 2, with no obvious boundaries in the spatial distribution. Overall, the risk is higher in the western and central parts and lower in the south and north. With the change in return periods, the medium-to-very-high-risk area gradually moves southward in the central part and gradually expands in the western part. Among them, the high-risk area is mainly concentrated in Dongchangfu District, and its scope increases with the increase in return period, expanding from 6.7% to 9.41%, indicating that the possibility of extreme floods in this area is increasing. Medium-to-very-high-risk areas are mainly located in Dongchangfu District, Chiping District, Dong’a County, Guanxian County, and Yanggu County, where the severity of flooding is high due to the frequent and heavy rainfall. Very-low-severity areas are mainly distributed in Shenxian County and Gaotang County, which have low flooding severity due to their low precipitation variability and low rainfall.

3.3. Exposure Assessment of Disaster-Prone Environment

The exposure of the disaster-prone environment reflects the hydrological and geomorphological environment of Liaocheng City. As shown in Figure 3, the distribution of flood exposure in Liaocheng City is scattered; the exposure is generally low, but the flood exposure in the central part and part of the southwest is strong. The areas of very high exposure are mainly concentrated in Dongchangfu District and Shenxian County, accounting for 10.42% of the total area, which is closely related to the high density of the river network, lower elevation, gentle terrain, and low vegetation cover in these areas. In Liaocheng City, the very-low-exposure and low-exposure areas account for 21.64% and 31.41% of the total area, respectively, and are mainly distributed in the northern part of the city, with Linqing City being the least exposed because of its relatively steep slope and high vegetation cover.

3.4. Vulnerability Assessment of the Disaster-Bearing Body

As shown in Figure 4, the spatial distribution trend of the disaster-bearing body’s vulnerability level in Liaocheng City shows a gradual weakening from the southwest to the northeast, and it is entirely in a state of high vulnerability. The very-high-vulnerability areas are concentrated in Dongchangfu District, Shenxian County, Guanxian County, and Linqing City, accounting for 57.17% of the total area. These areas are densely populated and have a large number of rural populations and dense roads, as well as weak recovery and self-construction capacity after damage. Very-low-vulnerability and low-vulnerability areas account for 11.69% and 8.48% of the total area, respectively, located in Chiping District and Dong’a County, which have low populations and road densities, high economic densities, and high levels of secondary industry development.

3.5. Comprehensive Risk Assessment of Urban Floods

Based on the results obtained by analyzing the severity of disaster-causing factors, the exposure of the disaster-prone environment, and the vulnerability of the disaster-bearing body, the comprehensive assessment model was used to carry out a weighted integrated evaluation, and the final results were graded using the natural breakpoint method, i.e., very low comprehensive risk, low comprehensive risk, medium comprehensive risk, high comprehensive risk, and very high comprehensive risk. The comprehensive risk distribution of flood disasters in Liaocheng City was obtained, as shown in Table 11.
As shown in Figure 5, the spatial distribution of the comprehensive risk of flooding in Liaocheng City was characterized by high risk in the central and western parts and relatively low risk in the southern and northern parts. Comprehensive risk was dominated by medium and low risk, with medium-risk and low-risk areas being distributed in Linqing City, Chiping District, and Shenxian County. Very-low-risk areas were distributed in Gaotang County.
With the gradual increase in return periods, the overall spatial distribution of medium-to-very-high-risk areas in risk zoning gradually shrinks, and the spatial distribution of very-high-risk areas gradually moves south but maintains a stable distribution law. The high-risk areas of Liaocheng City, in terms of comprehensive flood risk, are mainly distributed in Guanxian County and tend to be concentrated with the increase in return periods. Very-high-risk areas increase with the increase in the recurrence period, expanding from 4.18% to 7.16%, which are concentrated in Dongchangfu District. Due to the frequent and heavy rainfall in Dongchangfu District and Guanxian County, the precipitation variability was high. This, coupled with the dense population and rural population, dense road network, and rapid economic development, resulted in high flood severity and the high vulnerability of the disaster-bearing bodies in Dongchangfu District and Guanxian County. At the same time, Dongchangfu District has many rivers, a gentle terrain, and low vegetation cover, resulting in a high level of exposure. Therefore, Dongchangfu District and Guanxian County have a higher likelihood of flooding and are the key areas for future forecasting and prediction as well as flood prevention in weather characterized by rainfall.

4. Conclusions

This study took Liaocheng City as its research area on the basis of analyzing the characteristics of spatial and temporal changes in precipitation and the causes of disaster risk. We utilized the theory of disaster science and analyzed flood risk from three aspects: disaster-causing factors, disaster-prone environments, and disaster-bearing bodies. Considering different return periods, we adopted the subjective–objective combination assignment method for the risk of disaster-causing factors. For assessing the exposure to disaster-prone environments and the vulnerability of affected populations, we utilized the CRITIC-entropy weight objective empowerment method. Additionally, we employed the AHP subjective empowerment method for the criterion layer in order to set up the risk evaluation index system for Liaocheng City’s flood disaster and make use of GIS spatial analysis technology to assess the flood disaster risk and risk area zoning. The results indicate the following:
(1)
This regional flood risk assessment model based on a combination of subjective and objective multi-weight methods fully considers the role of expert experience and objective data, makes up for the shortcomings of single-weighting and machine learning models, and can simultaneously avoid the subjectivity of results and uncertainty of parameters, thus obtaining more accurate decision-making results and evaluating urban flood disaster risks more scientifically. This study represents important basic work for disaster prevention and mitigation in plain cities and is of great significance for improving the flood prevention capacity of urban areas, decreasing the risk level, and promoting economic development.
(2)
The spatial distribution of flood risk in Liaocheng City is characterized by a higher severity in the western and central parts and a lower severity in the south and north. With the change in return periods, the medium-to-very-high-risk area gradually moves southward in the central part and gradually expands in the western part. Among them, the high-risk area is concentrated in Dongchangfu District. The distribution of flood exposure is scattered and generally at a low level, but flood exposure is higher in the central and southwestern parts. The area of very high exposure is mainly concentrated in Dongchangfu District and Shenxian County. The spatial distribution trend of flood vulnerability shows a gradually weakening trend from the southwest to the northeast, with high vulnerability overall. Very-high-vulnerability areas are concentrated in Dongchangfu District, Shenxian County, Guanxian County, and Linqing City.
(3)
The spatial distribution of the comprehensive risk of flooding in Liaocheng City indicates high risk in the central and western parts of the city and relatively low risk in the south and north. Comprehensive risk was dominated by medium and low risk, with medium-risk and low-risk areas mainly being distributed in Linqing City, Chiping District, and Shenxian County. Very-low-risk areas are mainly distributed in Gaotang County. With the gradual increase in return periods, the overall spatial distribution of medium-to-very-high-risk areas in risk zoning gradually shrinks, and the spatial distribution of very-high-risk areas gradually moves south but maintains a stable distribution law. The high-risk areas of Liaocheng City, in terms of comprehensive flood risk, are mainly distributed in Guanxian County and tend to be concentrated with the increase in return periods. Very-high-risk areas increase with the increase in the recurrence period, expanding from 4.18% to 7.16%, which are concentrated in Dongchangfu District.
(4)
The research results can provide decision support for scientific and efficient flood risk management. In areas characterized by high flood risk in Liaocheng City, specific measures such as increasing urban and rural green areas, improving flood control standards for buildings, and/or expanding the defense scope of flood control projects, as well as changing flood control zones based on urban economic development and flood control capabilities, can be taken to continue improving the entire emergency management system for urban flood disasters, enhancing the city’s control and early warning capabilities, engineering defense capabilities, and resource guarantee capabilities in response to flood disasters. They also provide ideas for improving the flood emergency response capacity of similar plain cities. Risk assessment and the zoning of flood disasters are important parts of implementing risk management. The results of this study provide a scientific basis for disaster relief and mitigation. These results could improve people’s awareness of flood risk prevention and may help flood control and mitigation departments take effective measures in order to deal with flood disasters; they may also provide ideas for improving the flood emergency response capacity of similar plain cities.

Author Contributions

Conceptualization, J.C. and C.G.; data curation, H.Z.; formal analysis, D.Q.; investigation, C.C.; methodology, J.C.; resources, C.G.; software, J.C.; validation, H.Z., Q.W. and L.S.; writing—original draft preparation, J.C.; writing—review and editing, C.G. All authors have read and agreed to the published version of the manuscript.

Funding

This work was partially funded and supported by the Major Scientific and Technological Projects of the Ministry of Water Resources (Grant SKS-2022021), Fundamental Research Funds for the Central Universities (Grant B220202028), and the Project on Excellent Post-graduate Dissertation of Hohai University (Grant 422003507).

Institutional Review Board Statement

Not applicable.

Informed Consent Statement

Not applicable.

Data Availability Statement

The datasets presented in this article are not readily available because the participants of this study did not agree for their data to be shared publicly. Requests to access the datasets should be directed to the correspondent author.

Acknowledgments

The authors gratefully acknowledge the financial support that they received. The authors also thank the reviewers for their valuable comments.

Conflicts of Interest

Authors Qian Wang and Dandan Qing were employed by the company Design and Research Institute Co., Ltd., Hohai University. Author Liangliang She was employed by the company Ningbo Hong Tai Water Conservancy Information Technology Co., Ltd. All authors declare that the research was conducted in the absence of any commercial or financial relationships that could be construed as a potential conflict of interest.

References

  1. Pall, P.; Aina, T.; Stone, D.A.; Stott, P.A.; Nozawa, T.; Hilberts, A.G.J.; Lohmann, D.; Allen, M.R. Anthropogenic greenhouse gas contribution to flood risk in England and Wales in autumn 2000. Nature 2011, 470, 382–385. [Google Scholar] [CrossRef] [PubMed]
  2. Ren, G.; Feng, G.; Yan, Z. Review and prospect of extreme climate change observation in China. Clim. Environ. Res. 2010, 15, 337–353. [Google Scholar]
  3. Gao, T.; Xie, L. A review of extreme precipitation trends and physical causes in China over the past 50 years. Prog. Earth Sci. 2014, 29, 577–589. [Google Scholar]
  4. Goswami, B.N.; Venugopal, V.; Sengupta, D.; Madhusoodanan, M.M.S.; Xavier, P.K. Increasing Trend of Extreme Rain Events Over India in a Warming Environment. Science 2007, 314, 1442–1445. [Google Scholar] [CrossRef] [PubMed]
  5. Sanyal, J.; Lu, X. Application of Remote Sensing in Flood Management with Special Reference to Monsoon Asia: A Review. Nat. Hazards J. Int. Soc. Prev. Mitig. Nat. Hazards 2004, 33, 283–301. [Google Scholar] [CrossRef]
  6. Vanneuville, W.; Kellens, W.; Maeyer, P.D.; Reniers, G.; Witlox, F. Is ‘flood risk management’ identical to ‘flood disaster management’? Earthzine. In Fluid Flow for the Practicing Chemical Engineer; Wily: Hoboken, NJ, USA, 2011. [Google Scholar] [CrossRef]
  7. Karagiozi, E.; Ioannis, F.O.; Konstantinidis, A.; Andreadakis, E.; Konstantinos, N. Flood Hazard Assessment Based on Geomorphological Analysis with GIS Tools—The Case of Laconia (Peloponnesus, Greece). In Proceedings of the Symposium GIS Ostrava, Ostrava, Czech Republic, 24–26 January 2011; Volume 11, pp. 24–26. [Google Scholar]
  8. Wu, S.; Zhao, W.; Wang, Z.; Cao, S.; Qu, X.; Wang, Y.; Li, X. GIS-based Flood Risk Assessment and Zoning—A Case Study of Zhejiang Province. China Rural Water Conserv. Hydropower 2020, 6, 51–57. [Google Scholar]
  9. Ramin, B.M.; Mcmichael, A.J. Climate Change and Health in Sub-Saharan Africa: A Case-Based Perspective. Ecohealth 2009, 6, 52–57. [Google Scholar] [CrossRef]
  10. Field, C.B.; Barros, V.R.; IPPC. IPCC, 2014: Climate Change 2014: Impacts, Adaptation, and Vulnerability. Part A: Global and Sectoral Aspects. In Contribution of Working Group II to the Fifth Assessment Report of the Intergovernmental Panel on Climate Change; IPPC: Rome, Italy, 2014; Chapter 30; pp. 1644–1732. [Google Scholar]
  11. Temmerman, S.; Meire, P.; Bouma, T.J.; Herman, P.M.J.; Ysebaert, T.; De Vriend, H.J. Ecosystem-based coastal defence in the face of global change. Nature 2013, 504, 79–83. [Google Scholar] [CrossRef]
  12. Woodruff, J.D.; Irish, J.L.; Camargo, S.J. Coastal flooding by tropical cyclones and sea-level rise. Nature 2013, 504, 44–52. [Google Scholar] [CrossRef]
  13. Wang, Z.; Lai, C.; Chen, X.; Yang, B.; Zhao, S.; Bai, X. Flood hazard risk assessment model based on random forest. J. Hydrol. 2015, 527, 1130–1141. [Google Scholar] [CrossRef]
  14. Zheng, D.; Gao, M.; Li, Y.; Wu, R. GIS-based comprehensive risk assessment of heavy rainfall and flooding in Dalian. J. Hohai Univ. Nat. Sci. Ed. 2022, 50, 1–8+22. [Google Scholar]
  15. Huang, D.; Liu, G.; Peng, S. Progress in flood risk assessment and zoning. Prog. Geosci. 2007, 4, 11–22. [Google Scholar]
  16. Luu, C.; von Meding, J. A Flood Risk Assessment of Quang Nam, Vietnam Using Spatial Multicriteria Decision Analysis. Water 2018, 10, 40461. [Google Scholar] [CrossRef]
  17. Meyer, V.; Haase, D.; Scheuer, S. Flood risk assessment in European river basins--Concept, methods, and challenges exemplified at the Mulde River. Integr. Environ. Assess. Manag. 2009, 5, 17–26. [Google Scholar] [CrossRef] [PubMed]
  18. Pham, B.T.; Luu, C.; Phong, T.V.; Nguyen, H.D.; Le, H.V.; Tran, T.Q.; Ta, H.T.; Prakash, I. Flood risk assessment using hybrid artificial intelligence models integrated with multi-criteria decision analysis in Quang Nam Province, Vietnam. J. Hydrol. 2021, 592, 125815. [Google Scholar] [CrossRef]
  19. Gao, C.; Zhang, B.Y.; Shao, S.B.; Hao, M.Q.; Zhang, Y.Q.; Xu, Y.; Kuang, Y.; Dong, L.X.; Wang, Z.W. Risk assessment and zoning of flood disaster in Wuchengxiyu Region, China. Urban Clim. 2023, 49, 1562. [Google Scholar] [CrossRef]
  20. Hao, M.Q.; Gao, C.; Chen, J. Temporal analysis and the joint probability distribution of rainfall indexes in the Taihu Lake Basin, China. Theor. Appl. Climatol. 2023, 152, 951–965. [Google Scholar] [CrossRef]
  21. Wang, Y.H.; Gao, C.; Xu, J.; Zhang, W.; She, L.L.; Zhang, Q.Q.; Bao, R.L. Assessing the mechanism for flood control: A case of plain river network cities under extreme rainfalls. Environ. Sci. Pollut. Res. 2023, 30, 38076–38098. [Google Scholar] [CrossRef] [PubMed]
  22. Hao, M.Q.; Gao, C.; Gu, C.X.; Hou, T.; Zhang, Y.Q. Numerical simulation of the impact of urbanization on climate in Taihu Lake Basin. Ecol. Indic. 2023, 154, 110522. [Google Scholar] [CrossRef]
  23. Gao, C.; Liu, J.; Cui, H.; Wang, Z.W.; He, S. Optimized water surface ratio and pervious surface proportion in urbanized riverside areas. Environ. Earth Sci. 2014, 72, 569–576. [Google Scholar] [CrossRef]
  24. Anselmo, V.; Galeati, G.; Palmieri, S.; Rossi, U.; Todini, E. Flood risk assessment using an integrated hydrological and hydraulic modelling approach: A case study. J. Hydrol. 1996, 175, 533–554. [Google Scholar] [CrossRef]
  25. Erena, S.H.; Worku, H.; De Paola, F. Flood hazard mapping using FLO-2D and local management strategies of Dire Dawa city, Ethiopia. J. Hydrol.-Reg. Stud. 2018, 19, 224–239. [Google Scholar] [CrossRef]
  26. Cheng, T.; Xu, Z.X.; Hong, S.Y.; Song, S.L. Flood Risk Zoning by Using 2D Hydrodynamic Modeling: A Case Study in Jinan City. Math. Probl. Eng. 2017, 2017, 5659197. [Google Scholar] [CrossRef]
  27. Ye, C.L.; Xu, Z.X.; Lei, X.H.; Li, P.; Ba, C.; Zu, B. InfoWorks ICM flood simulation and risk analysis: Case of Baima River district, Fuzhou. J. Beijing Norm. Univ. Nat. Sci. 2021, 57, 784–793. [Google Scholar]
  28. Wu, H.C.; Huang, G.R. Risk assessment of urban waterlogging based on PCSWMM model. Water Resour. Prot. 2016, 32, 11–16. [Google Scholar]
  29. Islam, M.M.; Sado, K. Flood hazard assessment in Bangladesh using NOAA AVHRR data with geographical information system. Hydrol. Process. 2000, 14, 605–620. [Google Scholar] [CrossRef]
  30. La Salandra, M.; Roseto, R.; Mele, D.; Dellino, P.; Capolongo, D. Probabilistic hydro-geomorphological hazard assessment based on UAV-derived high-resolution topographic data: The case of Basento river (Southern Italy). Sci. Total Environ. 2022, 842, 156736. [Google Scholar] [CrossRef] [PubMed]
  31. Trepekli, K.; Balstrøm, T.; Friborg, T.; Fog, B.; Allotey, A.N.; Kofie, R.Y.; Møller-Jensen, L. UAV-borne, LiDAR-based elevation modelling: A method for improving local-scale urban flood risk assessment. Nat. Hazards 2022, 113, 423–451. [Google Scholar] [CrossRef]
  32. Jiafu, L.I.U.; Jing, L.I.; Jing, L.I.U.; Ruyin, C.A.O. Integrated GIS/AHP-based flood risk assessment:a case study of Huaihe River Basin in China. J. Nat. Disasters 2008, 17, 110–114. [Google Scholar]
  33. Bathrellos, G.D.; Karymbalis, E.; Skilodimou, H.D.; Gaki-Papanastassiou, K.; Baltas, E.A. Urban flood hazard assessment in the basin of Athens Metropolitan city, Greece. Environ. Earth Sci. 2016, 14, 319–333. [Google Scholar] [CrossRef]
  34. Li, S.; Du, J.; Zhang, Z.; Xing, H. Risk zoning of heavy rainfall and flooding in southern Shaanxi based on grey target model and GIS. People’s Yangtze River 2021, 52, 17–21. [Google Scholar]
  35. Sun, N.; Li, C.L.; Guo, B.Y.; Sun, X.K.; Yao, Y.K.; Wang, Y. Urban flooding risk assessment based on FAHP-EWM combination weighting: A case study of Beijing. Geomat. Nat. Hazards Risk 2023, 14, 943. [Google Scholar] [CrossRef]
  36. Cheng, S.B.; Yue, Y.; Liu, Y. Evaluation and Analysis of Social Vulnerability to Floods in the Yellow River Basin. People’s Yellow River 2022, 44, 45–50. [Google Scholar]
  37. Jia, Y.H.; Bai, Y.; Zhai, L.X. Risk assessment of heavy rainfall and flooding in Guangxi based on AHP-entropy weight method. Mapp. Spat. Geogr. Inf. 2023, 46, 13–17. [Google Scholar]
  38. Choubin, B.; Hosseini, F.S.; Rahmati, O. A step toward considering the return period in flood spatial modeling. J. Nat. Hazards 2023, 115, 431–460. [Google Scholar] [CrossRef]
  39. Asiri, M.M.; Aldehim, G.; Alruwais, N.; Allafi, R.; Alzahrani, I.; Nouri, A.M.; Assiri, M.; Ahmed, N.A. Coastal Flood risk assessment using ensemble multi-criteria decision-making with machine learning approaches. Environ. Res. 2024, 245, 118042. [Google Scholar] [CrossRef] [PubMed]
  40. Wang, D.Y.; Zhang, L.D.; Wu, Q.; Qi, W. Flood risk assessment based on machine learning algorithms—A case study of Yichang City. Yangtze River Basin Resour. Environ. 2023, 32, 1710–1723. [Google Scholar]
  41. Peng, J.Q.; Zhang, J.M. Urban flooding risk assessment based on GIS- game theory combination weight: A case study of Zhengzhou City. Int. J. Disaster Risk Reduct. 2022, 77, 103080. [Google Scholar] [CrossRef]
  42. Lyu, H.M.; Zhou, W.H.; Shen, S.L.; Zhou, A.N. Inundation risk assessment of metro system using AHP and TFN-AHP in Shenzhen. Sustain. Cities Soc. 2020, 56, 102103. [Google Scholar] [CrossRef]
  43. Wu, J.R.; Chen, X.L.; Lu, J.Z. Assessment of long and short-term flood risk using the multi-criteria analysis model with the AHP-Entropy method in Poyang Lake basin. Int. J. Disaster Risk Reduct. 2022, 75, 102968. [Google Scholar] [CrossRef]
  44. Song, X.; Huang, H.; Zhang, W.; Guo, S. Characterisation of vulnerability to floods in cities along the Yellow River in Henan Province. Henan Sci. Technol. 2023, 42, 103–107. [Google Scholar]
  45. Guo, X. Improved entropy method and its application in economic efficiency evaluation. Syst. Eng. Theory Pract. 1998, 12, 99–103. [Google Scholar]
  46. Ren, H.J.; Cao, P.L.; Zhang, S. Research on Ecological Social Evaluation Indicator System Based on Entropy Value Method--Taking China’s Western Region as an Example. East China Econ. Manag. 2014, 28, 71–76. [Google Scholar]
  47. Zhang, Y.Z.; Ren, J.L.; Liu, K. Early warning measurement of ecological security and spatial and temporal patterns in Shandong Province. Econ. Geogr. 2015, 35, 166–171+89. [Google Scholar]
  48. Diakoulaki, D.; Mavrotas, G.; Papayannakis, L. Determining objective weights in multiple criteria problems: The CRITIC method. Comput. Oper. Res. 1995, 22, 763–770. [Google Scholar] [CrossRef]
  49. Saaty, T.L. A scaling method for priorities in hierarchical structures. J. Math. Psychol. 1977, 15, 234–281. [Google Scholar] [CrossRef]
  50. Kandilioti, G.; Makropoulos, C. Preliminary flood risk assessment: The case of Athens. Nat. Hazards 2012, 61, 441–468. [Google Scholar] [CrossRef]
  51. Hai-Min, L.; Jack, S.; Arul, A. Assessment of Geohazards and Preventative Countermeasures Using AHP Incorporated with GIS in Lanzhou, China. Sustainability 2018, 10, 304. [Google Scholar] [CrossRef]
  52. Lyu, H.M.; Sun, W.J.; Shen, S.L.; Arulrajah, A. Flood risk assessment in metro systems of mega-cities using a GIS-based modeling approach. Sci. Total Environ. 2018, 626, 1012–1025. [Google Scholar] [CrossRef]
  53. Gigović, L.; Pamučar, D.; Bajić, Z.; Drobnjak, S. Application of GIS-Interval Rough AHP Methodology for Flood Hazard Mapping in Urban Areas. Water 2017, 9, 360. [Google Scholar] [CrossRef]
  54. Merz, B.; Kreibich, H.; Lall, U. Multi-variate flood damage assessment: A tree-based data-mining approach. Nat. Hazard Earth Sys. 2013, 13, 53–64. [Google Scholar] [CrossRef]
  55. Haynes, H.; Haynes, R.; Pender, G. Integrating socio-economic analysis into decision-support methodology for flood risk management at the development scale (Scotland). Water Environ. J. 2010, 22, 117–124. [Google Scholar] [CrossRef]
  56. Giupponi, C.; Mojtahed, V.; Gain, A.K.; Biscaro, C.; Balbi, S. Integrated Risk Assessment of Water-Related Disasters. Hydro-Meteorol. Hazards Risks Disasters 2015, 163, 200. [Google Scholar]
  57. Zhang, H.; Li, C.; Cheng, J.; Wu, Z.; Wu, Y. Progress of urban flood risk assessment based on “H-E-V” framework. Adv. Geosci. 2019, 38, 175–190. [Google Scholar]
  58. Jiang, C.; Ma, X. Liaocheng City Water Resources Journal: 1991–2020; China Literature and History Press: Beijing, China, 2021. [Google Scholar]
Figure 1. Topographic and geomorphological maps of the study area.
Applsci 14 03694 g001
Figure 2. Zoning maps indicate the severity of disaster-causing factors.
Applsci 14 03694 g002
Figure 3. Zoning map indicates disaster-prone environmental exposure.
Applsci 14 03694 g003
Figure 4. Zoning map shows the vulnerability of the disaster-bearing body.
Applsci 14 03694 g004
Figure 5. Zoning maps show the comprehensive risk of urban floods.
Applsci 14 03694 g005
Table 1. Data sources in the study area.
DatatypesMetadataSources
Meteorological and hydrological dataDaily precipitation in Liaocheng City (1950–2020)Haihe River Basin Hydrological Yearbook, National Meteorological Science Data Centre data (China Terrestrial Climatological Data Daily Value Dataset V3.0)
Flood disaster dataLiaocheng City Water Conservancy Journal (1991–2020)
Basic geographic dataDistrict and county administrative boundary dataMinistry of National Natural Resources
Drainage map of Liaocheng CityProvided by Liaocheng City Water Resources Bureau
Remote sensing image dataTopographic elevation data (12.5 DEM)Geospatial Data Cloud
NDVI dataNASA MOD13A3 Dataset
Socio-economic dataDemographic characteristics, economic statistics, municipal facility planningLiaocheng City Statistical Yearbook 2020
Table 2. Indicator system for flood risk assessment in Liaocheng City.
Target LayerCriteria LayerIndicator LayerNature of Indicator
IndicatorIndicator
Urban flood disaster riskSeverity of disaster-causing factorsMaximum 24 h rainfall (mm)Positive
Maximum 3-day rainfall (mm)Positive
Average annual precipitation in moderate rainfall (mm)Positive
Average annual precipitation of heavy rainfall (mm)Positive
Average annual precipitation of storms (mm)Positive
Precipitation variabilityPositive
Flood frequencyPositive
Exposure to disaster-prone environmentRiver network density (km/km2)Positive
Average elevation (m)Negative
Average slope (%)Negative
Vegetation cover (%)Negative
Vulnerability of disaster-bearing bodyPopulation density (person/km2)Positive
Road density (km/km2)Positive
Economic density (billion CNY/km2)Negative
Primary industry GDP (billion CNY/km2)Negative
Secondary industry GDP (billion CNY/km2)Negative
Tertiary industry GDP (billion CNY/km2)Negative
Rural population (10,000 people)Positive
Density of medical institutions (institutions/km2)Negative
Table 3. Hierarchical analysis scales and their meanings.
Factor i over Factor j Quantized Value
Equally important1
Slightly important3
Highly important5
Strongly important7
Extremely important9
Intermediate value of two adjacent judgments2, 4, 6, 8
Table 4. RI values of each scale.
Scale123456789
R I 000.580.91.121.241.321.411.45
Table 5. Weight in return periods of 10 years for flood risk assessment in Liaocheng City.
Target LayerCriteria LayerIndicator LayerNature Indicator
IndicatorWeightsIndicatorWeights
Entropy WeightCRITICAHPCombination
Urban flood disaster riskSeverity of disaster-causing factors0.4934Maximum 24 h rainfall (mm)0.10440.12260.21000.1439Positive
Maximum 3-day rainfall (mm)0.09540.13920.23390.1662Positive
Average annual precipitation in moderate rainfall (mm)0.22760.16440.08990.1800Positive
Average annual precipitation of heavy rainfall (mm)0.18820.17290.09980.1738Positive
Average annual precipitation of storms (mm)0.13480.15100.16220.1767Positive
Precipitation variability0.15080.13680.07370.0814Positive
Flood frequency0.09880.11300.13050.0779Positive
Exposure to disaster-pregnant environment0.3108 Entropy WeightCRITICCombination
River network density (km/km2)0.16930.19250.1218Positive
Average elevation (m)0.23590.21540.1899Negative
Average slope (%)0.22140.24320.2013Negative
Vegetation cover (%)0.37340.34890.4869Negative
Vulnerability of disaster-bearing body0.1958Population density (person/km2)0.21640.14710.2477Positive
Road density (km/km2)0.14450.13000.1462Positive
Economic density (billion yuan/km2)0.07400.09850.0567Negative
Primary industry GDP (billion yuan/km2)0.11080.19060.1643Negative
Secondary industry GDP (billion yuan/km2)0.17030.10370.1374Negative
Tertiary industry GDP (billion yuan/km2)0.06770.11130.0587Negative
Rural population (10,000 people)0.14490.11780.1328Positive
Density of medical institutions (institutions/km2)0.07140.10110.0562Negative
Table 6. Weight in return periods of 50 years for flood risk assessment in Liaocheng City.
Target LayerCriteria LayerIndicator LayerNature Indicator
IndicatorWeightsIndicatorWeights
Entropy WeightCRITICAHPCombination
Urban flood disaster riskSeverity of disaster-causing factors0.5396 Maximum 24 h rainfall (mm)0.1058 0.1240 0.2050 0.1452 Positive
Maximum 3-day rainfall (mm)0.0955 0.1391 0.2518 0.1805 Positive
Average annual precipitation in moderate rainfall (mm)0.2272 0.1640 0.0854 0.1716 Positive
Average annual precipitation of heavy rainfall (mm)0.1878 0.1722 0.0875 0.1526 Positive
Average annual precipitation of storms (mm)0.1345 0.1508 0.1170 0.1281 Positive
Precipitation variability0.1505 0.1370 0.1363 0.1516 Positive
Flood frequency0.0986 0.1130 0.1170 0.0704 Positive
Exposure to disaster-pregnant environment0.2970 Entropy WeightCRITICCombination
River network density (km/km2)0.16930.19250.1218Positive
Average elevation (m)0.23590.21540.1899Negative
Average slope (%)0.22140.24320.2013Negative
Vegetation cover (%)0.37340.34890.4869Negative
Vulnerability of disaster-bearing body0.1634 Population density (person/km2)0.21640.14710.2477Positive
Road density (km/km2)0.14450.13000.1462Positive
Economic density (billion yuan/km2)0.07400.09850.0567Negative
Primary industry GDP (billion yuan/km2)0.11080.19060.1643Negative
Secondary industry GDP (billion yuan/km2)0.17030.10370.1374Negative
Tertiary industry GDP (billion yuan/km2)0.06770.11130.0587Negative
Rural population (10,000 people)0.14490.11780.1328Positive
Density of medical institutions (institutions/km2)0.07140.10110.0562Negative
Table 7. Weight in return periods of 100 years for flood risk assessment in Liaocheng City.
Target LayerCriteria LayerIndicator LayerNature Indicator
IndicatorWeightsIndicatorWeights
Entropy WeightCRITICAHPCombination
Urban flood disaster riskSeverity of disaster-causing factors0.6250 Maximum 24 h rainfall (mm)0.1063 0.1244 0.2163 0.1567 Positive
Maximum 3-day rainfall (mm)0.0955 0.1390 0.2652 0.1929 Positive
Average annual precipitation in moderate rainfall (mm)0.2271 0.1639 0.0780 0.1591 Positive
Average annual precipitation of heavy rainfall (mm)0.1877 0.1720 0.0867 0.1534 Positive
Average annual precipitation of storms (mm)0.1345 0.1507 0.1037 0.1152 Positive
Precipitation variability0.1504 0.1370 0.1350 0.1525 Positive
Flood frequency0.0985 0.1130 0.1151 0.0703 Positive
Exposure to disaster-pregnant environment0.2385 Entropy WeightCRITICCombination
River network density (km/km2)0.16930.19250.1218Positive
Average elevation (m)0.23590.21540.1899Negative
Average slope (%)0.22140.24320.2013Negative
Vegetation cover (%)0.37340.34890.4869Negative
Vulnerability of disaster-bearing body0.1365 Population density (person/km2)0.21640.14710.2477Positive
Road density (km/km2)0.14450.13000.1462Positive
Economic density (billion yuan/km2)0.07400.09850.0567Negative
Primary industry GDP (billion yuan/km2)0.11080.19060.1643Negative
Secondary industry GDP (billion yuan/km2)0.17030.10370.1374Negative
Tertiary industry GDP (billion yuan/km2)0.06770.11130.0587Negative
Rural population (10,000 people)0.14490.11780.1328Positive
Density of medical institutions (institutions/km2)0.07140.10110.0562Negative
Table 8. Weight in return periods of 200 years for flood risk assessment in Liaocheng City.
Target LayerCriteria LayerIndicator LayerNature Indicator
IndicatorWeightsIndicatorWeights
Entropy WeightCRITICAHPCombination
Urban flood disaster riskSeverity of disaster-causing factors0.6483 Maximum 24 h rainfall (mm)0.1066 0.1246 0.2507 0.1919 Positive
Maximum 3-day rainfall (mm)0.0956 0.1389 0.3063 0.2344 Positive
Average annual precipitation in moderate rainfall (mm)0.2270 0.1638 0.0628 0.1345 Positive
Average annual precipitation of heavy rainfall (mm)0.1876 0.1718 0.0732 0.1359 Positive
Average annual precipitation of storms (mm)0.1344 0.1507 0.0828 0.0966 Positive
Precipitation variability0.1503 0.1370 0.1154 0.1369 Positive
Flood frequency0.0985 0.1131 0.1088 0.0698 Positive
Exposure to disaster-pregnant environment0.2297 Entropy WeightCRITICCombination
River network density (km/km2)0.16930.19250.1218Positive
Average elevation (m)0.23590.21540.1899Negative
Average slope (%)0.22140.24320.2013Negative
Vegetation cover (%)0.37340.34890.4869Negative
Vulnerability of disaster-bearing body0.1220 Population density (person/km2)0.21640.14710.2477Positive
Road density (km/km2)0.14450.13000.1462Positive
Economic density (billion yuan/km2)0.07400.09850.0567Negative
Primary industry GDP (billion yuan/km2)0.11080.19060.1643Negative
Secondary industry GDP (billion yuan/km2)0.17030.10370.1374Negative
Tertiary industry GDP (billion yuan/km2)0.06770.11130.0587Negative
Rural population (10,000 people)0.14490.11780.1328Positive
Density of medical institutions (institutions/km2)0.07140.10110.0562Negative
Table 9. Guideline layers and urban flood risk classification criteria.
ClassificationSeverity of Disaster-Causing FactorsExposure of Disaster-Prone EnvironmentVulnerability of Disaster-Bearing BodyComprehensive Urban Flood Risk
Very low<0.4228<0.3901<0.3664<0.4539
Low0.4228–0.48400.3901–0.47280.3664–0.49480.4539–0.5002
Medium0.4840–0.54520.4728–0.56320.4948–0.52980.5002–0.5510
High0.5452–0.62730.5632–0.68210.5298–0.59840.5510–0.6219
Very high>0.6273>0.6821>0.5984>0.6219
Table 10. Area share of disaster-causing factors.
Return PeriodsVery LowLowMediumHighVery High
10a18.83%34.53%20.66%19.28%6.70%
50a16.94%34.31%20.86%20.14%7.75%
100a17.37%34.68%20.47%19.40%8.08%
200a19.47%34.40%18.06%18.66%9.41%
Table 11. Area share of comprehensive urban flood risk.
Return PeriodsVery LowLowMediumHighVery High
10a21.14%35.12%24.29%15.27%4.18%
50a20.76%34.80%24.04%15.20%5.20%
100a20.54%36.57%23.19%13.41%6.29%
200a23.39%34.03%22.00%13.42%7.16%
Disclaimer/Publisher’s Note: The statements, opinions and data contained in all publications are solely those of the individual author(s) and contributor(s) and not of MDPI and/or the editor(s). MDPI and/or the editor(s) disclaim responsibility for any injury to people or property resulting from any ideas, methods, instructions or products referred to in the content.

