
Ground Deformation of Shield Tunneling through Composite Strata in Coastal Areas

 ,
,
Abstract
:1. Introduction
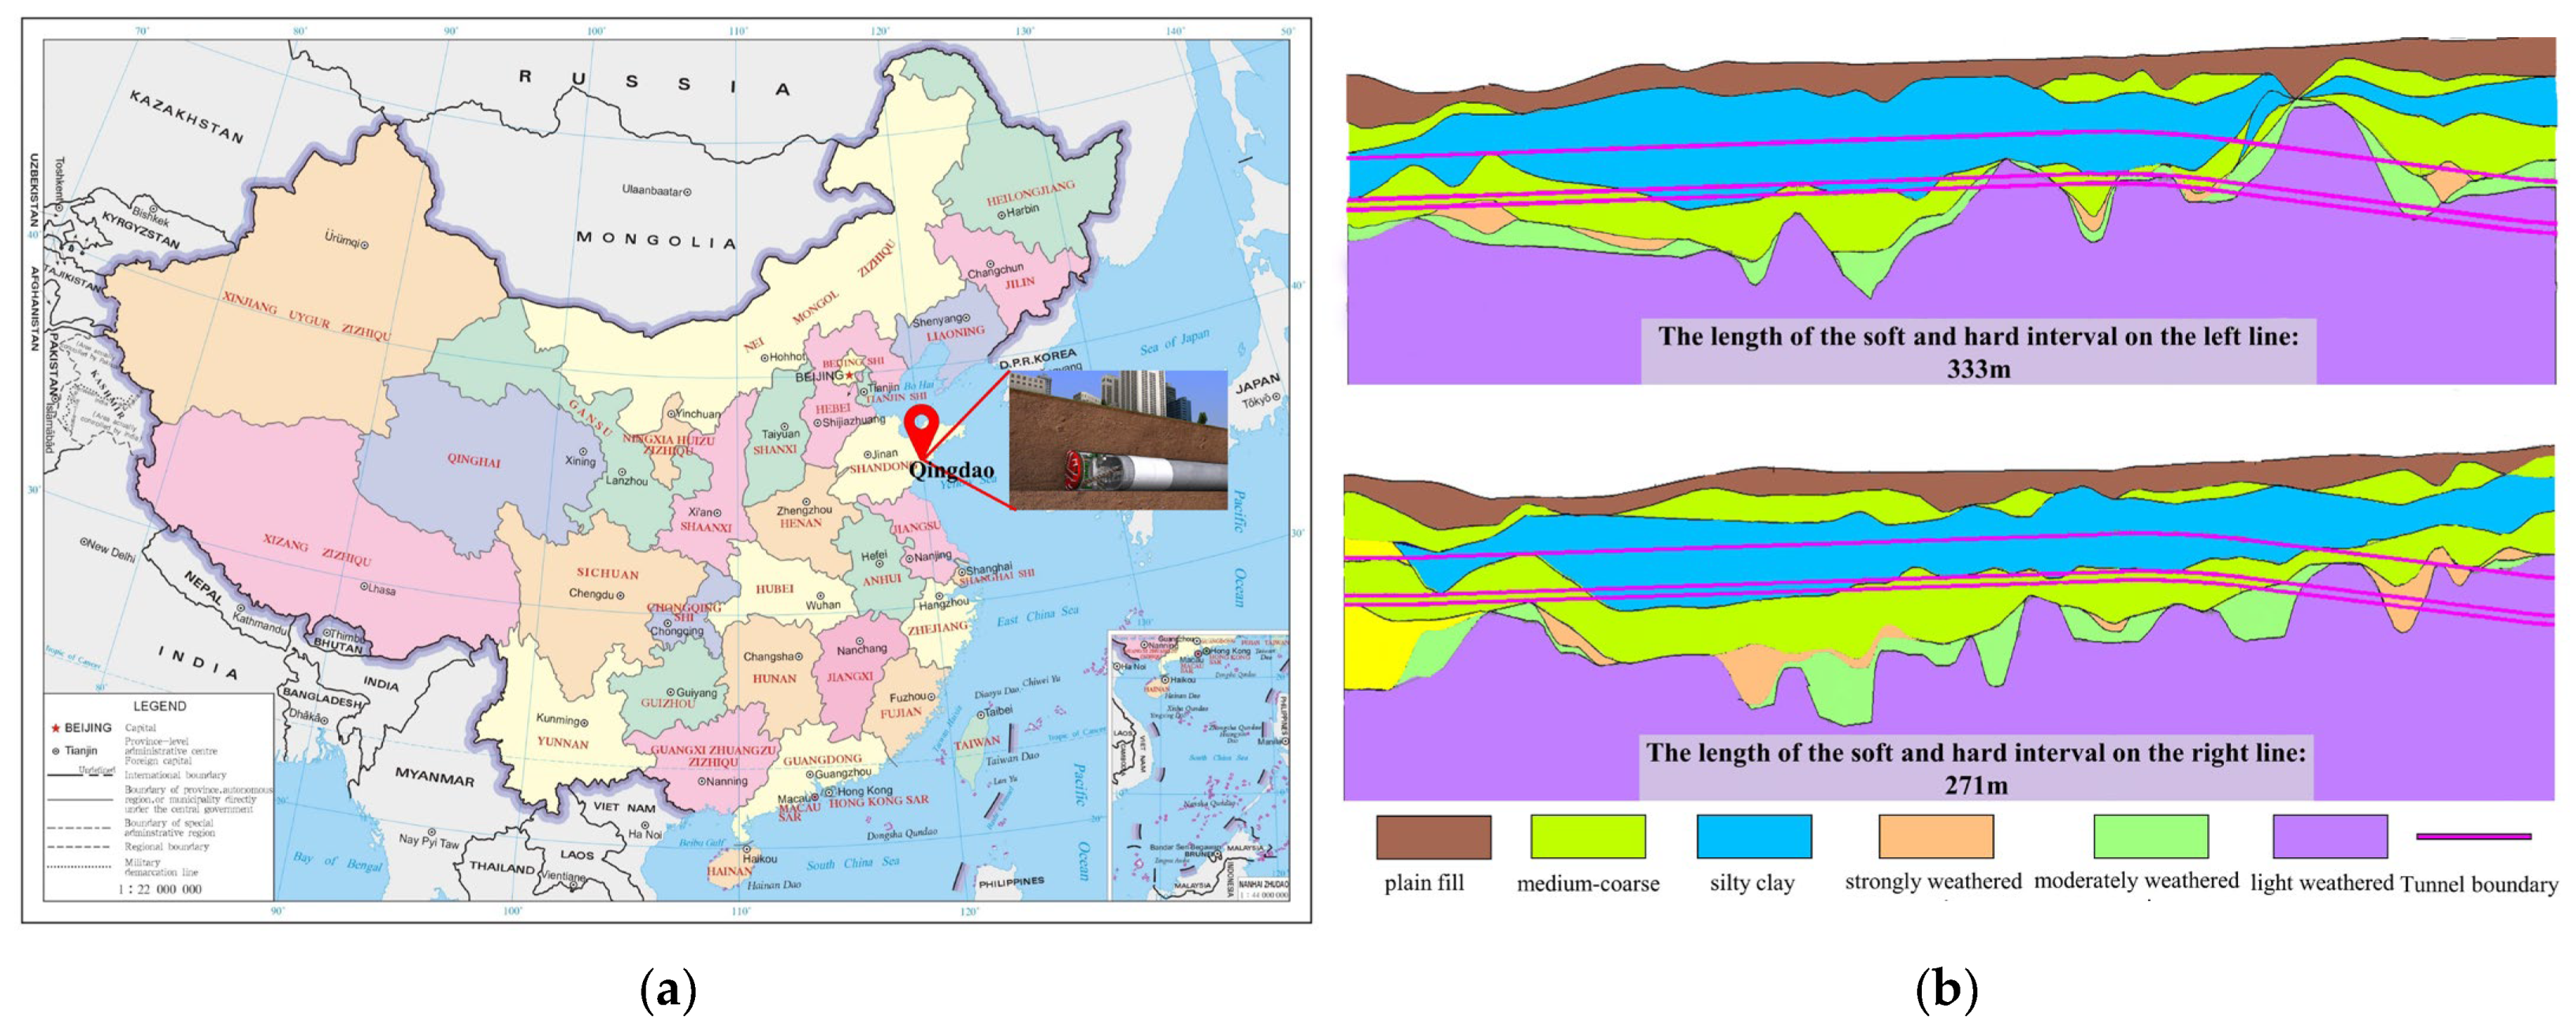
2. Project Overview
3. Methodology
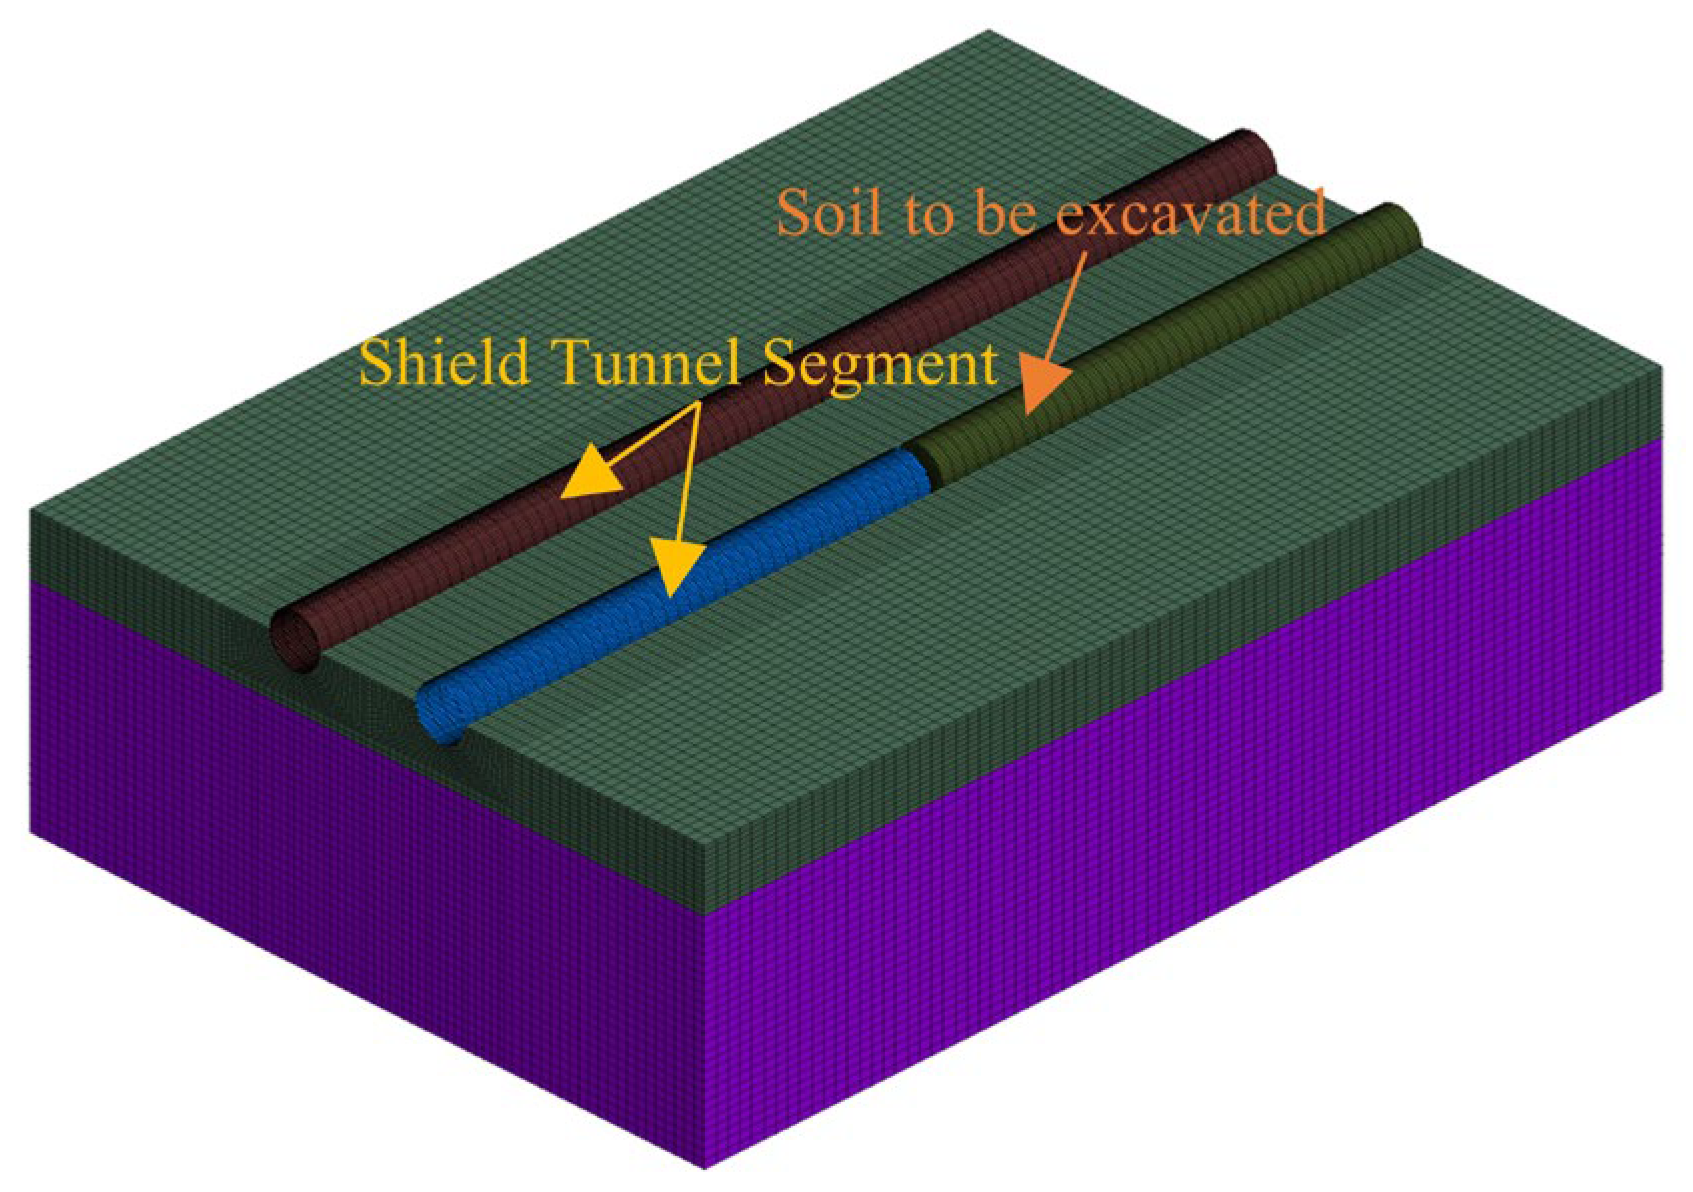
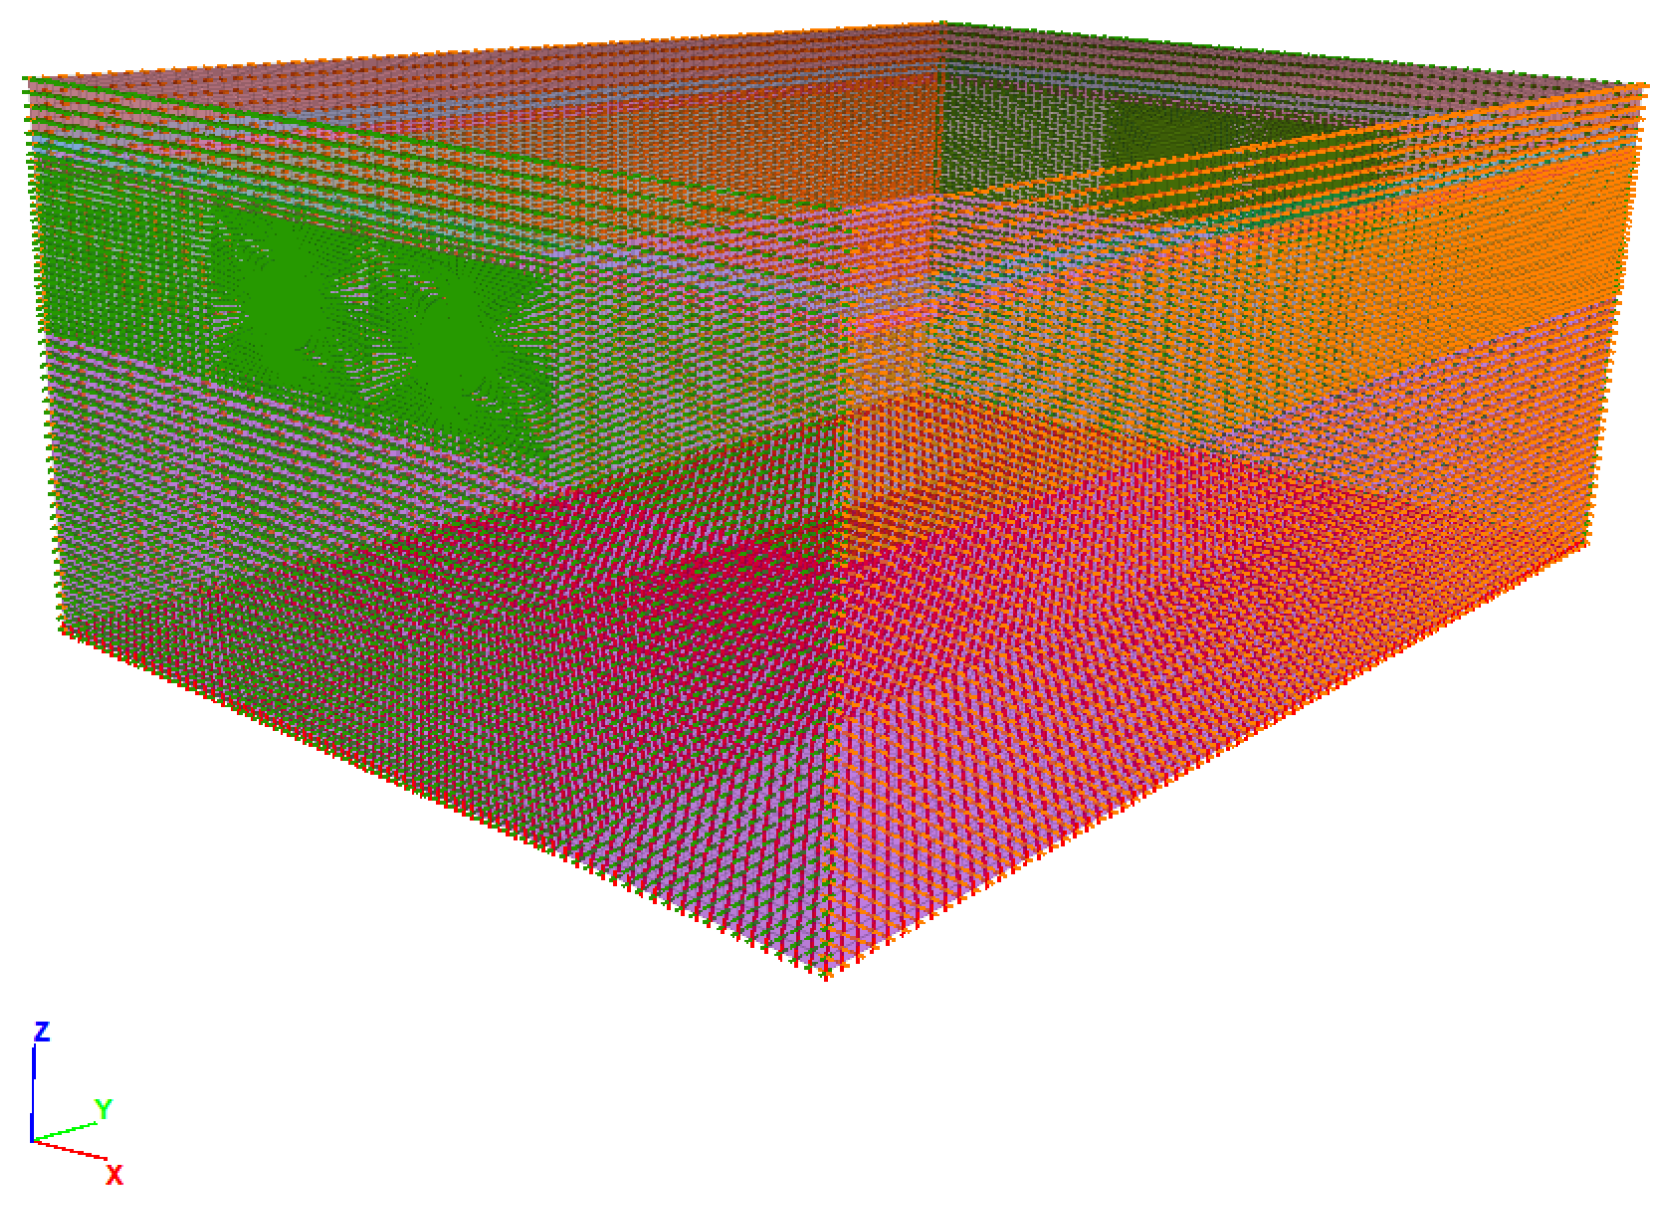
3.1. Numerical Model Establishment
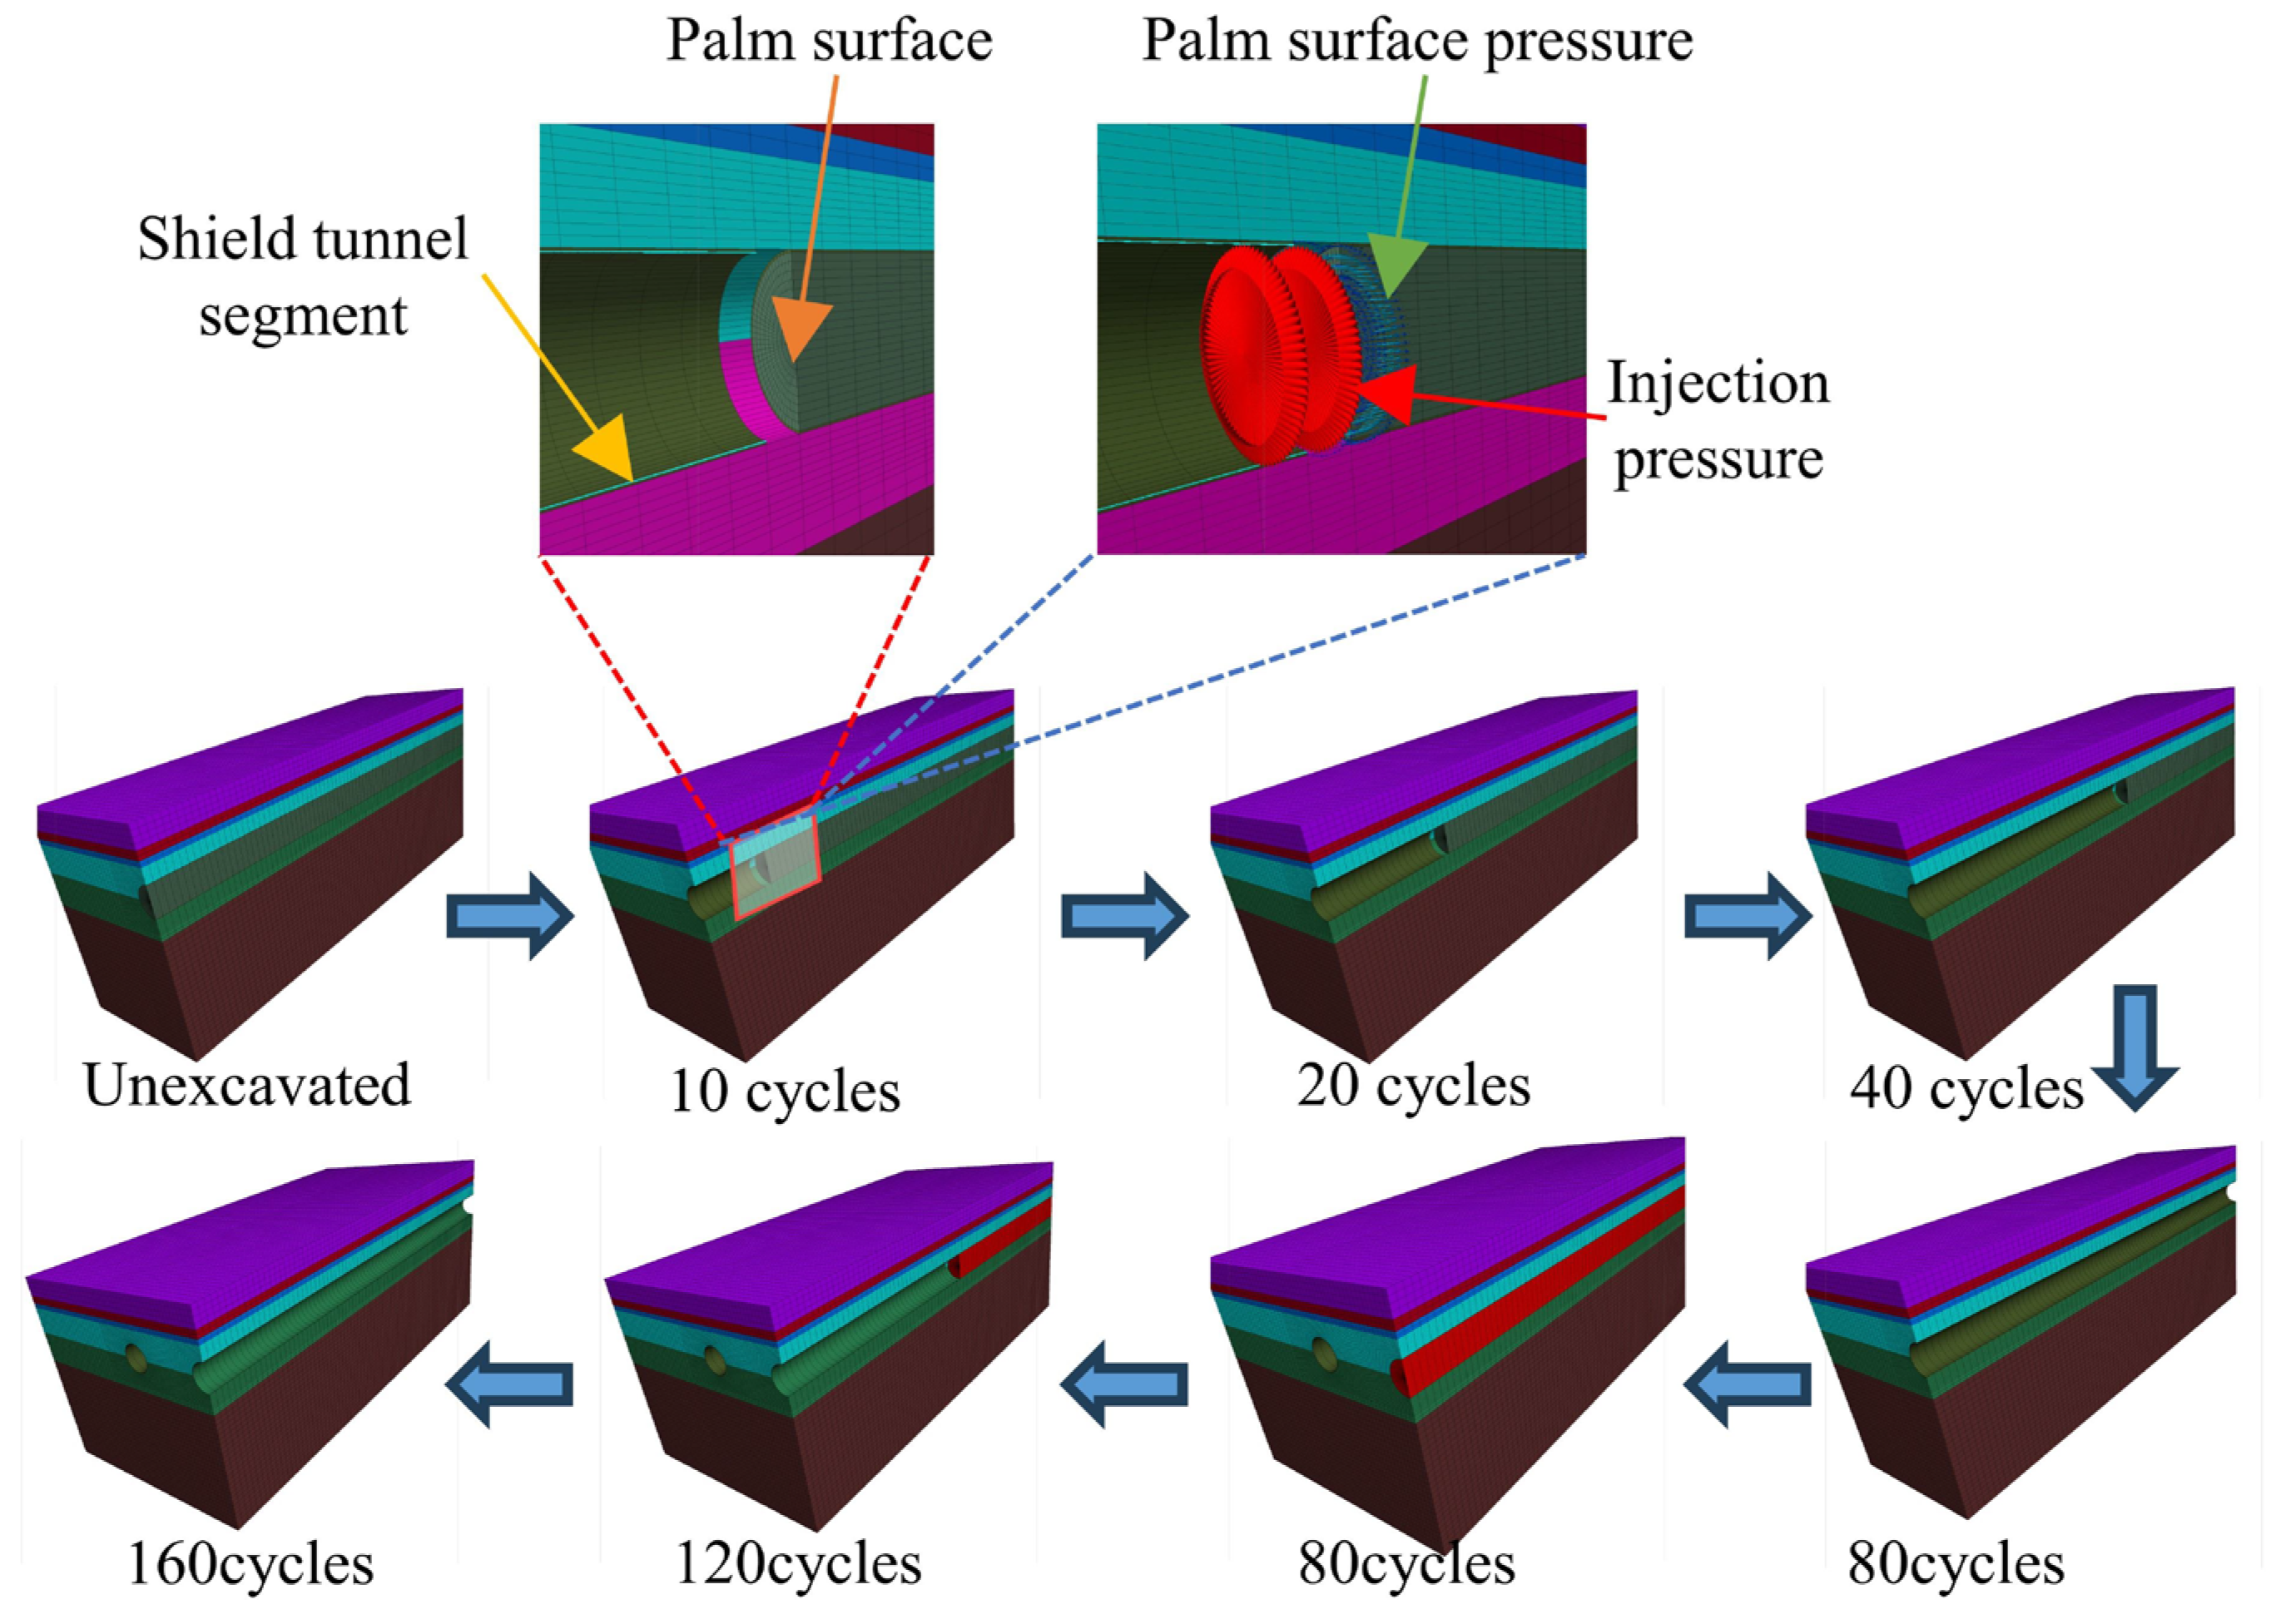
3.2. Shield Construction Simulation
4. Results
4.1. Deformation in Formation under Various Composite Strata Ratios
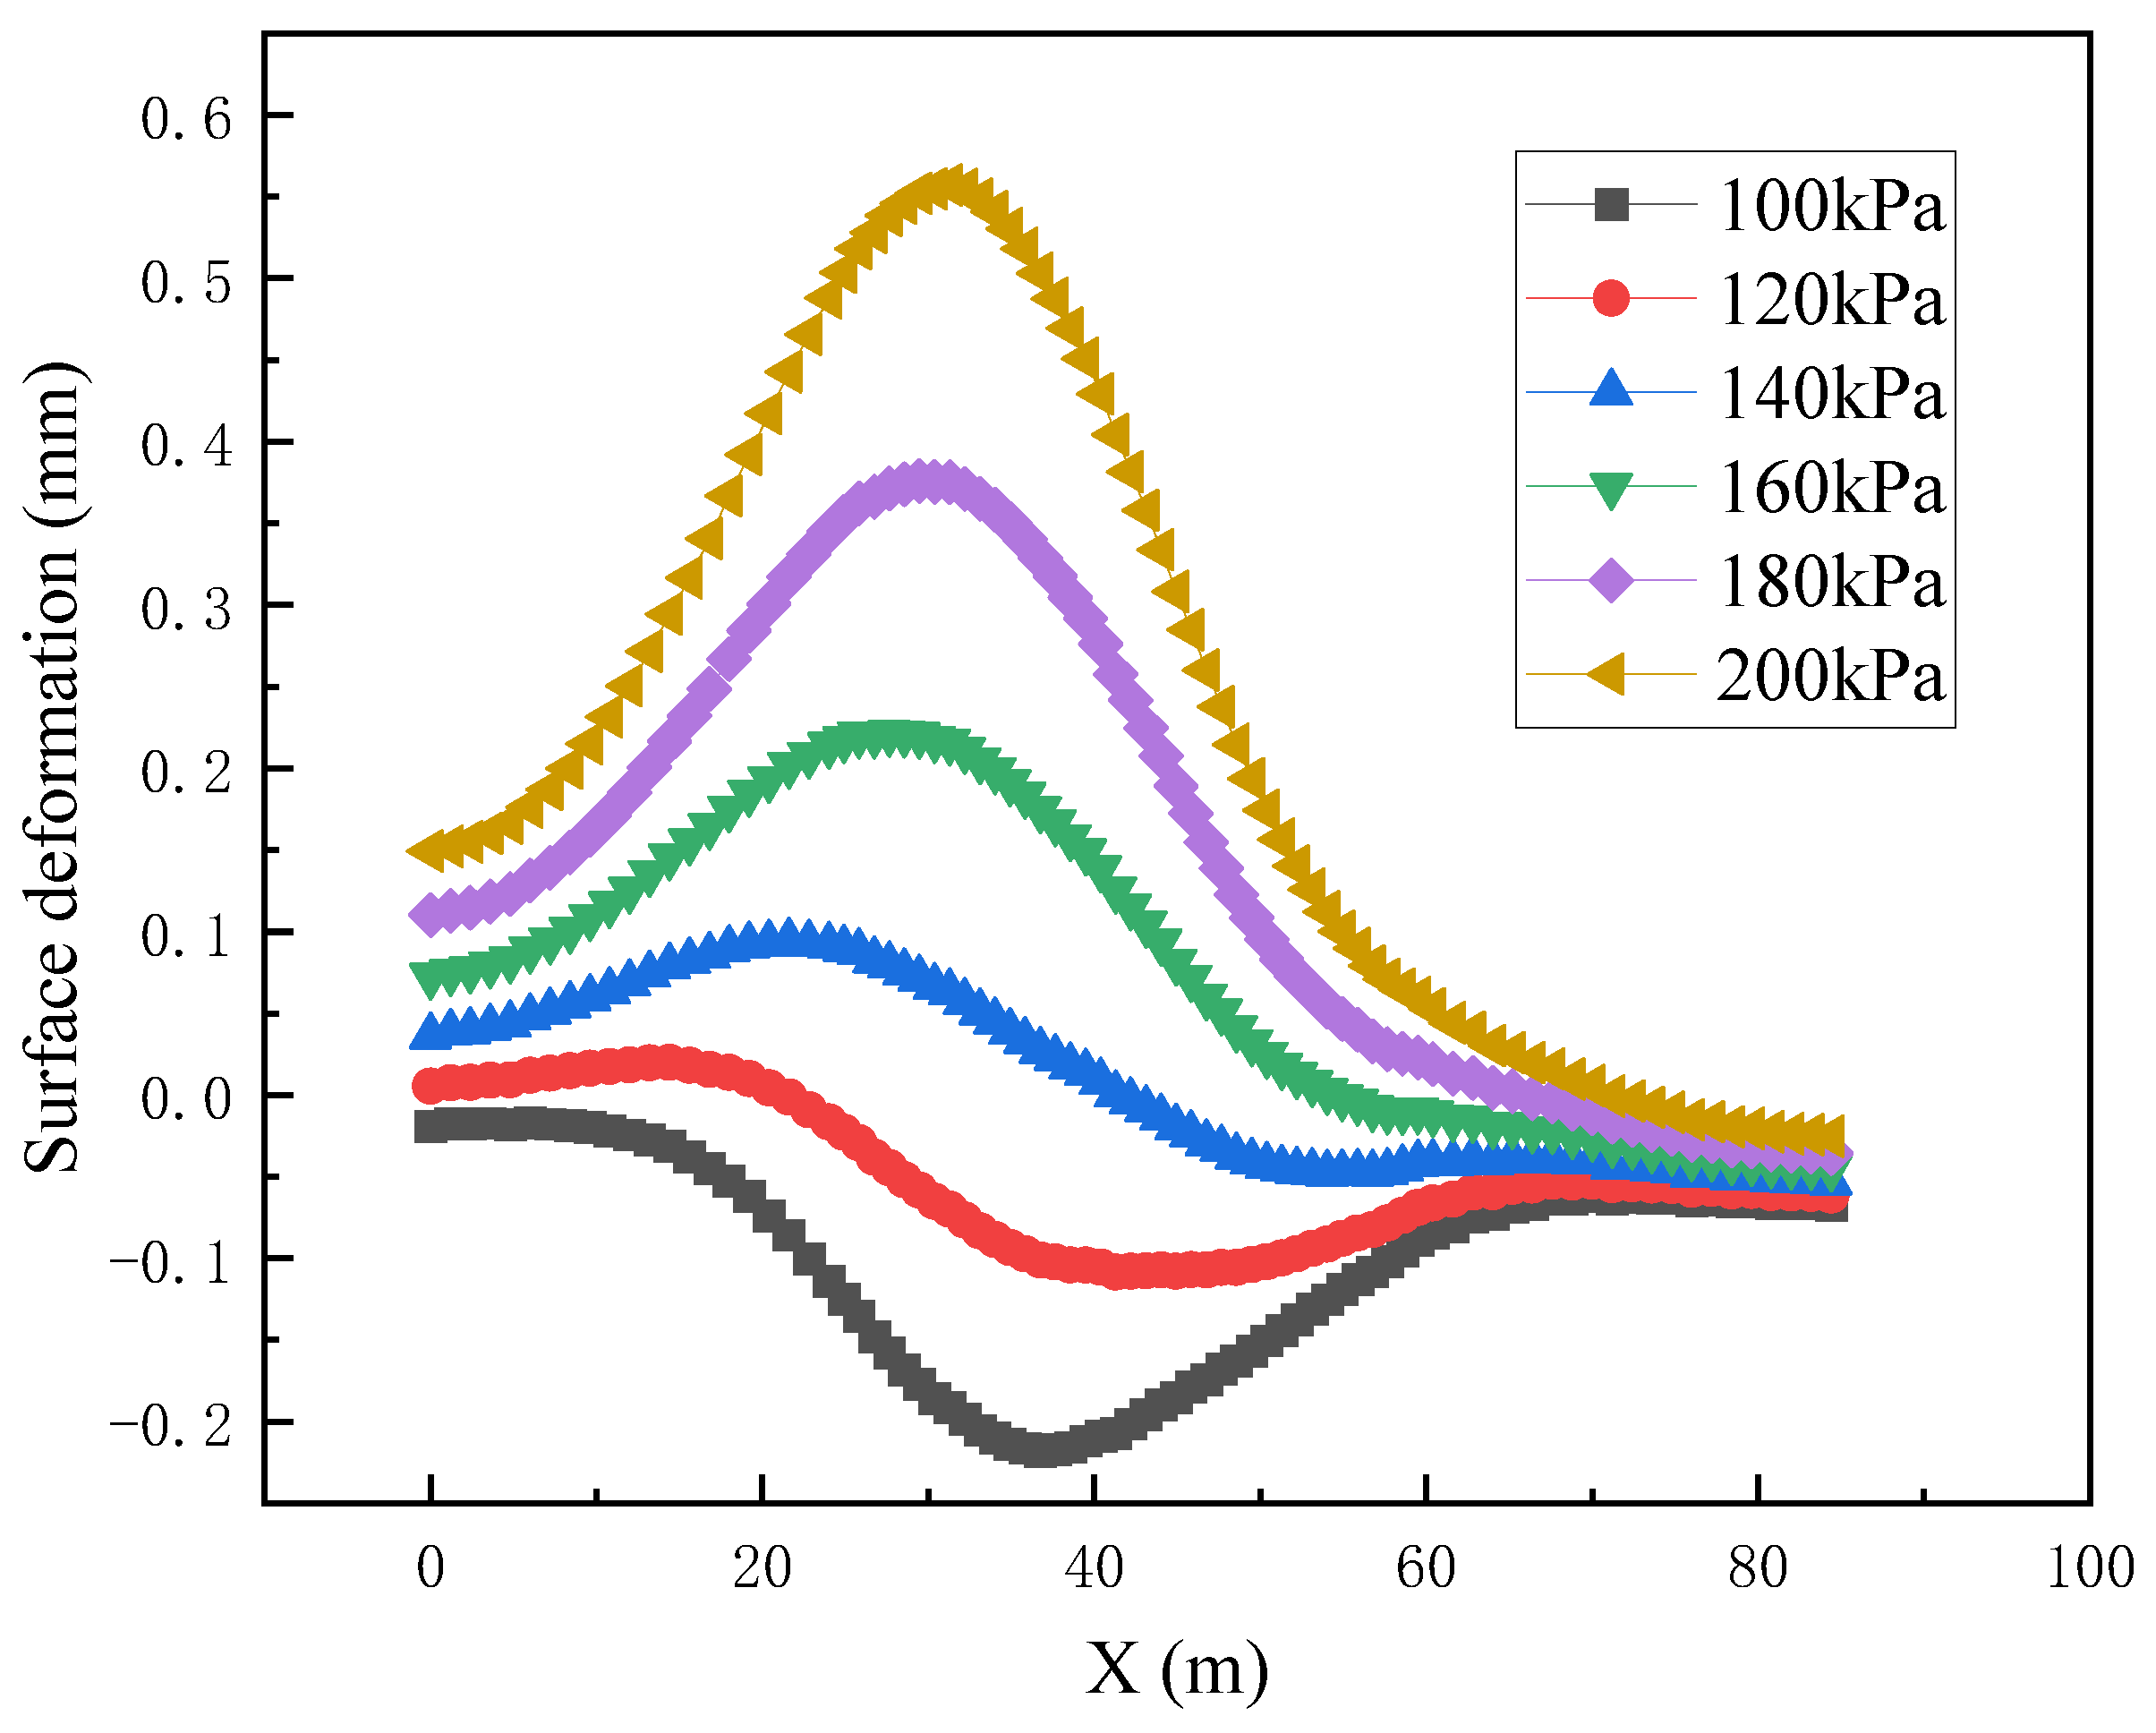
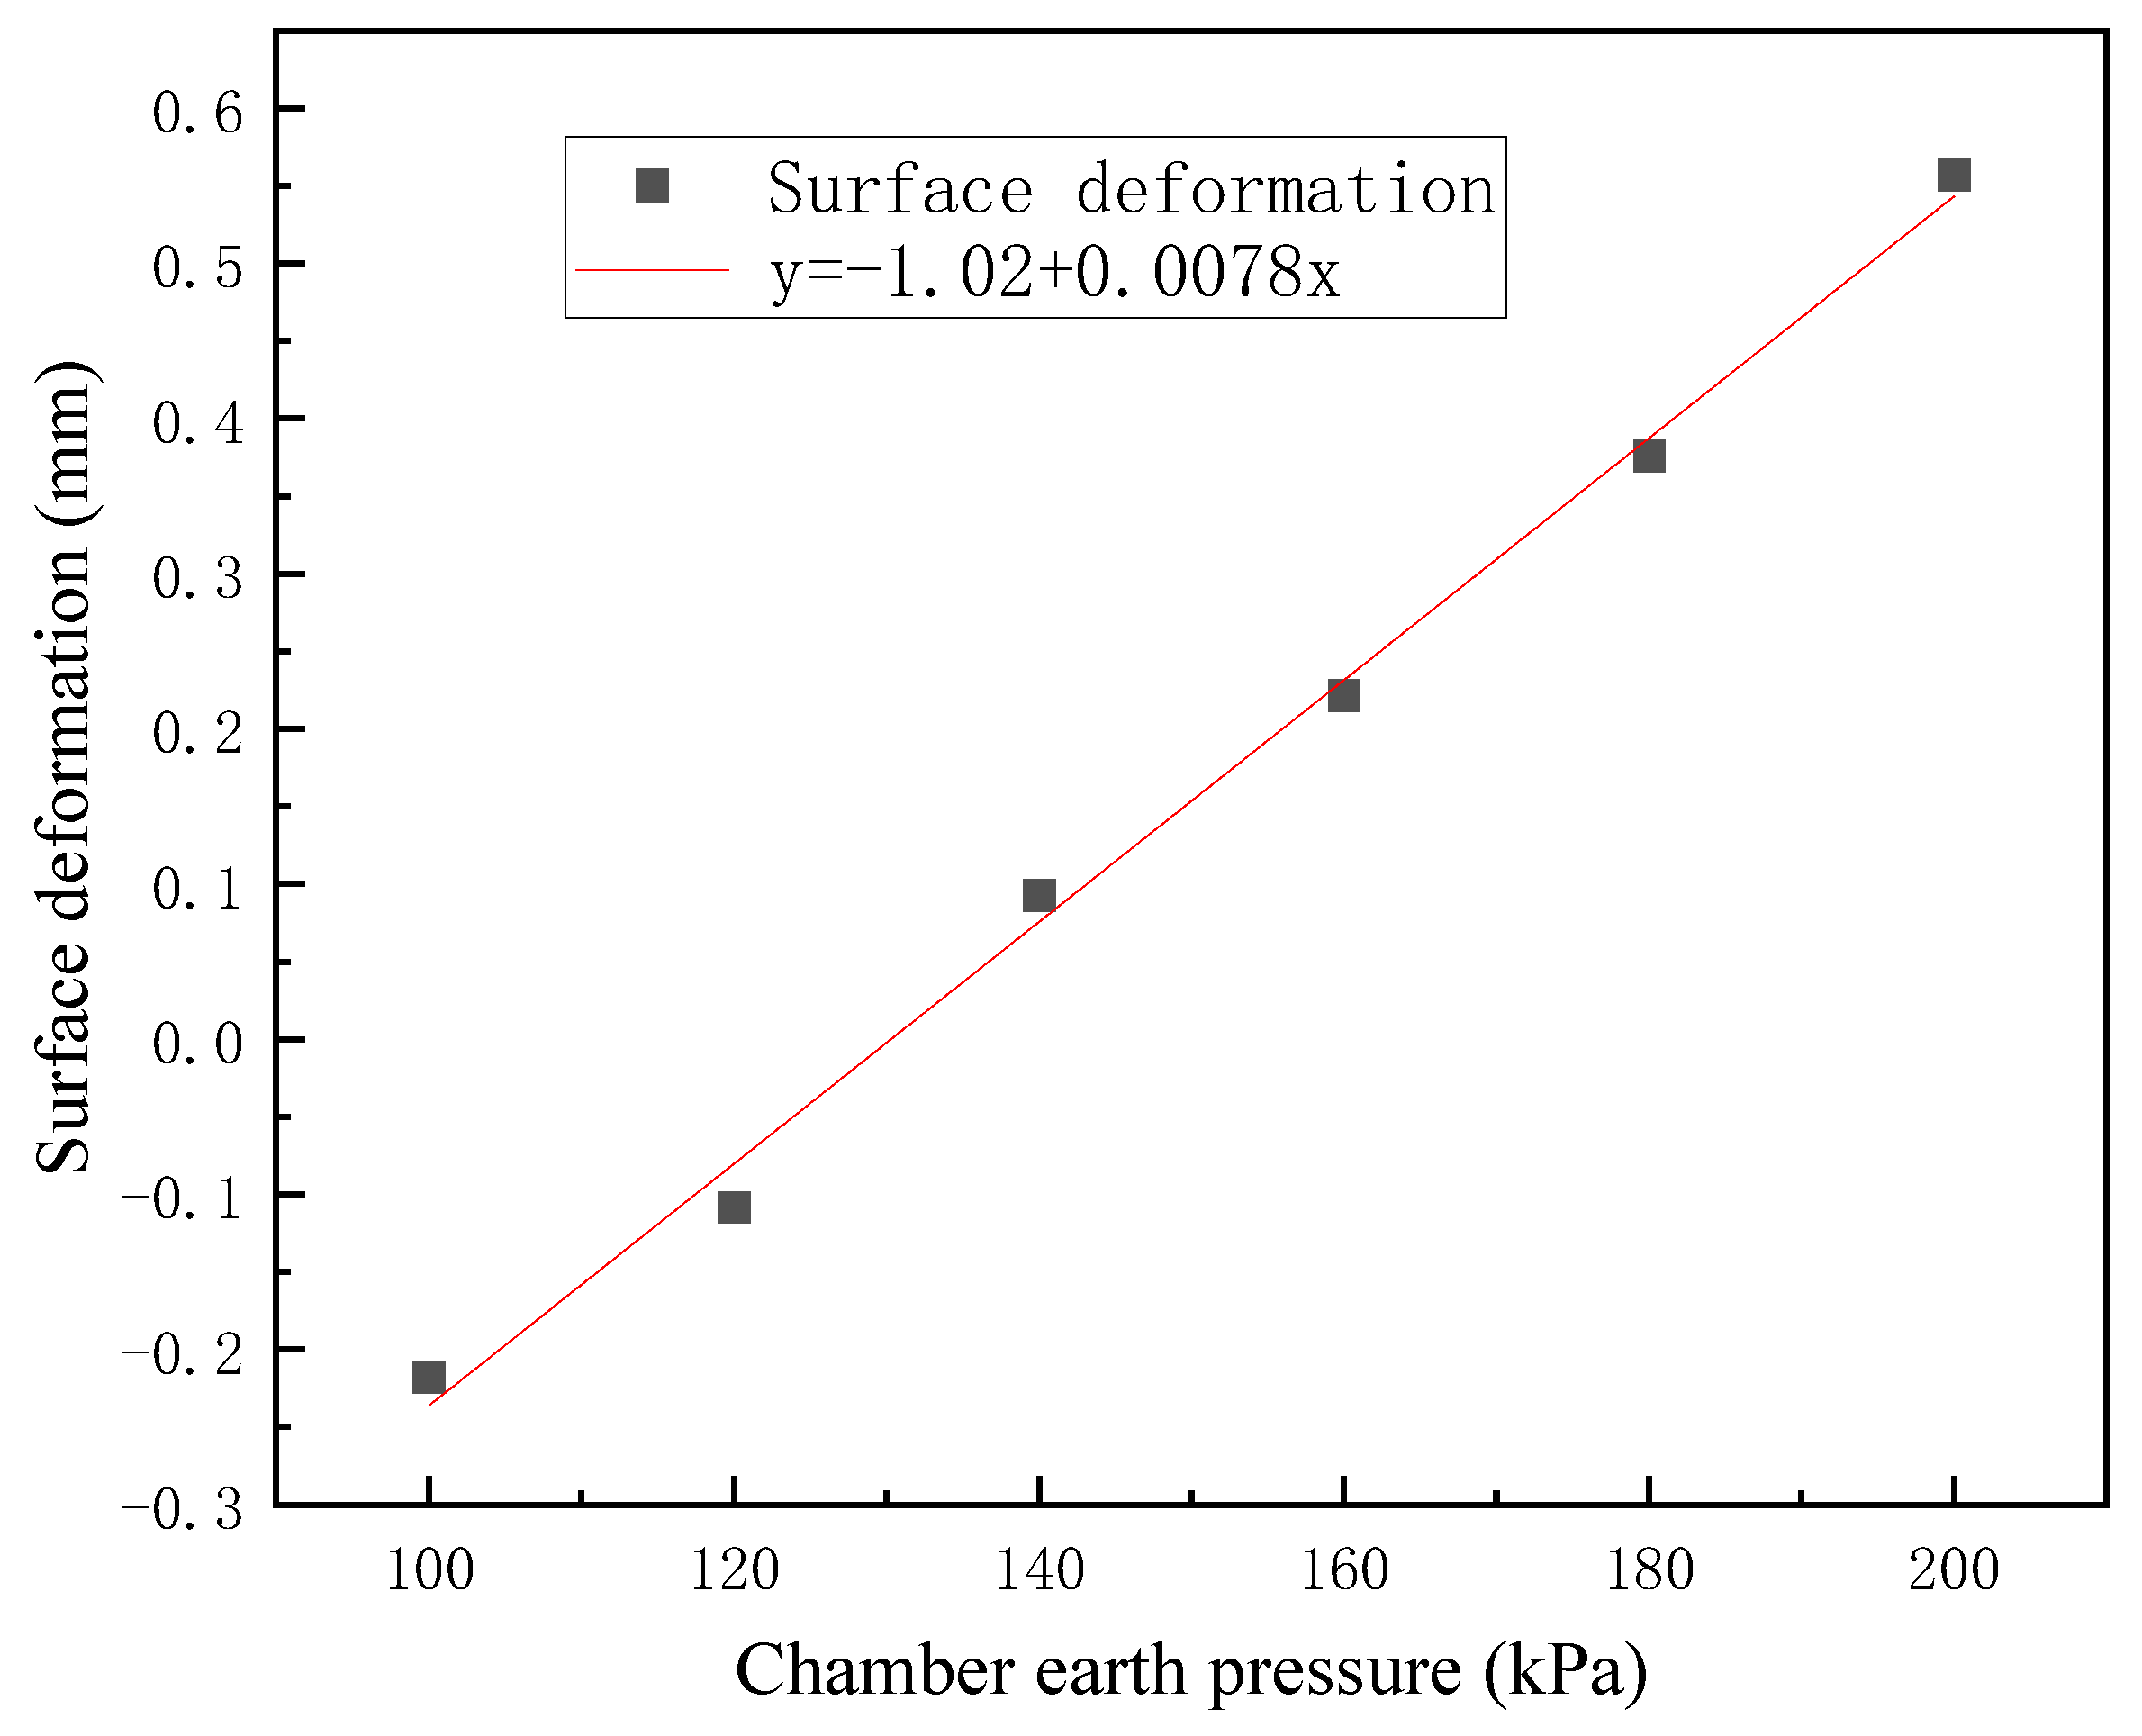
4.2. Deformation in Formation under Different Soil Bin Pressures
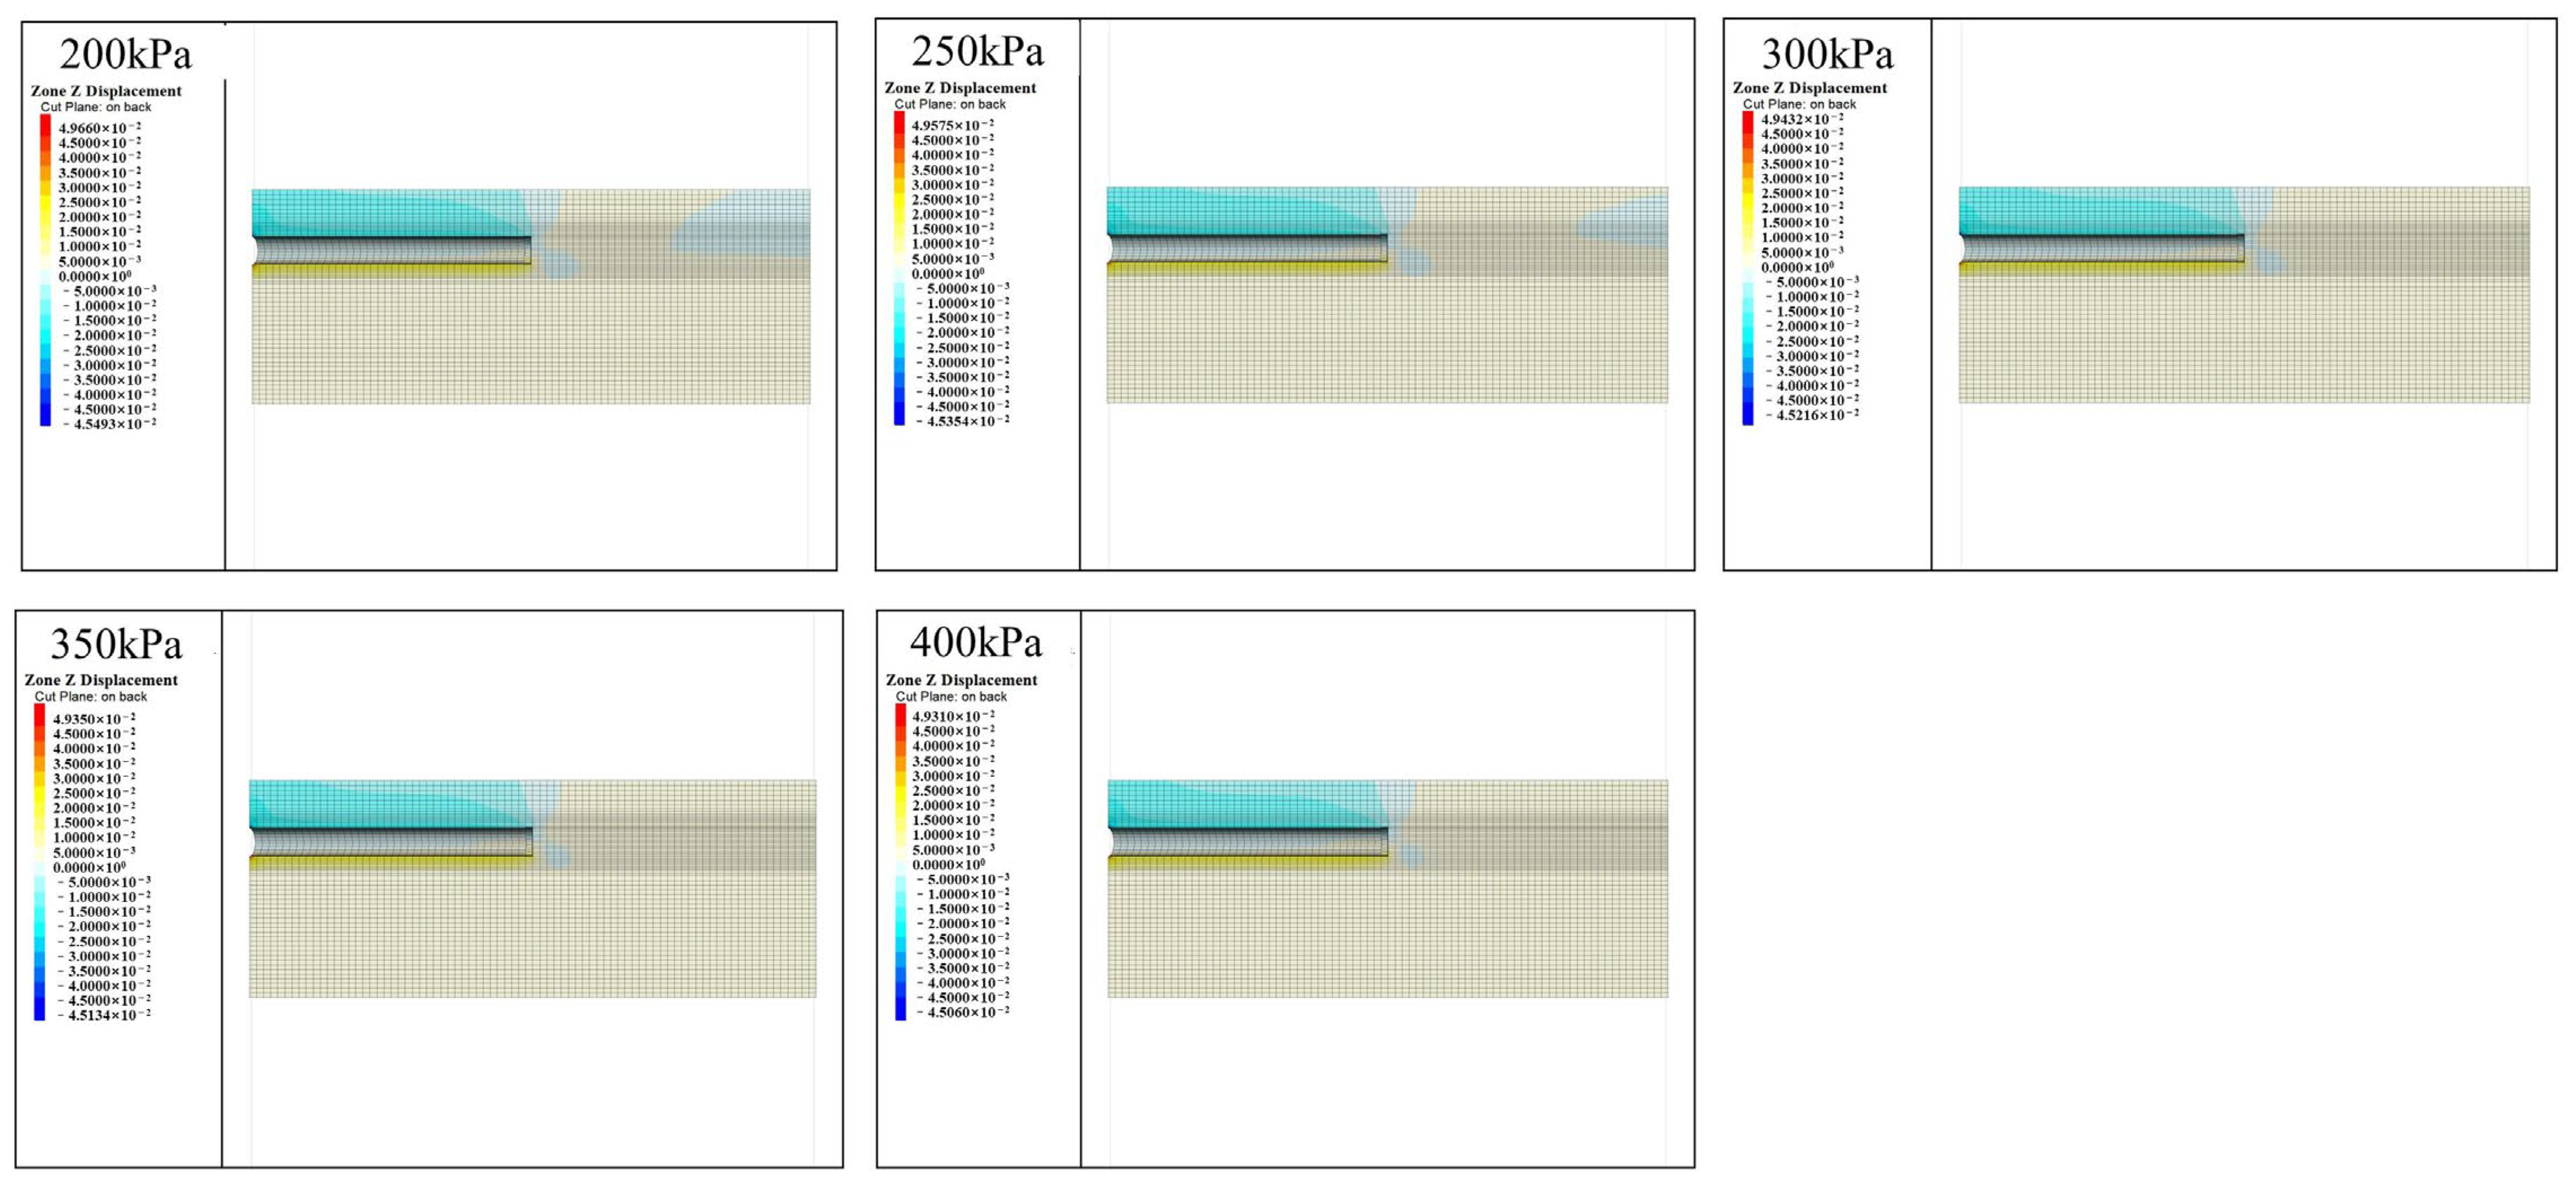
4.3. Deformation in Formation under Different Grouting Pressures
5. Discussion
5.1. Effect of Composite Strata Ratios on Settlement
5.2. Effect of Soil Bin Pressures on Settlement
5.3. Effect of Grouting Pressures on Settlement
6. Conclusions
Author Contributions
Funding
Data Availability Statement
Conflicts of Interest
References
- Yang, H.; Shi, H.T.; Jiang, X.L.; Liu, C. Influence of Construction Process of Double-Line Shield Tunnel Crossing Frame Structure on Ground Settlement. Geotech. Geol. Eng. 2020, 38, 1531–1545. [Google Scholar] [CrossRef]
- Wang, F. Evaluation of Surface Subsidence During TBM Construction of Urban Tunnels Based on Generalized Rheological Theory. Geotech. Geol. Eng. 2022, 40, 1323–1330. [Google Scholar] [CrossRef]
- Salour, F.; Erlingsson, S. Permanent deformation characteristics of silty sand subgrades from multistage RLT tests. Int. J. Pavement Eng. 2017, 18, 236–246. [Google Scholar] [CrossRef]
- Akbarimehr, D.; Rahai, A.; Eslami, A.; Karakouzian, M. Deformation Characteristics of Rubber Waste Powder-Clay Mixtures. Sustainability 2023, 15, 12384. [Google Scholar] [CrossRef]
- Peck, R. Deep excavations and tunnelling in soft ground. In Proceedings of the 7th International Conference on Soil Mechanics and Foundation Engineering, Mexico City, Mexico; 1969; pp. 225–290. Available online: https://www.issmge.org/publications/publication/deep-excavations-and-tunneling-in-soft-ground (accessed on 10 April 2024).
- O’Reilly, M.P.; New, B.M. Settlements above tunnels in the United Kingdom—Their magnitude and prediction. Proc. Tunn. 1982, 173–181. Available online: https://trid.trb.org/view/186714 (accessed on 10 April 2024). [CrossRef]
- Mair, R.; Taylor, R.; Bracegirdle, A. Subsurface settlement profiles above tunnels in clay. Geotechnique 1995, 45, 361–362. [Google Scholar] [CrossRef]
- Attewell, P.B.; Yeates, J.; Selby, A.R. Soil Movements Induced by Tunnelling and their Effects on Pipelines and Structures; Thomson Science and Professional: New York, NY, USA, 1986. [Google Scholar]
- Liu, J.; Hou, X. Shield Tunnel; China Railway Publishing House: Beijing, China, 1991. [Google Scholar]
- Chen, C.; Zhao, C.; Wei, G.; Ding, Z. Prediction of soil settlement induced by double-line shield tunnel based on Peck formula. Rock. Soil. Mech. 2014, 35, 2212–2218. (In Chinese) [Google Scholar]
- Zhang, Y.; Cao, W.; Zhou, S.; Zhou, S.; Xing, J.; Huang, Y. Prediction of three-dimensional subface and subsurface settlement caused by shield tunnelling based on Peck formula. J. Railw. Sci. Eng. 2021, 18, 153–161. (In Chinese) [Google Scholar]
- Zhang, Z.; Zhang, M.; Jiang, Y.; Bai, Q.; Zhao, Q. Analytical prediction for ground movements and liner internal forces induced by shallow tunnels considering non-uniform convergence pattern and ground-liner interaction mechanism. Soils Found. 2017, 57, 211–226. [Google Scholar] [CrossRef]
- Kong, F.C.; Lu, D.C.; Du, X.L.; Shen, C.P. Displacement analytical prediction of shallow tunnel based on unified displacement function under slope boundary. Int. J. Numer. Anal. Met. 2019, 43, 183–211. [Google Scholar] [CrossRef]
- Zeng, B.; Huang, D. Soil deformation induced by Double-O-Tube shield tunneling with rolling based on stochastic medium theory. Tunn. Undergr. Space Technol. 2016, 60, 165–177. [Google Scholar] [CrossRef]
- Rowe, R.; Lee, K. An evaluation of simplified techniques for estimating three-dimensional undrained ground movements due to tunnelling in soft soils. Can. Geotech. J. 2011, 29, 39–52. [Google Scholar] [CrossRef]
- He, C.; Jiang, Y.C.; Fang, Y.; Feng, K.; Wang, J. Impact of Shield Tunneling on Adjacent Pile Foundation in Sandy Cobble Strata. Adv. Struct. Eng. 2013, 16, 1457–1467. [Google Scholar] [CrossRef]
- He, C.; Wang, Y.; Fang, Y.; Xie, J.; Zhao, Q. Similarity model test of Earth-Pressure-Balanced shield tunneling process. China Civ. Eng. J. 2012, 45, 244–255. [Google Scholar]
- Feng, Z.Y.; Liu, B.; Zhang, S.J.; Kang, F.; Hui, H.P.; Tang, Q. Dynamic Failure Process of Soil Particles at the End of Shield Tunnel Based on Discrete Element. Environ. Sci. Eng. 2023, 509–520. [Google Scholar] [CrossRef] [PubMed]
- Yang, J.; Xu, D.; Cai, J.; Zhou, Y. Influence of Tunneling on Adjacent Foundations Based on Boundary Element Method. J. Chongqing Jiaotong Univ. Nat. Sci. 2019, 38, 35–40+122. [Google Scholar]
- Lei, H.Y.; Shi, L.; Hu, Y.; Zheng, G.; Zhang, T.Q.; Jia, R. Ground movement and settlement prediction induced by double-track curvature shield tunneling. Acta Geotech. 2024. [Google Scholar] [CrossRef]
- Li, S.; Chen, Y.X.; Huang, L.H.; Guo, E.P. Study on Response and Influencing Factors of Shield Single/Twin Tunnel under Seismic Loading using FLAC 3D. Shock. Vib. 2022, 2022, 2224198. [Google Scholar] [CrossRef]
- Yuan, W.; Fu, H.L.; Zhang, J.B.; Huang, Z. Analytical Prediction for Tunneling-Induced Ground Movements with Modified Deformation Pattern. Int. J. Geomech. 2018, 18, 04018039.1–04018039.12. [Google Scholar] [CrossRef]
- Guo, L. Law of Ground Surface Settlement Caused by Shield Tunnel Construction in Sand/Clay Compound Strata. Mod. Tunn. Technol. 2017, 54, 130–137. [Google Scholar]
- Zhou, L.; Zhang, M.; Wang, W.; Lv, Y.; Han, J.; Zhang, J. Analysis of the Influence of Mixed stratum of Up Soft and Down Hard on Shield Tunnel Construction in Guangzhou. Railw. Stand. Des. 2018, 62, 113–114. [Google Scholar]
- Ochmanski, M.; Modoni, G.; Bzówka, J. Numerical analysis of tunnelling with jet-grouted canopy. Soils Found. 2015, 55, 929–942. [Google Scholar] [CrossRef]
- Anato, N.J.; Chen, J.; Tang, A.P.; Assogba, O.C. Numerical Investigation of Ground Settlements Induced by the Construction of Nanjing WeiSanLu Tunnel and Parametric Analysis. Arab. J. Sci. Eng. 2021, 46, 11223–11239. [Google Scholar] [CrossRef]
- Li, X.; Lu, D.; Sun, H.; Hu, J.; Li, J.; Wu, X.; Xu, J. Stratum Deformation Law of Tidal River by Shield Tunneling under Shallow Overburden Soil. Sci. Technol. Eng. 2023, 23, 1270–1277. [Google Scholar]
- Sun, F.X.; Jin, Z.Z.; Wang, C.L.; Gou, C.F.; Li, X.C.; Liu, C.; Yu, Z. Case Study on Tunnel Settlement Calculations during Construction Considering Shield Disturbance. Ksce J. Civ. Eng. 2023, 27, 2202–2216. [Google Scholar] [CrossRef]
- He, J.Z.; Liao, S.M.; Liu, M.B.; Sun, J.C.; Xi, X.G. The soil arching effect induced by shield tunnelling under asymmetric surface loading. Comput. Geotech. 2023, 154, 105145. [Google Scholar] [CrossRef]
- Zhang, Z.G.; Chen, J.; Zhu, Z.G.; Wei, G.; Wu, Z.T.; Chen, Z.K. Analysis of ground settlement induced by small radius curve tunnel excavation considering shield articulation effect. Rock. Soil. Mech. 2023, 44, 1165–1178. [Google Scholar] [CrossRef]
- Ding, J.W.; Zhang, S.; Zhang, H.; Guo, C.; Liao, Z.S.; Liu, H.G. Ground Settlement Caused by Shield Tunneling in Soil-Rock Composite Strata. J. Perform. Constr. Fac. 2021, 35, 04021057.1–04021057.12. [Google Scholar] [CrossRef]
- Chen, R.P.; Meng, F.Y.; Ye, Y.H.; Liu, Y. Numerical simulation of the uplift behavior of shield tunnel during construction stage. Soils Found. 2018, 58, 370–381. [Google Scholar] [CrossRef]
- Zhong, X.C.; Huang, S.Y.; Hum, R.G.; Zhu, C.; Hu, Y.K.; Chen, X.Q. Longitudinal uplift characteristics of segments of shield tunnels based on buoyancy of grouting. Rock. Soil. Mech. 2023, 44, 1615–1624. [Google Scholar] [CrossRef]


| Method | Research Result | Author | Year |
|---|---|---|---|
| Empirical formula methods | Cross-sectional settlement formula | Peck [5] | 1969 |
| Empirical formula methods | The correlation between settlement groove width coefficient and tunnel center axis burial depth | O’Reilly and New [6] | 1982 |
| Empirical formula methods | Vertical surface settlement trough curve | Attewell et al. [8] | 1986 |
| Empirical formula methods | Vertical surface settlement trough curve | Liu and Hou [9] | 1991 |
| Mathematical analytical methods | Mindlin’s basic solution | Rowe and Lee [15] | 1992 |
| Empirical formula methods | Calculation of lateral settlement of deep soil | Mair et al. [7] | 1993 |
| Field testing procedures | Field test | He et al. [17] | 2012 |
| Model testing techniques | Indoor model tests | He et al. [16] | 2013 |
| Mathematical analytical methods | Random medium theory | Zeng et al. [14] | 2016 |
| Mathematical analytical methods | Complex variable function method | Zhang et al. [12] | 2017 |
| Mathematical analytical methods | Mirror method | Yuan et al. [22] | 2018 |
| Mathematical analytical methods | Stress function method in polar coordinates | Kong et al. [13] | 2019 |
| Numerical simulation methods | Boundary element method | Yang et al. [19] | 2019 |
| Empirical formula methods | Settlement of double-track shield tunnel | Zhang et al. [11] | 2021 |
| Numerical simulation methods | Finite difference method | Li et al. [21] | 2022 |
| Numerical simulation methods | Discrete element method | Feng et al. [18] | 2023 |
| Numerical simulation methods | Finite element method | Lei et al. [20] | 2024 |
| Strata | Density ρ/(kg·m−3) | Bulk Modulus K/MPa | Shear Modulus G/MPa | c/kPa | φ/° |
|---|---|---|---|---|---|
| Plain fill soil | 1800 | 22 | 7 | 19.2 | 18 |
| Fine sand | 1750 | 29 | 13 | 0 | 22 |
| Silty clay | 1970 | 25 | 9 | 23 | 20 |
| Coarse gravel sand | 2050 | 41 | 21 | 80 | 35 |
| Strongly weathered granite | 2300 | 49 | 33 | 170 | 38 |
| Moderately weathered granite | 2500 | 8621 | 6198 | 500 | 40 |
| Slightly weathered granite | 2650 | 17,778 | 13,333 | 2000 | 45 |
| Slurry | 2100 | 56.2 | 38.7 | — | — |
| Segments | 2500 | 7000 | 4200 | — | — |
| Condition | 1 | 2 | 3 | 4 | 5 | 6 | 7 |
|---|---|---|---|---|---|---|---|
| Composite ratio (%) | 0% | 20% | 40% | 50% | 60% | 80% | 100% |
| Soil pressure (kPa) | 100 | 120 | 140 | 160 | 180 | 200 | - |
| Grouting pressure (kPa) | 200 | 250 | 300 | 350 | 400 | - | - |
Disclaimer/Publisher’s Note: The statements, opinions and data contained in all publications are solely those of the individual author(s) and contributor(s) and not of MDPI and/or the editor(s). MDPI and/or the editor(s) disclaim responsibility for any injury to people or property resulting from any ideas, methods, instructions or products referred to in the content. |
© 2024 by the authors. Licensee MDPI, Basel, Switzerland. This article is an open access article distributed under the terms and conditions of the Creative Commons Attribution (CC BY) license (https://creativecommons.org/licenses/by/4.0/).
Share and Cite
Wu, X.; Xu, J.; Wang, S.; Sha, P.; Han, Z.; Chen, X.; Shu, S.; Qiao, W.; Zeng, X. Ground Deformation of Shield Tunneling through Composite Strata in Coastal Areas. Buildings 2024, 14, 1236. https://0-doi-org.brum.beds.ac.uk/10.3390/buildings14051236
Wu X, Xu J, Wang S, Sha P, Han Z, Chen X, Shu S, Qiao W, Zeng X. Ground Deformation of Shield Tunneling through Composite Strata in Coastal Areas. Buildings. 2024; 14(5):1236. https://0-doi-org.brum.beds.ac.uk/10.3390/buildings14051236
Chicago/Turabian StyleWu, Xiong, Jiangbo Xu, Shaowei Wang, Peng Sha, Zemin Han, Xinyu Chen, Sheng Shu, Wei Qiao, and Xianglong Zeng. 2024. "Ground Deformation of Shield Tunneling through Composite Strata in Coastal Areas" Buildings 14, no. 5: 1236. https://0-doi-org.brum.beds.ac.uk/10.3390/buildings14051236