
Development of Worth Estimation and Key Target Selection Methods for Effective VE


1
Department of Civil Engineering, Kyungpook National University, 80 Daehakro, Daegu 41566, Republic of Korea
2
Department of Architectural Engineering, Kyungpook National University, 80 Daehakro, Daegu 41566, Republic of Korea
*
Author to whom correspondence should be addressed.
Buildings 2024, 14(5), 1235; https://0-doi-org.brum.beds.ac.uk/10.3390/buildings14051235
Submission received: 13 March 2024
/
Revised: 20 April 2024
/
Accepted: 24 April 2024
/
Published: 26 April 2024
(This article belongs to the Section Construction Management, and Computers & Digitization)
Abstract
:VE is a powerful technique for analyzing a design with a focus on functionality, reducing costs, and increasing value. However, in order to proceed with the design of VE, the theoretical basis for the VE target selection process, which must be preceded in the preparation stage, is lacking, and as a result, it is difficult to verify the most effective target selection. Thus, a theoretical basis is needed. In this study, we intend to quantify the “Worth” value of the “Cost to Worth” technique and present an objective model of the target selection method using the derived value index (VI). For this purpose, cost worth (Worth C) was calculated based on the performance data of 1008 cases for 15 building types provided by the Domestic Public Procurement Service and the share of 83 detailed processes in seven fields. Then, a survey was conducted targeting the ordering companies, and the final worth (Worth F) was calculated by multiplying the derived customer value (Worth V) weight for each detailed work type. We calculated the value index (VI) by comparing “Cost” and “Worth F” for each detailed construction type of the VE project and developed a model to select construction types that exceed the VI standard value derived using the standard error of the population. Both cost experts and non-cost experts can use the developed model to specify the VE target selection criteria in order to easily select the key target, objectively sort the values that serve as the basis for calculating the value index, and make it possible to more easily select the VE target selection criteria based on theoretical evidence. Also, the model can be used to obtain effective detailed design VE results.
1. Introduction
1.1. Research Background and Purpose
A dictionary definition of value is a fair return or equivalent in goods, services, or money for something exchanged. More specifically, Value is an expression of the relationship between function and resources. Value is represented by the relationship.
Function is measured by the reliable performance of customer requirements. Resources are measured by cost, materials, labor, price, time, energy, etc. required to accomplish those functions. “The Value Methodology (VM)” is a systematic process used by a multidisciplinary team to improve the value of a project, product, or process through the analysis of its functions. The VM process comprises techniques that enable the project team to provide the highest value projects, products, and processes for the customer. The term “Value Analysis (VA)” is typically used when applying the VM process, to improve existing applications, such as manufactured products. The term “Value Engineering (VE)” is used when applying VM to new projects, products, processes, and services. Value Management is the application of VA and VE with other quality and improvement techniques to achieve strategic value improvement. Key concepts include understanding the functions which the customer wants and needs and using functional analysis to provide those functions and quality at the lowest total life cycle cost. A multidisciplinary team approach is used. Experts from various disciplines participate on the team. The team is led or facilitated by a qualified Value Methodology professional [1].
“VM facilitator” means that in every VM study, team members are the experts providing the right set of skills and knowledge to the goal of the study. The “VM facilitator” is the one who will guide the work of the group to accomplish its goals. The facilitator will plan, lead, and facilitate the VM study. The “VM facilitator” is substantively neutral, has no significant decision-making authority, enables a group to improve how it defines and solves problems, and increases a group’s effectiveness. In the context of VM, it is the person who leads the group through the VM Job Plan [2].
This study aims to discuss the VE currently being implemented in Korea among the three types of VM.
VE (value engineering) refers to systematic improvement activities conducted to enhance the functionality and performance of facilities and achieve design goals with a minimal life cycle cost (LCC) [3]. VE proceeds in the following sequence: user requirement elicitation, target selection, functional analysis, idea generation and concretization, and alternative development. VE has been widely used as a cost-saving tool since its inception in 1947, but there is not much research on methodologies. Research on effective methods for selecting VE targets among existing studies is scarce. Therefore, VE target selection is often ineffective and non-standardized. The problem of undervaluing VE outcomes due to this issue needs to be addressed as a priority. VE target selection is the phase where the VE team identifies the subjects to be reviewed to enhance the value of the project. Above all, there is a lack of theoretical basis regarding the criteria and approaches for target selection in the VE preparation phase [4].
Without sufficient theoretical basis, VE target selection becomes arbitrary, making it difficult to validate the most effective choices. When target selection is not carried out properly and the analysis phase begins, there is often a tendency to focus mainly on abstract functional analysis. Ultimately, this can lead to a lack of consistency in idea generation later on. Most domestic construction VE projects in Korea are currently facing such situations.
In VE activities, high-cost areas may not necessarily be the primary targets for value enhancement. While simple cost-cutting activities may focus solely on high-cost areas, VE considers the difference between the costs and the “Worth” of various functional elements to identify areas for value enhancement. “Worth” is a concept derived from functional analysis and is theoretically defined as the minimum cost required to achieve the same function of an item or element. The procedure of the “Cost to Worth” technique is as follows: (1) In a cost model, a representative function (or type of construction) is defined for each cost item. (2) The “Worth” of this function (type of construction) is calculated, and items are selected as VE targets in order of the largest difference between cost and “Worth”. The difference between cost and worth represents the imbalance of value and is expressed as cost/worth. The method for determining “Worth” relies heavily on the experience of the VE team, and its value can be quite approximate [5].
Among the most widely used VE target selection techniques, the main limitations of “Cost modeling techniques” include evaluation based on cost-centric criteria, deterioration of objectivity and reliability of worth, and unrealistic worth estimations. Additionally, the “Cost to Worth” method defines “Worth” as the minimum cost required to perform the same function. To estimate this “Worth”, a single fundamental function representing each cost item is required. However, the experience of the VE team can influence the estimation of “Worth” in the “Cost to Worth” method, leading to a decrease in objectivity and reliability of the “Worth” [6].
Above all, the lack of established theoretical foundations regarding criteria and approaches for target selection in VE leads to a subjective tendency in VE target selection. Furthermore, it is also difficult to validate the optimal and effective target selection. Therefore, to increase the objectivity and reliability of VE target selection, there is a need for theoretical foundations regarding the scope, methods, and effective implementation of VE after selection [4].
In relation to cost modeling, at the stage when the design is completed, the client needs to calculate the anticipated cost for the construction, that is, the bid amount, and then commission the construction. Overseas, there are professional quantity surveying institutions, but in Korea, requirements and certification systems for quantity surveyors are still lacking. Therefore, more specialized research and development are needed [7].
Is there any systematic way to perform VE target selection more efficiently even without cost experts? In other words, what methods are available to increase the objectivity and reliability of the “Worth”, representing the minimum cost?
To address this question, this study aims to objectify the “Cost to Worth” method during the design VE target selection process, with the goal of providing a model that enables efficient VE implementation within limited timeframes. The specific objectives for this are as follows:
- (1)
- Collect cost data from the Public Procurement Service Construction Cost Information Plaza and digitize it into a database, and establish standard costs for each type of construction to serve as the basis for determining the “Worth”.
- (2)
- Set user value to consider weights according to user requirements.
- (3)
- Establish the value index (VI) as the benchmark for VE target selection.
The expected outcome of this study is the enhancement of objectivity and reliability in the VE target selection method. Specifically, the creation of benchmarks for “Worth” will enable individuals, even those who are not cost experts, to calculate “Cost to Worth” without difficulty. Furthermore, saving time in finding the benchmark “Worth” value will allow for more time to be allocated to idea generation. Ultimately, this will provide a useful methodology for dealing with budget overruns in recent architectural design projects and deriving customer value.
1.2. Scope and Progress of Research
Construction projects are categorized into seven major fields: architecture, mechanical, electrical, communication, fire protection, civil engineering, and landscaping. Public construction projects select designers through architectural design competitions. Since there is currently no system in place for professionally overseeing the appropriateness of cost distribution among each field and sub-field of construction, occurrences of exceeding the construction budget are frequent. During the value engineering (VE) review phase, particularly in the VE preparation stage, a model for selecting targets that exceed necessary functions will be developed. This model aims to identify construction types exceeding necessary functions and validate their effectiveness. The following research scope and methods were established for this purpose.
For support the calculation of the appropriate construction budget at the beginning of the construction project and efficient cost management at each stage of the construction, the domestic Public Procurement Service (Construction Cost Information Plaza) [8], was used as a big data basis. The website has been providing data for 15 building types and a total of 1008 projects since January 2016. However, the website only provides a search function without offering the original data. Therefore, we organized data from 619 projects of the 13 most used types into a database. Among these, we selected 237 public buildings with the highest number of records as the subjects for analysis. We designated public buildings for which construction cost estimation has been completed as the scope of research for design VE.
The sequence of research, as depicted in Figure 1, involves selecting the floor area and number of floors derived through regression analysis as input variables from the surveyed data, which have a significant impact on construction costs. The sequence is as follows: (1) carry out a detailed construction cost “Worth” analysis based on the construction cost database, (2) develop customer demand “Worth” survey items, (3) develop a customer demand “Worth” weight survey, (4) validate the final “Worth” for each specific type of work by multiplying the outcomes obtained from the first and third steps, (5) calculate the value index (VI), (6) use the standard error to calculate the VI standard value. We present a standardized model that focuses on selecting detailed construction types exceeding the value index (VI) standard values derived through the following procedure, allowing for concentrated idea generation.
2. Literature Review
When examining the domestic and international literature related to value engineering (VE), four main contexts emerge: dissemination of basic VE concepts, functional analysis, practical application cases, and applications in fields beyond construction. While these international documents may not have direct relevance to this study, an examination of current trends in VE-related literature is desired.
Robin proposes methods for integrating the differing perspectives of systems engineers and value engineers using the functional analysis systems technique (FAST) in value engineering [9]. Ilayaraja investigates the applicability of VE in construction projects, proposing methods to optimize costs and enhance quality [10]. Behncke explores the potential of applying VE in systems engineering, emphasizing the importance of new models in enhancing the value of entire systems [11]. Rahman explores enhancing the value of massive infrastructure projects in Indonesia using VE methodologies, underlining the significance of VE and suggesting ways to optimize project outcomes [12]. Al-Muaybid investigates the role of VE in sustaining construction during the COVID-19 pandemic in Saudi Arabia, highlighting its importance and providing insights into its utilization [13]. Nejatyan conducts a Delphi-based survey focusing on determining factors influencing performance improvement in construction project management through value-based VE strategies, suggesting new concepts and indicating the need for further research and proposals [14]. Chen examines the trends of VE in construction projects over the past decade, providing insights into its various applications and effects, contributing to future research and industrial development [15]. Jin explores the impact of engineering changes on the cash flow value transfer in construction projects, emphasizing effective management of engineering changes and stability of cash flow [16]. Song develops a mobile environment-based VE system to complement the temporal and spatial losses often encountered in design VE processes conducted in Korea [17]. Park conducts a study on deriving strategies for effective construction VE from the perspective of construction companies, identifying influential factors and proposing measures for enhancing construction VE practices [18]. Khulug emphasizes the utilization of building information modeling (BIM)-based virtual reality (VR) technology to enhance understanding and immersion, aiming to improve VE outcomes [19]. Park’s problems with the existing design process were confirmed to be lack of awareness of the construction company’s process, lack of connectivity between processes, limitations in idea generation techniques, unclear evaluation and performance confirmation, and insufficient use of performance data. Through an awareness survey of project participants, it was analyzed that goal setting needs to be supplemented and reflected. As a way to improve and reflect this, an application plan was presented by dividing it into schedule, cycle, and process aspects [20].
As a result of researching the foreign literature, it seems that while VE focused on field practice developed around Save International, domestic research has been developed focusing on detailed methodologies among VE applications and VE theories.
Currently, in VE activities, target selection involves narrowing down the scope of VE activities by selecting the parts of the project designated by the customer with the highest potential for value enhancement. This is because VE team resources and time are limited.
However, there are limitations to using traditional cost modeling techniques for VE target selection. To overcome this, many researchers have proposed methods for VE target selection through surveys, cost modeling methods, and “Worth” derivation methods.
Firstly, when examining previous studies utilizing surveys, the strengths lie in the use of various approaches. However, the main drawback is the tendency to prioritize a cost-centered approach. Therefore, rather than relying on biased methods that focus only on costly aspects, these studies have proposed improvements based on directions such as “customer value orientation”, “overcoming functional cost (F) limitations”, and “utilization of VE team members experience”, subjective judgment, and pursuit of consensus”, to present the “Incompatible” method as a “cost-performance evaluation technique “and a function evaluation cost modeling method [21]. In the process of conducting design VE, efforts were made to accurately grasp the user’s (client’s) requirements, which were previously overlooked. And ways to effectively integrate these requirements with target selection and functional analysis stages were explored. To achieve this, quantification of requirements from the client, users, and experts in design VE for apartment complexes was conducted. Weighting was assigned to each requirement using the analytic hierarchy Process (AHP) technique, thereby enhancing the relevance between requirements and the target selection stage. This involved developing a reliable model that increases the relevance between requirements and target selection, as opposed to the traditional method, which simply surveyed requirements and conducted target selection with little correlation [22]. The performance evaluation of VE should consider not only the final cost savings but also the interaction between various factors. To achieve this, we relied on knowledge obtained from VE experts in Taiwan using a two-stage questionnaire. They grouped PAA and PAC using analytical techniques such as FA, AHP, and SAWM, and assigned weights, thereby providing a comprehensive VE performance evaluation model that was lacking in previous studies [23]. For each room in the building, a substantial number of functional definitions were identified using experts. The extracted data were aggregated to validate and identify duplicate elements, leading to the presentation of the “Stair Fast Diagram”, a quantitative and objective form factor. The derived “Stair Fast Diagram” was turned into data to facilitate future use in similar buildings or buildings of the same scale, thus proposing a method to simplify the process of conducting design VE [24]. To gain a practical understanding of the functional analysis in the analysis phase and idea generation in the design VE activity process, a survey was conducted targeting architecture experts with experience in design VE activities. Through this, to overcome the limitations of the lack of systematic approach in functional analysis and inefficiency and lack of coherence in idea generation, the Chimera Idea Creation Concept (CICC) was proposed [25]. The quality model is an important model that represents the expectations of the client and users. It is used as a guideline for decision making and as a scale for evaluation during VE activities. They sought to solve many problems such as lack of utilization of the quality model, lack of connection with subsequent work, time/cost problems, and lack of VE recognition. Through expert surveys, quality models were established for each project type. The items of the established quality model were set as evaluation criteria, and various applications to subsequent tasks with assigned weights were suggested through pairwise comparison. Through this, a procedure improvement plan was proposed to apply the quality model more efficiently, which was usually carried out with a tendency to prioritize cost [26].
Secondly, when examining previous studies related to cost models, the strengths lie in the efforts made to derive objective results despite limited data. However, the draw-backs include the absence of clear regulations on domestic cost estimation in the cases presented.
Most of the literature is based on domestic and international performance cases; issues were analyzed to highlight the problems with the summation method of cost modeling, where a fixed representative value is selected regardless of the type of facility or construction site conditions. It has been pointed out that when selecting targets based on a single criterion, there is a problem of not adequately reflecting complex factors such as customer demands, aesthetics, relevant regulations, technical feasibility, and safety which the client, designer, and VE team subjectively judge [27]. During the preparatory phase, specifically in the information-gathering stage, it was pointed out that the intentions of the client and the unique characteristics of the project are often unclear. Additionally, due to a lack of experience and knowledge in target selection, individuals may not effectively fulfill their roles. It was suggested that data are insufficient for target selection using cost models, and due to a lack of coherence, certain aspects are omitted or simplified in the VE Job Plan. Furthermore, it was proposed that there is a problem with idea generation preceding functional analysis in subsequent stages [28]. Furthermore, the Engineering News Record (ENR) publishes the Construction Cost Index (CCI) monthly. Based on these data, cost experts and construction professionals evaluate projects, adjust budgets, and prepare bids by predicting the CCI. However, due to the variability and uncertainty of the CCI, there are occasional occurrences of irrational estimates. To address this, the time series is first transformed into a visibility graph. Based on experimental results, a new method with an acceptable level of error measurement was developed, resulting in a network approach that can predict the CCI with easier implementation and fewer errors [29]. To establish objective criteria for target selection in value engineering (VE) and to analyze changes in factors, cost index factors were derived based on the unit construction cost per unit area of buildings according to usage, scale, construction type, and by category factors. The cost of construction projects for most building types and scales was consistently compared based on the index to determine large and small values. Furthermore, a database was constructed to ensure that VE target items could be selected for any construction project, and through case analysis, a specific process for selecting VE target trades was presented [4].
Third, when examining existing research on the derivation of value index (VI) methods, El-Nashar utilized VE methodologies to find alternatives for water scarcity at the tail end of a canal, going through six stages of VE to derive three alternatives for maintaining or improving the functionality of the transportation system at minimal cost. They evaluated each alternative by calculating NPV and applied life cycle cost (LCC) methodology, solving the problem by dividing NPV of the total value to obtain the value index [30]. In addition, they improved ideas repeatedly derived from 11 highway construction cases and determined construction costs by value for different trades. They also proposed a method for selecting design VE targets based on statistical experience, suggesting trades with a value index (VI) of 1.2 or higher as design VE targets [5]. Recognizing the importance of value engineering (VE) as a means of creating value for cost savings and performance enhancement, efforts were made to address the issues in VE target selection. To achieve this, the problems associated with the previous method, which only covered high-cost areas, were resolved by selecting secondary VE targets based on the primary VE targets selected by existing high-cost area selection techniques and by reapplying fish-bone diagrams and the worth technique. Additionally, to validate the effectiveness of the proposed improvements, they were applied to real road construction VE project cases and evaluated through expert interviews, which found that the proposed improvements were considerably effective compared to traditional VE target selection methods [31].
Previous studies have mainly been limited to surveys, cost analysis, and partial introduction of “Worth” in the road construction field, with a lack of objective data for analysis. As a result, it has been difficult to find proper research on specific methods for deriving worth values and utilizing “Cost to Worth” for the value index (VI).
This study differs significantly from previous research as it addresses methods for deriving “Worth” values and key target selection based on them, which have not been covered in existing studies.
3. Method of Research
Figure 2 shows that the target selection process expressed in yellow in the entire VE progression process is an important process that must be dealt with in the initial preparation stage, and the entire study is about this process.
The targets for review can vary depending on the progress and situation of the project, ranging from analyzing materials and construction methods to selecting specific parts of the project, certain trades, or the entire project. Analysis techniques may include selecting and applying high-cost field selection techniques, “Cost to Worth” techniques, cost-performance evaluation techniques, complex evaluation techniques, and weighted composite evaluation techniques depending on the nature of the project and the target, sometimes in parallel as needed. The types and characteristics of target selection methods can be found in Table 1 of the Basic Course Material for Construction VE Specialists provided by the Korea Institute of Value Engineering (KVEI).
The “Cost to Worth” method was used among the four methods mentioned in Table 1 to select VE targets. To determine the standard “Worth” value and value index (VI), the procedure follows the steps outlined in Figure 3.
Explaining the procedure of Figure 3, first, “VM facilitator” selects the sample size based on the conditions of the VE process for the floor area and number of floors, which are important factors affecting the construction cost, derived through correlation analysis of the construction cost data in the Construction Cost Information Plaza website database. Since there are differences in the timing of construction for the target samples, the average value of the construction cost share by detailed construction type, which is not affected by the construction cost index, is calculated as the detailed construction type cost “Worth” (Worth C). After conducting a customer value survey to identify special functional requirements from the client based on the building’s use, weights are assigned to determine the customer value worth by detailed construction type Worth V. The final “Worth” (Worth F) is calculated by multiplying the previously derived detailed construction type cost “Worth” (Worth C) and customer value “Worth” (Worth V).
The value index (VI) for each detailed construction type is calculated by dividing the detailed construction type cost share of the VE project by the derived detailed construction type (Worth F), and the standard error of the target sample is selected as the VI baseline value. The procedure then identifies the detailed construction types of the project that exceed the VI baseline value as priority focus areas for idea generation.
4. Results of the Study
The sequence of research is shown in Figure 3.
![Buildings 14 01235 g003]()
Figure 3.
Research flow chart.

4.1. Data Analysis of Construction Cost Information Plaza Website
The “Construction Cost Information Plaza website” is a portal site for analyzing and predicting construction costs, designed to predict construction costs and estimate appropriate construction budgets in the early stages of construction projects and to support efficient construction cost management at each stage of construction projects. Table 2 shows the descriptive statistical analysis results of a total of 619 cases by 13 used cases collected for analysis.
The average construction cost per unit area by usage was highest for sports facilities (2,281,404 KRW/m2), followed by exhibition facilities (3,956,687 KRW/m2) and training facilities (3,908,667 KRW/m2), with warehouse facilities (1,897,827 KRW/m2) being the lowest. The difference between the maximum and minimum floor area values ranged from 83% (sports facilities) to 95% (large offices), showing a relatively large range. The difference between the maximum and minimum construction costs per unit area ranged from 36% (medical facilities) to 77% (large offices), indicating a significant disparity.
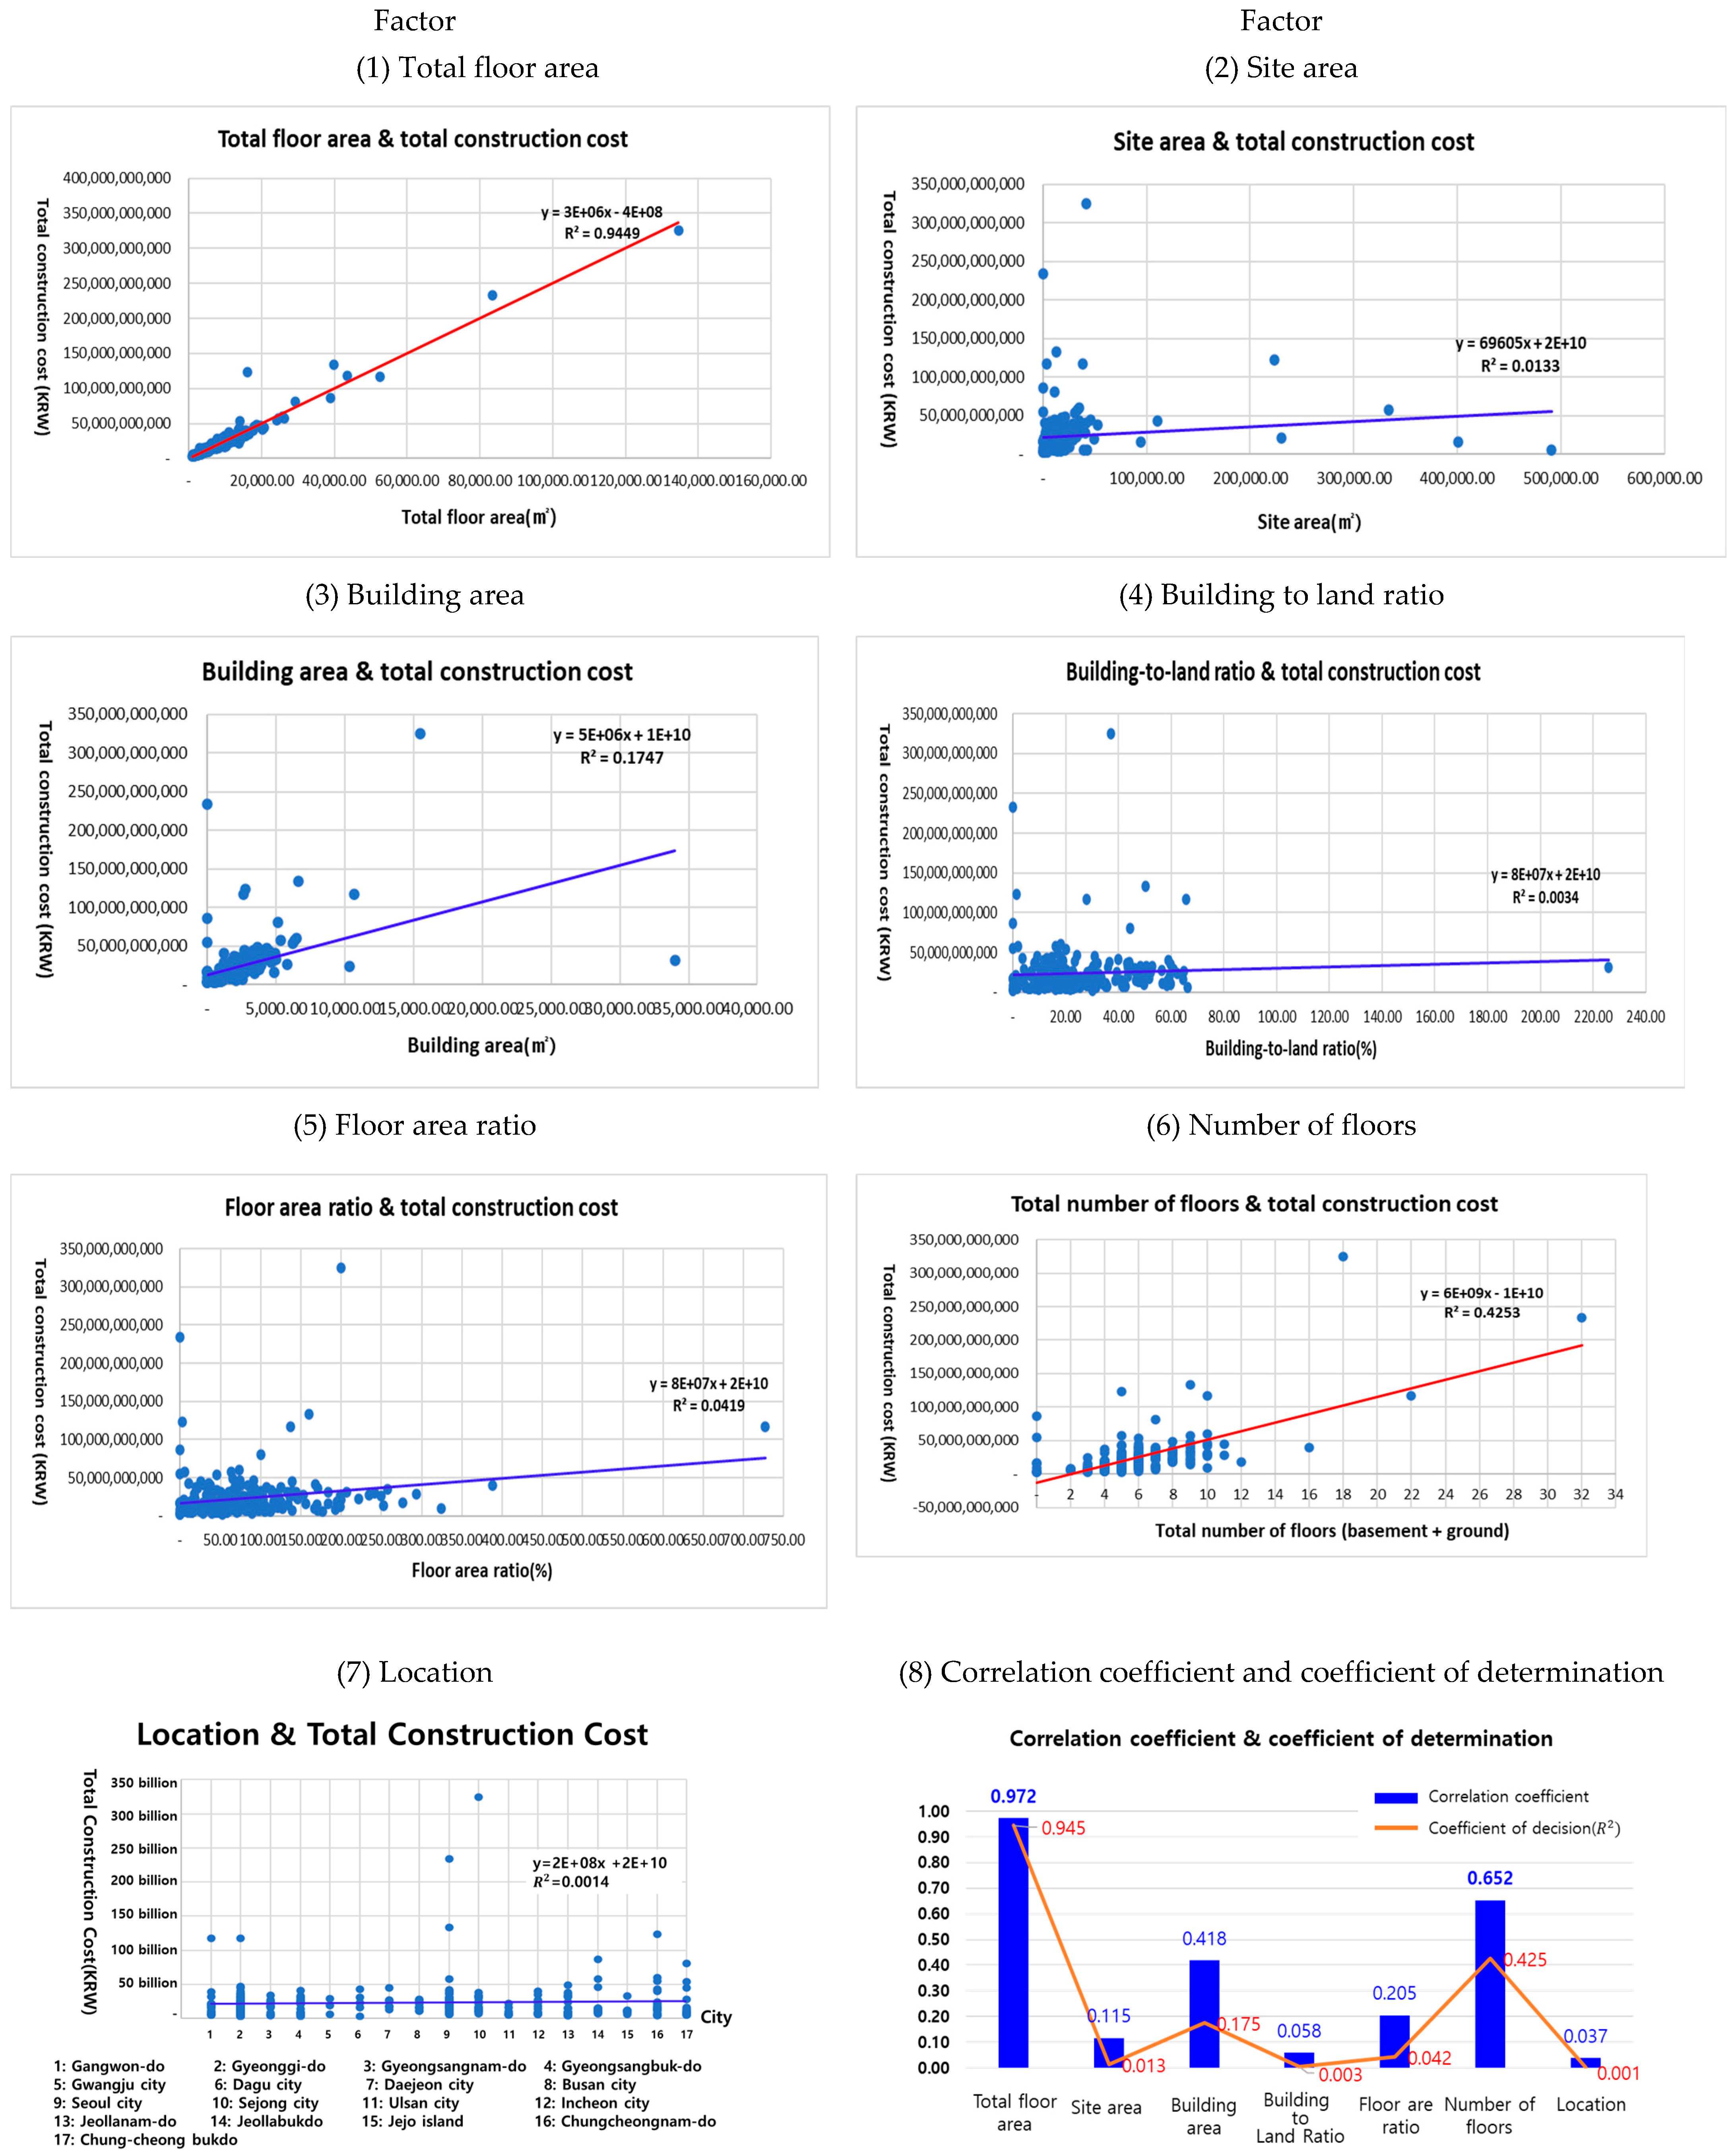
The study collected construction cost data for 237 public office buildings, which are the focus of this research, using construction cost indices as of January 2024 to establish a unified baseline. Correlation analysis was conducted using factors such as floor area, site area, building footprint, floor area ratio, building coverage ratio, number of floors, and regional factors to analyze the factors influencing construction costs. Figure 4 depicts the trend graphs and regression equations for each factor in construction costs.
In the field of statistical analysis, correlation is used to measure the strength of the relationship between variables measured on an interval or ratio scale. The strength of the correlation is indicated by the correlation coefficient, which ranges from −1.0 to +1.0. A value close to 0.0 indicates a weak relationship, while values close to −1.0 or +1.0 indicate a strong relationship. In regression or any statistical analysis, when discussing correlation, if the correlation coefficient is above 0.6, it is considered to have a high correlation. As shown in Table 3, the results of the regression analysis on the seven important factors influencing construction costs in public buildings in Korea indicate a very high correlation coefficient of 0.97 for the floor area factor, and a relatively high correlation coefficient of 0.65 for the total number of floors. Factors such as land area, floor area, building coverage ratio, floor area ratio, and regional factors show relatively low correlation coefficients. Therefore, in this study, only two factors, floor area and total number of floors, are used as factors related to the trend of construction costs.
The blue bar graph shown in (8) correlation coefficient and coefficient of determination in Figure 4 comprehensively expresses the correlation coefficients for the seven major factors affecting construction costs.
4.2. Estimating Cost Worth C
The term “Worth” used in the “Cost to Worth” technique for VE target selection refers to the value expressed in terms of “Worth”, defined as the least cost incurred for performing the same function. According to SAVE International, “Worth” is determined through methods such as record databases, data benchmarking, VE team member decisions, cost estimator experience, and the lowest cost available. However, if worth is determined solely based on simple costs, it may overlook the requirements of the main functions of the client for building purposes. Therefore, in this study, worth is applied in three distinct stages:
- Worth C: Cost by Detailed Construction Item Worth (Cost);
- Worth V: Customer Value by Detailed Construction Item Worth (Value);
- Worth F: Worth by Detailed Construction Item (Final) = Worth C × Worth V Weight.
The calculation of (Worth C) applies the detailed sub-trade occupancy rates without price fluctuations according to the construction period for 237 public buildings (163 ordinary buildings and 74 large-scale buildings). The “VM facilitator” selects the sample size based on the similarity of the gross floor area and total number of floors according to the VE conditions of each project building. Table 4 provides an example of the Worth C calculation applied to the average occupancy rates of 83 detailed sub-trades across seven major construction sectors, including architecture, mechanical, electrical, communication, fire protection, civil engineering, and landscaping.
4.3. Calculating the Customer Value Worth V
Customer value (Worth V) is crucial data that reflects the specific requirements of the client (customer) for each building. Relying solely on cost considerations to determine worth can lead to overlooking the primary functional requirements of the client for each building type. Therefore, there is a need to identify the customer value requirements for each detailed item (function) of the project through surveys and apply them as weights.
Customer value surveys are conducted using a Likert five-point scale. When the Likert scale was first proposed, it consisted of five response categories [32]. However, since there were no clear principles on the number of categories, researchers have used various scales up to nine levels depending on the amount of information desired. When collecting data using the Likert scale, various response categories can be used depending on the items, but typically, the five-point scale proposed by Likert, such as “Strongly Disagree”, “Disagree”, “Neutral”, “Agree”, and “Strongly Agree”, is used. Previous studies have shown conflicting views on whether the Likert scale is continuous or categorical data. The perspective that considers the Likert scale as continuous data views it as an interval scale where the intervals between response categories are equal [32,33].
In this study, when a sample survey was conducted in advance, proper answers were not given to the two questions “strongly disagree” and “disagree” due to concerns that the functions may fall short of the required functions. In order to supplement this, it was classified into “very important function”, “important function”, “normal function”, “basic function”, and “minimum function”, and the weight of each item for detailed work types presented by the Public Procurement Service was scored on an equal interval scale of 0.4 to 1.6. was assigned and calculated based on the customer value (Worth V) value for each work type.
The survey method aims to achieve optimal results within the allocated budget range. For this purpose, weights will be assigned to each detailed construction work item of the project, ranging relatively evenly from “Very Important Function” (1.6) to “Important Function” (1.3), “Average Function” (1.0), “Basic Function” (0.7), and “Minimum Function” (0.4).
4.4. Derive the Final Worth F
The final “Worth” (Worth F) can be obtained as Equation (3).
In the “Cost to Worth” method, “Worth” is defined as the minimum cost required to perform the same function. To calculate this “Worth”, one primary function representing each cost item is needed. In value engineering (VE), each cost item is typically composed of one or multiple functions. Generally, value is determined not by the producers or constructors but by the demands of the customers. However, in most cases, understanding the customer’s demands relies on the experiences of the VE team members and presentations from clients and designers. Especially in the VE target selection process, efforts to estimate high-cost areas may lead to the oversight of a genuine VE target selection process based on joint efforts and agreements among clients, designers, and VE teams to reflect customer demands alongside recognizing project-related issues [5]. To address these issues, objective data included in the Construction Cost Information Plaza of the Public Procurement Service are utilized to select target samples, and the final “Worth” (Worth F) is derived by multiplying the average cost Worth C of the samples by the weight of customer value (Worth V). Table 5 below provides an example of the final derived (Worth F) in the construction sector.
4.5. Value Index (VI) Calculation
The value index (VI) is calculated to assess the current state of value assurance for the project. The method for calculating the value index is determined by dividing the functional cost occupancy ratio of each detailed component of the project by the derived fundamental functional value (Worth F) of the project components, as shown in Equation (4).
The determination of the value index is calculated using the formula as described above. In this equation, “Cost” refers to the construction cost occupancy ratio of each detailed component of the project, and “Worth” refers to the final “Worth” (Worth F) calculated by multiplying the average occupancy ratio of the target samples by the weighted customer value derived from the survey. Table 6 provides an example of the final value index (VI) derived in the architectural field.
4.6. Derivation of Value Index (VI) Standard Value
If VI exceeds 1, it means that more costs are allocated compared to the worth, indicating poor cost efficiency. In VE target selection using the “Cost to Worth” method, selecting targets with VI values exceeding 1 is crucial. However, setting the VI threshold value above 1 without consideration may result in too many targets being selected, which may not contribute to efficient VE implementation.
To address this, in this study, the VI threshold value was determined by adding the result of the standard error, which varies according to the sample size, to a VI value of 1.
The standard error of the mean (SEM) refers to the standard deviation of the sample mean distribution. The standard error is calculated by dividing the standard deviation by the square root of the number of observations. The standard deviation is one of the measures of variability used to determine the spread of data, and the standard error of the mean (SEM) is the value that occurs during the estimation process of the population through sampling. The calculation method is shown in Equation (5).
4.7. Selection of Key Target Construction Types (Functions)
The value of 1, which is the optimal value standard for VI, plus the standard error derived from 3.6 is adopted as the final VI standard value, and construction types exceeding this are selected as construction types (functions) targeted for key reduction and priority ideas are created. By utilizing this study, even those who are not cost analysis experts can easily select priority targets, which will help to perform more efficient VE within limited time. Table 7 below is an example summarizing the analysis of the standard error according to the number of samples in the population based on the similarity in floor area and number of floors when selecting a government office building with a basement floor and four above-ground floors and total floor area of 6993 square meters as the project.
As shown in Figure 5, as the sample size of the target population increases, it approaches a normal distribution, and the standard error decreases, resulting in a decrease in the VI criterion value as well.
With the criterion value decreasing, the number of selected priority target construction work increases significantly, and even the construction work with very low deviation from the criterion value become VE targets. As a result, the time required for VE increases, and the cost-saving effect becomes minimal. Therefore, it is reasonable to use the standard error of samples with high similarity.
5. Model Validation and Effect
Following the methodology presented in Figure 3, this study conducted a series of analytical procedures with the aim of validating the model for selecting priority target public construction projects. To ensure a systematic approach to the research, empirical analysis was conducted using the past performance data of VE in public office buildings.
5.1. Selection of the Respective Project
The project in question is a VE (value engineering) project conducted by the Design Economy Feasibility Review Committee of Daegu City in November 2020. The project in question buildings are shown in Table 8 below.
Nine experts from various fields participated, and a high-cost area selection technique utilizing the expertise of cost professionals was adopted as the selection method. As a result, a total of 99 ideas were generated, leading to savings of approximately 1.8 billion KRW (10.28%) out of the total construction cost of 17.5 billion KRW.
5.2. Calculate the Cost of the Target Sample Worth C
The selection factors for the population target sample were based only on the total floor area and the total floor number similarity rate with the highest correlation coefficient according to the results in Table 3. In other words, a project with a high similarity rate in total floor area and number of floors must be selected to reduce the cost disparity rate by detailed construction type. The number of sample populations is two, namely Jeong-Seon Police Station and Changwon Marine Police Station, which have a similarity rate of 100% for the project and the total number of floors (one basement level and the fourth floor above ground), a total floor area similarity rate of 99%, and a population average construction cost similarity rate of 91%. The population was selected as a target sample.
5.3. Calculation of Customer Value Worth V and Final Worth F
The calculation of customer value (Worth V) for the target samples involved utilizing survey responses obtained from the client representatives as weighted data for customer value (Worth V).
5.4. Derivation of Value Index (VI) and Standard Value
Figure 6 shows the results of deriving the value index (VI) for each type of engineering and the sample value of the value index, and is expressed only in the field of architecture due to the paper relationship.
The standard error result of the average of the detailed construction work ratio in the target samples, consisting of Jeong-Seon Police Station and Chang-Won Marine Police Station, is derived as 0.1540, as shown in Figure 6. Adding the basic value of 1 to this, the criterion value of the value index (VI) was finally calculated as 1.154. In addition, the value index for each subspecies of this project was determined and indicated by yellow cells on the far-right side of Figure 6.
5.5. Selection and Analysis of Key Target Categories (Functions)
As shown in Figure 7, in the selection of key target items, 25 items expressed as blue graphs exceeding the VI threshold of 1.154 out of a total of 83 items were derived as cost-saving focus areas.
To validate the effectiveness of this study, we compared and analyzed the number of cost-saving ideas generated in previous iterations of the same project. As shown in Table 10, the results of idea generation for cost-saving focus areas by category revealed that in the previous scenario, a total of 68 alternatives were generated across 42 specific categories, resulting in a cost reduction of KRW 1.82 billion.
In contrast, the results of this study yielded 51 alternatives generated across 22 specific categories out of the 25 categories that exceeded the VI index of 1.154. This led to a cost reduction of KRW 1.58 billion.
In terms of selecting cost-saving priority focus categories, despite adopting high-cost area selection techniques as the target selection method due to most VE team members having rich practical experience in cost-related matters when implementing the project when compared to the methodology proposed in this study, as shown in Table 11, the priority focus categories exhibit an 88% concordance rate.
While this study’s model does not provide an absolute criterion for the selection of key targets, it is deemed that, in conducting design VE, even without the inclusion of cost experts, the model can offer information for selecting quantified priority categories based on consistent criteria through existing data analysis. Thus, it is expected that design VE can be conducted more efficiently within the given timeframe.
Furthermore, when comparing the results of previous scenarios with those of this study, it can be inferred that the effectiveness of this study is evident. As shown in Table 12, while the proportion of target selection categories was relatively small at 52.4%, the proportion of alternative generation was 75.0%, and the proportion of cost savings amounted to 86.8%.
6. Conclusions
This study aims to propose a model for prioritizing (key) targets in value engineering (VE) in public construction projects encompassing various fields, utilizing the value index (VI). The goal is to provide a model that enables more efficient VE within a limited timeframe.
To achieve this, the study selected 83 detailed construction work items collected from the procurement agency’s database as “Worth” values and classified them based on two factors: total floor area and total number of floors. Depending on the VE conditions, samples were selected that were similar to the target project in terms of total floor area and total number of floors. The average values of the detailed construction work items for the target samples were designated as Worth C, and the survey results from the client were converted into customer value (Worth V) weights. These two values were multiplied to derive the final “Worth” (Worth F). Using the “Cost to Worth” technique, the study calculated the VI (Cost ÷ Worth F) for each detailed construction work item based on its cost and the final derived (Worth F). By utilizing the standard error of the sample target population, a VI standard value was established. Detailed construction work items exceeding this standard value were selected as focal points, enabling the generation of cost-saving ideas through a standardized model.
To analyze the empirical evidence of this study, past public buildings were used for validation. The validation results showed an 88% match rate for the number of focal target construction work items. By utilizing the worth calculation and focal target selection methodology proposed in this study, the following benefits are expected: (1) “Worth” values can be calculated more reasonably than before, (2) effective selection of priority targets among detailed construction work types is possible, (3) even those who are not cost experts can achieve results equal to or better than those of cost experts, and (4) VE can be conducted more efficiently within limited time.
The VE “Worth” calculation and key target selection method proposed in this study for public architectural construction projects serve as the basis. In the future, expanding the scope to include more data inputs and the construction of big data, along with AI algorithms for the entire process, such as customer value perception surveys, trend-based automatic generation, automation of target selection for focal areas, and proposing VE solutions, will ultimately require research on the automation of VE target selection methods using value index (VI).
Author Contributions
Conceptualization, Y.-G.J.; Methodology, B.-S.K.; Validation, B.-S.K.; Formal analysis, Y.-G.J.; Resources, Y.-G.J.; Data curation, H.-M.J.; Writing—original draft, Y.-G.J.; Writing—review & editing, H.-M.J.; Visualization, H.-M.J.; Supervision, B.-S.K.; Project administration, B.-S.K. All authors have read and agreed to the published version of the manuscript.
Funding
This work was supported by the National Research Foundation of Korea (NRF) grant funded by the Korea Government (MSIT) (NRF-2021R1A2C1014267).
Data Availability Statement
The data from this study are restricted due to privacy and ethical considerations but can be accessed upon a justified request to the corresponding author, subject to ethical approval.
Conflicts of Interest
The authors declare no conflict of interest.
References
- Algase, D.; Bolton, J.; Kirk, S.; Lenzer, B.; Rains, J. The Value Methodology Memory Jogger, 2nd ed.; SAVE International: Mount Royal, NJ, USA, 2018; pp. ix–x. ISBN 978-1-57681-203-7. [Google Scholar]
- SAVE International. VM Guide; SAVE International: Mount Royal, NJ, USA, 2020; pp. 2–15. ISBN 978-1-7350880-0-6. [Google Scholar]
- Liu, J.N.; Qiao, L.; Park, J.Y.; Kim, B.S. VE Alternative Verification Method Using KANO Model. J. Korean Soc. Civ. Eng. 2019, 39, 923–932. [Google Scholar]
- Heo, W.-Y. The Methodology of Decision Making for VE Components by Cost Index of Building Work. Ph.D. Thesis, Hoseo University, Asan-si, Republic of Korea, 2022; pp. 3–11. [Google Scholar]
- Jung, B.J. VE Object Selection Method of Express Way by Value Index. Master’s Thesis, Pu-Kyong National University, Busan, Republic of Korea, 2010; pp. 16, 37–41. [Google Scholar]
- Yoon, S.-H. A Study on the Improvement for Cost Modelling Techniques in the Construction VE. Master’s Thesis, University of Seoul, Seoul, Republic of Korea, 2001; pp. i–iii. [Google Scholar]
- Lee, H.-S. An Improvement of the Quantity Take-off Process for Reducing Errors during Detailed Design Development of Building Projects. Master’s Thesis, Chung-Ang University, Seoul, Republic of Korea, 2014; pp. 9, 12–14. [Google Scholar]
- Construction Cost Information Plaza. Available online: https://pcae.g2b.go.kr:8044/pbs/psa/psa0000/index.do (accessed on 25 November 2023).
- de Graaf, R.; Van der Linde, G.; De Jong, H.; Vogt, B. Value Engineering as a Specialty for Systems Engineering: Exploring Opportunities. Insight 2019, 22, 41–44. [Google Scholar] [CrossRef]
- Ilayaraja, K.; Eqyaabal, M.Z. Value engineering in construction. Indian J. Sci. Technol. 2015, 8, 1–8. [Google Scholar] [CrossRef]
- Behncke, F.G.; Maisenbacher, S.; Maurer, M. Extended model for integrated value engineering. Procedia Comput. Sci. 2014, 28, 781–788. [Google Scholar] [CrossRef]
- Rahman, H.Z. Enhancing value for money of mega infrastructure projects. Procedia Technol. 2014, 16, 1037–1046. [Google Scholar]
- Al-Muaybid, A.I.; Abdulghafour, A.; Mlybari, E.A. Value Engineering Role in Construction Sustainability during COVID-19 Pandemic in KSA. Indian J. Sci. Technol. 2022, 15, 518–526. [Google Scholar] [CrossRef]
- Nejatyan, E.; Sarvari, H.; Hosseini, S.A.; Javanshir, H. Determining the Factors Influencing Construction Project Management Performance Improvement through Earned Value-Based Value Engineering Strategy: A Delphi-Based Survey. Buildings 2023, 13, 1964. [Google Scholar] [CrossRef]
- Chen, W.T.; Merrett, H.C.; Liu, S.S.; Fauzia, N.; Liem, F.N. A decade of value engineering in construction projects. Adv. Civ. Eng. 2022, 2022, 2324277. [Google Scholar] [CrossRef]
- Jin, L.; Yin, Y.; Du, F.; Yuan, H.; Zheng, C. Impact of Engineering Changes on Value Movement in Fund Flow: Monte Carlo-System Dynamics Modeling Approach. Buildings 2023, 13, 2218. [Google Scholar] [CrossRef]
- Song, C.Y.; Yang, B.S. Development of Mobile-Based Design Value Engineering (VE) Supporting System for VE Process Improvement. J. Korea Inst. Build. Constr. 2021, 21, 433–443. [Google Scholar]
- Park, C.Y.; Yun, S.; Lee, D.E. Establishing the Strategy of Effective Construction VE for Construction Firms. Korean J. Constr. Eng. Manag. 2021, 22, 80–87. [Google Scholar]
- Ikhbayar, K.; Jin, C.; Hyun, C.T.; Lee, S. A process for Reviewing the Applicability of VE Alternatives using BIM-based VR. Proc. Korean Inst. Build. Constr. Conf. 2021, 21, 89–90. [Google Scholar]
- Park, B.S.; Kim, O.K. A Study on the Application of Design VE Process in Pre-Construction Phase for GMP Determination of CM at Risk Project. Korean J. Constr. Eng. Manag. 2022, 23, 56–64. [Google Scholar]
- Lee, D.H. An Efficient Owner’s Requirements Reflecting Process at the Planning Stage of the Building Project. Ph.D. Thesis, Chung-Ang University, Seoul, Republic of Korea, 2006; p. 4. [Google Scholar]
- Jeong, H.G. Improvement of the Design Phase VE Selection by the Analysis of the Required Items of Owners, Users and Experts in the Apartment. Master’s Thesis, Dong Eui University, Busan, Republic of Korea, 2008; p. 2. [Google Scholar]
- Chen, W.T.; Chang, P.-Y.; Huang, Y.-H. Assessing the overall performance of value engineering workshops for construction projects. Int. J. Proj. Manag. 2010, 28, 514–527. [Google Scholar] [CrossRef]
- Jae, H.S. A Study on Method for Effective Function Definition of Construction Project Design Value Engineering. Master’s Thesis, Namseoul University, Cheonan-si, Republic of Korea, 2010; pp. 45–48. [Google Scholar]
- Jeong, S.E. A Process Model for Design Value Engineering (VE) Using the Chimera Idea Creation Concept (CICC). Master’s Thesis, Namseoul University, Cheonan-si, Republic of Korea, 2012; pp. 24–25. [Google Scholar]
- Kim, M.S. Improvement of Design VE Process Using the Quality Model by Construction Project Type. Master’s Thesis, Namseoul University, Cheonan-si, Republic of Korea, 2010; pp. 39–40. [Google Scholar]
- Kwon, B.S. A Study on Improvement of Subjection Method for Value Engineering in Early Design Stage. Master’s Thesis, Dankook University, Yongin-si, Republic of Korea, 2001; pp. 25–31. [Google Scholar]
- Yun, S.W.; Kim, H.H.; Min, K.S. Improvement for Subject Selection using SWOT Analysis in the Design Value Engineering. In Proceedings of the Korean Institute of Construction Engineering and Management, Seoul, Republic of Korea, 7 November 2008; Volume 7, pp. 872–876. [Google Scholar]
- Zhang, R.; Ashuri, B.; Shyr, Y.; Deng, Y. Forecasting Construction Cost Index based on visibility graph: A network approach. Physica A 2018, 493, 239–252. [Google Scholar] [CrossRef]
- El-Nashar, W.Y.; Elyamany, A.H. Value engineering for canal tail irrigation water problem. Ain Shams Eng. J. 2018, 9, 1989–1997. [Google Scholar] [CrossRef]
- Kim, J.H. Advance of Method for An Object Selection in Construction Value Engineering. Master’s Thesis, Pukyong National University, Busan, Republic of Korea, 2011; p. V. [Google Scholar]
- Likert, R. A Technique for the measurement of attitudes. Arch. Psychol. 1932, 140, 5–55. [Google Scholar]
- Kim, S.M. A Comparison of Structural Equation Model Estimation Methods According to the Attributes of Likert Scale Data. Master’s Thesis, Keimyung University, Daegu, Republic of Korea, 2011; pp. 1, 10, 104. [Google Scholar]
Figure 1.
Framework of selection of VE targets.

Figure 2.
Design VE process.

Figure 4.
Trend graphs of construction costs by factor.

Figure 5.
Graph of Standard Error and VI Criterion Value Changes.

Figure 6.
Value index (VI) criterion table.

Figure 7.
Selection of the key target categories graph.


Table 1.
Evaluation criteria and characteristics between design VE target selection techniques.
| VE Target Selection Method | Evaluation Standard | Evaluation Items | Characteristic |
|---|---|---|---|
| High-cost field selection technique | Cost | Select high-cost items | Construction that is easy to calculate costs |
| “Cost to Worth” Technique | Comprehensively judge cost and value | VI = Cost ÷ Worth Select the item with the highest VI value | Construction that is easy to calculate costs or has past performance data When using worth, use the concept of functional analysis |
| Cost performance evaluation technique | Comprehensively judge cost and performance | Item with the lowest performance ratio/cost ratio value | Construction with insufficient past performance data Performance evaluation criteria include ordering body/user requirements, construction period, etc. |
| Complex evaluation technique | Expected improvement effects, available effort, team capabilities, etc. | Evaluation by evaluation item | Large-scale project Construction VE |
Table 2.
Descriptive statistical analysis of construction costs per unit area.
| Building Use | Number of Samples | Unit Construction Cost Average (KRW/m2) | SEM (Standard Error of the Mean) | Standard Deviation | Minimum Construction Cost per Unit Area (KRW/m2) | Maximum Construction Cost per Unit Area (KRW/m2) | |
|---|---|---|---|---|---|---|---|
| Public building | General | 163 | 3,369,047.5 | 45,369.2 | 579,234.6 | 2,072,265 | 5,158,590 |
| Large | 74 | 3,328,716.6 | 111,514.5 | 959,284.3 | 2,465,224 | 10,584,173 | |
| Library | 21 | 3,449,470.3 | 115,376.0 | 528,719.1 | 2,267,530 | 4,195,593 | |
| Warehouse | 8 | 1,897,827.3 | 166,336.4 | 470,470.5 | 1,164,246 | 2,836,082 | |
| Dormitory | 14 | 3,400,605.6 | 133,406.2 | 499,160.4 | 2,714,915 | 4,474,552 | |
| Factory | 23 | 2,867,950.1 | 203,884.8 | 977,797.3 | 1,385,877 | 4,839,010 | |
| Welfare facilities | 22 | 3,640,164.6 | 220,683.2 | 1,035,096.0 | 2,735,033 | 7,716,943 | |
| Medical facilities | 16 | 3,559,654.4 | 99,429.1 | 397,716.3 | 2,702,300 | 4,251,077 | |
| Training facilities | 29 | 3,908,666.6 | 176,132.3 | 948,501.6 | 2,628,219 | 6,307,060 | |
| Sports facilities | 41 | 4,481,404.3 | 201,608.4 | 1,290,923.3 | 3,029,790 | 10,324,043 | |
| Exhibition facilities | 49 | 3,956,687.2 | 111,544.7 | 780,813.0 | 2,874,435 | 6,653,951 | |
| Facilities for the elderly | 50 | 3,380,304.9 | 93,702.0 | 662,573.3 | 2,499,938 | 5,718,689 | |
| University | 56 | 3,011,569.6 | 51,564.2 | 385,871.3 | 2,449,153 | 4,354,924 | |
| Laboratory | 53 | 3,739,241.5 | 111,069.6 | 808,598.8 | 2,578,894 | 6,471,361 | |
| Subtotal | 619 | 3,427,950.7 | 131,544.3 | 737,482.8 | 2,397,701.3 | 5,991,860 | |
Table 3.
Regression equation for construction cost trends by factor.
| Factor | Regression Equation | Correlation Coefficient | Coefficient of Decision | Adjusted Coefficient of Determination | Significance Level |
|---|---|---|---|---|---|
| Total floor area | Y = 3 × 100.6X − 4 × 100.8 | 0.972063 | 0.9449 | 0.9447 | 6.4 × 10−150 |
| Site area | Y = 69,605X + 2 × 10¹⁰ | 0.115279 | 0.0133 | 0.0091 | 7.7 × 10−02 |
| Building area | Y = 5 × 100.6X + 1 × 10¹⁰ | 0.418012 | 0.1747 | 0.1712 | 1.9 × 10⁻¹¹ |
| Building-to-land ratio | Y = 8 × 100.7X + 2 × 10¹⁰ | 0.057906 | 0.0034 | −0.0009 | 3.7 × 10−01 |
| Floor area ratio | Y = 8 × 100.7X + 2 × 10¹⁰ | 0.204732 | 0.0419 | 0.0378 | 1.5 × 10−03 |
| Number of floors | Y = 8 × 100.9X − 1 × 10¹⁰ | 0.652180 | 0.4253 | 0.4229 | 4.3 × 10⁻³⁰ |
| Location | Y = 2 × 100.8X + 2 × 10¹⁰ | 0.037360 | 0.0014 | −0.0029 | 5.7 × 10−01 |
Table 4.
An example of calculating the cost worth C for detailed sub-trades in public buildings.
| Division | Detailed Work Type | Average Market Share | ||
|---|---|---|---|---|
| General Government Building (163) | Large Government Building (74) | All Government Building (237) | ||
| Building | Temporary | 5.73% | 5.36% | 5.62% |
| Foundation | 1.79% | 1.30% | 1.64% | |
| Reinforced concrete | 15.36% | 12.96% | 14.61% | |
| Iron frame | 1.47% | 2.32% | 1.73% | |
| Brick | 1.80% | 1.56% | 1.72% | |
| Waterproofing | 2.62% | 2.24% | 2.50% | |
| Stone | 3.95% | 3.03% | 3.66% | |
| Tile | 1.24% | 0.74% | 1.09% | |
| Metal | 4.74% | 4.75% | 4.74% | |
| Plastering | 1.68% | 1.32% | 1.57% | |
| Windows and glass | 4.80% | 4.79% | 4.80% | |
| Wood and interior finishing | 13.30% | 9.44% | 12.09% | |
| Painting | 1.35% | 1.26% | 1.32% | |
| Dismantling and demolition | 0.56% | 0.71% | 0.61% | |
| Waste disposal | 0.02% | 0.00% | 0.02% | |
| Gravel and transportation | 0.57% | 0.46% | 0.54% | |
| Work by-product | −0.05% | −0.07% | −0.06% | |
| Quality test fee | 0.08% | 0.09% | 0.08% | |
| Other | 2.16% | 2.30% | 2.21% | |
| Subtotal | 63.16% | 54.57% | 60.48% | |
| Mechanical | Equipment installation | 1.21% | 1.14% | 1.19% |
| Outdoor plumbing | 0.11% | 0.09% | 0.10% | |
| Machine room plumbing | 0.82% | 1.07% | 0.89% | |
| Air conditioning piping | 0.65% | 1.35% | 0.87% | |
| Gas piping | 0.37% | 0.22% | 0.32% | |
| Water supply piping | 1.10% | 0.94% | 1.05% | |
| Sewage piping | 0.98% | 0.97% | 0.98% | |
| Heating piping | 0.17% | 0.12% | 0.15% | |
| Flue installation | 0.09% | 0.15% | 0.11% | |
| Duct installation | 1.24% | 2.47% | 1.62% | |
| Rainwater treatment facility | 0.26% | 0.37% | 0.30% | |
| Sanitary equipment installation | 0.71% | 0.53% | 0.65% | |
| Underfloor heating | 0.04% | 0.06% | 0.05% | |
| Geothermal facility | 0.39% | 0.88% | 0.55% | |
| Soundproofing and dustproofing installation | 0.11% | 0.24% | 0.15% | |
| Other | 0.76% | 1.58% | 1.02% | |
| Subtotal | 9.00% | 12.19% | 10.00% | |
| Electrical | Electricity inlet | 0.63% | 0.51% | 0.60% |
| Main power line facility | 1.63% | 1.42% | 1.56% | |
| Outdoor security lighting | 0.49% | 0.26% | 0.41% | |
| Power facility | 0.79% | 0.81% | 0.79% | |
| Remote meter reading facility | 0.05% | 0.06% | 0.05% | |
| Lighting equipment | 3.01% | 2.99% | 3.01% | |
| Lighting and power control facility | 0.17% | 0.22% | 0.19% | |
| Electric heating equipment | 1.61% | 1.40% | 4.54% | |
| Heating/cooling equipment | 0.42% | 0.38% | 0.41% | |
| Grounding and lightning protection | 0.57% | 0.33% | 0.49% | |
| Cable tray and duct facility | 0.44% | 0.51% | 0.46% | |
| Other | 0.40% | 0.46% | 0.42% | |
| Subtotal | 10.21% | 9.35% | 9.94% | |
| Telecommunications | Outdoor communication equipment | 0.35% | 0.27% | 0.33% |
| Integrated wiring facility | 2.61% | 2.77% | 2.66% | |
| CATV and TV equipment | 0.48% | 0.47% | 0.47% | |
| Broadcasting facilities | 0.69% | 0.66% | 0.68% | |
| A/V equipment | 0.22% | 0.19% | 0.21% | |
| CCTV facility | 0.26% | 0.33% | 0.28% | |
| Access control equipment | 0.25% | 0.49% | 0.32% | |
| Parking control facility | 0.06% | 0.10% | 0.07% | |
| Cable tray and duct installation | 0.47% | 0.50% | 0.48% | |
| Other | 0.17% | 0.30% | 0.21% | |
| Subtotal | 5.57% | 6.08% | 5.73% | |
| Firefighting | Fire extinguishing equipment installation | 0.28% | 0.20% | 0.26% |
| Outdoor fire-fighting piping | 0.04% | 0.03% | 0.04% | |
| Indoor fire-fighting piping | 0.62% | 0.67% | 0.64% | |
| Pump room piping | 0.26% | 0.15% | 0.22% | |
| Sprinkler piping | 0.89% | 2.00% | 1.24% | |
| Fire extinguishing gas piping | 0.12% | 0.22% | 0.15% | |
| Fire extinguishing | 0.17% | 0.21% | 0.18% | |
| Smoke control duct installation | 0.01% | 0.14% | 0.05% | |
| Guide light equipment | 0.54% | 0.51% | 0.53% | |
| Automatic fire detection | 1.57% | 1.52% | 1.56% | |
| Wireless communication auxiliary equipment | 0.03% | 0.16% | 0.07% | |
| Other | 0.38% | 0.20% | 0.33% | |
| Subtotal | 4.91% | 6.02% | 5.26% | |
| Civil | Earth retaining facility | 3.46% | 3.88% | 3.60% |
| Earth construction | 2.27% | 2.72% | 2.41% | |
| Rainwater treatment | 0.90% | 0.43% | 0.75% | |
| Sewage treatment | 0.24% | 0.15% | 0.21% | |
| Water construction | 0.04% | 0.02% | 0.03% | |
| Paving construction | 0.73% | 0.44% | 0.64% | |
| Civil structural | 0.65% | 0.30% | 0.54% | |
| Company-supplied materials | 0.72% | 0.48% | 0.65% | |
| Transportation costs | 0.03% | 0.02% | 0.03% | |
| Other | 0.56% | 0.40% | 0.51% | |
| Subtotal | 9.61% | 8.83% | 9.37% | |
| Landscaping | Planting | 1.65% | 1.68% | 1.66% |
| Pedestrian road paving | 0.76% | 0.44% | 0.66% | |
| Landscaping facilities | 0.53% | 0.70% | 0.58% | |
| Other | 0.09% | 0.14% | 0.11% | |
| Subtotal | 3.03% | 2.95% | 3.00% | |
| Total | 100.00% | 100.00% | 100.00% | |
Table 5.
Example of final Worth F derivation (architectural field).
| Detailed Construction Work in the Field of Public Building Construction | Cost Share Worth C (A) | Customer Value Worth V Weighting (B) | Final Worth F (A × B) |
|---|---|---|---|
| Temporary | 4.85% | 0.4 | 1.94% |
| Foundation | 7.84% | 1.0 | 7.84% |
| Reinforced concrete | 17.85% | 0.7 | 12.50% |
| Iron frame | 0.62% | 1.0 | 0.62% |
| Brick | 2.18% | 0.7 | 1.53% |
| Waterproofing | 2.06% | 1.6 | 3.30% |
| Stone | 4.79% | 1.3 | 6.23% |
| Tile | 1.04% | 1.3 | 1.35% |
| Metal | 3.20% | 1.3 | 4.16% |
| Plastering | 1.71% | 0.7 | 1.20% |
| Windows and glass | 4.44% | 1.3 | 5.77% |
| Wood and interior | 7.67% | 1.6 | 12.27% |
| Painting | 1.02% | 1.3 | 1.33% |
| Waste disposal | 0.04% | 0.7 | 0.03% |
| Gravel and transportation | 0.70% | 0.7 | 0.49% |
| Other (architect) | 1.36% | 0.7 | 0.95% |
| Subtotal | 61.37% | 1.002 | 61.51% |
Table 6.
Value index (VI) calculation example (architectural field).
| Detailed Construction Work in the Field of Public Building Construction | Of the Project COST (C) | Final Worth F (D) | VI (Value Index) (C ÷ D) |
|---|---|---|---|
| Temporary | 5.02% | 1.94% | 2.59 |
| Foundation | 5.15% | 7.84% | 0.66 |
| Reinforced concrete | 12.85% | 12.49% | 1.03 |
| Iron frame | 1.41% | 0.62% | 2.27 |
| Brick | 4.95% | 1.53% | 3.24 |
| Waterproofing | 2.76% | 3.30% | 0.84 |
| Stone | 1.01% | 6.23% | 0.16 |
| Tile | 1.68% | 1.35% | 1.24 |
| Metal | 4.96% | 4.16% | 1.19 |
| Plastering | 1.74% | 1.20% | 1.45 |
| Windows and glass | 6.57% | 5.77% | 1.14 |
| Wood and interior | 6.67% | 12.27% | 0.54 |
| Painting | 1.17% | 1.33% | 0.88 |
| Waste disposal | 0.08% | 0.03% | 2.67 |
| Gravel and transportation | 1.16% | 0.49% | 2.37 |
| Other (architect) | 4.09% | 0.95% | 4.31 |
| Subtotal | 61.27% | 61.50% | 0.996 |
Table 7.
Standard error analysis results (example) according to the similarity of floor area among samples with the same total number of floors.
Table 7.
Standard error analysis results (example) according to the similarity of floor area among samples with the same total number of floors.
| Progress Project | Total Floor Area Similarity (m2) | Cumulative Number of Samples | Number of Floors | SEM (Standard Error of the Mean) |
|---|---|---|---|---|
| Building use Public building Number of floors: basement floors (1) Ground floors (4) Total floor area: 6993 m2 | 99% (6923~7063) | 2 | Basement floors (1) Ground floors (4) | 0.15405467 |
| 95% (6643~7342) | 6 | 0.08385151 | ||
| 90% (6293~7692) | 7 | 0.07630537 | ||
| 85% (5944~8042) | 13 | 0.05403102 | ||
| 80% (5594~8391) | 13 | 0.05403102 | ||
| 75% (5244~8741) | 16 | 0.04819095 | ||
| 70% (4895~9090) | 19 | 0.04374134 |
Table 8.
Construction information for the new building of the Gang-Buk Fire Station in Daegu.
| Category | Content | A Bird’s-Eye View of Building |
|---|---|---|
| Progress Project | Daegu Gang-Buk Fire Station New Construction |  |
| Location | Guam-dong, Buk-Gu, Daegu | |
| Local district | Central commercial area | |
| Building use | Public building | |
| Number of floors | Basement floors (1) Ground floors (4) | |
| Site area | 8009.90 m2 | |
| Total floor area | 6.993.04 m2 | |
| Building-to-land ratio | 30.79% | |
| Floor area ratio | 71.52% | |
| Total construction cost | 17,582,741,000 KRW |
Table 9.
The final derivation of Worth F for the target samples (across all sectors, with a focus on the architectural field).
Table 9.
The final derivation of Worth F for the target samples (across all sectors, with a focus on the architectural field).
| Architectural Field Detailed Work | Cost Share Worth C (A) | Customer Value Worth V (B) | Total Worth F (A × B) |
|---|---|---|---|
| Temporary | 4.85% | 0.7 | 3.395% |
| Foundation | 7.84% | 1.0 | 7.84% |
| Reinforced concrete | 17.85% | 1.0 | 17.85% |
| Iron frame | 0.62% | 1.0 | 0.62% |
| Brick | 2.18% | 0.7 | 1.526% |
| Waterproofing | 2.06% | 1.3 | 2.678% |
| Stone | 4.79% | 1.0 | 4.79% |
| Tile | 1.04% | 1.0 | 1.04% |
| Metal | 3.20% | 1.0 | 3.2% |
| Plastering | 1.71% | 0.7 | 1.197% |
| Windows and glass | 4.44% | 1.0 | 4.44% |
| Wood and interior | 7.67% | 1.6 | 12.272% |
| Painting | 1.02% | 1.0 | 1.02% |
| Waste disposal | 0.04% | 0.4 | 0.016% |
| Gravel and transportation | 0.70% | 0.4 | 0.28% |
| Other (architect) | 1.36% | 1.0 | 1.36% |
| Subtotal | 61.37% | 1.035 | 63.524% |
Table 10.
Results of idea generation for cost-saving priority focus categories.
| Division | Detailed | VI Value | Number of Alternatives | Increase/Decrease Amount (KRW) |
|---|---|---|---|---|
| Building | Temporary | 1.48 | 3 | −33,600,000 |
| Iron frame | 2.28 | 3 | −50,800,000 | |
| Brick | 3.90 | |||
| Tile | 1.61 | |||
| Metal | 1.86 | 3 | −354,200,000 | |
| Plastering | 1.45 | 2 | −52,000,000 | |
| Windows and glass | 1.48 | 5 | ||
| Gravel and transportation | 4.13 | 1 | ||
| Other construction | 2.20 | 3 | −217,700,000 | |
| Mechanical | Heating piping | 3.98 | 2 | −42,700,000 |
| Duct installation | 1.21 | 2 | −1,650,000 | |
| Sanitary equipment | 4.23 | 1 | ||
| Electrical | Electric main line | 1.26 | 5 | −93,000,000 |
| Remote meter reading | 3.02 | 2 | −74,700,000 | |
| Heating and cooling | 1.20 | 1 | −1,500,000 | |
| Thunderstroke ground connection | 5.90 | 1 | −1,000,000 | |
| Cable tray | 2.58 | 1 | −12,000,000 | |
| Telecommunications | AV equipment | 2.00 | 4 | −39,000,000 |
| CCTV | 1.53 | |||
| Firefighting | Outdoor fire piping | 1.31 | 2 | −12,600,000 |
| Other construction | 145.62 | 3 | −58,500,000 | |
| Civil | Earthwork | 11.85 | 2 | −233,100,000 |
| Company-supplied materials | 22.05 | 2 | −268,000,000 | |
| Landscaping | Landscaping facilities | 1.64 | 1 | −34,400,000 |
| Other construction | 2.65 | 2 | −600,000 | |
| Subtotal | 11.85 | 51 | −1,581,050,000 | |
Table 11.
Comparison between identified key targets and alternative generation categories.
| VE Implementation Steps | Target Project | Sample Target | Number of Target Selected Construction Types Derived from This Study | Number of Construction Types for Deriving Target Project Alternatives | Match Rate |
|---|---|---|---|---|---|
| Design stage | Gang-Buk Fire Station | Jeong-Seon Police Station | 25 | 22 | 88% |
| Chang-Won Marine Police Station |
Table 12.
Comparison of study effectiveness.
| Comparison Target | Number of Targets Selected Work Types | Number of Alternatives Derived | Savings Amount (KRW) |
|---|---|---|---|
| Previous project (A) | 42 | 68 | 1,820,000,000 |
| This study (B) | 25 | 51 | 1,580,000,000 |
| Efficiency (B ÷ A) × 100 | 59.5% | 75.0% | 86.8% |
Disclaimer/Publisher’s Note: The statements, opinions and data contained in all publications are solely those of the individual author(s) and contributor(s) and not of MDPI and/or the editor(s). MDPI and/or the editor(s) disclaim responsibility for any injury to people or property resulting from any ideas, methods, instructions or products referred to in the content. |
© 2024 by the authors. Licensee MDPI, Basel, Switzerland. This article is an open access article distributed under the terms and conditions of the Creative Commons Attribution (CC BY) license (https://creativecommons.org/licenses/by/4.0/).
Share and Cite
MDPI and ACS Style
Jeong, Y.-G.; Jeong, H.-M.; Kim, B.-S. Development of Worth Estimation and Key Target Selection Methods for Effective VE. Buildings 2024, 14, 1235. https://0-doi-org.brum.beds.ac.uk/10.3390/buildings14051235
AMA Style
Jeong Y-G, Jeong H-M, Kim B-S. Development of Worth Estimation and Key Target Selection Methods for Effective VE. Buildings. 2024; 14(5):1235. https://0-doi-org.brum.beds.ac.uk/10.3390/buildings14051235
Chicago/Turabian StyleJeong, Yeon-Goo, Hye-Min Jeong, and Byung-Soo Kim. 2024. "Development of Worth Estimation and Key Target Selection Methods for Effective VE" Buildings 14, no. 5: 1235. https://0-doi-org.brum.beds.ac.uk/10.3390/buildings14051235
Note that from the first issue of 2016, this journal uses article numbers instead of page numbers. See further details here.