
Influences of the Decomposition Atmosphere and Heating Rate on the Pyrolysis Behaviors of Resin Sand


1
College of Information and Management Science, Henan Agricultural University, Zhengzhou 450046, China
2
School of Resources and Civil Engineering, Northeastern University, Shenyang 110819, China
*
Authors to whom correspondence should be addressed.
Buildings 2024, 14(5), 1234; https://0-doi-org.brum.beds.ac.uk/10.3390/buildings14051234
Submission received: 21 March 2024
/
Revised: 24 April 2024
/
Accepted: 25 April 2024
/
Published: 26 April 2024
(This article belongs to the Special Issue Emerging Techniques in Concrete Materials and Structures: Experiments, Theories and Applications)
Abstract
:The pouring of sand casting is accompanied by severe heat conduction, and there is an urgent need to investigate the pyrolysis properties of foundry sand. The main purpose of this study was to investigate the pyrolysis behaviors of resin sand, including precoated sand (PCS), hot box sand (HBS), and warm box sand (WBS), at heating rates of 20 °C/min, 30 °C/min, and 40 °C/min in nitrogen and air atmospheres. The mass loss of the resin sand was monitored continuously with a simultaneous thermal analyzer, and the kinetic parameters of the resin sand were calculated based on the Coats–Redfern method and thermal data. The average mass loss of the resin sand during pyrolysis was 3.03%, which was much smaller than that of the other sands. The volatile release characteristic index of resin sand could not be calculated based on this concept. To solve this issue, the term Tstv/mloss was established, and its value was determined. With increasing heating rates from 20 °C/min to 30 °C/min and from 30 °C/min to 40 °C/min, the mass losses of the resin sand increased by 0.79% and 0.64%, respectively, and the volatile release characteristic indices of the resin sand increased by 3.8 × 10⁻¹⁰ and 1.06 × 10⁻⁹, respectively. In addition, the mass losses and volatile release characteristic indices of resin sand in an air atmosphere were greater than those in a nitrogen atmosphere. With increasing heating rate, the activation energy of the resin sand decreased in a nitrogen atmosphere. The findings concerning the thermal decomposition behaviors of resin sand provided a theoretical basis for the pouring step of the sand casting process.
1. Introduction
Foundry manufacturing is a hot metal working process in which high-temperature molten metal is poured into a cavity to prepare castings [1,2]. In modern society, the foundry industry is the basis of modern machinery manufacturing and occupies an important position in the national economy and in social development. Sand casting, which occupies approximately 90% of the foundry industry, is the main method used for casting [3,4]. The main raw material consumed in sand casting is sand [4]. The highest demand for sand is in the construction industry, where it is used as concrete [5,6,7]. The physical properties of concrete have been studied comprehensively [8,9]. Sand casting promotes social and economic development but is accompanied by environmental pollution [10] and casualties [11]. Exploring the characteristics of foundry sand under high-temperature conditions is highly important for ensuring the safe production and quality of castings in the casting industry.
When high-temperature molten metal is poured into a cavity, the molten metal and the casting model undergo heat conduction [12,13,14], which causes the temperature of the casting model to increase rapidly. Moreover, certain materials, such as adhesives, curing agents, and coatings, in the sand are rapidly vaporized and pyrolyzed to produce gas. Heat conduction is a type of heat transfer that occurs within a substance or between objects with different temperatures in direct contact without relative displacement [15,16,17] and involves the thermal movement of microscopic particles within a substance. The faster the increase in the temperature of the casting model, the faster the vaporization and pyrolysis of these materials in the sand. Obtaining the variation in the temperature of the casting mold during pouring can help to gain a comprehensive understanding of the gas production of the casting mold under high-temperature conditions.
The methods for studying the variation in the temperature of casting molds can be categorized into experimental [11] and simulated methods [18]. With the development of computer technology, an increasing number of scholars have utilized computer software to simulate the complex features of the casting process [19,20]. Numerical simulation combines theoretical research with practical application and can simulate the temperature field, flow field, stress field, and microstructure, among other characteristics. The simulation results at a specific position at any moment can be displayed in the postprocessing stage. The algorithms for numerical simulation of casting mainly include the finite difference method (FDM) [21,22,23], the finite element method (FEM) [24,25,26], and the finite volume method (FVM) [27,28,29]. Different numerical algorithms have distinct discretization methods, boundary processing methods, and computational efficiencies and accuracies. The FDM is widely used in temperature field calculations of the casting solidification process and numerical simulations of the mold filling process. The FEM is mainly used for stress analysis in the casting process and for temperature and flow field analyses. Although the software can simulate temperature variations during pouring, it cannot effectively simulate the pyrolytsis properties of foundry sand.
During real-world production, resin sand at a gate is pyrolyzed in an air atmosphere, and that in a cavity is thermally decomposed in a nitrogen atmosphere. From the inner wall to the outer wall of a sand mold, the heating rate of the resin sand gradually decreases. When the condition of the resin sand changes, its pyrolysis behavior changes. Previously, the thermal decomposition behaviors of foundry sand for cast iron were investigated at heating rates of 30 °C/min and 40 °C/min in a nitrogen atmosphere [30]. In another study, the thermal decomposition characteristics of foundry sand for cast steel were further investigated at heating rates of 20 °C/min, 30 °C/min, and 40 °C/min under nitrogen and air atmospheres [4]. However, these two research groups investigated only the pyrolysis characteristics of self-hardening resin sands and did not address other types of resin sands.
The volatile release characteristic index can be used to represent the pyrolysis reaction in the sample [31,32,33]. The volatile release characteristics of various materials, such as coal [34,35,36], oil [37,38,39], and biomass [40,41,42], have been widely studied. This parameter requires a specific initial temperature for volatile emissions and a corresponding mass loss rate of at least 0.1 mg/min [43]. In addition, the mass of the sample used for pyrolysis experiments is usually 5 mg [44]. Therefore, the initial temperature needs a mass loss rate of 2%/min. For foundry sand, the content of SiO2 is approximately 94.6% [4], and the mass loss rate does not reach 2%/min. To address this issue, a new method can be adopted to calculate the volatile release characteristic index of foundry sand.
Kinetic parameters can be adopted to represent the physical and chemical characteristics of the material during heating [45,46,47], and these parameters can be calculated from pyrolysis data. The methods for calculating the kinetic parameters mainly include the distributed activation energy model (DAEM) [48,49,50], the Flynn–Wall–Ozawa (FWO) method [51,52,53], and the Coats–Redfern method [54,55,56]. The kinetic parameters of self-hardening resin sand can be calculated based on the Coats–Redfern method [4]. Different methods have distinct applications to pyrolysis for materials with various properties, and the change in the activation energy of the material is inconsistent with the change in the conversion rate [57,58,59]. For foundry sand, the validity of the calculated results of the kinetic parameters must be verified.
In summary, there are three highlights in this study compared with previous studies. First, the pyrolysis behaviors of a wide range of resin sands at different heating rates under nitrogen and air atmospheres were studied. Second, the term Tstv/mloss was established, and its value was determined; thus, the volatile release characteristic index of resin sand was calculated, and its validity was tested. Third, the kinetic parameters of the resin sand were calculated, and its validity was tested by one-way analysis of variance (ANOVA) [60].
2. Materials and Methods
2.1. Resin Sand Proportioning
The raw foundry sand used in this experiment was quartz sand, which originated from Gongyi, Henan Province, China, with a 007 model, a melting point of 2250 °C, a Moh hardness of 7.5, a density of 2.66 g/cm3, and a hydrochloric acid solubility of 3.5. Herein, the quartz sand consisted of particles formed by the crushing and processing of quartz stone. Quartz stone was a hard, wear-resistant, and chemically stable nonmetallic silicate mineral. Precoated sand (PCS), hot box sand (HBS), and warm box sand (WBS), which are commonly used, were taken as experimental objects, and their formulations are shown in Table 1.
PCS, also known as shell (core) sand, was mixed according to standard JB/T 8583-2008 [61]. The curing agent hexamethylene tetramine reacted with the water in the resin sand, producing formaldehyde and ammonia during heating. The generated formaldehyde reacted with phenolic resin, transforming the resin from a linear structure to a macromolecule with a three-dimensional structure. Ammonia formed an alkaline atmosphere, which was beneficial for this reaction.
HBS was mixed according to the standard JB/T 3823-2013 [62]. The curing agent ammonium chloride was weakly acidic after dissociation in water, and the acidity increased when heated. In addition, ammonium chloride reacted with free formaldehyde in furan resin to form hydrochloric acid, which accelerated the hardening of resin sand.
For WBS, the curing agent copper chloride aqueous solution was very stable at room temperature, began to decompose from 80 °C to 120 °C, and completely decomposed above 150 °C. The hardened resin sand had high strength, there was no need for secondary drying, and its hygroscopic properties were significantly improved.
2.2. Pyrolysis Experiments
An STA8000 Frontier instrument (PerkinElmer, WLM, USA) was used as a synchronous thermal analyzer for the pyrolysis of the resin sand. The mass loss of resin sand could be represented by the thermogravimetric (TG) curve, and the mass loss rate of resin sand could be represented by the differential thermogravimetric curve (DTG). DTG is the first derivative of the thermogravimetric curve.
The decomposition atmosphere of the resin sand pyrolysis experiment consisted of nitrogen and air (oxygen:nitrogen = 1:4); the heating rates were 20 °C/min, 30 °C/min, and 40 °C/min; and the temperature range was 25–1200 °C.
2.3. Volatile Release Characteristic Index
The volatile release characteristic index was used to represent the pyrolysis characteristics of the resin sand, and the calculation formula was as follows [16,17,18]:
where D is the volatile release characteristic index; Ts is the initial temperature of volatile release, corresponding to the temperature at which the mass loss rate reached 0.1 mg/min, °C [19]; Tmax is the temperature corresponding to the maximum mass loss rate of volatiles, °C; (dw/dt)mean is the average mass loss rate of volatiles, %/min; (dw/dt)max is the maximum mass loss rate of volatiles, %/min; and △1/2 is the temperature interval within the scope of (dw/dt)/(dw/dt)max = 1/2, °C.
2.4. Kinetic Theory
The Coats–Redfern method is usually used to describe the thermal decomposition of materials [28,29,30]. According to the Arrhenius equation and the law of conservation of mass of materials, the kinetics theory of the reaction could be described as follows.
where A is the preexponential factor, min−1; E is the activation energy, kJ/mol; R is the universal gas constant, 8.314 kJ/mol/K; T is the thermodynamic temperature, K; β is the heating rate, K/min; and α is the mass conversion rate of the pyrolysis reaction.
where , , and are the initial mass of the sample, the final mass of the sample, and the mass of the sample at a specific time t, respectively.
For a given heating rate, the term—ln[−ln(1 − α)/T2] linearly varied as 1/T with a slope of E/R, and the intercept was—ln(AR/βE). The activation energy E was calculated with Equation (2).
3. Results
While heating resin sand, the adhesive, curing agent, and other materials are pyrolyzed and vaporized, which reduces the resin sand mass. The volatile release characteristic index is adopted to represent the pyrolysis behavior of the resin sand. A larger value indicates better resin sand release characteristics and an easier pyrolysis reaction in the sample [30]. The thermal decomposition experiment investigates the physical and chemical properties of the resin sand, and thermodynamic and kinetic principles are applied during research. The thermal decomposition kinetic parameters include the activation energy and preexponential factor [4]. The activation energy refers to the energy needed for molecules to move from a normal state to an active state prone to chemical reactions. In addition, the activation energy effectively reflects the material stability. The preexponential factor is determined by the thermal decomposition experiment, regardless of the reaction temperature or the substance concentration. To effectively understand the thermal decomposition results of the resin sand, the basic properties of the raw sand were tested first, including proximate, chemical composition, and particle diameter analyses.
3.1. Basic Properties of Raw Sand
3.1.1. Proximate Analysis
The proximate analysis of the raw sand is carried out according to the standard GB/T 30732-2014 [63]. The composition of the raw sand mainly includes ash (99.01%), volatiles (0.87%), and moisture (0.12%). However, fixed carbon is not detected.
3.1.2. Chemical Composition Analysis
To further test the raw sand, X-ray fluorescence (XRF) analysis is performed with a ZSX Primus II instrument (Rigaku, Japan), and the results are shown in Table 2.
The results of the XRF analysis show that there are nine components of the raw sand, among which the SiO2 content is the highest at 96.174%. Thus, SiO2 is the main component of ash in the proximate analysis.
3.1.3. Particle Diameter Analysis
The influence of the particle diameter on the permeability of the molding sand is the most direct. The finer the particle diameter of the raw sand is, the lower the permeability of the molding sand. Therefore, the particle diameter of the raw sand significantly impacts the discharge of gas generated in the cavity during molten metal pouring. A laser particle size analyzer (model 3000; Malvern, UK) is used to determine the particle diameter of the raw sand according to the standard GB/T 15445.2-2006 [64], and the results are shown in Table 3.
D [3,2] indicates the average particle size of the surface area; D [4,3] indicates the average volumetric particle size; Dv (10) indicates that 10% of the particle size in the sample is less than this value; v indicates that the particle size is derived based on the volume distribution; Dv (50) indicates that 50% of the particle size in the sample is less than this value; and Dv (90) indicates that 90% of the particle size in the sample is less than this value.
The particle size distribution of the raw sand is shown in Figure 1.
The minimum and maximum particle sizes of the raw sand are 24.1 µm and 516 µm, respectively. The particle size of the raw sand increases from 24.1 µm to 272 µm as the bulk density gradually increases. When the particle size of the raw sand is 272 µm, its bulk density is the highest (13.55%), and the bulk density curve is roughly symmetric. The particle size of the raw sand increases from 272 µm to 516 µm as the bulk density gradually decreases.
The minimum particle size of the raw sand is 24.1 µm, which is greater than 20 µm, indicating that the raw sand does not contain mud.
3.2. Pyrolysis Behavior of Resin Sand
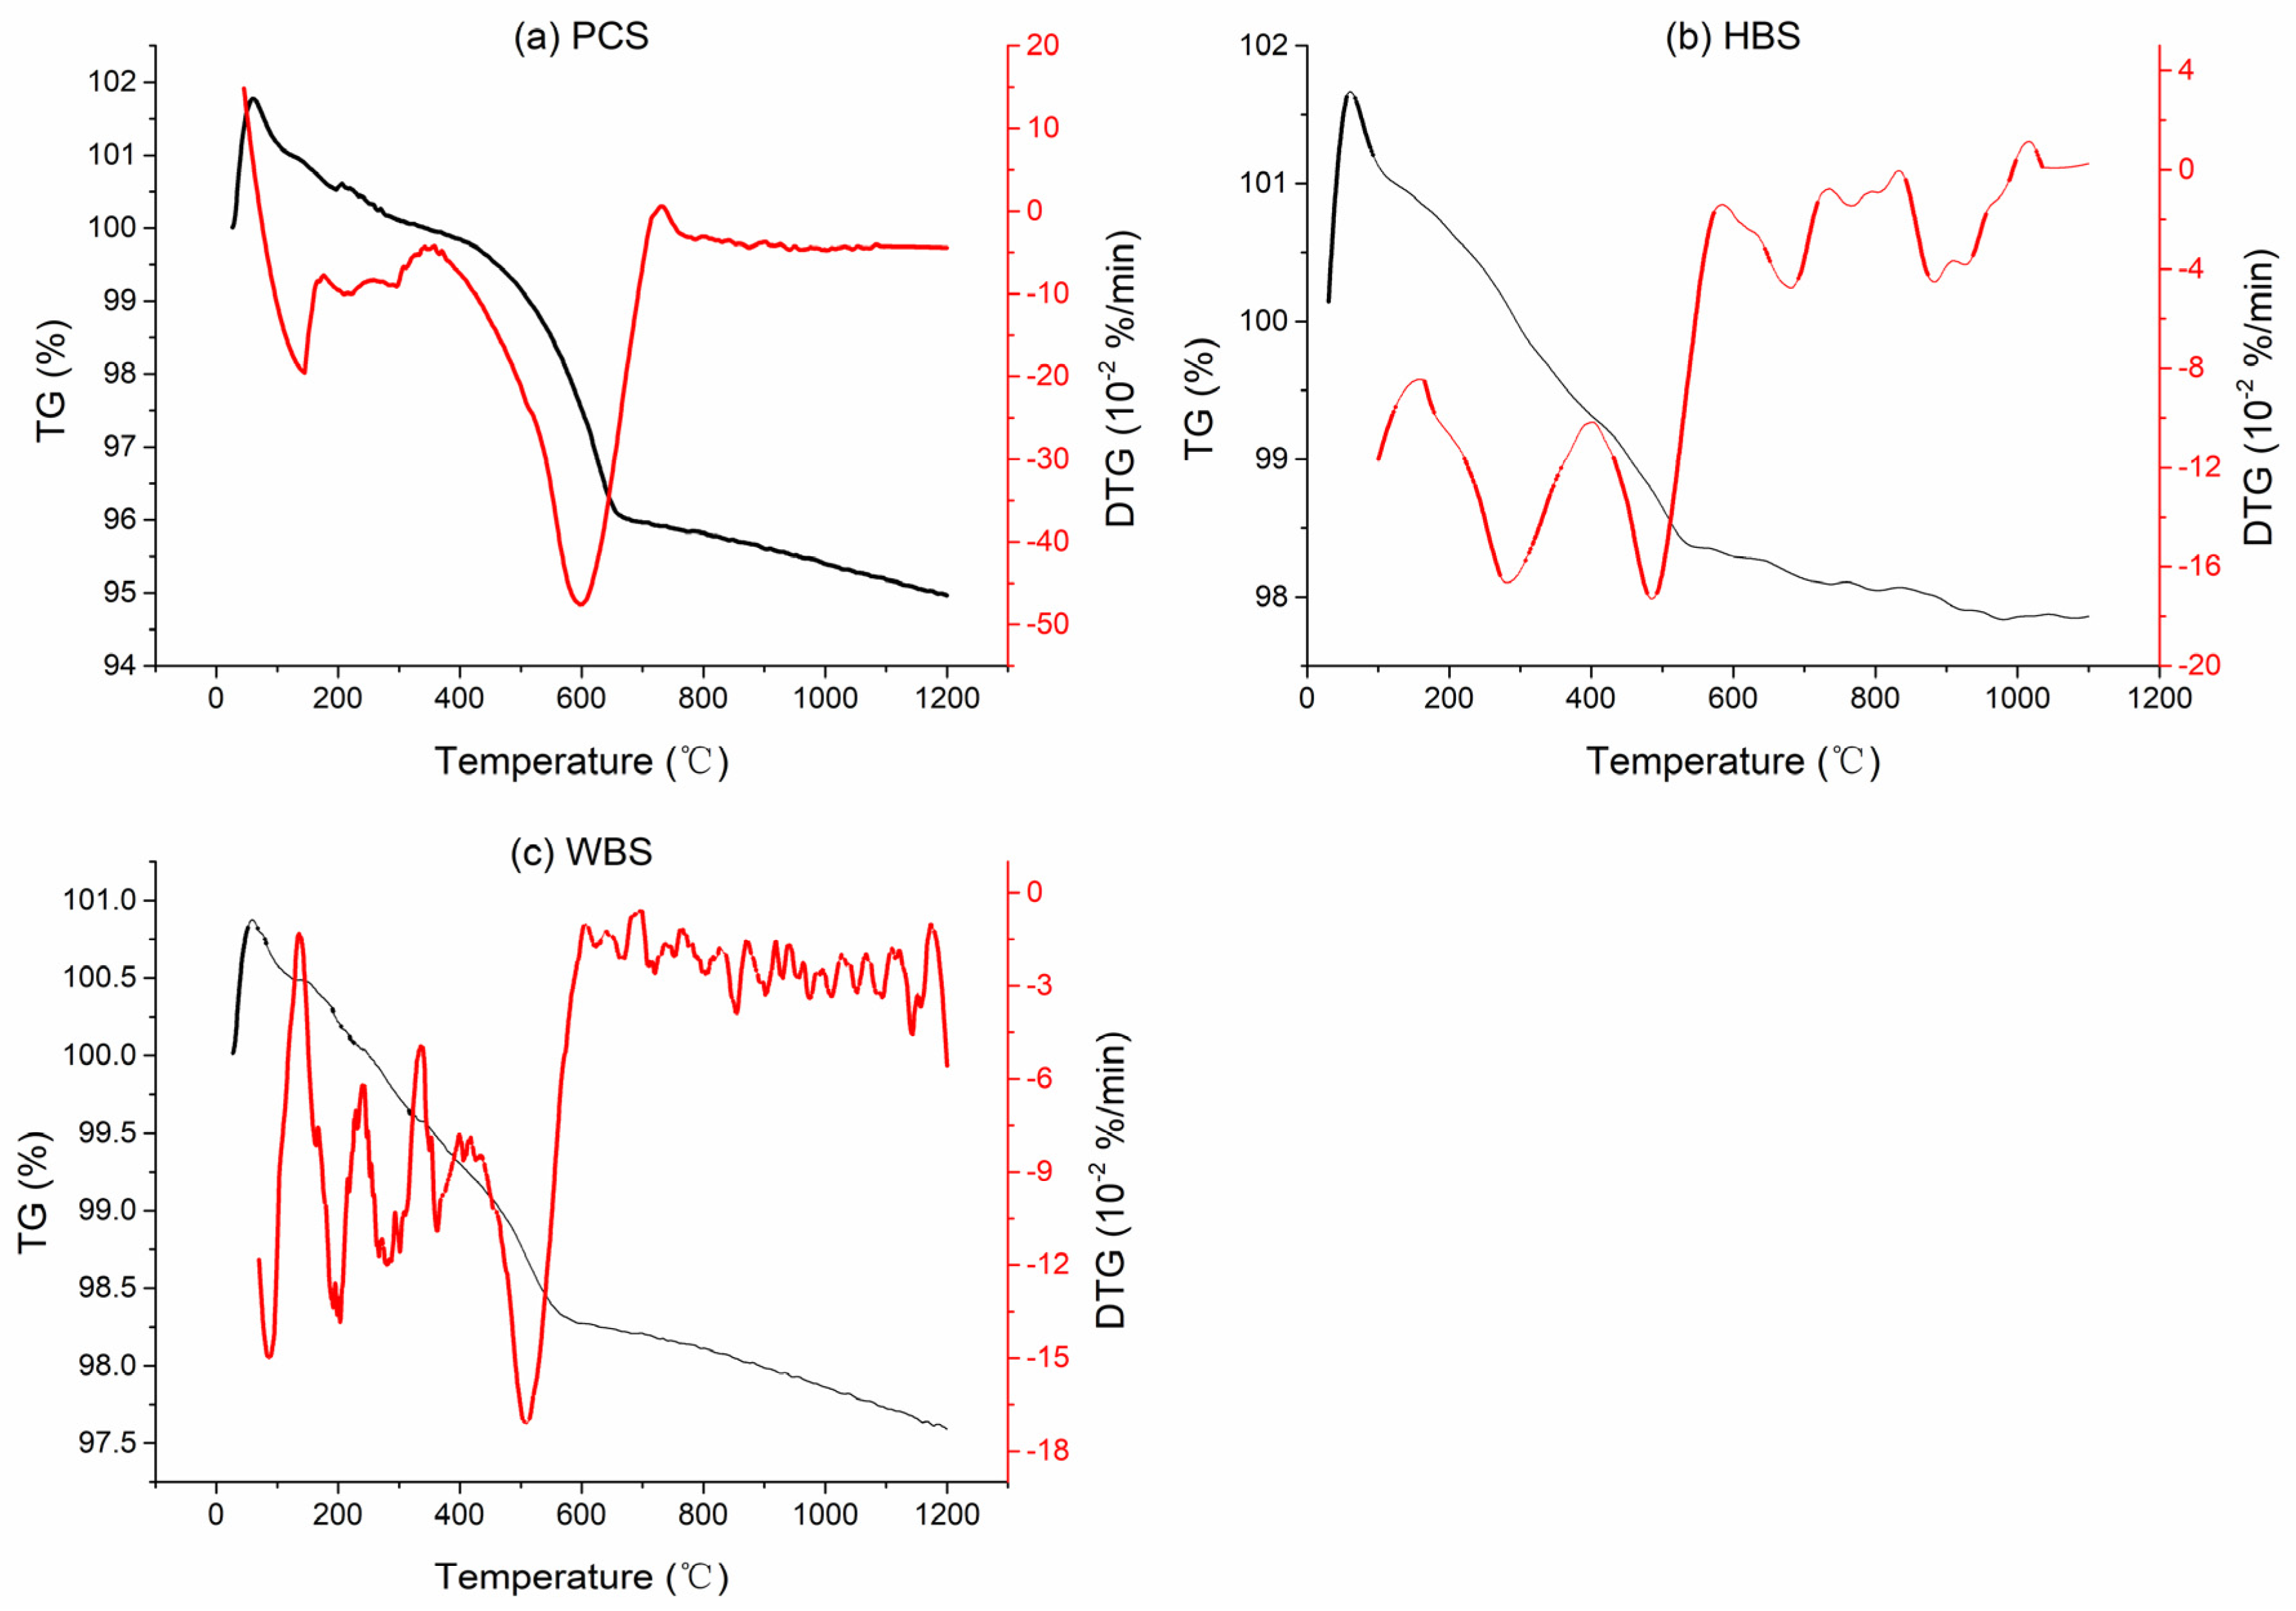
The thermal decomposition process of the resin sand is preliminarily analyzed, the decomposition atmosphere is set to nitrogen, the heating rate is 30 °C/min, and the temperature range is 25 °C–1200 °C. The pyrolysis process is shown in Figure 2. The thermal decomposition data of resin sand can be found in Supplementary Materials.
Figure 2 shows that there are significant differences in the pyrolysis processes of the three resin sands. The differences are mainly related to the pyrolysis characteristics of each resin sand, resulting in each resin sand exhibiting different pyrolysis behaviors. The pyrolysis process of resin sand can be divided into three stages. In the first stage, the PCS ranges from 25 °C to 400 °C, the HBS and WBS range from 25 °C to 200 °C, and the dehydration reaction and volatilization of small molecular organic matter mainly occur during this stage. Notably, at this stage, due to the influences of buoyancy and convection, baseline drift occurs in the TG curve.
For the PCS in the first stage, depolymerization of phenolic resins produces phenol and its methyl substituents. In addition, the crosslinking of hydroxyl and methylene functional groups produces moisture and a small amount of CO.
In the second stage, the PCS ranges from 400 °C to 700 °C, and the HBS and WBS range from 200 °C to 600 °C. In this stage, the three different resin sands show obvious mass losses, and the adhesive and curing agent in the resin sand undergo drastic pyrolysis while releasing volatiles. The maximum mass loss rate of the PCS is the largest at 57.08 × 10⁻²%/min. The maximum mass loss rates of HBS and WBS are approximately the same at 19.25 × 10⁻²%/min and 21.65 × 10⁻²%/min, respectively.
For PCS in the second stage, both crosslinking bond breaking and benzene ring rearrangement generate H2, CH4, CO, and H2O. The benzene ring in the phenolic resin gradually condenses with increasing carbonization treatment temperature to form a thick polyphenylene ring structure with a high degree of polymerization.
Furan resin undergoes complex pyrolysis and polycondensation reactions, releasing small molecular gases, such as H2O and CO. From 150 °C to 370 °C, polycondensation is generally accompanied by the combination and rearrangement of carbon atoms. From 370 °C to 570 °C, the intense pyrolysis of furan resin and the polycondensation reaction begin to slow. From 570 °C to 740 °C, the pyrolysis and polycondensation reactions of furan resin enter the final stage. The benzene ring in furan resin gradually polycondensates with increasing carbonization temperature, forming a polybenzene thick-ring structure with a high degree of polymerization [65].
In the third stage, the PCS ranges from 700 °C to 1200 °C, and the HBS and WBS range from 600 °C to 1200 °C. At this stage, the remaining adhesive, curing agent, and other materials in the resin sand continue to decompose slowly, and the quality of the resin sand is basically unchanged. The total mass losses of PCS, HBS, and WBS are 5.45%, 2.46%, and 2.63%, respectively.
For the PCS in the third stage, the unstable aromatic carbon is converted to a relatively stable carbon structure by a condensation reaction, releasing H2 and small amounts of CO and moisture.
Above 740 °C, the molecular rearrangement and adjustment of the furan resin after coking occur. The polybenzene thick ring formed after the coking of furan resin experiences a microscopic transition state during the transformation to a graphite microcrystalline structure during carbonization. The furan resin precipitates graphite microcrystals at approximately 650 °C [65].
Table 1 shows that the contents of adhesive and curing agents in the WBS are the highest. The total mass loss during pyrolysis should be the largest, which seems to be inconsistent with the experimental results of this study. This result arises mainly due to the different mixing processes of the resin sand.
The sand mixing process for PCS requires the raw sand to be initially heated to 130–160 °C [66]. Then, phenolic resin is added to mix with the raw sand, and the resin melts and wraps around the surface of the sand grains. When the temperature of the sand decreases to 105–110 °C, the curing agent hexamethylene tetramine is added, and the mixture gradually cools.
The sand mixing process for HBS starts with mixing the raw sand with an aqueous solution of the curing agent ammonium chloride. Then, furan resin is added and mixed. Finally, the mixed sand is placed in the metal core box at a temperature of 200–250 °C [66]. When the core sand is heated, the adhesive furan resin on the surface of the sand grains hardens in a very short period by a condensation reaction.
The sand mixing process for WBS is similar to that for HBS; the raw sand is mixed with an aqueous solution of the curing agent copper chloride, furan resin is added and mixed, and the mixed sand is finally placed into the metal core box at a temperature of 150–220 °C [66]. The process of WBS can use the original HBS shooting machine, without additional equipment investment. Conversely, the original production process can be changed.
Greater mass loss from HBS and WBS occurs while mixing sand. Therefore, the final mass losses of HBS and WBS in this pyrolysis experiment are not as large as that of PCS.
3.3. Thermal Decomposition of Resin Sand in Nitrogen and Air Atmospheres
The thermal decomposition behaviors of the resin sand at a heating rate of 30 °C/min in nitrogen and air atmospheres are shown in Figure 3.
Figure 3a–c show that the TG curve of resin sand pyrolysis continues to decrease with increasing temperature. In addition, the TG curve in an air atmosphere decreases more than that in a nitrogen atmosphere. The mass losses of PCS, HBS, and WBS in a nitrogen atmosphere are 4.45%, 2.06, and 1.81%, respectively, while those in an air atmosphere are 5.45%, 2.46%, and 2.39%, respectively.
Figure 3d–f show that there is a peak in the mass loss of the PCS at approximately 600 °C. The main reason is that the adhesive in the coated sand is pyrolyzed. The phenol hydroxyl group and methylene group form an ether bond or a C-C crosslinking bond through a condensation reaction to release H2O molecules. However, the methylene bridge bond and ether bond connect to the benzene ring broke to form CO, CH4, phenol, and its derivatives. Moreover, the benzene ring substances gradually form graphitic carbon structures.
The first mass loss peaks of HBS and WBS appear at approximately 300 °C in the air atmosphere. The main reason is that in HBS and WBS, the methylene or methine bridge connecting the furan resin chain starts to break when the temperature exceeds 250 °C. Furan resin undergoes a significant ring-opening reaction between 300 °C and 350 °C. The second peak of mass loss appears at approximately 500 °C. In the ring-opening reaction of furan resin, the amount of benzene increases significantly if the temperature exceeds 400 °C. The intermediate products of furan resin form benzene between 460 °C and 650 °C. In addition to benzene, the pyrolysis products of HBS and WBS include CO, CH4, H2O, CO2, and other small gas molecules.
3.4. Thermal Decomposition of Resin Sand at Different Heating Rates
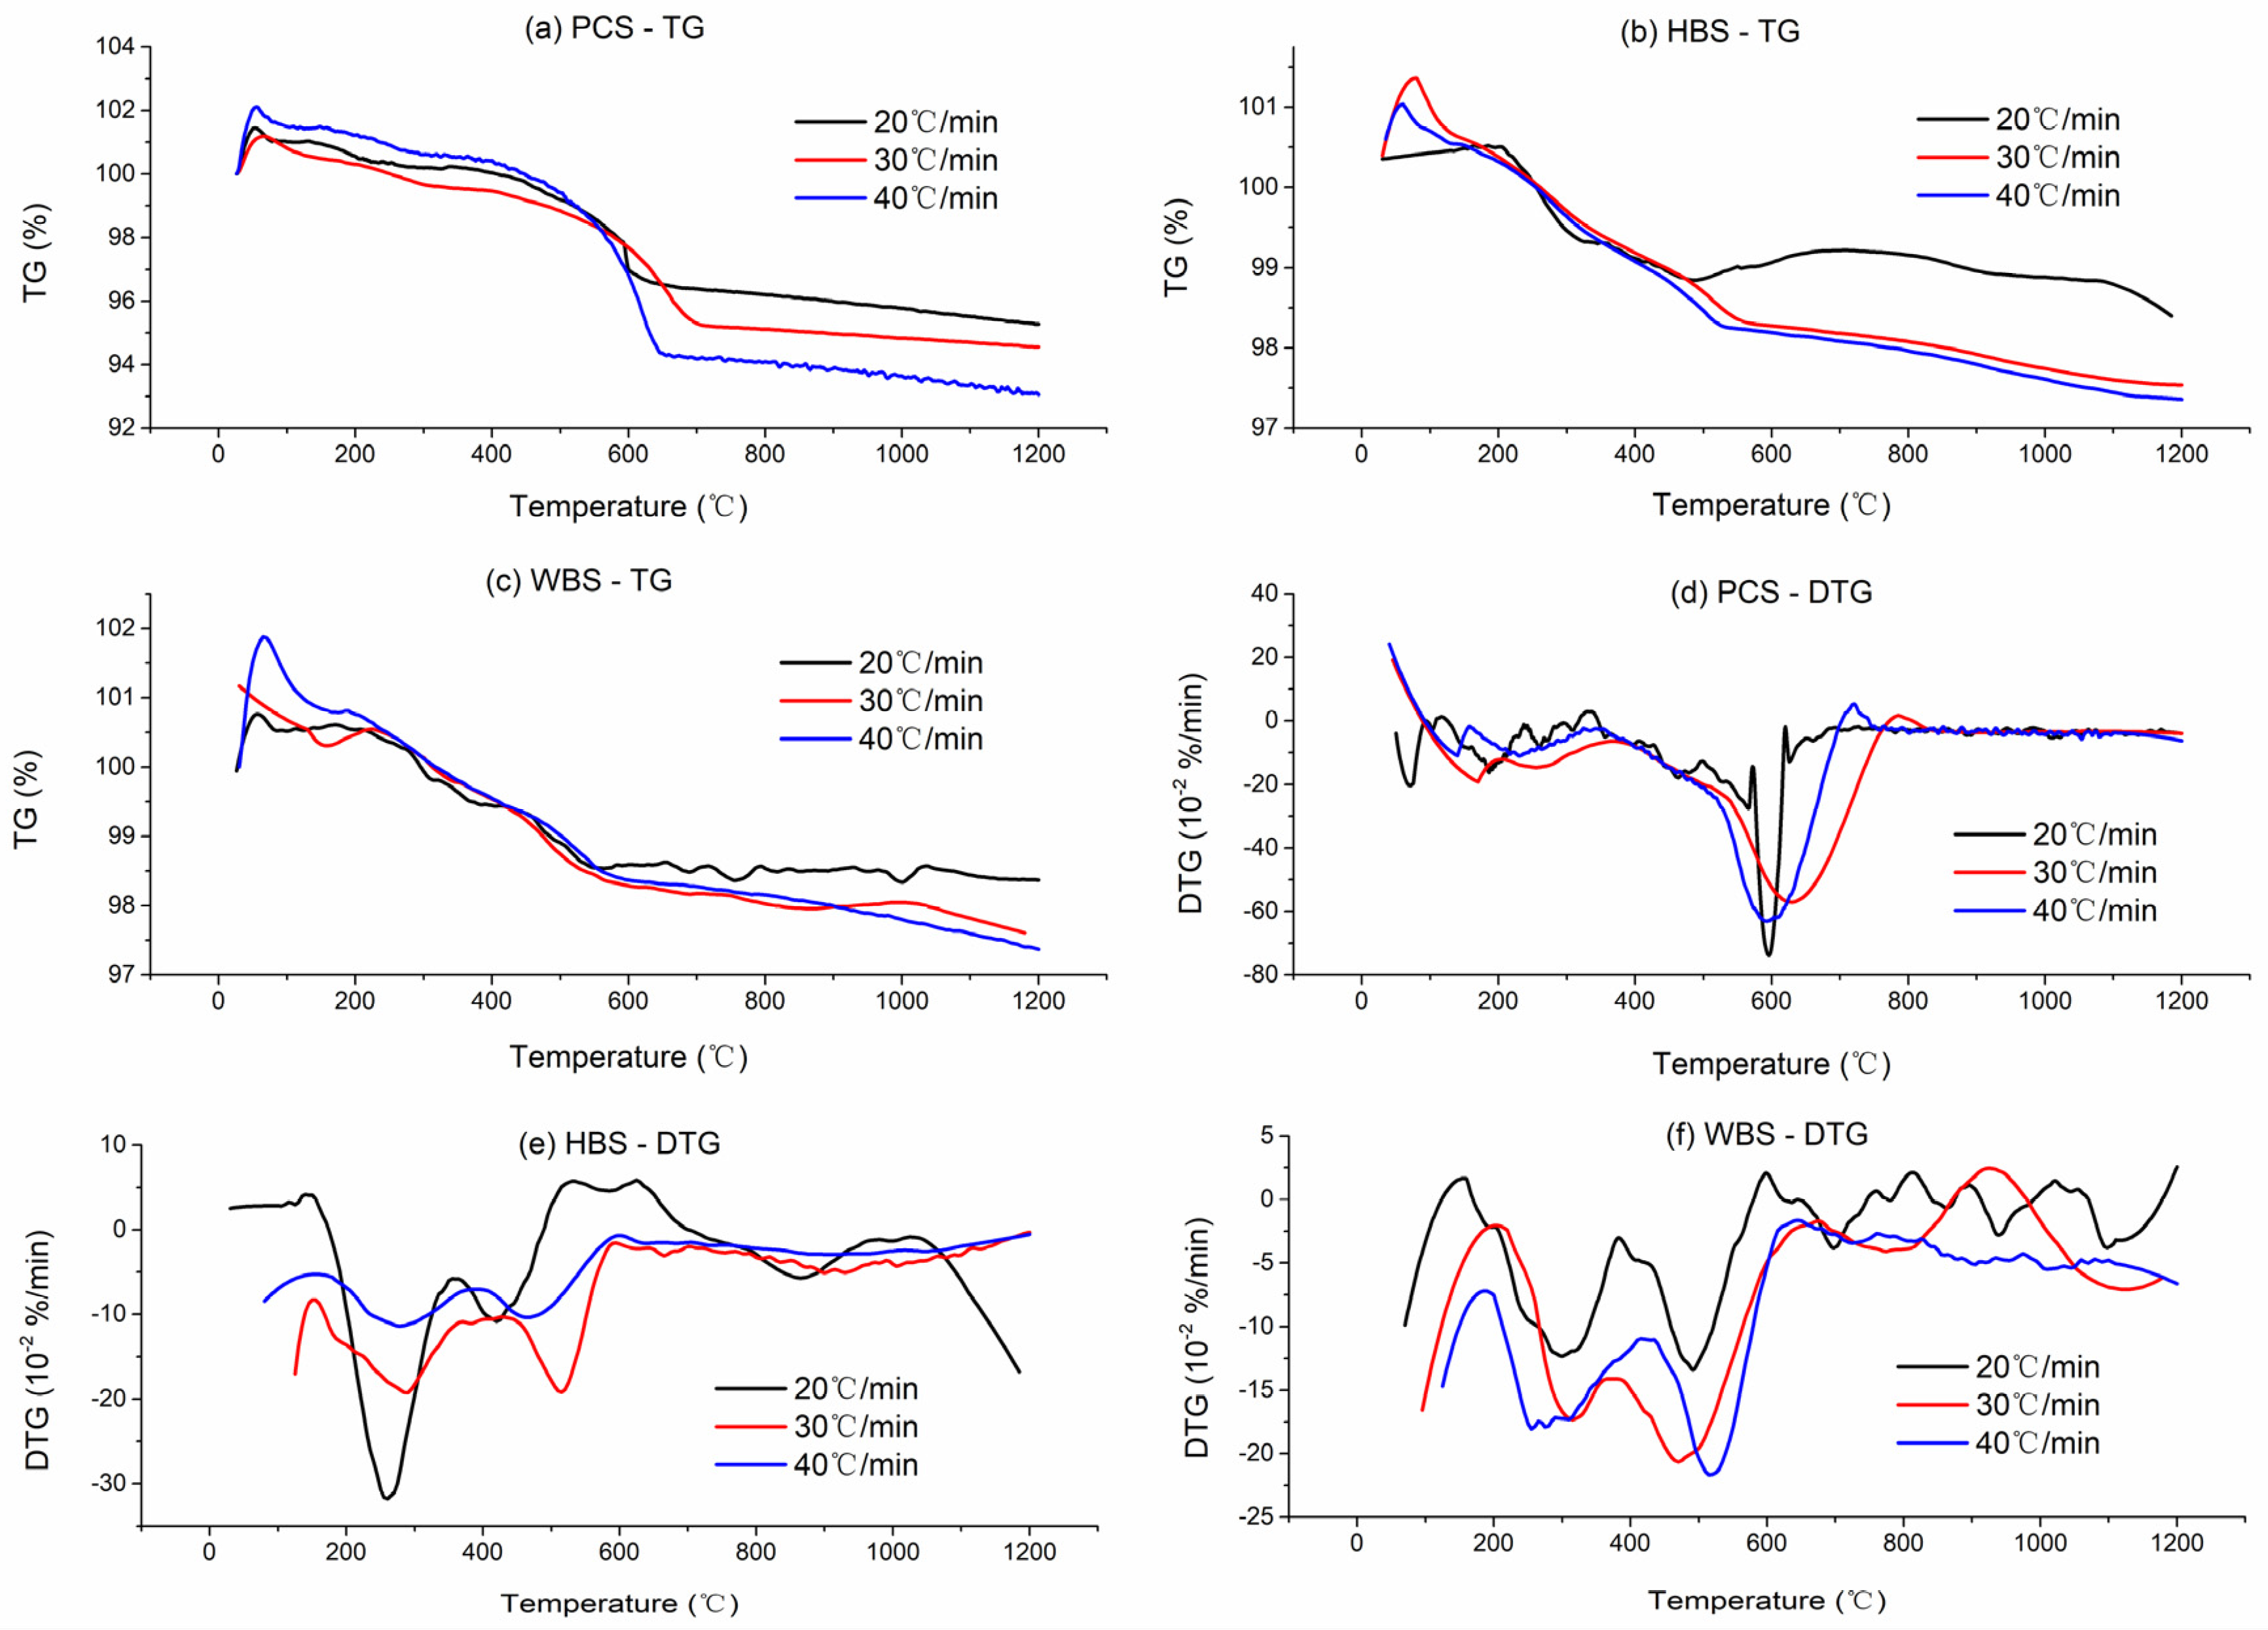
The thermal decomposition behaviors of the resin sand at heating rates of 20 °C/min, 30 °C/min, and 40 °C/min in an air atmosphere are shown in Figure 4.
Figure 4a–c show that the TG curves of the resin sand continue to decrease with increasing temperature, and the higher the heating rate is, the greater the mass loss of the resin sand when the heating process ends. At heating rates of 20 °C/min, 30 °C/min, and 40 °C/min, the mass losses of PCS are 4.73%, 5.45%, and 6.95%; those of HBS are 1.6%, 2.46%, and 2.64%; and those of WBS are 1.63%, 2.39%, and 2.63%, respectively.
Figure 4d–f show that the mass loss rate of resin sand at different heating rates is relatively complicated. The mass loss peak of PCS is largest at a heating rate of 20 °C/min. The first mass loss peak of the HBS occurs at a heating rate of 20 °C/min. However, the second mass loss peak occurs at a heating rate of 30 °C/min. The two mass loss peaks of WBS basically increase with increasing heating rate. The main reason for this difference is that different types of resin sand exhibit distinct pyrolysis behaviors under various heating rates, and the underlying reasons will be explored in future research.
3.5. Volatile Release Characteristic Index of Resin Sand
The volatile release characteristic index can be calculated based on the pyrolysis process of resin sand. Before calculating the volatile release characteristic index of resin sand, it is necessary to first determine the values of each parameter in Equation (1). The initial temperature Ts of volatile release refers to the temperature at which the mass loss rate of the sample during the pyrolysis experiment reaches 0.1 mg/min [19]. The initial mass of the sample is generally 5 mg for pyrolysis experiments [20], suggesting that the mass loss rate of the sample must reach 2%/min. After determining the rate of mass loss per minute, the initial temperature Ts is independent of the sample mass during the pyrolysis experiment. However, the maximum mass loss rate of the resin sand in this study is less than 2%/min. It is impossible to calculate the volatile release characteristic index of resin sand following this concept. The authors reported that Tstv/mloss is 2.86%/min based on comprehensive research on the volatile release characteristic index of rice husks [15], where Tstv is the threshold for determining the initial temperature Ts; specifically, this parameter is the percentage of mass loss of the sample per minute. mloss is the mass loss of the sample during pyrolysis. The value of Tstv is 2%/min according to Equation (1). The threshold value of Tstv can be determined first based on the Tstv/mloss ratio and the mass loss of the resin sand. The release characteristic index of the volatiles in the resin sand can be determined by combining Equation (1) with the remaining parameters, as shown in Table 4.
As shown in Table 4, the volatile release characteristic index D of the resin sand increases with increasing heating rate under both nitrogen and air atmospheres. In addition, the volatile release characteristic index of resin sand is greater in an air atmosphere than in a nitrogen atmosphere. This difference suggests that increasing the heating rate in the air atmosphere is favorable for the pyrolysis of resin sand.
3.6. Kinetics Analysis of Resin Sand
By taking the term (1/T) × 103 as the independent variable and the term—ln[−ln(1 − α)/T2] as the dependent variable, an equation can be fitted. The activation energy E and prefactor A of the resin sand can be calculated by calculating the slope and intercept of the linear equation, as shown in Table 5.
The fitting effect of the equation can be roughly determined by the Pearson correlation coefficient. In Table 5, except for one fitting equation with a correlation coefficient of 0.854, the correlation coefficients of the remaining equations all exceed 0.92, indicating that the fitting effect of the equations is good. To strictly test the fitting effect of the equation, it is necessary to conduct one-way ANOVA for the error source, as shown in Table 6.
By taking the results of one-way ANOVA of PCS in a nitrogen atmosphere at a heating rate of 20 °C/min as an example, F0.05 (1164) = 3.84 < 16,7906, indicating that the independent variable significantly influences the dependent variable. In addition, p = 0 < 0.05 indicates that the independent variable significantly impacts the dependent variable. Therefore, the independent variable of the fitting equation of the pyrolysis kinetics parameters of PCS significantly influences the dependent variable in the nitrogen atmosphere and at a heating rate of 20 °C/min, indicating that the linear fitting equation selected is accurate and effective. Similar tests can be carried out, and the fitting equations of the pyrolysis kinetic parameters of PCS, HBS, and WBS under other conditions are accurate and effective.
The activation energies of PCS, HBS, and WBS decrease with increasing heating rate in a nitrogen atmosphere, indicating that the energy required for the conversion of volatiles in resin sand to an active state is reduced. Moreover, increasing the heating rate is conducive to the pyrolysis of resin sand in a nitrogen atmosphere.
Overall, the activation energy of PCS is the largest in the nitrogen atmosphere, the activation energy of WBS is the second largest, and the activation energy of HBS is the smallest. This trend is mainly related to the sand mixing processes of the three types of resin sand. During sand mixing, the HBS must be heated to 200–250 °C, the WBS must be heated to 150–220 °C, and the PCS must be heated to 130–160 °C [66]. The higher the temperature of resin sand heating is, the more energy it receives, and the smaller the energy required to activate volatiles during pyrolysis; specifically, the activation energy is reduced.
The activation energy of resin sand does not regularly change with the heating rate in an air atmosphere. The activation energy of PCS increases with increasing heating rate, while the activation energies of HBS and WBS first increase and then decrease with increasing heating rate. These results indicate that the pyrolysis of resin sand in an air atmosphere is complicated, and future research must address this issue.
4. Discussion
4.1. Comparison with Previous Studies
The main component of foundry sand is ash, the contents of volatiles and moisture are very low, and fixed carbon is not detected [4,30]. These results are consistent with those of this study. Murthy and Rao tested the chemical components of quartz sand and found that the content of SiO2 accounts for 96.62% of the total content [67], which is basically consistent with our results. For foundry sand dust, the content of SiO2 is approximately 50% [68]. Additional impurities are mixed in the foundry sand dust during the shakeout process, which sharply decreases the SiO2 content. Only the proximate analysis of the raw sand was carried out in Ref. [30], and proximate and chemical composition analyses of the raw sand were carried out in Ref. [4]. In addition to the proximate and chemical composition analyses of the raw sand, a particle diameter analysis of the raw sand was carried out. The results showed that the raw sand does not contain mud, indicating that the raw sand is of high quality.
The mass loss of biomass can reach approximately 75% during thermal decomposition [69,70,71]. The main component of resin sand is silica, which is stable in high-temperature environments; thus, the total mass loss of resin sand is much smaller than that of biomass. During the pyrolysis of self-hardening resin sand, the maximum mass loss is 2.24% [30], which is basically consistent with the results of this study, indicating that the mass loss during the pyrolysis of resin sand is very small with high-temperature stability.
The mass loss of the resin sand in the air atmosphere is greater than that in the nitrogen atmosphere because the adhesive and curing agent in the resin sand is prone to pyrolysis in the air atmosphere. The mass loss of self-hardening resin sand in an air atmosphere is greater than that in a nitrogen atmosphere [30], which is consistent with the results of this paper.
Although the mass loss of resin sand increases with increasing heating rate, the total mass loss of resin sand during heating is still lower than that of other materials [71,72,73]. The main component of resin sand, silicon dioxide, has high-temperature stability, and its mass loss is not large in a high-temperature environment. This phenomenon is conducive to the casting process. During the thermal decomposition experiment, with increasing heating rate, the residual mass of the resin decreases [74]. Therefore, increasing the heating rate is conducive to the thermal decomposition of the material, which is consistent with the results of this paper. Reportedly, by pyrolyzing self-hardening resin sand, increasing the heating rate is prone to the pyrolysis of foundry sand [4,30]. In this study, pyrolysis experiments of different types of resin sand at different heating rates were carried out, and the conclusions are valuable.
The volatile release characteristic index of self-hardening resin sand in a nitrogen atmosphere increases with increasing heating rate, and it is greater in an air atmosphere than in a nitrogen atmosphere at a heating rate of 20 °C/min [4], which is consistent with the results of this study. This study involves a comprehensive investigation of the volatile release characteristics of resin sand through pyrolysis experiments under different heating rates and decomposition atmosphere conditions with different types of resin sand. The results are convincing. Compared with other materials, the volatile release characteristic index of resin sand is very small, approximately one millionth to one-tenth that of other materials [31,32,33]. Compared with other materials, resin sand is difficult to pyrolyze under high-temperature conditions. The volatile content of resin sand is very low, and the main component SiO2 has high-temperature stability, which is conducive to maintaining the stability of molding sand during casting. These results are consistent with the analyses of the TG and DTG curves of the resin sand.
The activation energy of PCS in a nitrogen atmosphere at a heating rate of 20 °C/min is roughly equal to that of corncob [44] but much less than that of solid waste and lignite [75]. The average mass loss of resin sand during pyrolysis is 3.03%, while the mass loss of biomass during pyrolysis is approximately 75% [44]. In addition, the mass loss of solid waste can reach 90% [75]. The main component of the resin sand in this study is silica, which has high-temperature stability. Furthermore, the volatile content is very low, and the number of volatiles that can be converted into an active state is relatively low. Therefore, the activation energy required in the main pyrolysis stage is low. In the pyrolysis stage of other materials (biomass, solid waste, etc.), most of the mass is converted into volatile dispersion loss in an active state; thus, the activation energy requirements are relatively great. With increasing heating rate, the activation energy of self-hardening resin sand in a nitrogen atmosphere gradually decreases [4], which is consistent with the results of this study. In this study, the activation energy of resin sand was investigated in pyrolysis experiments of different types of resin sand at different heating rates, and the results are valuable.
The activation energy of self-hardening resin sand in an air atmosphere is greater than that in a nitrogen atmosphere [4]. However, this conclusion is obtained at only one heating rate, providing weak evidence. Overall, there is no regular causal relationship between the activation energy and the heating rate of resin sand in an air atmosphere. Some scholars have reported that the activation energy of materials in an air atmosphere is greater than that in a nitrogen atmosphere [76], but other scholars have found opposing support [77]. To investigate the changes in the activation energy of materials, some scholars have conducted thermal decomposition experiments on materials with different oxygen contents [78]. The results showed that the activation energy of materials changes unstably with increasing oxygen content. The activation energy of the material increases steadily with increasing mass conversion rate and decreases when the activation energy peaks [79].
4.2. Limitations
First, only the pyrolysis behaviors of resin sand in nitrogen and air atmospheres were investigated. Further attention should be given to the influences of oxygen content on the thermal decomposition characteristics of resin sand. Second, the activation energy of resin sand does not change regularly with the heating rate in an air atmosphere, and future studies should focus on this issue. Third, the mass loss of resin sand occurs during the sand mixing process, and future studies should consider this issue.
5. Conclusions
The main component of the resin sand is SiO2, which has high-temperature stability. Increasing the heating rate in an air atmosphere is conducive to the pyrolysis of resin sand. The average mass loss of the resin sand during pyrolysis is 3.03%, which is much smaller than that of the other materials. The term Tstv/mloss is equivalent to 2.86%/min, and the volatile release characteristic index of resin sand can be calculated. The value of this parameter is even smaller than that of other materials. The validity of the kinetic parameters of the resin sand was tested by one-way ANOVA.
Supplementary Materials
The following supporting information can be downloaded at https://0-www-mdpi-com.brum.beds.ac.uk/article/10.3390/buildings14051234/s1: The thermal decomposition data have been uploaded as electronic Supplementary Material.
Author Contributions
Data collection, Methodology, Writing—review and editing: Q.X.; Methodology: Y.Z., Investigation: K.X., Formal analysis: B.L., Data curation, Review and editing: N.S. All authors have read and agreed to the published version of the manuscript.
Funding
This study was supported by the Natural Science Foundation of Henan (Grant No. 232300420297), General Program of Humanities and Social Sciences Research in Henan Universities (Grant No. 2024-ZDJH-035), Research Innovation Fund of Henan Agricultural University in Philosophy and Social Sciences (Grant No. SKJJ2022B06), Major Program of Philosophy and Social Science Basic Research in Higher Education Institutions in Henan Province (Grant No. 2024-JCZD-21), and Research and Practice Program on Research Teaching Reform in Undergraduate Colleges and Universities in Henan Province (Grant No. 2022SYJXLX017).
Data Availability Statement
The data presented in this study are available in Supplementary Materials.
Conflicts of Interest
The authors declare no conflicts of interest.
References
- Tang, H.; Zhang, W.; Li, X.; Wei, S. A discrete group teaching optimization algorithm for solving many-objective sand casting whole process production scheduling problem. Comput. Oper. Res. 2024, 164, 106563. [Google Scholar] [CrossRef]
- Yu, J.; Zhang, Y.; Guo, J.; Shu, X.; Lu, Q.; Chen, Q. Sand casting-inspired surface modification of 3D-printed porous polyetheretherketone scaffolds for enhancing osteogenesis. Compos. Part A-Appl. Sci. Manuf. 2024, 179, 108033. [Google Scholar] [CrossRef]
- Xu, Q.; Xu, K.; Li, L.; Xu, X.; Yao, X. Energy release and countermeasures for sand casting explosion accidents. Hum. Ecol. Risk Assess. 2020, 26, 2078–2090. [Google Scholar] [CrossRef]
- Chen, S.; Zhang, J.; Xu, K.; Xu, Q. Thermal Decomposition Behaviour of Foundry Sand for Cast Steel in Nitrogen and Air Atmospheres. Math. Probl. Eng. 2020, 2020, 8121276. [Google Scholar] [CrossRef]
- Meskhi, B.; Beskopylny, A.N.; Stel’makh, S.A.; Shcherban, E.; Mailyan, L.R.; Shilov, A.A.; El’shaeva, D.; Shilova, K.; Karalar, M.; Aksoylu, C.; et al. Analytical Review of Geopolymer Concrete: Retrospective and Current Issues. Materials 2023, 16, 3792. [Google Scholar] [CrossRef]
- Celik, A.I.; Tunc, U.; Bahrami, A.; Karalar, M.; Mydin, M.A.O.; Alomayri, T.; Ozkilic, Y.O. Use of waste glass powder toward more sustainable geopolymer concrete. J. Mater. Res. Technol.-JMRT 2023, 24, 8533–8546. [Google Scholar] [CrossRef]
- Ozkilic, Y.O.; Celik, A.I.; Tunc, U.; Karalar, M.; Deifalla, A.; Alomayri, T.; Althoey, F. The use of crushed recycled glass for alkali activated fly ash based geopolymer concrete and prediction of its capacity. J. Mater. Res. Technol.-JMRT 2023, 24, 8267–8281. [Google Scholar] [CrossRef]
- Madenci, E.; Fayed, S.; Mansour, W.; Ozkilic, Y.O. Buckling performance of pultruded glass fiber reinforced polymer profiles infilled with waste steel fiber reinforced concrete under axial compression. Steel Compos. Struct. 2022, 45, 653–663. [Google Scholar]
- Fayed, S.; El-din, A.B.; Basha, A.; Mansour, W. Shear behavior of RC pile cap beams strengthened using ultra-high performance concrete reinforced with steel mesh fabric. Case Stud. Constr. Mater. 2022, 17, e01532. [Google Scholar] [CrossRef]
- Chakraborty, P.; Wood, D.A.; Sinh, S.; Hzara, B. Trace element contamination in soils surrounding the open-cast coal mines of eastern Raniganj basin, India. Environ. Geochem. Health 2023, 45, 7275–7302. [Google Scholar] [CrossRef]
- Xu, Q.; Xu, K. Safety assessment of sand casting explosion accidents through on-site testing and numerical simulation of the temperature variation in sand molds to protect employee health. Process Saf. Environ. Prot. 2022, 159, 452–463. [Google Scholar] [CrossRef]
- Wang, X.; Zhang, T.; Zhang, R.; Wang, X.; Yuan, Y.; Li, Z.; Han, Z. Study on the heat transfer at the casting-mould interface in resin-bonded sand mould casting of Mg-Gd-Y-Zr alloy. Int. J. Cast Met. Res. 2020, 33, 1–10. [Google Scholar] [CrossRef]
- Jeon, J.H.; Bae, D.H. Effect of cooling rate on the thermal and electrical conductivities of an A356 sand cast alloy. J. Alloys Compd. 2019, 808, 151756. [Google Scholar] [CrossRef]
- Li, Y.; Hu, A.; Fu, Y.; Liu, S.; Shen, W.; Hu, H.; Nie, X. Al Alloys and Casting Processes for Induction Motor Applications in Battery-Powered Electric Vehicles: A Review. Metals 2022, 12, 216. [Google Scholar] [CrossRef]
- Hua, Y.; Luo, L.; Le Corre, S.; Fan, Y. Machine-learning topology optimization with stochastic gradient descent optimizer for heat conduction problems. Int. J. Heat Mass Transf. 2024, 223, 125226. [Google Scholar] [CrossRef]
- Weng, L.; Xu, F.; Chen, X. Three-dimensional analysis of thermoelastic damping in couple stress-based rectangular plates with nonlocal dual-phase-lag heat conduction. Eur. J. Mech. A-Solids 2024, 105, 105223. [Google Scholar] [CrossRef]
- Bar-Kohany, T.; Jain, A. Dissipation of boundary effects in multilayer heat conduction problems. Int. J. Heat Mass Transf. 2024, 223, 125207. [Google Scholar] [CrossRef]
- Ammar, A.; Ben Saada, M.; Cueto, E.; Chinesta, F. Casting hybrid twin: Physics-based reduced order models enriched with data-driven models enabling the highest accuracy in real-time. Int. J. Mater. Form. 2024, 17, 16. [Google Scholar] [CrossRef]
- Wang, M.; Zheng, L.; Kang, H. 3-Dimenional conformal cooling channel design: Origami-inspired topology optimization approach. Appl. Therm. Eng. 2024, 242, 122526. [Google Scholar] [CrossRef]
- Ringel, A.; Hirt, G. Bending behavior of structured steel sheets with undercuts for interlocking with Al die-cast metal. Int. J. Mater. Form. 2024, 17, 2. [Google Scholar] [CrossRef]
- Zong, H.; Cong, Q.; Zhang, T.; Hao, Y.; Xiao, L.; Hao, G.; Zhang, G.; Guo, H.; Hu, Y.; Jiang, W. Simulation of printer nozzle for 3D printing TNT/HMX based melt-cast explosive. Int. J. Adv. Manuf. Technol. 2022, 119, 3105–3117. [Google Scholar] [CrossRef]
- Yan, B.; Wang, R.; Ding, B.; Wang, Y. Numerical simulation analysis of tunnel backfill grout based on DEM-FDM coupling and particle inlet. Undergr. Space 2024, 14, 285–299. [Google Scholar] [CrossRef]
- Yohannan, A.; Vincent, S.; Divakaran, N.; Venugopal, A.K.P.; Patra, S.; Ashish, K.; Mohanty, S. Experimental and simulation studies of hybrid MWCNT/montmorillonite reinforced FDM based PLA filaments with multifunctional properties enhancement. Polym. Compos. 2024, 45, 507–522. [Google Scholar] [CrossRef]
- Narayanan, S.; Sahani, P.; Rathod, J.; Soma, V.R.; Yalla, R.; Tata, B.V.R. Thin photonic crystal templates for enhancing the SERS signal: A case study using very low concentrations of dye molecules. Phys. Scr. 2024, 99, 35512. [Google Scholar] [CrossRef]
- Takemura, K.; Sudo, K.; Dorget, R.; Dadiel, J.L.; Sakafuji, M.; Yokoyama, K.; Oka, T.; Sakai, N. Study on the PFM Behavior of GdBCO Bulk Joined by ErBCO and Its FEM Simulation. IEEE Trans. Appl. Supercond. 2024, 34, 6800405. [Google Scholar] [CrossRef]
- Szucs, H. Numerical study to investigate the thermal characteristic length with coupled CFD-FEM simulations. Int. J. Heat Fluid Flow 2024, 106, 109312. [Google Scholar] [CrossRef]
- De Andrade, G.S.; Nascimento, E.J.G.; de Lemos, M.J.S. Transient heat transfer in concentric cylinders using periodic boundary condition and asymmetric heat generation applied to thermal plug and abandonment of oil wells. Int. J. Therm. Sci. 2024, 196, 108689. [Google Scholar] [CrossRef]
- Xu, Y.; Yang, G.; Hu, D. Comparison of surface tension models for the simulation of two-phase flow in an ISPH-FVM coupling method. Eur. J. Mech. B-Fluids 2024, 105, 57–96. [Google Scholar] [CrossRef]
- Liu, S.; Yang, G.; Xu, Y.; Hu, D. A SPH-FVM coupling method based on triangular mesh for the simulation of two-phase flows. Eng. Anal. Bound. Elem. 2024, 159, 237–258. [Google Scholar] [CrossRef]
- Xu, Q.; Xu, K.; Yao, X.; Li, J.; Li, L. Thermal decomposition characteristics of foundry sand for cast iron in nitrogen atmosphere. R. Soc. Open Sci. 2018, 5, 181091. [Google Scholar] [CrossRef]
- Yang, L.; Zhang, Z.; Chen, A.; Mao, W.; Zhu, Z.; Zhao, Y.; Zhang, L. Experimental and kinetic study on pyrolysis and combustion characteristics of pesticide waste liquid. J. Environ. Chem. Eng. 2024, 12, 111994. [Google Scholar] [CrossRef]
- Zhang, X.; Liu, Q.; Kong, B.; Bultinck, T.; Lu, W. Characterizing emissions of VOCs from the initial degradation of kitchen waste in household waste bins of residential areas in Beijing. J. Hazard. Mater. 2024, 466, 133479. [Google Scholar] [CrossRef] [PubMed]
- Sun, Y.; Du, C.; Chen, G.; Kumar, A.; Wu, S.; Cheng, Z.; Yan, B.; Chen, G.Y. Co-disposal kinetics and characteristics of sewage sludge and municipal solid waste incineration fly ash. J. Anal. Appl. Pyrolysis 2024, 177, 106319. [Google Scholar] [CrossRef]
- Zhu, Z.; Huang, Y.; Yu, M.; Gao, J.; Cheng, H.; Li, Z.; Xu, W.; Xiao, Y. Co-combustion of bituminous coal and industrious sludge under non-isothermal and isothermal conditions: Thermal behaviors, kinetic analyses, and heavy metals migration. J. Clean. Prod. 2024, 434, 140167. [Google Scholar] [CrossRef]
- Li, J.; Hu, X.; Qiao, X. Thermogravimetric experimental study on the co-combustion of coal gangue and polypropylene. Thermochim. Acta 2024, 732, 179660. [Google Scholar] [CrossRef]
- Zhang, Y.; Yang, Y.; Wang, G.; Li, P.; Liu, H.; Wang, H.; Gao, K. Changes in physical and chemical structure and Full-stage oxidation characteristics of coal caused by igneous intrusion. Energy 2024, 288, 129780. [Google Scholar] [CrossRef]
- Ogrodowska, D.; Damerau, A.; Banaszczyk, P.; Tanska, M.; Konopka, I.Z.; Pilat, B.; Dajnowiec, F.; Linderborg, K.M. Native and pregelatinized potato and rice starches and maltodextrin as encapsulating agents for linseed oil ethyl esters-Comparison of emulsion and powder properties. J. Food Eng. 2024, 364, 111799. [Google Scholar] [CrossRef]
- Cao, R.; Yang, D.; Kang, Z.; Huang, D.; Cui, Z.; Lu, Y. Effects of Inherent Minerals on Pyrolysis Behavior and Kinetics of Jimsar Oil Shale. ACS Omega 2023, 8, 40396–40406. [Google Scholar] [CrossRef]
- Yang, Y.; Luo, Z.; Ding, X.; Zhang, F.; Luo, C.; Zhang, H.; Shu, C. Effects of dust concentration, particle size, and crude oil concentration on the explosion characteristics of oil-immersed coal dust. Fuel 2024, 356, 129596. [Google Scholar] [CrossRef]
- Sun, Y.; Zhang, X.; Yu, Q.; Yang, T.; Yan, B.; Li, R.; Chen, G. Effect of pickling on pyrolysis characteristics and adsorption properties of biomass. Energy Sources Part A-Recovery Util. Environ. Eff. 2024, 46, 228–243. [Google Scholar] [CrossRef]
- Liu, Q.; Sun, J.; Gu, Y.; Zhong, W.; Gao, K. Experimental study on CO2 co-gasification characteristics of biomass and waste plastics: Insight into interaction and targeted regulation method. Energy 2024, 292, 130509. [Google Scholar] [CrossRef]
- Yahya, A.M.; Adeleke, A.A.; Nzerem, P.; Ikubanni, P.P.; Ayuba, S.; Rasheed, H.A.; Gimba, A.; Okafor, I.; Okolie, J.A.; Paramasivam, P. Comprehensive Characterization of Some Selected Biomass for Bioenergy Production. ACS Omega 2023, 8, 43771–43791. [Google Scholar] [CrossRef] [PubMed]
- Wang, J.; Zhang, S.; Guo, X.; Dong, A.; Chen, C.; Xiong, S.; Fang, Y.; Yin, W. Thermal Behaviors and Kinetics of Pingshuo Coal/Biomass Blends during Copyrolysis and Cocombustion. Energy Fuels 2012, 26, 7120–7126. [Google Scholar] [CrossRef]
- Yao, X.; Xu, K.; Liang, Y. Comparing the Thermo-Physical Properties of Rice Husk and Rice Straw as Feedstock for Thermochemical Conversion and Characterization of their Waste Ashes from Combustion. Bioresources 2016, 11, 10549–10564. [Google Scholar] [CrossRef]
- El-Sayed, S.E.; Abdelaziz, N.A.; El-Housseiny, G.S.; Aboshanab, K.M. Nanosponge hydrogel of octadecyl 3-(3,5-di-tert-butyl-4-hydroxyphenyl) propanoate of Alcaligenes faecalis. Appl. Microbiol. Biotechnol. 2024, 108, 100. [Google Scholar] [CrossRef] [PubMed]
- Liang, R.; Chen, C.; Tao, J.; Xu, Y.; Song, M.; Cheng, Z.; Yan, B.; Chen, G. Thermal kinetic parameters based classification method of residual waste oriented for efficient energy utilization. J. Clean. Prod. 2024, 439, 140914. [Google Scholar] [CrossRef]
- Ben Talouba, I.; Diop, A.; Neveu, K.; Balland, L.; Brodu, N.; Mouhab, N. Nitration of biodiesel by acetyl nitrate: Kinetic study and chemical safety parameters. Thermochim. Acta 2024, 731, 179647. [Google Scholar] [CrossRef]
- Cai, J.; Huang, Q.; Chen, H.; Zhang, T.; Niu, B.; Zhang, Y.; Long, D. Evaluating two stages of silicone-containing arylene resin oxidation via experiment and molecular simulation. Chin. J. Chem. Eng. 2024, 66, 189–202. [Google Scholar] [CrossRef]
- Li, M.; Zhang, D.; Han, Z.; Jiang, L. Thermal oxidation characteristics of polystyrene with different particle sizes based on the traditional kinetic approaches and distributed activation energy model. J. Therm. Anal. Calorim. 2024, 149, 993–1001. [Google Scholar] [CrossRef]
- Wakimoto, S.; Matsukawa, Y.; Aoki, H. New criteria to select reasonable hyperparameters for kinetic parameter estimation in distributed activation energy model (DAEM) by using neural network. Chem. Eng. Sci. 2024, 285, 119597. [Google Scholar] [CrossRef]
- Song, Y.; Jin, Z.; Zhang, J.; Jin, B.; Peng, R. Spiral gas-solid two-phase flow continuous mechanochemical synthesis of salophen complexes and catalytic thermal decomposition of ammonium perchlorate. Dalton Trans. 2024, 53, 3765–3776. [Google Scholar] [CrossRef] [PubMed]
- Kumar, R.; Dubey, P.; Mondal, M.K. Analysis of kinetics, mechanism, thermodynamic properties and product distribution for pyrolysis of Ni-Fe impregnated coconut husk. Renew. Energy 2024, 222, 119972. [Google Scholar] [CrossRef]
- Gao, N.; Zhang, J.; Quan, C.; Wang, J. Research on the characteristics of pressured pyrolysis products of marine plastics. J. Anal. Appl. Pyrolysis 2024, 177, 106327. [Google Scholar] [CrossRef]
- Nan, W.; Ji, W.; Yuan, Y.; Yuan, Z.; Sun, Y. Pyrolysis Empirical Modeling of Polyester Glass Fiber Reinforced Plastics Using Sestak-Berggren Model Method. J. Therm. Sci. 2024, 33, 725–738. [Google Scholar] [CrossRef]
- Zhang, C.; Wu, L.; Kang, R.; Bin, F.; Dou, B. Precise in-situ infrared spectra and kinetic analysis of gasification under the H2O or CO2 atmospheres. Int. J. Hydrogen Energy 2024, 52, 46–57. [Google Scholar] [CrossRef]
- Li, B.; Zhang, W.; Jia, F.; Yang, T.; Bai, S.; Zhou, Q. Research on the Combustion Performance of Municipal Solid Waste in Different Sorting Scenarios: Thermokinetics Investigation via TG-DSC-FTIR-MS. ACS Omega 2023, 9, 1206–1215. [Google Scholar] [CrossRef]
- Ren, J.; Jiang, J.; Wang, J.; Yuan, X.; Wang, A. Variable frequency microwave induced CO2 Boudouard reaction over biochar. Biochar 2024, 6, 20. [Google Scholar] [CrossRef]
- Zhu, Y.; Huo, G.; Yang, W.; Liu, H.; Zhang, W.; Cheng, W.; Yang, H.; Wang, Z.; Jin, Y.; Zhao, H. Catalytic pyrolysis of duckweed with phosphoric acid: Pyrolysis behavior and kinetics analysis. J. Anal. Appl. Pyrolysis 2024, 177, 106384. [Google Scholar] [CrossRef]
- Huang, Q.; Gong, B.; Habibullah; Wang, Z.; Wang, Y.; Yan, Y.; Chen, Y.; Wu, C. Hydrogen generation behaviors from hydrolysis of cold-welding free magnesium-calcium hydride-expanded graphite composites. J. Power Sources 2024, 595, 234004. [Google Scholar] [CrossRef]
- Aldossari, H.M.; Salam, A.A. COVID-19 infections, recoveries, and mortality: An ANOVA model of locations and administrative areas in Saudi Arabia. Front. Public Health 2024, 12, 1281289. [Google Scholar] [CrossRef]
- JB/T 8583-2008; Resin coated sand for foundry. China Machine Press: Beijing, China, 2008.
- JB/T 3823-2013; Hot box resin for foundry. China Machine Press: Beijing, China, 2014.
- GB/T 30732-2014; Proximate analysis of coal—Instrumental method. Standards Press of China: Beijing, China, 2014.
- GB/T 15445.2-2006; Representation of results of particle size analysis—Part 2:Calculation of average particle size/diameters and moments from particle size distributions. Standards Press of China: Beijing, China, 2006.
- Tian, L.; Zhou, Y.; Xie, G.; Li, R.; Yu, X. Ecofriendly Cold Ramming Paste for an Aluminum Electrolysis Cell with Furan Resin As a Binder. Ind. Eng. Chem. Res. 2012, 51, 6018–6024. [Google Scholar] [CrossRef]
- Li, Y.; Zhou, J.; Yin, Y.; Wan, P.; Ji, X.; Shen, X.; Qian, X.; Peng, X.; Qi, Y. Present status and prospect of resin-bonded sand technology for casting in China. Foundry 2022, 71, 251–270. [Google Scholar]
- Murthy, I.N.; Rao, J.B. Investigations on Physical and Chemical Properties of High Silica Sand, Fe-Cr Slag and Blast Furnace Slag for Foundry Applications. Procedia Environ. Sci. 2016, 35, 583–596. [Google Scholar] [CrossRef]
- Coronado, M.; Andres, A.; Cheeseman, C.R. Acid gas emissions from structural clay products containing secondary resources: Foundry sand dust and Waelz slag. J. Clean. Prod. 2016, 115, 191–202. [Google Scholar] [CrossRef]
- Almusafir, R.; Smith, J.D. Thermal Decomposition and Kinetic Parameters of Three Biomass Feedstocks for the Performance of the Gasification Process Using a Thermogravimetric Analyzer. Energies 2024, 17, 396. [Google Scholar] [CrossRef]
- Gupta, J.; Konysheva, E.Y.; Papadikis, K. Functions of local structural surrounding in activity of Ca-containing catalysts for vapor upgrading during biomass thermal decomposition. Fuel Process. Technol. 2023, 252, 107973. [Google Scholar] [CrossRef]
- Li, Y.; Zhao, H.; Sui, X.; Wang, X.; Ji, H. Studies on individual pyrolysis and co-pyrolysis of peat-biomass blends: Thermal decomposition behavior, possible synergism, product characteristic evaluations and kinetics. Fuel 2022, 323, 124426. [Google Scholar] [CrossRef]
- Jiang, B.; Yao, Q.; Su, M.; Li, J.; Lu, K.; Ding, D.; Hong, H. Study on the suppression characteristics and mechanism of ABC powder on pulverized coal explosion based on the analysis of thermal decomposition characteristics and reaction kinetics. Process Saf. Environ. Prot. 2024, 181, 143–155. [Google Scholar] [CrossRef]
- Daniel, S.; Vnaraj, R.; Baskar, S.; Manivasagam, V.R.; Jerdy, A.C.; Armugam, S.; Kim, S.C. Citric Acid Recovery and Methanol Production from a Waste Food Fruit Sample by Thermal Decomposition of a Reusable Zinc Citrate Complex. ACS Sustain. Chem. Eng. 2022, 10, 15680–15691. [Google Scholar] [CrossRef]
- Chen, K.S.; Yeh, R.Z. Pyrolysis kinetics of epoxy resin in a nitrogen atmosphere. J. Hazard. Mater. 1996, 49, 105–113. [Google Scholar] [CrossRef]
- Mu, L.; Chen, J.; Yin, H.; Song, X.; Li, A.; Chi, X. Pyrolysis behaviors and kinetics of refining and chemicals wastewater, lignite and their blends through TGA. Bioresour. Technol. 2015, 180, 22–31. [Google Scholar] [CrossRef] [PubMed]
- Wu, C.; You, J.; Wang, X. Thermal decomposition mechanism and kinetics of gemcitabine. J. Anal. Appl. Pyrolysis 2018, 130, 118–126. [Google Scholar] [CrossRef]
- Yang, M.; Chen, X.; Wang, Y.; Yuan, B.; Niu, Y.; Zhang, Y.; Liao, R.; Zhang, Z. Comparative evaluation of thermal decomposition behavior and thermal stability of powdered ammonium nitrate under different atmosphere conditions. J. Hazard. Mater. 2017, 337, 10–19. [Google Scholar] [CrossRef] [PubMed]
- Chen, J.; Xie, C.; Liu, J.; He, Y.; Xie, W.; Zhang, X.; Chang, K.; Kuo, J.; Sun, J.; Zheng, L.; et al. Co-combustion of sewage sludge and coffee grounds under increased O2/CO2 atmospheres: Thermodynamic characteristics, kinetics and artificial neural network modeling. Bioresour. Technol. 2018, 250, 230–238. [Google Scholar] [CrossRef]
- Jiang, L.; Yuan, X.; Li, H.; Xiao, Z.; Liang, J.; Wang, H.; Wu, Z.; Chen, X.; Zeng, G. Pyrolysis and combustion kinetics of sludge-camphor pellet thermal decomposition using thermogravimetric analysis. Energy Convers. Manag. 2015, 106, 282–289. [Google Scholar] [CrossRef]
Figure 1.
Particle size distribution of the raw sand.

Figure 2.
Thermal decomposition curves of the resin sand.

Figure 3.
Pyrolysis of resin sand in nitrogen and air atmospheres.

Figure 4.
Thermal decomposition of the resin sand at heating rates of 20 °C/min, 30 °C/min, and 40 °C/min.
Figure 4.
Thermal decomposition of the resin sand at heating rates of 20 °C/min, 30 °C/min, and 40 °C/min.


Table 1.
Proportion of resin sand.
| Resin Sand | Adhesive | Curing Agent | ||
|---|---|---|---|---|
| Type | Content | Type | Content | |
| PCS | Phenolic resin | 2.5% (percentage of raw sand) | Hexamethylene tetramine | 15% (percentage of phenolic resin) |
| HBS | Furan resin | 2% (percentage of raw sand) | Ammonium chloride | 30% (percentage of furan resin) |
| WBS | Furan resin | 3% (percentage of raw sand) | Copper chloride | 30% (percentage of furan resin) |
Table 2.
Chemical composition of the raw sand.
| Chemical Composition | Content (%) | Chemical Composition | Content (%) | Chemical Composition | Content (%) |
|---|---|---|---|---|---|
| SiO2 | 96.174 | SO3 | 0.196 | CuO | 0.018 |
| Al2O3 | 2.739 | Fe2O3 | 0.127 | Cr2O3 | 0.014 |
| K2O | 0.654 | Ag2O | 0.052 | SrO | 0.011 |
Table 3.
Results of the raw sand particle diameter.
| Specific Surface Area | D [3,2] | D [4,3] | Dv (10) | Dv (50) | Dv (90) |
|---|---|---|---|---|---|
| 24.30 m2/kg | 247 μm | 291 μm | 171 μm | 278 μm | 436 μm |
Table 4.
Volatile release characteristics of the resin sand.
| Resin Sand | Atmosphere | β (°C/min) | Tstv (%/min) | mloss (%) | Ts (°C) | Tmax (°C) | (dw/dτ)max (%/min) | (dw/dτ)mean (%/min) | Δ1/2 (°C) | D (%2/min2/°C3) |
|---|---|---|---|---|---|---|---|---|---|---|
| PCS | Nitrogen | 20 | 9.47 × 10⁻² | 3.31 | 453 | 607 | 34.18 × 10⁻² | 5.63 × 10⁻² | 241 | 2.90 × 10⁻¹⁰ |
| Nitrogen | 30 | 12.73 × 10⁻² | 4.45 | 430 | 605 | 45.58 × 10⁻² | 11.36 × 10⁻² | 280 | 7.11 × 10⁻¹⁰ | |
| Nitrogen | 40 | 14.39 × 10⁻² | 5.03 | 459 | 597 | 47.56 × 10⁻² | 17.12 × 10⁻² | 224 | 1.33 × 10⁻⁹ | |
| Air | 20 | 13.53 × 10⁻² | 4.73 | 452 | 596 | 73.76 × 10⁻² | 8.05 × 10⁻² | 233 | 9.46 × 10⁻¹⁰ | |
| Air | 30 | 15.59 × 10⁻² | 5.45 | 465 | 630 | 57.08 × 10⁻² | 13.91 × 10⁻² | 265 | 1.02 × 10⁻⁹ | |
| Air | 40 | 19.88 × 10⁻² | 6.95 | 492 | 591 | 63.06 × 10⁻² | 23.66 × 10⁻² | 181 | 2.83 × 10⁻⁹ | |
| HBS | Nitrogen | 20 | 4.46 × 10⁻² | 1.56 | 120 | 270 | 18.94 × 10⁻² | 2.66 × 10⁻² | 449 | 3.46 × 10⁻¹⁰ |
| Nitrogen | 30 | 5.89 × 10⁻² | 2.06 | 314 | 358 | 7.82 × 10⁻² | 5.26 × 10⁻² | 88 | 4.16 × 10⁻¹⁰ | |
| Nitrogen | 40 | 6.12 × 10⁻² | 2.14 | 100 | 484 | 17.3 × 10⁻² | 7.28 × 10⁻² | 446 | 5.83 × 10⁻¹⁰ | |
| Air | 20 | 4.58 × 10⁻² | 1.6 | 190 | 260 | 31.75 × 10⁻² | 2.72 × 10⁻² | 280 | 6.24 × 10⁻¹⁰ | |
| Air | 30 | 7.04 × 10⁻² | 2.46 | 125 | 290 | 19.25 × 10⁻² | 6.28 × 10⁻² | 435 | 7.67 × 10⁻¹⁰ | |
| Air | 40 | 7.55 × 10⁻² | 2.64 | 210 | 278 | 11.39 × 10⁻² | 8.99 × 10⁻² | 152 | 1.15 × 10⁻⁹ | |
| WBS | Nitrogen | 20 | 4.15 × 10⁻² | 1.45 | 236 | 501 | 11.72 × 10⁻² | 2.47 × 10⁻² | 303 | 8.08 × 10⁻¹¹ |
| Nitrogen | 30 | 5.18 × 10⁻² | 1.81 | 440 | 499 | 18.68 × 10⁻² | 4.62 × 10⁻² | 122 | 3.22 × 10⁻¹⁰ | |
| Nitrogen | 40 | 6.89 × 10⁻² | 2.41 | 344 | 509 | 17.12 × 10⁻² | 6.15 × 10⁻² | 219 | 3.66 × 10⁻¹⁰ | |
| Air | 20 | 4.66 × 10⁻² | 1.63 | 405 | 491 | 13.4 × 10⁻² | 2.77 × 10⁻² | 141 | 1.32 × 10⁻¹⁰ | |
| Air | 30 | 6.84 × 10⁻² | 2.39 | 255 | 470 | 20.65 × 10⁻² | 8.13 × 10⁻² | 325 | 3.23 × 10⁻¹⁰ | |
| Air | 40 | 7.52 × 10⁻² | 2.63 | 200 | 515 | 21.65 × 10⁻² | 8.95 × 10⁻² | 385 | 4.89 × 10⁻¹⁰ |
Table 5.
Kinetics parameters of the resin sand.
| Resin Sand | Atmosphere | β (°C/min) | Equation | E (KJ/mol) | A (min−1) | Pearson’s R |
|---|---|---|---|---|---|---|
| PCS | Nitrogen | 20 | y = 9.20973x + 3.34242 | 76.57 | 6.4364 | 0.99951 |
| Nitrogen | 30 | y = 8.56259x + 4.43528 | 71.19 | 3.0097 | 0.99886 | |
| Nitrogen | 40 | y = 8.14836x + 4.55662 | 67.75 | 3.3826 | 0.99627 | |
| Air | 20 | y = 6.90464x + 6.0716 | 57.41 | 0.3151 | 0.99848 | |
| Air | 30 | y = 8.52829x + 4.34177 | 70.9 | 3.2912 | 0.98984 | |
| Air | 40 | y = 11.96321x + 0.25952 | 99.46 | 364.7619 | 0.99414 | |
| HBS | Nitrogen | 20 | y = 6.46881x + 3.47767 | 53.78 | 3.9489 | 0.9276 |
| Nitrogen | 30 | y = 4.10173x + 8.0692 | 34.10 | 0.0381 | 0.98829 | |
| Nitrogen | 40 | y = 3.73828x + 8.49313 | 31.08 | 0.0303 | 0.99539 | |
| Air | 20 | y = 4.65897x + 5.71185 | 38.73 | 0.3046 | 0.85406 | |
| Air | 30 | y = 7.11362x + 2.55222 | 59.14 | 16.4324 | 0.94223 | |
| Air | 40 | y = 2.36259x + 10.39441 | 19.64 | 0.0029 | 0.98806 | |
| WBS | Nitrogen | 20 | y = 7.02694x + 4.53135 | 58.42 | 1.4957 | 0.99852 |
| Nitrogen | 30 | y = 6.04784x + 6.07901 | 50.28 | 0.4109 | 0.98954 | |
| Nitrogen | 40 | y = 3.16716x + 9.52065 | 26.33 | 0.0092 | 0.98868 | |
| Air | 20 | y = 4.79026x + 6.95508 | 39.83 | 0.0904 | 0.95085 | |
| Air | 30 | y = 4.88472x + 7.31655 | 40.61 | 0.0963 | 0.99825 | |
| Air | 40 | y = 3.86463x + 9.02241 | 32.13 | 0.0184 | 0.99221 |
Table 6.
Results of one-way ANOVA.
| Resin Sand | Atmosphere | Heating Rate (°C/min) | Source of Variation | Degrees of Freedom | Sum of Squares | Mean Square | F | p |
|---|---|---|---|---|---|---|---|---|
| PCS | Nitrogen | 20 | Model error | 1 | 59.18393 | 59.18393 | 167,906.48309 | 0 |
| Random error | 164 | 0.05781 | 3.52 × 10⁻⁴ | |||||
| Total | 165 | 59.24174 | ||||||
| 30 | Model error | 1 | 6.62679 | 6.62679 | 1341.49912 | 0 | ||
| Random error | 30 | 0.1482 | 0.00494 | |||||
| Total | 31 | 6.77498 | ||||||
| 40 | Model error | 1 | 29.29323 | 29.29323 | 18,543.40404 | 0 | ||
| Random error | 139 | 0.21958 | 0.00158 | |||||
| Total | 140 | 29.51281 | ||||||
| Air | 20 | Model error | 1 | 11.31318 | 11.31318 | 34,399.36928 | 0 | |
| Random error | 105 | 0.03453 | 3.29 × 10⁻⁴ | |||||
| Total | 106 | 11.34771 | ||||||
| 30 | Model error | 1 | 3.98285 | 3.98285 | 1163.29093 | 0 | ||
| Random error | 24 | 0.08217 | 0.00342 | |||||
| Total | 25 | 4.06502 | ||||||
| 40 | Model error | 1 | 79.84294 | 79.84294 | 12,942.34202 | 0 | ||
| Random error | 153 | 0.94388 | 0.00617 | |||||
| Total | 154 | 80.78682 | ||||||
| HBS | Nitrogen | 20 | Model error | 1 | 35.34264 | 35.34264 | 684.38759 | 0 |
| Random error | 111 | 5.73218 | 0.05164 | |||||
| Total | 112 | 41.07482 | ||||||
| 30 | Model error | 1 | 5.0071 | 5.0071 | 3524.06109 | 0 | ||
| Random error | 84 | 0.11935 | 0.00142 | |||||
| Total | 85 | 5.12645 | ||||||
| 40 | Model error | 1 | 4.80542 | 4.80542 | 11,094.87771 | 0 | ||
| Random error | 103 | 0.04461 | 4.33 × 10⁻⁴ | |||||
| Total | 104 | 4.85003 | ||||||
| Air | 20 | Model error | 1 | 2.70073 | 2.70073 | 45.82843 | 3.27 × 10⁻⁶ | |
| Random error | 17 | 1.00183 | 0.05893 | |||||
| Total | 18 | 3.70256 | ||||||
| 30 | Model error | 1 | 5.25536 | 5.25536 | 126.59337 | 5.20 × 10⁻⁹ | ||
| Random error | 16 | 0.66422 | 0.04151 | |||||
| Total | 17 | 5.91958 | ||||||
| 40 | Model error | 1 | 3.82119 | 3.82119 | 5346.67629 | 0 | ||
| Random error | 130 | 0.09291 | 7.15 × 10⁻⁴ | |||||
| Total | 131 | 3.9141 | ||||||
| WBS | Nitrogen | 20 | Model error | 1 | 35.31583 | 35.31583 | 45,584.93196 | 0 |
| Random error | 135 | 0.10459 | 7.75 × 10⁻⁴ | |||||
| Total | 136 | 35.42042 | ||||||
| 30 | Model error | 1 | 30.9454 | 30.9454 | 7056.08741 | 0 | ||
| Random error | 150 | 0.65784 | 0.00439 | |||||
| Total | 151 | 31.60325 | ||||||
| 40 | Model error | 1 | 7.37748 | 7.37748 | 6121.59332 | 0 | ||
| Random error | 141 | 0.16993 | 0.00121 | |||||
| Total | 142 | 7.5474 | ||||||
| Air | 20 | Model error | 1 | 35.82054 | 35.82054 | 1659.41313 | 0 | |
| Random error | 176 | 3.79918 | 0.02159 | |||||
| Total | 177 | 39.61973 | ||||||
| 30 | Model error | 1 | 7.95686 | 7.95686 | 9420.3247 | 0 | ||
| Random error | 33 | 0.02787 | 8.45 × 10⁻⁴ | |||||
| Total | 34 | 7.98473 | ||||||
| 40 | Model error | 1 | 3.26363 | 3.26363 | 1967.6818 | 0 | ||
| Random error | 31 | 0.05142 | 0.00166 | |||||
| Total | 32 | 3.31505 |
Disclaimer/Publisher’s Note: The statements, opinions and data contained in all publications are solely those of the individual author(s) and contributor(s) and not of MDPI and/or the editor(s). MDPI and/or the editor(s) disclaim responsibility for any injury to people or property resulting from any ideas, methods, instructions or products referred to in the content. |
© 2024 by the authors. Licensee MDPI, Basel, Switzerland. This article is an open access article distributed under the terms and conditions of the Creative Commons Attribution (CC BY) license (https://creativecommons.org/licenses/by/4.0/).
Share and Cite
MDPI and ACS Style
Xu, Q.; Zhu, Y.; Xu, K.; Li, B.; Su, N. Influences of the Decomposition Atmosphere and Heating Rate on the Pyrolysis Behaviors of Resin Sand. Buildings 2024, 14, 1234. https://0-doi-org.brum.beds.ac.uk/10.3390/buildings14051234
AMA Style
Xu Q, Zhu Y, Xu K, Li B, Su N. Influences of the Decomposition Atmosphere and Heating Rate on the Pyrolysis Behaviors of Resin Sand. Buildings. 2024; 14(5):1234. https://0-doi-org.brum.beds.ac.uk/10.3390/buildings14051234
Chicago/Turabian StyleXu, Qingwei, Yaping Zhu, Kaili Xu, Bingjun Li, and Nan Su. 2024. "Influences of the Decomposition Atmosphere and Heating Rate on the Pyrolysis Behaviors of Resin Sand" Buildings 14, no. 5: 1234. https://0-doi-org.brum.beds.ac.uk/10.3390/buildings14051234
Note that from the first issue of 2016, this journal uses article numbers instead of page numbers. See further details here.