
Complete Mitochondrial Genome of Four Peristediidae Fish Species: Genome Characterization and Phylogenetic Analysis

1
Fisheries College, Zhejiang Ocean University, Zhoushan 316022, China
2
Fisheries College, Jimei University, Xiamen 361021, China
3
School of Ecology and Environment, Hainan University, Haikou 570228, China
*
Author to whom correspondence should be addressed.
Genes 2024, 15(5), 557; https://0-doi-org.brum.beds.ac.uk/10.3390/genes15050557
Submission received: 23 March 2024
/
Revised: 23 April 2024
/
Accepted: 23 April 2024
/
Published: 27 April 2024
(This article belongs to the Special Issue DNA Taxonomy, Molecular Phylogeny and Population Genetics of Cartilaginous Fishes and Teleost Fishes)
Abstract
:The systematic revision of the family Peristediidae remains an unresolved issue due to their diverse and unique morphology. Despite the popularity of using mitochondrial genome research to comprehensively understand phylogenetic relationships in fish, genetic data for peristediid fish need to be included. Therefore, this study aims to investigate the mitochondrial genomic characteristics and intra-family phylogenetic relationships of Peristediidae by utilizing mitochondrial genome analysis. Therefore, this study aims to investigate the phylogenetic relationship of Peristediidae by utilizing mitochondrial genome analysis. The mitochondrial genome of four species of Peristediidae (Peristedion liorhynchus, Satyrichthys welchi, Satyrichthys rieffeli, and Scalicus amiscus) collected in the East China Sea was studied. The mitochondrial gene sequence lengths of four fish species were 16,533 bp, 16,526 bp, 16,527 bp, and 16,526 bp, respectively. They had the same mitochondrial structure and were all composed of 37 genes and one control region. Most PCGs used ATG as the start codon, and a few used GTG as the start codon. An incomplete stop codon (TA/T) occurred. The AT-skew and GC-skew values of 13 PCGs from four species were negative, and the GC-skew amplitude was greater than that of AT-skew. All cases of D-arm were found in tRNA-Ser (GCT). The Ka/Ks ratio analysis indicated that 13 PCGs were suffering purifying selection. Based on 12 PCGs (excluding ND6) sequences, a phylogenetic tree was constructed using Bayesian inference (BI) and maximum likelihood (ML) methods, providing a further supplement to the scientific classification of Peristediidae fish. According to the results of divergence time, the four species of fish had apparent divergence in the Early Cenozoic, which indicates that the geological events at that time caused the climax of species divergence and evolution.
1. Introduction
Family Peristediidae belongs to Scorpaeniformes and includes six valid genera: Gargariscus Smith (1917) (with a single nominal species); Heminodus Smith (1917) (with a single species); Paraheminodus Kamohara (1957) (with four valid species); Peristedion Lacepède (1801) (with 24 valid species; Satyrichthys Kaup (1873) (with 7 valid species); and Scalicus Jordan (1923) (with 8 valid species). Peristediidae are commonly known as armored searobins or armored gurnards. The peristediid fish are small to medium-sized benthic species, which have a wide roosting depth [1]. Peristedidea are covered with hard bone plates throughout the body, and each bone plate has spines on the body. They have various rostral projections, which is an important morphological feature that distinguishes them. Their rostral projection has four sensory pores, which can help them detect submerged prey in the sand, and the peristediid fish have two detached pectoral fins between the pectoral fin and pelvic fin. The detached pectoral fins can also help them find submerged prey in the sand [2]. In studies of peristediid systematics, the focus has been on morphological identification, and distinguishing characteristics have not always been clear within certain species [3]. Due to the strict fishing conditions and wide distribution range of Peristedidea, the incomplete species identification of Peristedidea and the inconsistent morphological results of some of them are also directions that need to be further studied. Therefore, revised systematics studies have been lacking in recent times.
The utilization of mitochondrial genomes (mtDNA) is a widely accepted method for comprehensively elucidating phylogenetic relationships within the fish group due to their characteristics such as small size, simple genomic structure, fast rate of evolution, and maternal inheritance with a low level of recombination [4]. The genome of mtDNA within general fish is similar to vertebrates within a circular molecule of 15~18 kb, which includes 13 protein-coding genes (PCGs), 2 ribosomal RNA (rRNA) genes, 22 transfer RNA (tRNA) genes, and a control region (CR) [5,6]. The control region includes a D-loop area and a light chain replication start area (OL). Whole-mtDNA genomes have been proven to be a valuable tool for understanding phylogenetic and molecular evolutionary studies across various taxonomic levels on a large scale [7,8,9]. In previous studies, the focus of fish species identification and systematics construction was primarily on individual genes within mtDNA, such as the ribosomal RNA (12S and 16S) and cytochrome c oxidase I (COI) [6,10,11], with only a few studies provided based on the mitochondrial genome [12]. Therefore, the enrichment of fish mitochondrial gene studies is of utmost importance. However, its application to members of the Peristeididae family is limited by the availability of data in existing databases. To date, it is unclear if these species’ mtDNA or genes were already annotated, and only the S. amiscus mitochondrial genome has been uploaded to the MitoFish GenBank in Peristediidae [13].
At present, there are few studies on the mitochondrial genome of Peristediidae, and there is no molecular phylogenetic relationship between Peristediidae in order to further explore the mitochondrial genome characteristics and phylogenetic relationships of Peristediidae. The complete mitochondrial genomes of four Peristediidae species (P. liorhynchus, S. welchi, S. rieffeli, and S. amiscus) were sequenced in this study. Subsequently, a comprehensive description and comparative analysis of the characteristics of the mtDNA genome were performed. Furthermore, an examination of the relative synonymous codon usage (RSCU) and AT skew value of PCGs was conducted to gain insights into the functional implications of associated genes. The phylogenetic relationships and divided time of peristediid fishes were ultimately calculated. The phylogenetic relationship conclusions of this study can be used to verify the accuracy of morphological classification results, and the mitochondrial genome results provide a molecular basis for subsequent further studies.
2. Materials and Methods
2.1. Sample Collection and Species Identification
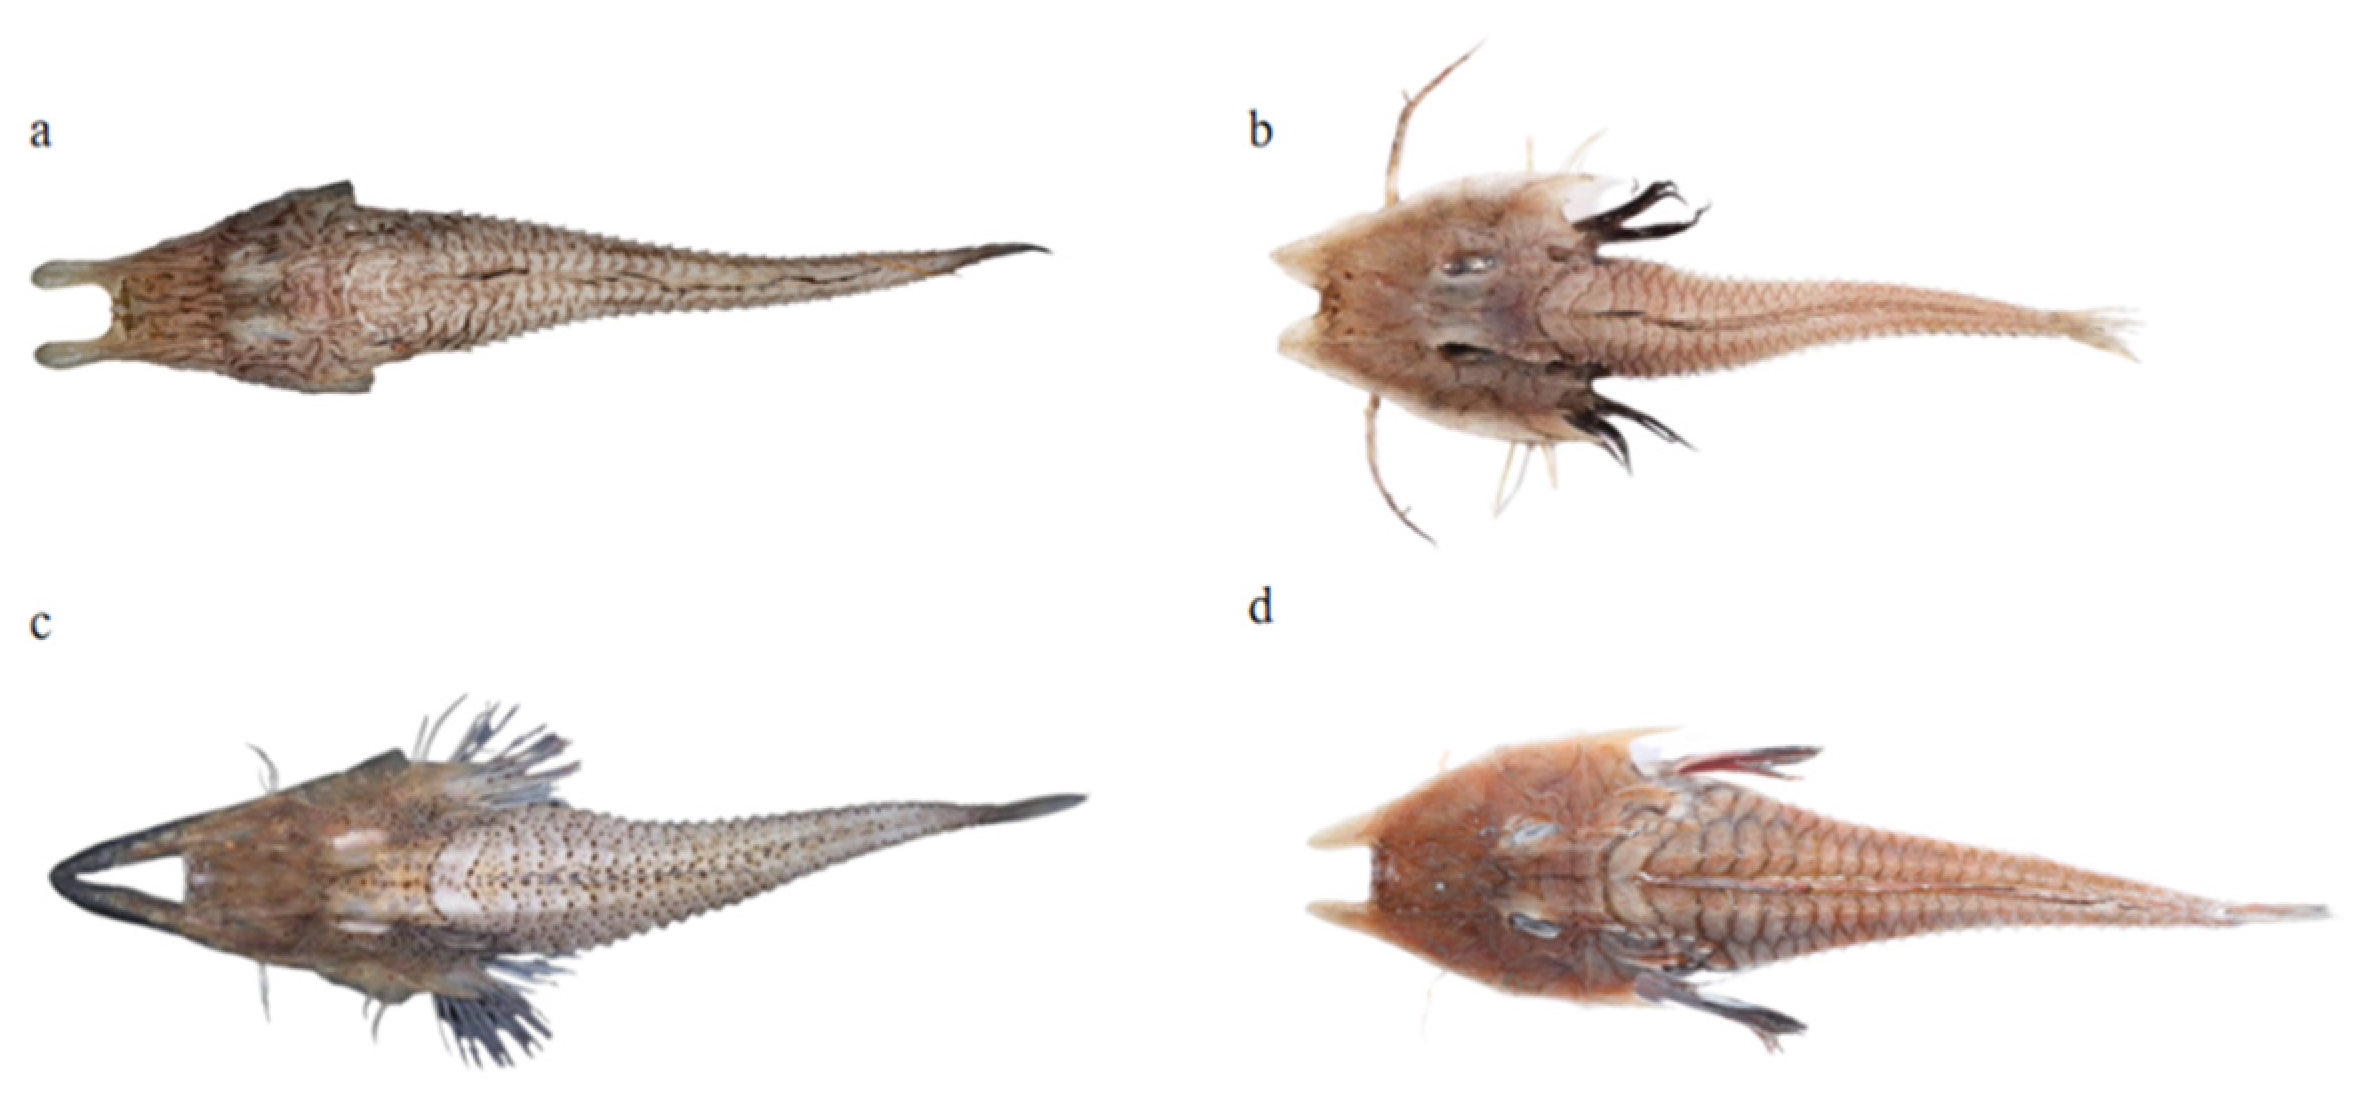
More than 100 samples were collected in the East China Sea (127°–129° E, 28°–30° N) in December 2021. According to Kawai’s research, frozen samples were observed for their physical appearance and identified [2]. Four species (one sample per species) have been identified and confirmed through the process of identification (Figure 1). A small portion of the dorsal muscle was collected from each individual sample for DNA extraction. They were saved in liquid nitrogen and sent to the Wuhan Wanmo Technology Company for genome survey sequencing. All of the organisms (including experimental samples) were deposited in the Fisheries Ecology and Biodiversity Laboratory of Zhejiang Ocean University. Laboratory storage includes both specimen and DNA samples.
The DNA of the samples was tested for quality using 1% agarose electrophoresis for degradation and impurities, followed by the NanoPhotometer® spectrophotometer (IMPLEN, CA, USA) for sample purity, and the Qubit® 3.0 Flurometer (Life Technologies, Carlsbad, CA, USA) for DNA concentration. Qualified samples were processed into the library preparation process, including DNA fragmentation, end repair and addition of dA tails, adapter ligation, PCR amplification, PCR product detection, denaturation, and cyclization product testing. The constructed libraries were sequenced by PE using Illumina Nova. Finally, sequencing was performed, including DNB fabrication, DNB loading, and MGI platform sequencing. All data were sequenced by OneMore Technology (Wuhan, China).
2.2. Sequence Assembly, Annotation, and Analysis
Mitochondrial genome sequences were extracted from raw genome sequencing data using NOVOPlasty 2.6.3 software [14]. The parameters were set by default. The reference sequence was the single gene sequence corresponding to each species in GenBank. The obtained data was annotated and visualized using MitoFish to obtain a complete mitochondrial genome [15]. Using MEGA 11 to calculate genomic base composition, amino acid usage frequency, and relative usage frequency of synonymous codons [16].
2.3. Phylogenetic Analyses and Divergence Times Analyses
The mitochondrial genomes of 10 Scorpaeniformes species were downloaded from GenBank (MT855984.1, MN122888.1, KY379222.1, KY012348.1, MZ442599.1, LC493914.1, MT801083.1, MK784116.1, MN104592.1). Phylogenetic analysis based on 12 protein-coding genes (excluding ND6). The ND6 gene was not used in this analysis because of a significant anti-G shift. Dactylopterus volitans (GenBank accession number: LC512458.1) was used as an outgroup to determine the classification relationship of Peristediidae. The Bayesian inference (BI) and maximum likelihood (ML) methods were used and the optimal model for nucleotide sequences was estimated using jModelTest v2.1.10 [17]. The model GTR + G + I captured the minimum values of the Bayesian Information Criterion (BIC, estimation 67) and was considered to be the best model for phylogenetic tree construction [18]. The ML tree was constructed using MEGA 11 software with 1000 replicates of bootstrapping and the BI analysis was inferred by the software of MrBayes v3.2.7a [19]. The divergence time was estimated using MEGA 11.0 with the RelTime-ML method and GTR + G + I modeling [20]. The calibration of divergence times was obtained from the online Time Tree database [21].
All the above analysis methods used default parameters for calculation, except for the specific parameters mentioned.
3. Results
3.1. Genome Structure and Nucleotide Composition
The mitochondrial sequences obtained in this study were as follows: P. liorhynchus, S. welchi, S. rieffeli, and S. amiscus had lengths of 16,533 bp, 16,526 bp, 16,527 bp, and 16,526 bp, respectively. All of the mitogenome was composed of 37 genes and one control region, including 13 PCGs (ATP6, ATP8, Cytb, COXI-III, ND1-6, and ND4L), two rRNA genes (12S rRNA and 16S rRNA), 22 tRNA genes, and one D-loop region (Tables S1–S4 and Figure 2). ND6 and 8 tRNA genes (Gln, Ala, Asn, Cys, Tyr, Ser, Glu, and Pro) were encoded on the light strand (L-strand), and the others were encoded on the heavy strand (H-strand). The D-loop regions were encoded between the tRNA-Pro and tRNA-Phe genes. The gene structure and arrangement of these species exhibited no instances of gene rearrangement. P. liorhynchus found 6 overlapping regions and 10 intergenic spacer regions, totaling 24 and 65 bp, respectively. S. welchi found 6 overlapping regions and 10 intergenic spacer regions, totaling 24 and 67 bp, respectively. S. rieffeli found 4 overlapping regions and 11 intergenic spacer regions, totaling 8 and 99 bp, respectively. S. amiscus found 7 overlapping regions and 10 intergenic spacers regions, a total of 25 and 65 bp, respectively. The overall base composition was 26.7–27.4% for A, 28.6–30% for C, 16.7–17.2% for G, and 26–27.3% for T (Table S5). Four species had low levels of G and had a clear bias towards G. Additionally, the third codon position exhibited a high preference for A and C in terms of codon usage, as evidenced by the elevated content levels observed in both nucleotides A and C. The A + T content of the whole mitogenome ranged from 52.8% to 54.4%. All regions of the whole mitogenome exhibited a higher A + T content compared to the G + C content.
3.2. Protein-Coding Genes (PCGs)
The lengths of 13 PCGs in P. liorhynchus, S. welchi, S. rieffeli, and S. amiscus were 10,578 bp, 10,577 bp, 10,541 bp, and 10,577 bp, respectively. The H-strand of the mitochondrial genome encoded 12 PCGs in each species, while only the ND6 gene was expressed on the L-strand. Among them, there were 12 PCGs of 3 species (S. welchi, S. rieffeli, and S. amiscus) initiated with ATG as the start codon, while COI initiated with GTG as the start codon like other bony fish. For the remaining species, 11 PCGs started with ATG as the start codon, while COI and ATPase 6 genes initiated with GTG. Four complete termination codons (TAA or TAG) were identified in each species, while incomplete termination codons (TA or T) were also detected. TA was detected in ND2, ATPase 6 and COIII in 5 species (S. welchi, S. rieffeli, S. amiscus, Paraheminodus laticephalus, and Paraheminodus murrayi). In addition to these genes, TA was also detected in ND4 in one species (P. liorhynchus). T was detected in COII, ND3, ND4, and Cyt b in three species, while the remaining ones were detected in COII, ND3, and Cyt b.
Most of the AT-skew and GC-skew values for the four species were negative (Figure 3). The abundance of base T and C exceeded that of A and G, while the scarcity of base T and C was more pronounced compared to A and G. Overall, the magnitude of GC-skew was consistently greater than AT-skew. The maximum difference in the ND6 gene was observed in all four species.
3.3. RNA Genes
In the mitogenomes of the four species, a total of 22 tRNA genes were identified. Among them, tRNA-Leu (TAA, TAG) and tRAN-Ser (GCT, TGA) possessed two types of anticodons, while others had only one type. Eight tRNA genes were located on the L-stand and fourteen on the H-stand. The structure of tRNA-Ser (GCT) was characterized by a simple loop lacking a dihydrouridine arm (D-arm), whereas all other tRNAs exhibited canonical cloverleaf secondary structure (Figure S1). The base composition for these genes was as follows: 26.3–26.8% for T, 21.4–22.0% for C, 27.6–28.0% for A, and 23.8–24.2% for G.
The H-strand exhibited the presence of 12S rRNA and 16S rRNA. Especially, the 12S rRNA gene was positioned between tRNA-Phe and tRNA-Val, while the 16S rRNA gene resided between tRNA-Val and tRNA-Leu. The length range of the 12S rRNA gene was determined to be between 945 bp and 946 bp, while that of the 16S rRNA gene was found to be between 1695 bp and 1699 bp.
3.4. Usage of Mitogenome Codon
The amino acid tRNA-Leu exhibited the highest codon usage value, being utilized by six distinct codons. Conversely, the frequencies of tRNA-Asp and tRNA-Cys were relatively low, with each employed by only two different codons (Figure 4). The RSCU value of all amino acids in the four species was not uniformly equal to 1, indicating varying degrees of bias in the utilization of each amino acid (Figure 5).
3.5. Ka/Ks
In this study, the value of Ka/Ks greatly deviated (Figure 6). Positive selection mainly occurred between different species in the ND4L and ATP8 genes. Among them, the values of the ND3 gene were significantly greater than 1 in S. rieffeli and S. amiscus, and the values of the COI gene were significantly greater than 1 in S. amiscus and S. welchi. The ND1, ND4, ND5, COII, COIII, and Cyt-b genes were only selected for purification and at small values.
3.6. Phylogenetic and Divergence Times
Fourteen species, belonging to three families (Peristediidae, Triglidae, and Dactylopteridae), were included in the analysis of topology and divergence times. D. volitans was selected as the outgroup (Figure 7). The cladograms generated by both BI and ML methods exhibited consistent results, providing clear evidence for the distinct separation of these two families. Both families, Peristediidae and Triglidae, were sister lines. Within the family Peristediidae, the genus Peristedion was distinguished as the first sub-clade, followed by the separation of the genus Satyrichthys from other genera.
The divergence time calculations showed that the earliest divergence between Triglidae and Peristediidae occurred 43.85 million years ago (Mya) (Figure 8). In the family Peristediidae, P. liorhynchus was the earliest to differentiate from the other Peristediidae (26.19 Mya). According to the estimated divergence time, these two families, Peristediidae and Triglidae, underwent speciation during the Cenozoic era. Both families belong to the suborder Triglioidei, which first appeared in the Late Cretaceous–Early Paleogene period.
4. Discussion
The mitochondrial genomes of four Peristediidae species were all composed of 37 genes and one control region. The gene structure and arrangement of these species were identical to those of other vertebrate mitogenomes, and none of them exhibit genetic rearrangements. The gene rearrangement is always detected in fungi and insects [22,23,24,25]. The conservation of the mitochondrial genome is widely acknowledged, making gene rearrangement a highly studied feature in organism mtDNAs for organismal systematics [26,27]. The rearrangements of mitochondrial genes can generally be associated with genomic variation, aspects of physiology, molecular mechanism, life history, or genomic evolutionary processes [3,28,29]. The evidence suggests that the mtDNAs of Peristediidae fish may exhibit a higher degree of conservation compared to other members within the class Actinopterygii. Therefore, an understanding of the arrangement and combination of these nucleotides among species, as well as the statistical results, is of great significance for further exploration of the splitting of species. ND6 and 8 tRNA genes (Gln, Ala, Asn, Cys, Tyr, Ser, Glu, and Pro) were encoded on the light strand (L-strand), and the others were encoded on the heavy strand (H-strand). The D-loop region was encoded between the tRNA-Pro and tRNA-Phe genes. The base content of all six species appeared to have a significant anti g bias. It was related to the hydrophobic character of proteins [30].
For the initiation codon in the COI gene, all four species utilized GTG, which is consistent with findings from previous studies on other bony fish [31]. Besides, S. amiscus used GTG as the initiation codon in the ATP 6 gene. Six complete termination codons (TAA or TAG) for each species were detected. Moreover, incomplete termination codons (TA or T) were discovered. The presence of incomplete stop codons is common in fish mitochondrial genomes. In fish genetics, this can be achieved by adding poly A tails during RNA processing [32]. The phenomenon of incomplete termination codons was discovered in this study, which is significant for further investigation.
The AT-skew and GC-skew have been regarded as potential indicators for quantifying strand asymmetry and nucleotide composition patterns. The majority of genes in this study exhibited a higher magnitude of GC-skew compared to AT-skew, aligning with conventional preferences that favor a more pronounced GC-skew [33]. However, the ND6 gene was observed to have the highest difference between the GC-skew values and AT-skew values, which was consistent with the significant differences in the AT-skew and GC-skew values of Cheilinus undulatus in the DN6 gene [34]. The ND6 gene had a larger fluctuation in AT/GC-skew value, suggesting that the selection and mutational pressure on it might be significantly different from other genes [33].
The secondary structure of all 21 tRNAs in the four species exhibited a canonical cloverleaf pattern, and the tRNA-Ser (GCT) displayed a simplified loop without the dihydrouridine arm (D-arm). This characteristic is commonly observed in the mitogenomes of many bony fish [35]. For bony fish, the missing D-arm could be transformed into the recognition potential to be recognized [33]. The 12s rRNA and 16s rRNA were divided by tRNA-Val and located between tRNA-Phe and tRNA-Leu on the H-strand. Miya exhibited the same structure in that study of the mitochondrial genome of round and pointed-head grenadier fishes [36]. The same structure occurs in Sebastiscus marmoratus [37].
The RSCU method was also employed for the evaluation of codon usage in mitochondrial genes. Distinct RSCU values indicated diverse scenarios of codon usage [38]. The RSCU values of four species were found to be unequal to 1, indicating that the utilization of each amino acid exhibited varying degrees of bias. Among the codon usage of the four species, NNT and NNC were more used, and Leu > Pro > Ser > Thr. The codon use bias is related to the strength of gene expression, and the codons used by the genes with high efficiency expression have significantly different gene use frequencies compared with the genes with low expression. The genes with efficient expression have more bias in the use of codons than the non-efficient genes, and they usually use a set of preferential synonymous codons [39]. The result suggested that the gene function might be similar within the family Peristediidae. The main factors influencing codon bias include mutation pressure, genetic drift, and natural selection [40].
The value of non-synonymous substitution (Ka)/synonymous substitution (Ks) is a common indicator for assessing the relationship between species selection pressure and evolution in molecular studies. Ka/Ks < 1, Ka/Ks = 1, and Ka/Ks > 1 represent purified selection, neutral mutation, and positive selection, respectively. The ratio of Ka/Ks is generally considered an indicator of selective pressure and evolutionary relationships at the molecular level among homogenous or heterogeneous species [41]. In this study, the genes that were obviously in positive selection (ND4L and ATP8) also showed Ka/Ks values greater than 1 (COI and ND3), and the Ka/Ks values of the remaining genes were less than 1, but much larger than those of fish genes that were normally in purification selection [42]. The higher positive selection for the ND4L and ATP8 genes may be due to the fact that their gene sequences are shorter, which makes them more susceptible to genetic mutations and drift. The Ka/Ks value is greater than 1, and one of the reasons for this result is that gene mutations and drift caused by the environment lead to genome evolution [43]. Peristediidae fish live in a deep water depth of about 40–1000 m at the bottom of the demersal fish. Demersal fish live in conditions such as lack of oxygen, lack of food, lack of sunlight, and extreme cold. Such an environment is the cause of Ka/Ks > 1 [44]. The root cause of positive selection is often related to environmental adaptation and the development of new functions, and most non-synonymous mutations are unfavorable [43]. Compared to other genes, the ND4L and ATP8 genes had a higher average value in each pair comparison. Due to DNA repair mechanisms, low mutation rates tend to occur in highly expressed genes, and COII and Cytb have lower Ka/Ks levels and lower mutation rates compared with other genes, suggesting that they may have higher expression levels [45]. Fish of the same genus showed lower Ka/Ks values in different genes, indicating that fish of the same genus showed similar living habits and had a closer phylogenetic relationship [42]. Peristediidae fishes are demersal fishes, and their living environment extends from the bottom of the front sea to the bottom of the deep sea. Their living environment is the same, and their morphological characteristics are generally the same [2].
The topology tree results obtained by the BI and ML methods consistently indicate the two families, Peristediidae and Triglidae. The result was consistent with the traditional systematics based on morphological characteristics [2]. Furthermore, the analysis reveals that the genus Peristedion exhibits the farthest genetic divergence within the family Peristediidae.
In the family Peristediidae, the divergence time between the genus Peristedion and other species within Peristediidae was the earliest (26.19 Mya). Conversely, the genera Scalicus and Paraheminodus exhibited a more recent divergence time of 4.58 Mya. Notably, there existed a significant gap of 7.51 million years between the genera Peristedion and Satyrichthys. The results of this study suggest that reproductive isolation and evolutionary processes in different genera occurred over a long period of time. These findings underscore the long-term nature of evolution, aligning with previous research [46]. Additionally, alterations in genetic structure can also result in reproductive isolation among organisms. The occurrence of geological events constitutes the primary factor leading to geographical isolation [47,48]. The divergence time of species in the family Peristediidae can be traced back to the late Cretaceous period (66–145 Mya). A multitude of geological transformations have transpired during this time period. The formation of numerous mountain ranges, the emergence of flowering plants, and a substantial accumulation of shale deposits on the ocean floor have contributed to the manifestation of two marine anoxic events [49]. The occurrence of these events has resulted in changes to the fish habitat, leading to their divergence in this region. During the Cenozoic–Mesozoic period, which occurred approximately 240–65 Mya, there was a significant reduction in transgressive range on the continent and the emergence of marine sediments in marginal areas of China [50]. During this period, there were frequent occurrences of geological movements. These geological changes have the potential to generate an increased abundance of food sources for fish and can also result in geological isolation, thereby altering genetic trajectories. The findings from this study reveal that a majority of fish species underwent differentiation during the Early Cenozoic, further substantiating the notion that geological events exerted a discernible influence on species divergence.
5. Conclusions
In this study, mitochondrial genome sequence analysis was used to explore four Peristiidae species. The complete mitochondrial genome sequences and mitochondrial gene structures of four Peristiidae species were determined. The structure remains consistent, encompassing a total of 37 genes and one control region. The cladogram was constructed using two methods to determine the classification of the family Peristiidae. The P. liorhynchus was preferentially separated, the S. rieffeli and the S. welchi were gathered into one branch, and the S. amiscus and Satyrichthys were sister branches. The results of the classification within the family were consistent with those obtained from morphological studies. The divergence time tree and timeline were constructed based on the ML tree. The four peristiid species underwent differentiation during the Early Paleogene period, and their evolution trajectory may be linked to geological events that could have altered their habitat conditions. The results of this study provide a basic theoretical and molecular basis for the taxonomic study of Peristiidae. The complete mitogenome of these four peristiid fishes will provide crucial insights for enhancing the taxonomic system and phylogenetics.
Supplementary Materials
The following supporting information can be downloaded at: https://0-www-mdpi-com.brum.beds.ac.uk/article/10.3390/genes15050557/s1, Table S1. Summary of gene/element feature of P. liorhynchus; Table S2: Summary of gene/element feature of S. welchi; Table S3: Summary of gene/element feature of S. rieffeli; Table S4: Summary of gene/element feature of S. amiscus; Table S5: The base composition of four Peristediidae fish; Figure S1. Inferred secondary structures of tRNA-Ser (GCT) gene in four Peristediidae mitogenomes.
Author Contributions
Conceptualization, T.G.; methodology, T.G.; software, X.L.; validation, X.L. and Y.S.; formal analysis, X.L.; investigation, X.L.; resources, T.G.; data curation, T.G.; writing—original draft preparation, X.L.; writing—review and editing, T.G. and C.J.; visualization, T.G.; supervision, T.G.; project administration, T.G.; funding acquisition, T.G. All authors have read and agreed to the published version of the manuscript.
Funding
This research was funded by the Province Key Research and Development Program of Zhejiang, grant number 2021C02047.
Institutional Review Board Statement
Not applicable.
Informed Consent Statement
Not applicable.
Data Availability Statement
The datasets generated during this study have been uploaded to NCBI (Nos. PP708603; PP708604; PP708605; PP708606).
Acknowledgments
We are grateful to Chen-feng Zhao for taking the photos and Qi Liu of Wanmo Technology Company helping data analysis.
Conflicts of Interest
The authors declare no conflicts of interest.
References
- Rajeeshkumar, M.; Rajeev, R.; Hashim, M.; Saravanane, N. New distributional record of Peristedion liorhynchus (Scorpaeniformes: Peristediidae) from central Indian Ocean. Int. J. Mar. Sci. 2021, 37, 739–743. [Google Scholar]
- Kawai, T. Phylogenetic systematics of the family Peristediidae. Species Divers. 2008, 13, 1–34. [Google Scholar] [CrossRef]
- Chen, D.G.; Zhang, M.Z. Marine Fish in China (Medium Volume); Ocean University of China Press: Qingdao, China, 2015; pp. 806–813. [Google Scholar]
- Curole, J.; Kocher, T. Mitogenomics: Digging deeper with complete mitochondrial genomes. Trends Ecol. Evol. 1999, 14, 394–398. [Google Scholar] [CrossRef] [PubMed]
- Boore, J. Animal mitochondrial genomes. Nucleic Acids Res. 1999, 27, 1767–1780. [Google Scholar] [CrossRef] [PubMed]
- Jogayya, K.; Meganathan, P.; Dubey, B.; Haque, I. Mitochondrial 16S ribosomal RNA gene for forensic identification of crocodile species. J. Forensic Leg. Med. 2013, 20, 334–338. [Google Scholar] [CrossRef] [PubMed]
- Lavrov, D.; Pett, W. Animal mitochondrial DNA as we do not know it: Mt-genome organization and evolution in nonbilaterian lineages. Genome Biol. Evol. 2016, 8, 2896–2913. [Google Scholar] [CrossRef] [PubMed]
- Gan, H.; Amornsakun, T.; Tan, M. The complete mitochondrial genome of the snakeskin gourami, Trichopodus pectoralis (Regan 1910) (Teleostei: Osphronemidae). Mitochondrial DNA Part B 2017, 2, 148–149. [Google Scholar] [CrossRef] [PubMed]
- Inoue, J.; Miya, M.; Tsukamoto, K.; Nishida, M. Complete mitochondrial DNA sequence of Conger myriaster (Teleostei: Anguilliformes): Novel gene order for vertebrate mitochondrial genomes and the phylogenetic implications for anguilliform families. J. Mol. Evol. 2001, 52, 311–320. [Google Scholar] [CrossRef] [PubMed]
- Xing, B.; Lin, H.; Zhang, Z.; Wang, C.; Wang, Y.; Wang, J. DNA barcoding for identification of fish species in the Taiwan Strait. PLoS ONE 2018, 13, e0198109. [Google Scholar]
- Kenchington, E.L.; Baillie, S.M.; Kenchington, T.J.; Bentzen, P. Barcoding Atlantic Canada’s mesopelagic and upper bathypelagic marine fishes. PLoS ONE 2017, 12, e0185173. [Google Scholar] [CrossRef] [PubMed]
- Nevatte, R.; Clark, J.; Williamson, J.; Gillings, M. The complete mitochondrial genome of the Epaulette shark, Hemiscyllium ocellatum (Bonnaterre, 1788). Mitochondrial DNA Part B 2019, 4, 534–535. [Google Scholar] [CrossRef]
- Miya, M.; Takeshima, H.; Endo, H.; Ishiguro, N.; Inoue, J.; Mukai, T.; Satoh, T.; Yamaguchi, M.; Kawaguchi, A.; Mabuchi, K.; et al. Major patterns of higher teleostean phylogenies: A new perspective based on 100 complete mitochondrial DNA sequences. Mol. Phylogenet. Evol. 2003, 26, 121–138. [Google Scholar] [CrossRef] [PubMed]
- Nicolas, D.; Patrick, M.; Guillaume, S. NOVOPlasty: Denovo assembly of organelle genomes from whole genome data. Nucleic Acids Res. 2016, 45, e18. [Google Scholar]
- Wataru, I.; Tsukasa, F.; Ryota, I.; Koichiro, Y.; Yasunobu, M.; Satoh, T.P.; Tetsuya, S.; Kohji, M.; Hirohiko, T.; Masaki, M. MitoFish and mitoAnnotator: A mitochondrial genome database of fish with an accurate and automatic annotation pipeline. Mol. Biol. Evol. 2013, 30, 2531–2540. [Google Scholar]
- Kuang, W.; Yu, L. The strategy and software application status of mitochondrial genome assembly in the genome era. Heredity 2019, 41, 979–993. [Google Scholar]
- Posada, D. jModelTest: Phylogenetic model averaging. Mol. Biol. Evol. 2008, 25, 1253–1256. [Google Scholar] [CrossRef] [PubMed]
- Ronquist, F.; Teslenko, M.; Mark, P.; Ayres, D.; Darling, A.; Höhna, S.; Larget, B.; Liu, L.; Suchard, M.; Huelsenbeck, J. MrBayes 3.2: Efficient Bayesian phylogenetic inference and model choice across a large model space. Syst. Biol. 2012, 61, 539–542. [Google Scholar] [CrossRef] [PubMed]
- Kumar, S.; Stecher, G.; Li, M.; Knyaz, C.; Tamura, K. MEGA X: Molecular evolutionary genetics analysis across computing platforms. Mol. Biol. Evol. 2018, 35, 1547–1549. [Google Scholar] [CrossRef] [PubMed]
- Kumar, S.; Stecher, G.; Tamura, K. MEGA7: Molecular evolutionary genetics analysis version 7.0 for bigger datasets. Mol. Biol. Evol. 2016, 33, 1870–1874. [Google Scholar] [CrossRef] [PubMed]
- Kumar, S.; Stecher, G.; Suleski, M.; Hedges, S. TimeTree: A resource for timelines, timetrees, and divergence times. Mol. Biol. Evol. 2017, 34, 1812–1819. [Google Scholar] [CrossRef] [PubMed]
- Ruan, H.; Li, M.; Li, Z.; Huang, J.; Chen, W.; Sun, J.; Liu, L.; Zou, K. Comparative analysis of complete mitochondrial genomes of three Gerres fishes (Perciformes: Gerreidae) and primary exploration of their evolution history. Int. J. Mol. Sci. 2020, 21, 1874–1893. [Google Scholar] [CrossRef] [PubMed]
- Zhong, L.; Wang, M.; Li, D.; Tang, S.K.; Zhang, T.; Bian, W.; Chen, X. Complete mitochondrial genome of freshwater goby Rhinogobius cliffordpopei (Perciformes, Gobiidae): Genome characterization and phylogenetic analysis. Genes Genom. 2018, 40, 1137–1148. [Google Scholar] [CrossRef] [PubMed]
- Periasamy, R.; Chen, X.; Ingole, B.; Liu, W. Complete mitochondrial genome of the spadenose shark Scoliodon laticaudus (Carcharhiniformes: Carcharhinidae). Mitochondrial DNA Part A 2016, 27, 3248–3249. [Google Scholar] [CrossRef] [PubMed]
- Wei, S.; Shi, M.; Chen, X.; Sharkey, M.; van Achterberg, C.; Ye, G.; He, J. New views on strand asymmetry in insect mitochondrial genomes. PLoS ONE 2010, 5, e12708. [Google Scholar] [CrossRef] [PubMed]
- Zhang, J.; Kan, X.; Miao, G.; Hu, S.; Sun, Q.; Tian, W. qMGR: A new approach for quantifying mitochondrial genome rearrangement. Mitochondrion 2020, 52, 20–23. [Google Scholar] [CrossRef] [PubMed]
- Gong, L.; Lu, X.; Luo, H.; Zhang, Y.; Shi, W.; Liu, L.; Lü, Z.; Liu, B.; Jiang, L. Novel gene rearrangement pattern in Cynoglossus melampetalus mitochondrial genome: New gene order in genus Cynoglossus (Pleuronectiformes: Cynoglossidae). Int. J. Biol. Macromol. 2020, 149, 1232–1240. [Google Scholar] [CrossRef] [PubMed]
- Gissi, C.; Iannelli, F.; Pesole, G. Evolution of the mitochondrial genome of Metazoa as exemplified by comparison of congeneric species. Heredity 2008, 101, 301–320. [Google Scholar] [CrossRef] [PubMed]
- Paula, M.; Manuela, M.; Mauricio, O.; Natalia, S.; Jefrey, L.; Carlos, F. Comparative genomic analysis of vertebrate mitochondrial reveals a differential of rearrangements rate between taxonomic class. Sci. Rep. 2022, 12, 5479. [Google Scholar]
- Naylor, G.J.P.; Collins, T.; Brown, W.M. Hydrophobicity and phylogeny. Nature 1995, 373, 555–556. [Google Scholar] [CrossRef] [PubMed]
- Lu, Z.; Zhu, K.; Jiang, H.; Lu, X.; Ye, Y.; Jiang, L.; Liu, L.; Gong, L. Complete mitochondrial genome of Ophichthus brevicaudatus reveals novel gene order and phylogenetic relationships of Anguilliformes. Int. J. Biol. Macromol. 2019, 135, 609–618. [Google Scholar] [CrossRef] [PubMed]
- Ojala, D.; Montoya, J.; Attardi, G. tRNA punctuation model of RNA processing in human mitochondria. Nature 1981, 290, 470–474. [Google Scholar] [CrossRef] [PubMed]
- Han, Y.; Chen, G.; Luo, J.; Wen, X.; Li, W.; Wang, J. The complete mitochondrial genome of Cheilinus undulates based on high-throughput sequencing technique. Mitochondrial DNA Part A 2014, 3, 1897–1899. [Google Scholar]
- Shi, X.; Tian, P.; Lin, R.; Huang, D.; Wang, J. Characterization of the complete mitochondrial genome sequence of the globose head whiptail Cetonurus globiceps (Gadiformes: Macrouridae) and its phylogenetic analysis. PLoS ONE 2016, 11, e0153666. [Google Scholar] [CrossRef] [PubMed]
- Hardt, W.; Schlegl, J.; Erdmann, V.; Hartmann, R. Role of the D arm and the anticodon arm in tRNA recognition by eubacterial and eukaryotic RNase P enzymes. Biochemistry 1993, 32, 13046–13053. [Google Scholar] [CrossRef] [PubMed]
- Satoh, T.; Miya, M.; Endo, H.; Nishida, M. Round and pointed-head grenadier fshes (Actinopterygii: Gadiformes) represent a single sister group: Evidence from the complete mitochondrial genome sequences. Mol. Phylogenet. Evol. 2006, 40, 129–138. [Google Scholar] [CrossRef] [PubMed]
- Sun, D.; Zhang, H.; Yanagimoto, T.; Yin, L.; Gao, T.X. The complete mitochondrial genome of the marbled rockfish Sebastiscus marmoratus (Scorpaeniformes, Scorpaenidae) from Japan. Mitochondrial DNA 2015, 26, 771–772. [Google Scholar] [CrossRef] [PubMed]
- Redwan, R.; Parthasarathy, S.; Hari, R. Codon usage. Encycl. Bioinform. Comput. Biol. 2019, 3, 327–331. [Google Scholar]
- Meng, Q.; Zhang, Z.; Zhang, Z.; Zhang, C.; Chen, S.; Zhu, F.; Jia, C.; Cao, G. Codon bias and cluster analysis on coding regions of mtDNA in rock porgy Oplegnathus punctatus and rock bream O. fasciatus. Fish. Sci. 2020, 39, 702–709. [Google Scholar]
- Hull, R. Plant Virology, 5th ed.; Elsevier: Amsterdam, The Netherlands, 2014; pp. 247–339. [Google Scholar]
- Li, X.; Huang, Y.; Lei, F. Comparative mitochondrial genomics and phylogenetic relationships of the Crossoptilon species (Phasianidae, Galliformes). BMC Genom. 2015, 16, 42. [Google Scholar] [CrossRef] [PubMed]
- Delarbre, C.; Spruyt, N.; Delmarre, C.; Gallut, C.; Barriel, V.; Janvier, P.; Laudet, V.; Gachelin, G. The complete nucleotide sequence of the mitochondrial DNA of the dogfish, Scyliorhinus canicula. Genetics 1998, 150, 331–344. [Google Scholar] [CrossRef]
- Xiang, D.; Shen, X.; Pu, Z.; Irwin, D.; Liao, M.; Shen, Y. Convergent evolution of human-isolated H7N9 avian influenza A viruses. J. Infect. Dis. 2018, 217, 1699–1707. [Google Scholar] [CrossRef] [PubMed]
- Nielsen, R. Molecular signatures of natural selection. Annu. Rev. Genet. 2005, 39, 197–218. [Google Scholar] [CrossRef] [PubMed]
- Barrientos, A.; Barros, M.; Valnot, I.; Rötig, A.; Rustin, P.; Tzagoloff, A. Cytochrome oxidase in health and disease. Gene 2002, 286, 53–63. [Google Scholar] [CrossRef] [PubMed]
- Twyford, A.; Kidner, C.; Ennos, R. Maintenance of species boundaries in a neotropical radiation of Begonia. Mol. Ecol. 2015, 24, 4982–4993. [Google Scholar] [CrossRef] [PubMed]
- Pamela, P.; Manuel, C.; Guillermo, V.; Pedro, L.; Harald, M. The influence of geological history on diversification in insular species: Genetic and morphological patterns of Micromeria benth. (Lamiaceae) in Tenerife (Canary archipelago). J. Biogeogr. 2014, 41, 1871–1882. [Google Scholar]
- Catarino, D.; Knutsen, H.; Veríssimo, A.; Olsen, E.; Jorde, P.; Menezes, G.; Sannæs, H.; Stanković, D.; Company, J.B.; Neat, F. The Pillars of Hercules as a bathymetric barrier to gene flow promoting isolation in a global deep-sea shark (Centroscymnus coelolepis). Mol. Ecol. 2015, 24, 6061–6079. [Google Scholar] [CrossRef] [PubMed]
- Sweere, T.; Dickson, A.; Jenkyns, H.; Porcelli, D.; Elrick, M.; Boorn, S.H.; Henderson, G.M. Isotopic evidence for changes in the zinc cycle during Oceanic Anoxic Event 2 (Late Cretaceous). Geology 2018, 46, 463–466. [Google Scholar] [CrossRef]
- Yan, Y.; Yao, D.; Tian, Z.; Huang, C.; Dilek, Y.; Clift, P.; Li, Z. Tectonic topography changes in Cenozoic East Asia: A landscape erosion-sediment archivein the South China Sea. Geochem. Geophys. Geosyst. 2018, 19, 1731–1750. [Google Scholar] [CrossRef]
Figure 1.
The samples of four Peristediidae fish species: (a) P. liorhynchus, (b) S. amiscus, (c) S. rieffeli, and (d) S. welchi.
Figure 1.
The samples of four Peristediidae fish species: (a) P. liorhynchus, (b) S. amiscus, (c) S. rieffeli, and (d) S. welchi.

Figure 2.
The circular map of the mitogenome of four Peristediidae fishes. (a): P. liorhynchus, (b): S. amiscus, (c): S. rieffeli, and (d): S. welchi.
Figure 2.
The circular map of the mitogenome of four Peristediidae fishes. (a): P. liorhynchus, (b): S. amiscus, (c): S. rieffeli, and (d): S. welchi.

Figure 3.
AT-skew and GC-skew values for four species. (a): P. liorhynchus, (b): S. amiscus, (c): S. rieffeli, and (d): S. welchi.
Figure 3.
AT-skew and GC-skew values for four species. (a): P. liorhynchus, (b): S. amiscus, (c): S. rieffeli, and (d): S. welchi.

Figure 4.
Codon frequency of the mitochondrial genome for four species: (a) P. liorhynchus, (b) S. amiscus, (c) S. rieffeli, and (d) S. welchi. Note: F(Phe), L1(Leu), L2(Leu), I(Ile), M(Met), V(Val), S1(Ser), P(Pro), T(Thr), A(Ala), Y(Tyr), H(His), Q(Gln), N(Asn), K(Lys), D(Asp), E(Glu), C(Cys), W(Trp), R(Arg), S2(Ser), G(Gly).

Figure 5.
Relative synonymous codon usage (RSCU) of the mitochondrial genome for four species: (a) P. liorhynchus, (b) S. amiscus, (c) S. rieffeli, and (d) S. welchi. Note: F(Phe), L1(Leu), L2(Leu), I(Ile), M(Met), V(Val), S1(Ser), P(Pro), T(Thr), A(Ala), Y(Tyr), H(His), Q(Gln), N(Asn), K(Lys), D(Asp), E(Glu), C(Cys), W(Trp), R(Arg), S2(Ser), G(Gly).

Figure 6.
The Ka/Ks values for each protein-coding gene (PCG) in the pairwise mitochondrial genomes of four peristediid fishes. The abbreviations used are as follows: (PL) P. liorhynchus, (SW) S. welchi, (SR) S. rieffeli, and (SA) S. amiscus.
Figure 6.
The Ka/Ks values for each protein-coding gene (PCG) in the pairwise mitochondrial genomes of four peristediid fishes. The abbreviations used are as follows: (PL) P. liorhynchus, (SW) S. welchi, (SR) S. rieffeli, and (SA) S. amiscus.

Figure 7.
Phylogenetic tree based on the Bayesian (BI) and maximum likelihood (ML) methods (based on 12 PCGs). D. volitans was used as the outgroup.
Figure 7.
Phylogenetic tree based on the Bayesian (BI) and maximum likelihood (ML) methods (based on 12 PCGs). D. volitans was used as the outgroup.

Figure 8.
Based on the maximum likelihood (ML) topology, the divergent time trees of 14 fish species were constructed, and the tandem sequences of 12 PCGs were used. The number near the node represents the estimated divergence time (Mya).
Figure 8.
Based on the maximum likelihood (ML) topology, the divergent time trees of 14 fish species were constructed, and the tandem sequences of 12 PCGs were used. The number near the node represents the estimated divergence time (Mya).

Disclaimer/Publisher’s Note: The statements, opinions and data contained in all publications are solely those of the individual author(s) and contributor(s) and not of MDPI and/or the editor(s). MDPI and/or the editor(s) disclaim responsibility for any injury to people or property resulting from any ideas, methods, instructions or products referred to in the content. |
© 2024 by the authors. Licensee MDPI, Basel, Switzerland. This article is an open access article distributed under the terms and conditions of the Creative Commons Attribution (CC BY) license (https://creativecommons.org/licenses/by/4.0/).
Share and Cite
MDPI and ACS Style
Liao, X.; Shih, Y.; Jia, C.; Gao, T. Complete Mitochondrial Genome of Four Peristediidae Fish Species: Genome Characterization and Phylogenetic Analysis. Genes 2024, 15, 557. https://0-doi-org.brum.beds.ac.uk/10.3390/genes15050557
AMA Style
Liao X, Shih Y, Jia C, Gao T. Complete Mitochondrial Genome of Four Peristediidae Fish Species: Genome Characterization and Phylogenetic Analysis. Genes. 2024; 15(5):557. https://0-doi-org.brum.beds.ac.uk/10.3390/genes15050557
Chicago/Turabian StyleLiao, Xianhui, Yijia Shih, Chenghao Jia, and Tianxiang Gao. 2024. "Complete Mitochondrial Genome of Four Peristediidae Fish Species: Genome Characterization and Phylogenetic Analysis" Genes 15, no. 5: 557. https://0-doi-org.brum.beds.ac.uk/10.3390/genes15050557
Note that from the first issue of 2016, this journal uses article numbers instead of page numbers. See further details here.