Article

The Satellite DNA PcH-Sat, Isolated and Characterized in the Limpet Patella caerulea (Mollusca, Gastropoda), Suggests the Origin from a Nin-SINE Transposable Element

Department of Biology, University of Naples Federico II, Via Cinthia, I-80126 Naples, Italy
*
Author to whom correspondence should be addressed.
Submission received: 19 March 2024 / Revised: 16 April 2024 / Accepted: 23 April 2024 / Published: 25 April 2024
(This article belongs to the Section Animal Genetics and Genomics)

Abstract

:
Satellite DNA (sat-DNA) was previously described as junk and selfish DNA in the cellular economy, without a clear functional role. However, during the last two decades, evidence has been accumulated about the roles of sat-DNA in different cellular functions and its probable involvement in tumorigenesis and adaptation to environmental changes. In molluscs, studies on sat-DNAs have been performed mainly on bivalve species, especially those of economic interest. Conversely, in Gastropoda (which includes about 80% of the currently described molluscs species), studies on sat-DNA have been largely neglected. In this study, we isolated and characterized a sat-DNA, here named PcH-sat, in the limpet Patella caerulea using the restriction enzyme method, particularly HaeIII. Monomeric units of PcH-sat are 179 bp long, AT-rich (58.7%), and with an identity among monomers ranging from 91.6 to 99.8%. Southern blot showed that PcH-sat is conserved in P. depressa and P. ulyssiponensis, while a smeared signal of hybridization was present in the other three investigated limpets (P. ferruginea, P. rustica and P. vulgata). Dot blot showed that PcH-sat represents about 10% of the genome of P. caerulea, 5% of that of P. depressa, and 0.3% of that of P. ulyssiponensis. FISH showed that PcH-sat was mainly localized on pericentromeric regions of chromosome pairs 2 and 4–7 of P. caerulea (2n = 18). A database search showed that PcH-sat contains a large segment (of 118 bp) showing high identity with a homologous trait of the Nin-SINE transposable element (TE) of the patellogastropod Lottia gigantea, supporting the hypothesis that TEs are involved in the rising and tandemization processes of sat-DNAs.

1. Introduction

Limpets of the genus Patella Rafinesque, 1815 are popular marine gastropod grazers. The genus includes 16 species living on rocky intertidal areas of the East Atlantic and Mediterranean coasts [1].
Five species of Patella inhabit the Mediterranean Sea. Other than the historically documented presence of four species, P. caerulea Linnaeus, 1758, P. ferruginea Gmelin, 1791, P. rustica Linnaeus, 1758, and P. ulyssiponensis Gmelin, 1791, [2,3], an additional species, P. depressa Pennant, 1777, has been recently recorded in western Mediterranean coasts [4]. The above first four Patella species can be sympatric on intertidal rocky areas, but distributed at different vertical levels, with P. rustica at the supralittoral zone; P. ferruginea at the upper mesolittoral level; P. ulyssiponensis at the lower mesolittoral; and P. caerulea in both the intertidal and upper infralittoral zones [3,4].
Patella ferruginea deserves particular attention because the species is threated and in “danger of extinction” according to the Barcelona Convention [5] and it is the most endangered marine species on the list of the European Council Directive 92/43/EEC on the Conservation of Natural Habitat of Wild Fauna and Flora [6]. The other three limpet species, P. caerulea, P. rustica, and P. ulyssiponensis, are quite common in the Mediterranean Sea, with P. caerulea locally abundant, and used for food, fishery, and as a species index in marine environmental monitoring studies (e.g., [6,7,8,9]).
In accordance with their ecological and commercial importance in marine ecosystems, interest in genetic and molecular research on Patella has increased in recent years [10,11,12,13,14,15,16]. Recent genome assemblies are available on online databases (direct submission by the Wellcome Sanger Tree of Life Programme [17,18]). However, cytogenetic aspects are largely unexplored, and of 16 species of the genus [1], only 3 (P. caerulea, P. rustica, and P. ulyssiponensis) have been karyotyped. Patella caerulea and P. rustica have 2n = 18 chromosomes (with seven biarmed pairs, 1–7, and two telocentric pairs, 8–9) while P. ulyssiponensis has 2n = 16 elements (with all biarmed pairs) [2,19]. Furthermore, heterochromatin is mostly located on the pericentromeric regions and presents a complex composition [2], which notoriously is mostly constituted by repeated, non-coding DNA sequences, particularly satellite DNA (sat-DNA) [20,21]. Sat-DNA constitutes a large component of eukaryotic genomes, frequently localized on centromeric and telomeric regions of chromosomes [22,23]; it is constituted of arrays of tandemly repeated sequences, with monomeric units ranging from lower than 100 to more than 1000 bp and copy numbers varying from lower than a few hundred to several million copies and reaching more than 50% of the genome [24,25,26,27].
Sat-DNA was previously considered as junk and selfish DNA [28,29]. However, in the last two decades, evidence has been accumulated showing that sat-DNA has substantial roles in contributing to the assembly of centromeric chromatin, chromosome segregation and gametogenesis, higher-level organization of the nucleus, reproductive isolation and speciation, and the architecture and integrity of the genome (references in [23]). Furthermore, changes in the copy number and rates of expression of sat-DNAs have also been proposed be involved in stress, tumorigenesis, and adaptation to environmental changes (references in [23]).
The high similarity of repetitive sequences of sat-DNAs makes it difficult to reconstruct the sequential order of the monomeric units. Study problems also arise because sat-DNAs are under-represented and/or commonly missed in the annotated assemblies deposited in public repositories [30,31,32,33,34]. These difficulties have started to be overcome only recently, thanks to the development of powerful bioinformatic programs and high-quality annotated assemblies, which, so far, have been applied mostly to humans and model species [18,27,30,32,33,35,36,37].
In non-model species, such as molluscs, previous and relatively old methods have been and can still be useful tools to study sat-DNAs. For example, gradient density methods were used to first isolate sat-DNAs. In fact, sat-DNAs appear as a satellite of the main bulk of the DNA peak, from which the name sat-DNA was originally conceived [21,37]. A successive and more widely applied method is represented by restriction enzymes [38]. In the present paper, the digestion of the genomic DNA of the limpet P. caerulea with the restrictase HaeIII was used to evidence the presence of a sat-DNA, here named PcH-sat, whose monomeric units were isolated and sequenced. The chromosomal distribution of PcH-sat and its quantification in the genome of P. caerulea were assayed by FISH and dot blot, respectively. Finally, the conservation of PcH-sat in Patellogastropoda and other mollusc taxa was assayed by Southern blot and queried in annotated assemblies.

2. Material and Methods

Experimental procedures were conducted on the following species of the genus Patella: P. caerulea, P depressa, P. ferruginea, P. rustica, P. ulyssiponensis, and P. vulgata. The number and provenance of the studied Patella specimens are given in Table 1.
Several samples considered here have been already used in other studies [2,38,39].

2.1. DNA Extraction

DNA was extracted from the foot of the studied specimens according to Sokolov [40]. In brief, a piece of foot (4–5 mm), finely cut with forceps, was transferred in a 2 mL plastic tube containing 1 mL of the lysis buffer (50 mM Tris-HCl, pH 7.5, 100 mM NaCl, 10 mM EDTA, 1% sodium dodecyl sulphate (SDS), 0.2 mg/mL Proteinase K) and incubated at 55 °C until complete digestion. A saturated solution of KCl (100 μL) was added and samples were incubated on ice for 5 min. After centrifugation at 12,000 rpm, the supernatant was treated twice with an equal volume of a chloroform/isoamyl alcohol (24:1) mixture. DNA was extracted with 100% ethanol, washed in 70% ethanol, centrifugated a 6000 rpm, air-dried, and finally dissolved in an adequate volume of TE buffer (10 mM Tris-HCl, 1 mM EDTA).
Preliminary digestions of the DNA of P. caerulea with several restriction enzymes, BglII, Eco RI, HaeIII, HpaII, MspI, and TaqI, evidenced a ladder of bands in the DNA digested with HaeIII. After that, 5 μg DNA of P. caerulea was digested overnight with 10 units of HaeIII (Promega, Madison, WI, USA). The monomeric unit of about 180 bp was eluted by the Qiaquick gel extraction kit (Qiagen, Hilden, Germany) and ligated in pGem-T easy vector (Promega, Madison, WI, USA).
After the transformation of monomeric units in DH5α cells, positive colonies were selected and amplified by PCR using primer pairs T7 (5′ TAATACGACTCACTATAGGG 3′) and SP6 (5′ ATTTAGGTGACACTATAG 3′) with the following PCR conditions: 5 min at 94 °C; 36 cycles at 94 °C for 30 s, 50 °C for 30 s, and 70 °C for 45 s; and 5 min at 72 °C. Sequencing of positive colonies (about 50) was performed in both orientations using the BigDye Terminator kit v1.1 Cycle Sequencing Kit (Thermo Fisher, Waltham, MA, USA) and the automatic sequencer ABI Prism 310 (Applied Biosystems, Foster City, CA, USA). Sequences presenting similar traits were selected and used to design the following primer pair: PcH-sat F 5′ ACCGCCGCTKCCCCCCTAA 3′ and PcH-sat R 5′ TATAATAAATAAGCAACATAGAGAAAA 3′. These were used to amplify the isolated sat-DNA from the genomic DNA of P. cerulean, P. ulyssiponensis, P. ferruginea, P. rustica, P. depressa, P. intermedia, and P. vulgata. The PCR conditions with the primer pair PcH-sat F and PcH-sat R were as follows: 5 min at 94 °C; 36 cycles at 94 °C for 30 s, 65 °C for 30 s, and 70 °C for 45 s; and 5 min at 72 °C. Amplicons were purified and sequenced in both directions using the same primer pair.
Clone 2 of PcH-sat of P. caerulea was biotinylated and used for Southern blot, quantitative dot blot, and FISH analyses (see below).

2.2. Southern Blot

Southern blots were performed according to [41] and carried out on 5 μg of P. caerulea DNA digested with 10 units of HaeIII at 0, 5, and 15 min; 1 h; and overnight.
For the other investigated molluscan species (P. depressa, P. vulgata, P. rustica, P. ferruginea, P. ulyssiponensis), Southern blot was performed on 5 μg of DNA digested overnight with HaeIII. Hybridization was carried out as described by [41] using the biotinylated clone 2 of PcH-sat. Washing was performed at medium stringency conditions [2] washes in 0.2× standard saline citrate solution (SSC) and 0.5% sodium dodecyl sulphate (SDS) for 15 min. at 55 °C. Hybridization signals were revealed by 5-bromo-4-chloro-3-indolyl phosphate and nitro blue tetrazolium (BCIP-NBT) (Promega, Madison, WI, USA).

2.3. Quantitative Dot Blot

For quantitative dot blot analysis, 1 μg/mL of DNA of P. caerulea, P. depressa, P. vulgata, P. rustica, P. ferruginea, and P. ulyssiponensis was added to denaturing buffer (0.4 M NaOH, 1 M NaCl), and serially diluted six times with an equal volume of E. coli DNA at a concentration of 1 μg/mL. A purified sample of PcH-sat amplicons of P. caerulea was used as a standard at an initial concentration of 0.1 μg/mL + 0.9 μg/mL of E. coli DNA in denaturing buffer. A 100 μL aliquot of each dilution was added per slot in a dot blot apparatus (Bio-Rad, Hercules, CA, USA), filtered on a nylon membrane (Sigma-Aldrich, St. Louis and Burlington, MA, USA), and fixed on the membrane by exposition for 4 min under transilluminator UV light. Hybridization and staining procedures were the same as those used for the Southern blot.

2.4. Genome Size Estimation

Genome size (GS) was determined for P. caerulea because it was only for this species that we had fresh tissues which were suitable for performing a Feulgen densitometric image analysis (FIA), according to [42]. The integrated optical densities (IODs) were converted to genome size (GS) in picograms/nucleus (pg/N) using the IODs of three standards of known GS: Pecten maximus (Linnaeus, 1758) (1.42 pg/N), Podarcis siculus Rafinesque, 1810, (2.20 pg/N), and Bufotes viridis (Laurenti, 1768) (4.83 pg/N) [43].

2.5. Fluorescence In Situ Hybridization (FISH)

Chromosomes were obtained from gonads as described in [44]. FISH staining was performed according to Petraccioli et al. [2]. Chromosomes were aged for 1 day at room temperature, then left for 2 h at 60 °C and incubated for 30 min in RNase at 100 μg/mL in Tris-HCl 10 mM at pH 6.5. After dehydration in alcohol series, the chromosomes and probe were denatured for 3 min at 72 °C in hybridization mixture (10 ng/mL biotinylated 16 dUTP probe + 0.1 mg/mL shared E. coli DNA in 2 × SSC with 50% formamide). Hybridization was carried out at 40 °C for 20 h, which was followed by washing in 1 × SSC at 72 °C for 5 min and at RT for 2 min. Probe detection was performed by chromosome incubation for one hour with monoclonal anti-biotin (Sigma cod. B7653) diluted 1:500 in PTB (1 mL PTB = 5 μL of Tween 20% + 0.01 g of dry milk in 1 mL of PBS 0.2 M), followed by washing in 1 × PBS and incubation for 30 min with FITC-conjugated anti-anti-biotin antibodies (Sigma) diluted 1:50 in PTB. After washing in 1 × PBS, chromosomes were counterstained with 5 μg/mL propidium iodide (PI) in 1 × PBS for 15 min at RT and mounted with antifade (DABCO, Sigma). The hybridization signals were detected and recorded using an epifluorescent microscope (Leica DM) equipped with a digital camera.

2.6. Bioinformatic Analysis

To test for the presence of PcH-sat or its traits in bioinformatic databases, queries were made to Repbase [45], Repeatmasker [46], and GenBank, with different BLAST suites and parameters [47]. In particular, we used blastn (nucleotide collection n/r; Reference RNA Sequences, Refseq_RNA; whole-genome shotgun contigs, WGS) and blastx (non-redundant protein sequences, n/r). In the BLAST search, queries were performed by setting filters for cover and identity > 70%.

3. Results

3.1. Restriction Enzyme and Sequence Analysis

DNA digestion of P. caerulea with HaeIII restrictase evidenced a ladder of bands with a monomeric unit of about 180 bp, here named PcH-sat (Figure 1A). After the transformation of DH5α cells, clones displaying sequences with a length close to 180 bp and an identity among them >90% were selected (see Figure 1B) and used to design a primer pair to perform direct PCR amplification from the DNA of the studied Patella species. PcH-sat units were 179 bp long, AT-rich (58.7%), and with an identity among monomer units ranging from 91.6% to 99.8% (GenBank accession numbers PP554448–PP554449).
Successful amplifications were obtained in P. caerulea, P. depressa, P. ferruginea, P. ulyssiponensis, and P. vulgata. The alignment of the obtained sequences against P. caerulea showed nearly 100% coverage and an identity ranging from 89.1% (P. ferruginea) to 96.5% (P. ulyssiponensis), with variations mostly in the 3′ tail of the sequences (Figure 1). Direct PCR amplification was unsuccessful for the DNA of P. rustica and of several marine and air breath gastropod species belonging to different genera and families (evidence not shown). However, Southern blot and dot blot revealed the occurrence of hybridization signals in P. rustica. Additional primer pairs are probably needed for direct PCR amplification of PcH-sat in this limpet species.

3.2. Southern Blot

Southern blot with the DNA of P. caerulea digested with HaeIII confirmed the DNA satellite profile of PcH-sat and the length of its monomeric unit (179 bp), also evidencing that hybridization signals were more abundant on the dimeric band than the monomeric one (Figure 2A,B). A smeared hybridization signal was also present when the DNA was exhaustively digested (O.N.) (Figure 2A,B).
The Southern blot results for the overnight-digested DNA of other studied Patella species evidenced a ladder of bands with a monomeric band of about 180 bp in P. depressa and P. ulyssiponensis, with hybridization signals mostly on the monomeric unit (Figure 2C,D). In P. ferruginea, P. vulgata, and P. rustica, only a smeared hybridization signal was observed.

3.3. Quantitative Dot Blot
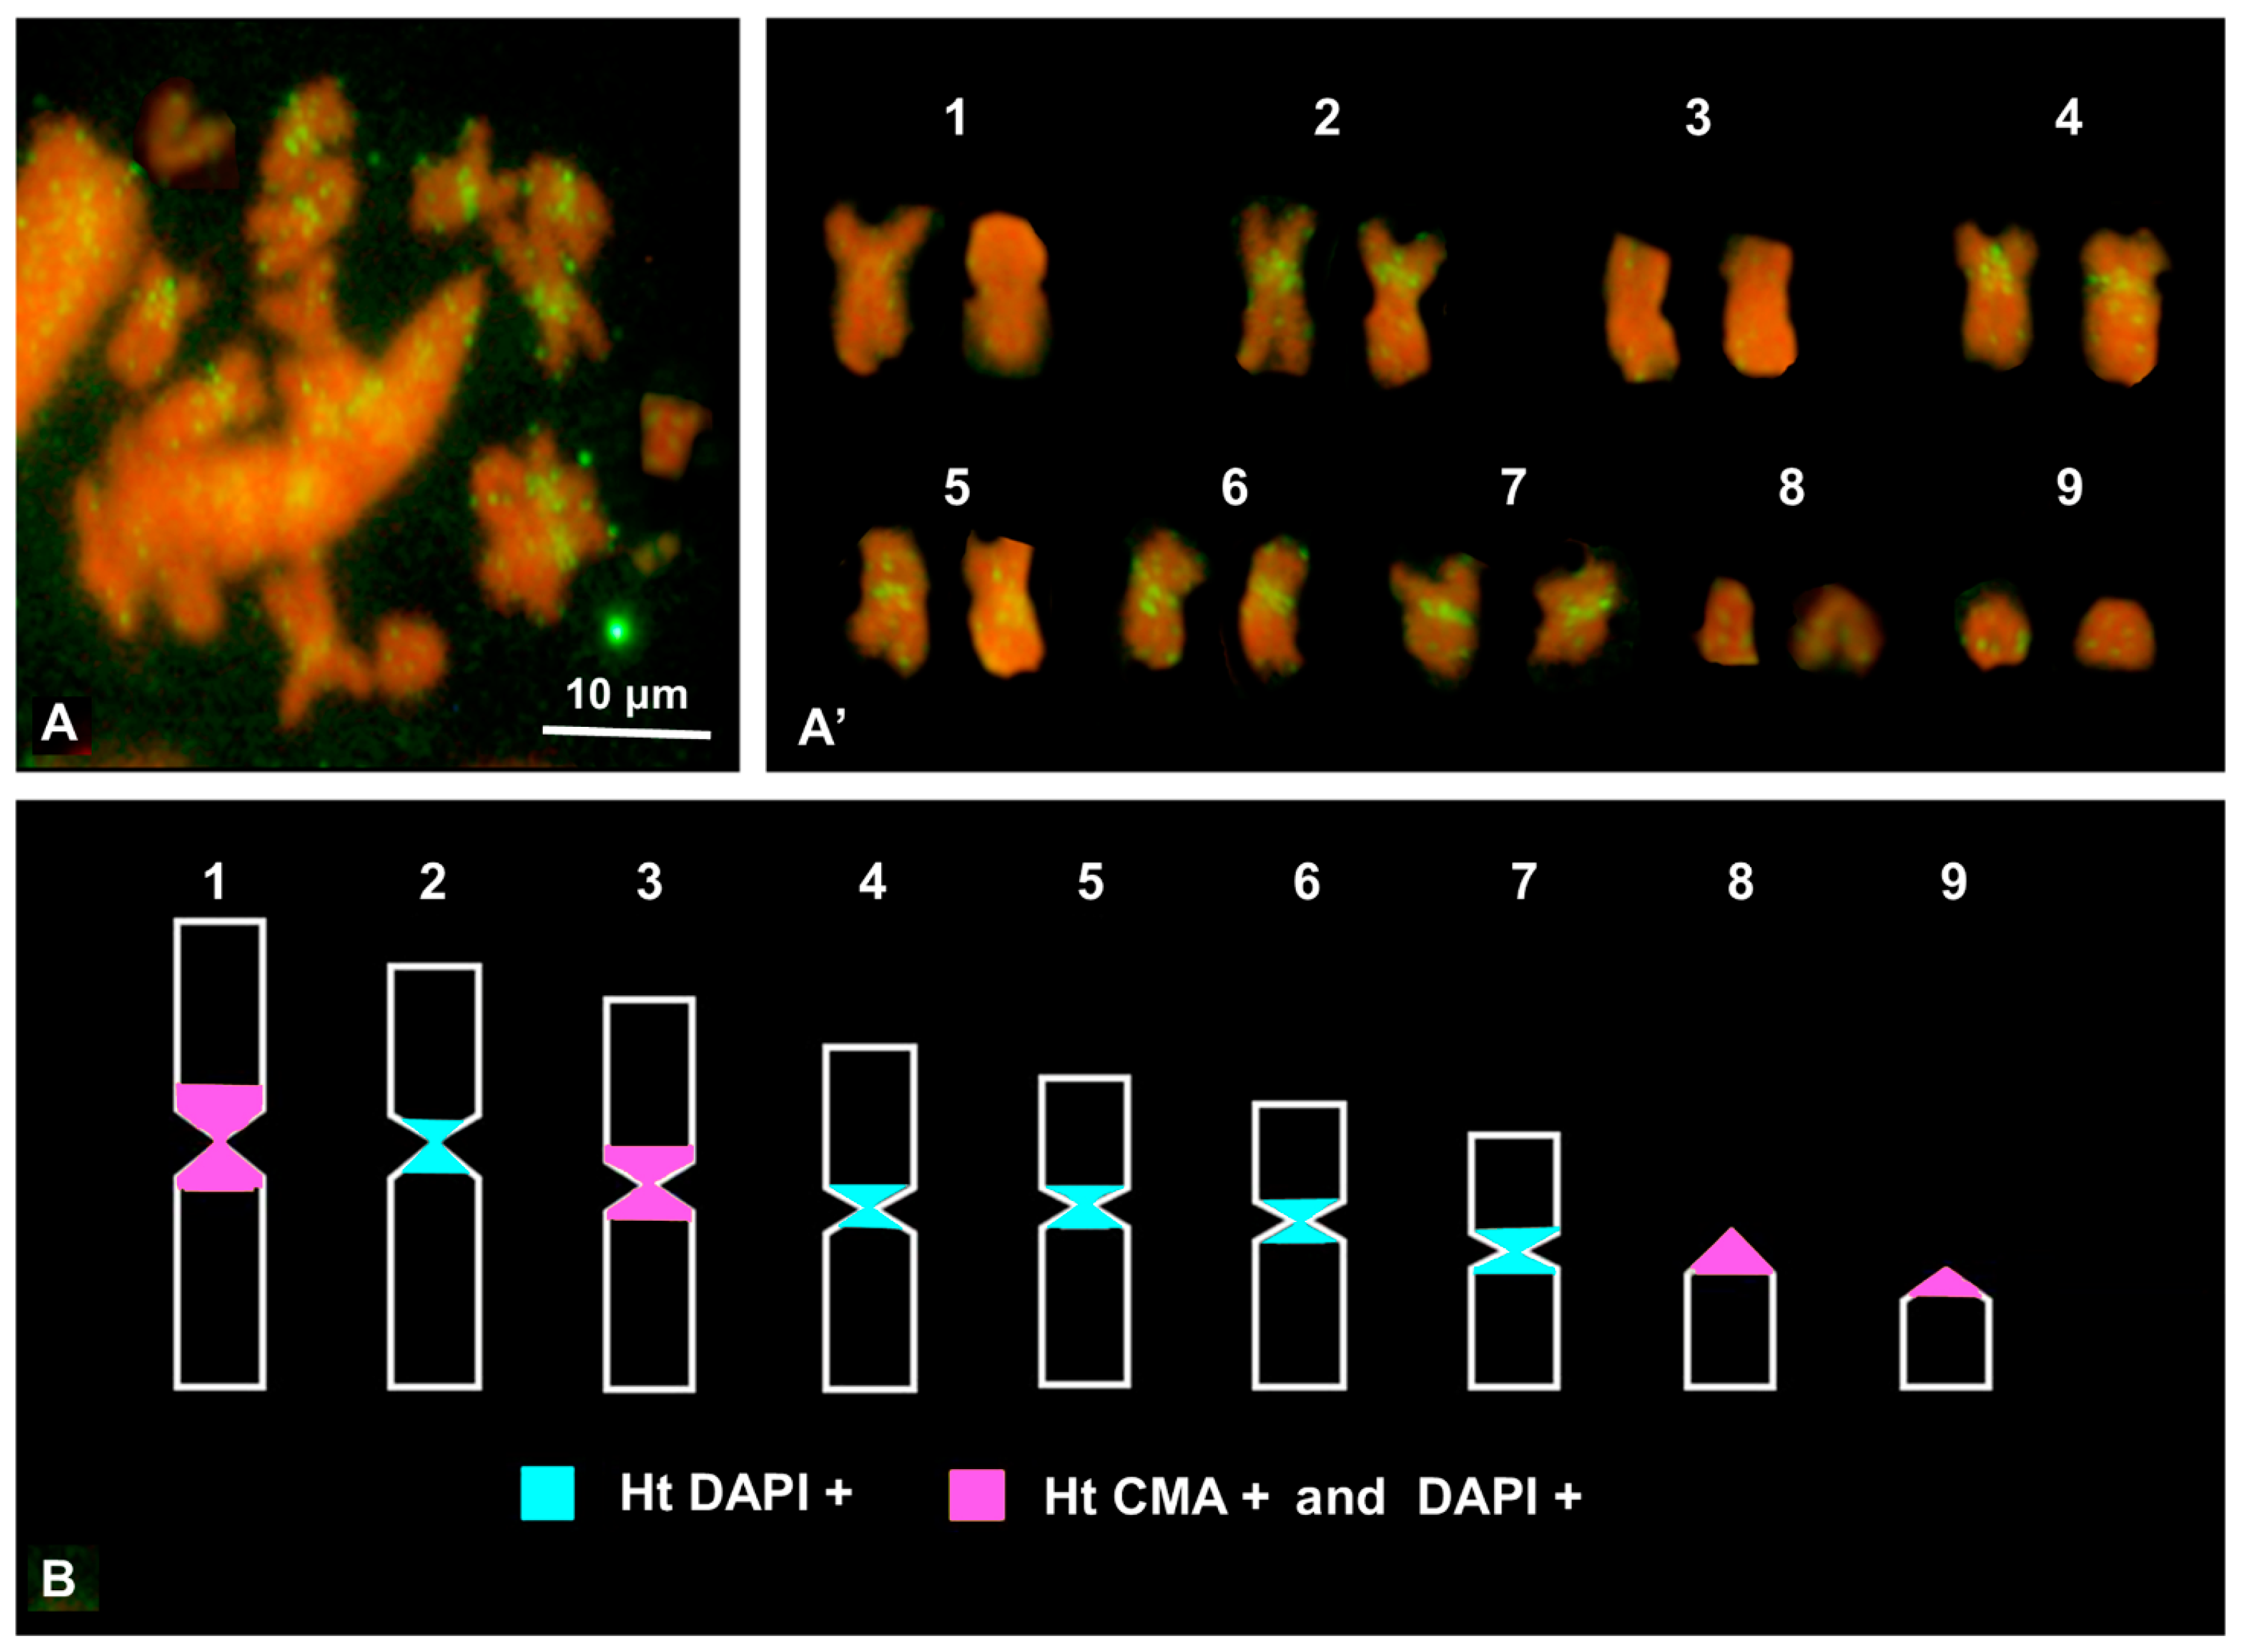
In the dot blot analysis, we compared the density of the dilutions of the genomic hybridization of each studied Patella species against scalar quantities of the clone of PcH-sat (100%, 50%, 25%, 12.5%, 6.25%, and 0.32% of the PcH-sat clone). To calculate the genomic quantity (in %) of PcH-sat in the genome of the study samples, the selected clone percentage was divided by 10, because the quantity of the genomic DNA is 10 times (1 mcg) higher of that of the clone (0.1 mcg).
Based on the quantitative dot blot analyses (Figure 3), PcH-sat accounts for about 10% of the genome of P. caerulea, 5% of P. depressa, 2% of P. rustica, 1.2% of P. vulgata, 0.3% of P. ulyssiponensis, and less than 0.3% of P. ferruginea. The copy number of PcH-sat was evaluated on the genome size (GS) of P. caerulea, which has been determined in this work as GS = 1.09 pg/N, and P. depressa, whose GS ranges from 0.95 to 1.46 pg/N as evaluated by [48] in their draft genome assembly analysis on the species. Therefore, PcH-sat is present with about 600,000 copies in the genome of P. caerulea, and with about 60,000–90,000 copies in P. depressa (according to the minimum and maximum GS values estimated by [48].

3.4. FISH

Metaphase chromosome plates, suitable for FISH, were available only from the gonads of P. caerulea. There were abundant hybridization signals on the pericentromeric regions of metacentric pairs 2 and 4–7, which then colocalized with the distribution of DAPI + heterochromatin [2] (Figure 4A,B). In addition, interspersed signals were observed along both arms of all chromosomes (Figure 4A,A′).

3.5. Repeatmasker and Repbase Queries
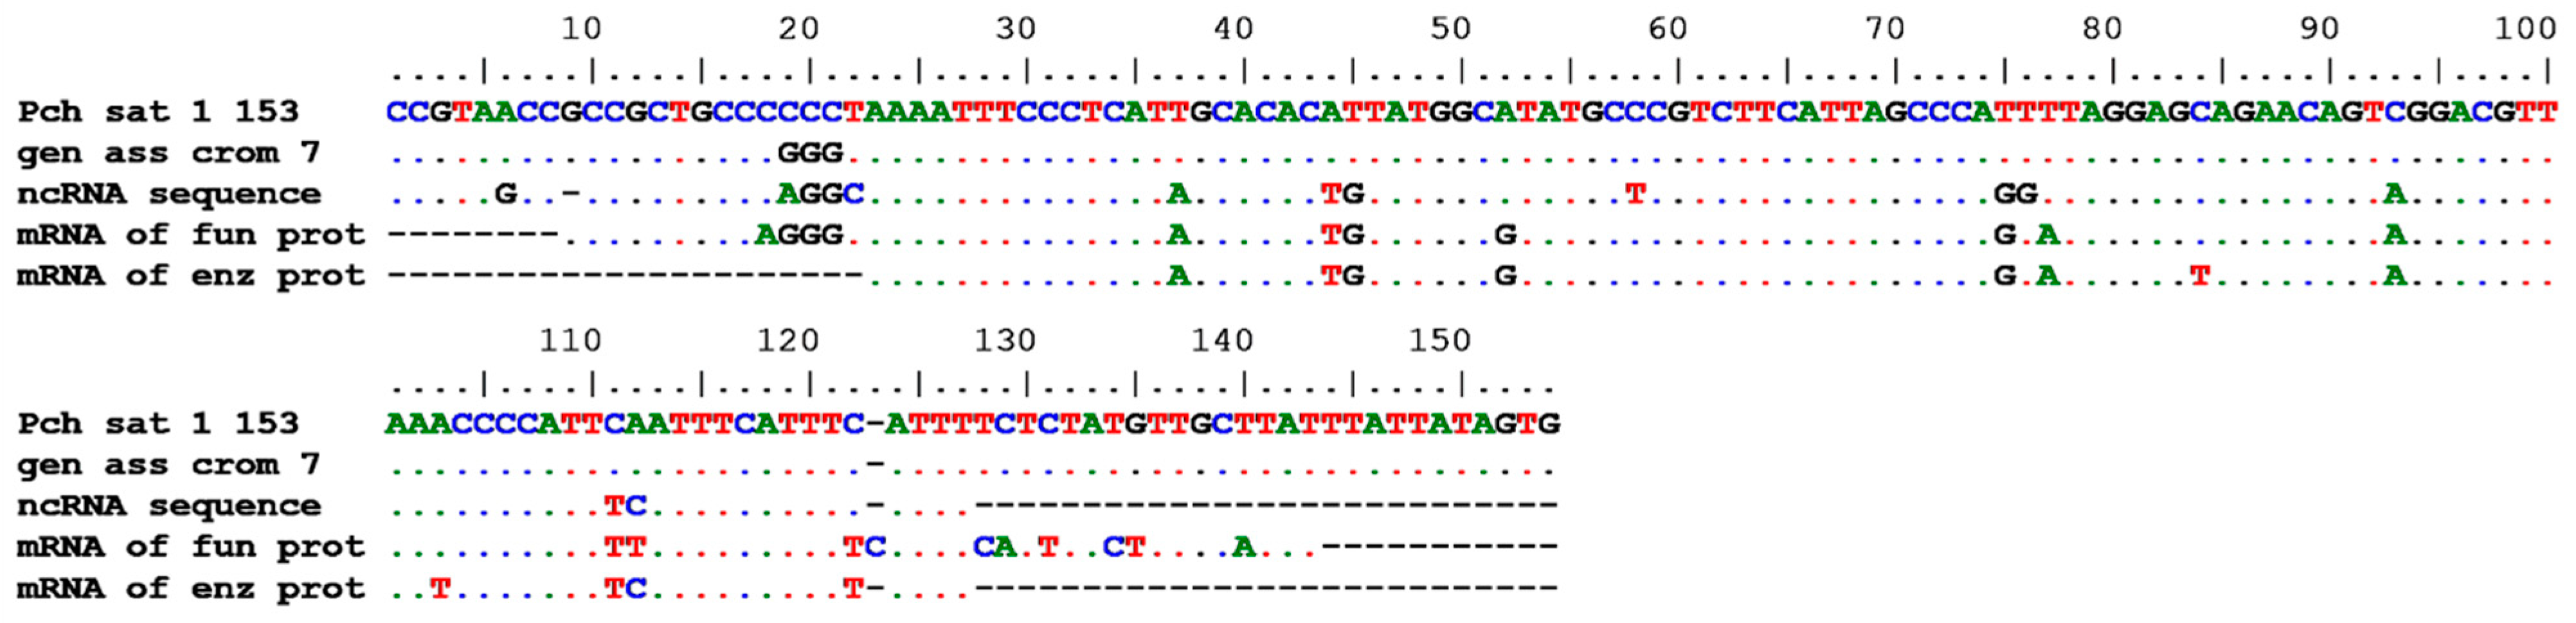
The search in Repeatmasker did not produce hits, evidencing the lack of simple repeats in PcH-sat.
The query in the Giri Repbase database evidenced a trait of 118 bp (from 8 to 127) of PcH-sat, showing an identity of 84.6% (score 650; direction +/+) with a homologous segment of the Non-LTR Retrotransposon SINE2/tRNA Nin-SINE of the patellogastropod Lottia gigantea G. B. Sowerby I, 1834 [49]. In Figure 5, we show the alignment between clone 2 of PcH-sat of P. caerulea and the whole Nin-Sine sequence of L gigantea (369 bp long, with evidence of Box A and Box B for DNA polymerase PolIII and the Nin domain). PcH-sat contains a large 3′ truncation of the Nin-SINE of L. gigantea (from 253 to 377 bp; identity 90.3%). Furthermore, only a short 5′ segment of PcH-sat (26 bp) shows identity (83.7%) with the Nin domain of the Nin-SINE of L. gigantea [49] (Figure 5).

3.6. BLAST Analysis

The query to n/r collections with filters at 70% identity and 70% cover produced 83 hits: 27 of these were for the genome assembly sequences of chromosomes 1–9 of P. depressa, P. pellucida, and P. vulgata; 55 hits were for the nuclear RNAs and transcript mRNAs of structural and functional proteins of P. vulgata; and 1 hit was for a microsatellite region of P. ferruginea. All the hits covered the region from 1 to 153 of PcH-sat. In Figure 6 is shown the alignment among segments 1–153 of PcH-sat, a homologous region of the genome assemblies of P. depressa chromosome 7, and the ncRNAs and structural and functional mRNAs of P. vulgata.
The search in the WGS of Patella (taxid 6463), with filters set for cover and identity > 70%, produced 2318 hits, of which 29 were for P. caerulea, 357 were for P. depressa, 720 were for P. pellucida, 557 were for P. ulyssiponensis, and 669 were for P. vulgata ([50], direct submission by the Wellcome Sanger Tree of Life Programme). The query extended in Mollusca only retrieved hits in the deposited WGS Patellogastropoda assemblies, namely of the Lottidae family (L. scabra (Gould, 1846), 111 hits; L. gigantea, 113; and Nipponacmea schrenkii (Lischke, 1868)) 16 hits ([17]; Dawson et al., direct submission; Qu. and Wang, direct submission) (see Table 2). The alignment of the PcH-sat sequence of P. caerulea vs. the homologous trait of the first hits of the deposited WGS archives of Patella, Lottia, and N. schrenkii species is shown in Figure 7.
The query with the PcH-sat of P. caerulea to Blastx did not produce hits.

4. Discussion

Studies of sat-DNAs in molluscs are fragmentary and relative to a small number of species, mostly bivalves, because of their economic importance and relevant roles in marine environments (reviewed by [51]). This kind of analysis in gastropods is rarely performed and only one study is reported in the literature, with gradient density centrifugation methods applied to the DNA of the muricid Rapana venosa (Valenciennes, 1846), formerly R. thomasiana Crosse, 1861 [52]. The isolated sat-DNA in the murid species was about 5% of the genome, AT-rich, and with monomeric units of 1460 bp, which probably originated from an ancestral 400–500 bp long sequence [52]. The sat-DNA isolated here from Patella carulea, named PcH-sat, only shares a relatively AT-rich content (about 59%), while its monomeric units are much shorter in length than the sat-DNA of R. venosa and its supposed ancestral sequence.
We are inclined to classify PcH-sat as a centromeric sat-DNA, based on its monomeric length (179 bp), high AT content, and the presence of regions of five or six adenines/thymines repeated in phase. These sat-DNAs mostly localize in centromeric or pericentromeric heterochromatin, and the presence of blocks of five or six adenines repeated in phase have been frequently reported to be involved in heterochromatin condensation [31,38,53,54]. Finally, FISH results definitively localize PcH-sat in the centromeric/pericentromeric regions of five out nine chromosomes of P. caerulea (see Figure 4). The interspersed hybridization signals were probably due to the truncated segment of the Nin-SINE elements of L. gigantea occurring in all chromosomes (see also below). This situation mirrors that of Cg170/HindIII satDNA of Crassostrea gigas, where FISH analyses showed its localization in centromeric regions of several chromosome pairs as well as interspersed signals on all chromosomes [55]. Interestingly, Tunjić Cvitanić et al. [33,34] recently proposed that signal interspersion was related to the activity of TEs, in particular of Helitrons.
The Southern blot analysis, besides the tandem organization characteristic of sat-DNAs, showed that PcH-sat is mostly present in monomeric or dimeric units in P. caerulea, P. depressa, and P. ulyssiponensis, suggesting a strong conservation of the HaeIII restriction site and that events of deletion/insertion seem to be excluded and or minimized in the monomers in the PcH-sat of the three scallop species.
The dot blot results evidence that PcH-sat is present in the genomes of P. caerulea, P. depressa, and P. ulyssiponensis, respectively, for about 10%, 1.2%, and 0.3%. Based on the genome size of GS = 1.09 pg/N, here determined for the former species, and the GS = 0.95–1.46 for P. depressa, as evaluated by [48], the copy numbers were 600,000 in P. caerulea and 60,000–90,000 in P. depressa. The amounts resulting from the relative signals interspersed along the chromosomes must be deducted from these percentages. However, the quantitative percentages of PcH-sat in P. depressa and P. ulyssiponensis are in accordance with those revealed in bivalve mollucs, while Pch-sat in P. caerulea can be considered an abundant sat-DNA, lower only than the genome percentage (20%) of PjHhaI sat-DNA isolated by [39] in the scallops Pecten jacobaeus and P. maximus [51]. In addition to multimeric bands, smeared hybridization signals were also evidenced in P. caerulea, P. depressa, P. ulyssiponensis, P. ferruginea, P. rustica, and P. vulgata. The smeared signals are not due to PcH-sat, but to its segment showing high identity with the homologous trait of Nin-SINE of L. gigantea [49]. The latter is also responsible for the direct PCR amplicons obtained here in study limpet species, because the primer pair used includes the Nin-SINE segment. Similarly, this TE is also responsible for the positive hits obtained from the BLAST queries in the WGS of deposited assemblies of Archaegastropoda species (see Table 2). The differences between the number of PcH-sat sequences reported in WGS (see Table 2) and the quantification obtained here with the dot blot analysis in P. caerulea, P. depressa, and P. ulyssiponensis are probably due to the omission of repeated sequences in the WGS assemblies [30,31,32,33].
Nin-SINE- in L. gigantea was first studied by Piskurek and Jackson [49], who exhaustively described the conservation and evolution in Metazoans of the Nin domain. This TE penetrated the genome of the common ancestor of Patella, and vertical inheritance and its transposition activity deeply modified the genome of this genus of Patellogastropoda. The queries in Refseq-RNA and n/r sequence collection evidenced that truncated Nin-SINE copies of L. gigantea are transcribed, but not translated, resulting in their presence in the mRNAs of both structural and functional proteins of P. depressa, P. pellucida, and P. vulgata (see Figure 6). It should be noted that a significant role in the variability and evolution of the concerned genome has also been documented for other kinds of SINE elements. For example, RUDI SINE and SINE-Squam1 deeply affected the genome of molluscs and squamates, respectively [56,57,58].
In our case, the truncated segment of Nin-SINE of L. gigantea in PcH-sat is a non-active element because it lacks Box A and Box B for polIII. However, the occurrence and amplification of PcH-sat is clearly linked to Nin-SINE, supporting the hypothesis that the origin of sat-DNAs is mediated by TEs [23,38,59].
In fact, there is increasing evidence that TEs facilitate the dispersion of sat-DNA repeats and their tandem arrangement (tandemization), and different hypotheses have been proposed [59,60]. One of these involves Helitrons, which are able to incorporate variable numbers of tandem repeats and mediate their dispersion and amplification by rolling-circle replication events. In contrast, a different hypothesis reports the capture of sat-DNA sequences by a TE, while its following transposition cycles increase the genomic occurrence of monomeric units and tandem repeats, finally producing the classically observed repeated structure of sat-DNAs (for details see [23]).
Whatever the mechanism involved is, it could be hypothesized that in Patella the tandemization of Nin-SINE, like L. gigantea sequences, and the origin of PcH-sat occurred in the common ancestor of this genus of Patellogastropoda with its successive conservation (in P. caerulea, P. depressa, and P. ulyssiponensis) or loss (as in P. ferruginea, P. vulgata, and P. rustica). Alternatively, based on the phylogenetic relationships of the genus Patella by Sá-Pinto et al. [11], the studied species of Patella are in different clades, namely, (((P.caerulea, P. depressa) ((P. ulyssiponensis, P. vulgata) (P. rustica, P. ferruginea))), suggesting that the tandemization and growth of PcH-sat originated independently in the different species. The events of tandemization producing a genomic augmentation of PcH-sat were dependent on specific genomic properties allowing the tandemization process. Interestingly, the FISH results in P. caerulea also suggest that the events of tandemization, rise, and expansion in PcH-sat can occur only on specific chromosome regions. In fact, PcH-sat is only present on the pericentromeric regions of chromosomes 2 and 4–7, incidentally overlapping with heterochromatin positive to DAPI, and not on the pericentromeric regions of other chromosomes, which contain a heterochromatin positive to Chromomycin A3 and DAPI [2]. Interestingly, in other chromosomal regions of P. caerulea the process of tandemization of PcH-sat is hampered and this correlates with the very scarce presence of Nin-SINE of L. gigantea segments (some tens based on the query in WGS assembly with filters at 70% cover and identity). The low copy number of truncated Nin-SINE probably is a consequence of the ‘purifying selection’ process against TEs [60,61,62]. This process of purification is very effective in chromosomal regions other than those in the pericentromeric areas of chromosomes 2 and 4–7. In these pericentromeric regions, TE taming [63,64] appears loose and probably allowed the tandemization of PcH-sat. The processes of TE taming and tandemization also appear to vary in the different species. In fact, compared to P. caerulea, the copy number of PcH-sat appears to be much lower in P. depressa and P. ulyssiponensis, while the number of truncated Nin-SINEs is much higher (see Table 2).
Further bioinformatic, molecular, and cytogenetic analyses should be performed in order to provide an adequate description of the satellitome in the genus Patella as well as in other mollusc taxa.

Author Contributions

Conceptualization, G.O. and A.P.; methodology, A.P., G.O. and N.M.; validation, A.P. and G.O.; formal analysis, A.P. and G.O.; data curation, G.O. and F.M.G.; writing—original, G.O. and F.M.G.; writing—review and editing, G.O., F.M.G. and R.C.; supervision G.O., F.M.G. and R.C. All authors have read and agreed to the published version of the manuscript.

Funding

This research received no external funding.

Institutional Review Board Statement

Not applicable.

Informed Consent Statement

Not applicable.

Data Availability Statement

No new data were created or analysed in this study. Data sharing is not applicable to this article.

Acknowledgments

We are grateful to Marcello Mezzasalma for the theoretical support given to this study and Michela Castellano for her technical assistance. Many thanks are due to the reviewers for their comments and constructive criticism of the manuscript.

Conflicts of Interest

The authors declare no conflicts of interest.

References

  1. WoRMS. Editorial Board. World Register of Marine Species. Available online: https://www.marinespecies.org (accessed on 14 March 2023).
  2. Petraccioli, A.; Guarino, F.M.; Maio, N.; Odierna, G. Molecular cytogenetic study of three common Mediterranean limpets, Patella caerulea, P. rustica and P. ulyssiponensis, Archaeogastropoda, Mollusca. Genetica 2010, 138, 219–225. [Google Scholar] [CrossRef] [PubMed]
  3. Cascales-Soler, A.; Ramos-Espla, A.A.; Forcada, A. Reviewing the knowledge on the genus Patella in the Mediterranean Sea: Testing the effect of protection on the mean abundance and size of Patella ferruginea. Front. Mar. Sci. 2023, 10, 158470. [Google Scholar] [CrossRef]
  4. Guallart, J.; Templado, J. Patella ferruginea. En: VV.AA., Bases ecológicas preliminares para la conservación de las especies de interés comunitario en España: Invertebrados. In Ases Ecológicas Preliminares para la Conservación de las Especies de Interés Comunitario en España: Invertebrados; Ministerio de Agricultura, Alimentación y Medio Ambiente: Madrid, Spain, 2012; p. 86. [Google Scholar]
  5. UNEP/MAP; SPA/RAC. Annex II: List of Endangered or Threatened Species; SPA-BD Protocol; SAP/RAC: Tunis, Tunisia, 2018. [Google Scholar]
  6. Guerra-García, J.M.; Corzo, J.; Espinosa, F.; García-Gómez, J.C. Assessing habitat use of the endangered marine mollusc Patella ferruginea (Gastropoda, Patellidae) in northern Africa: Preliminary results and implications for conservation. Biol. Conserv. 2004, 116, 319–326. [Google Scholar] [CrossRef]
  7. Bresler, V.; Abelson, A.; Fishelson, L.; Feldestein, T.; Rosenfeld, M.; Mokady, O. Marine molluscs in environmental monitoring. I. Cellular and molecular responses. Helgol. Mar. Res. 2003, 57, 157–165. [Google Scholar] [CrossRef]
  8. Cravo, A.; Bebianno, M.J. Bioaccumulation of metals in the soft tissue of Patella aspera: Application of metal/shell weight indices. Estuar. Coast. Mar. Sci. 2005, 65, 571–586. [Google Scholar] [CrossRef]
  9. Pérez, S.; Sánchez-Marín, P.; Bellasc, J.; Viñas, L.; Besada, V.; Fernández, N. Limpets (Patella spp. Mollusca, Gastropoda) as model organisms for biomonitoring environmental quality. Ecol. Indic. 2019, 101, 150–162. [Google Scholar] [CrossRef]
  10. Koufopanou, V.; Reid, D.G.; Ridgway, S.A.; Thomas, R.H. A molecular phylogeny of the patellid limpets (Gastropoda: Patellidae) and its implications for the origins of their antitropical distribution. Mol. Phylogenet. Evol. 1999, 11, 138–156. [Google Scholar] [CrossRef]
  11. Sá-Pinto, A.; Branco, M.; Harris, D.-J.; Alexandrino, P. Phylogeny and phylogeography of the genus Patella based on mitochondrial DNA sequence data. J. Exp. Mar. Biol. Ecol. 2005, 325, 95–110. [Google Scholar] [CrossRef]
  12. Sá-Pinto, A.; Branco, M.; Sayanda, D.; Alexandrino, P. Patterns of colonization, evolution and gene flow in species of the genus Patella in the Macaronesian Islands. Mol. Ecol. 2008, 17, 519–532. [Google Scholar] [CrossRef]
  13. Casu, M.; Casu, D.; Lai, T.; Cossu, P.; Curini-Galletti, M. Inter-simple sequence repeat markers reveal strong genetic differentiation among populations of the endangered mollusc Patella ferruginea (Gastropoda: Patellidae) from two Sardinian marine protected areas. Mar. Biol. 2006, 149, 1163–1174. [Google Scholar] [CrossRef]
  14. Casu, M.; Rivera-Ingraham, G.A.; Cossu, P.; Lai, T.; Sanna, D.; Dedola, G.L.; Sussarellu, R.; Sella, G.; Cristo, B.; Curini-Galletti, M.; et al. Patterns of spatial genetic structuring in the endangered limpet Patella ferruginea: Implications for the conservation of a Mediterranean endemic. Genetica 2011, 139, 1293–1308. [Google Scholar] [CrossRef] [PubMed]
  15. Faria, J.; Pita, A.; Rivas, M.; Martins, G.M.; Hawkins, S.J.; Ribeiro, P.; Neto, A.I.; Presa, P. A multiplex microsatellite tool for conservation genetics of the endemic limpet Patella candei in the Macaronesian archipelagos. Aquat. Cons. 2016, 26, 775–781. [Google Scholar] [CrossRef]
  16. Quinteiro, J.; ·González-Lorenzo, G.; Hernández-Reyes, D.; Quinteiro, L.; Herrera-Pérez, R.; Martínez-Barrio, J.; González, J.-A.; Rey-Méndez, M.; González-Henríquez, N. Genetic differentiation of a critically endangered population of the limpet Patella candei candei d’Orbigny, 1840, in the Canary Islands. Conserv. Genet. 2022, 23, 807–819. [Google Scholar] [CrossRef]
  17. Simakov, O.; Marletaz, F.; Cho, S.J.; Edsinger-Gonzales, E.; Havlak, P.; Hellsten, U.; Kuo, D.H.; Larsson, T.; Lv, J.; Arendt, D.; et al. Insights into bilaterian evolution from three spiralian genomes. Nature 2012, 493, 526–531. [Google Scholar] [CrossRef] [PubMed]
  18. Zhang, Y.; Chu, J.; Cheng, H.; Li, H. De novo reconstruction of satellite repeat units from sequence data. Genome Res. 2023, 33, 1994–2001. [Google Scholar] [CrossRef] [PubMed]
  19. Cervella, P.; Ramella, L.; Robotti, C.A.; Sella, G. Chromosome analysis of three species of Patella (Archaeogastropoda). Genetica 1988, 77, 97–103. [Google Scholar] [CrossRef]
  20. John, B.E.; Miklos, G.L.G. Functional aspects of satellite DNA and heterochromatin. Int. Rev. Cytol. 1979, 58, 1–114. [Google Scholar] [CrossRef]
  21. Singer, M.F. Highly repeated sequences in mammalian genomes. Int. Rev. Cytol. 1982, 67, 67–112. [Google Scholar] [CrossRef] [PubMed]
  22. Mezzasalma, M.; Andreone, F.; Glaw, F.; Guarino, F.M.; Odierna, G.; Petraccioli, A.; Picariello, O. Changes in heterochromatin content and ancient chromosome fusion in the endemic Malagasy boid snakes Sanzinia and Acrantophis (Squamata: Serpentes). Salamandra 2019, 55, 140–144. [Google Scholar]
  23. Šatović-Vukšić, E.; Plohl, M. Satellite DNAs—From localized to highly dispersed genome components. Genes 2023, 14, 742. [Google Scholar] [CrossRef]
  24. Miklos, G.L.G. Localized highly repetitive DNA sequences in vertebrate and invertebrate genomes. In Molecular Evolutionary Genetics; Maclntyre, R.J., Ed.; Plenum Press: New York, NY, USA, 1985; pp. 241–321. [Google Scholar]
  25. Redi, C.A.; Garagna, S.; Zacharias, H.; Zuccotti, M.; Capanna, E. The other chromatin. Chromosoma 2001, 110, 136–147. [Google Scholar] [CrossRef] [PubMed]
  26. Feliciello, I.; Pezer, Ž.; Kordiš, D.; Bruvo Mađarić, B.; Urđica, Đ. Evolutionary History of Alpha Satellite DNA Repeats Dispersed within human genome euchromatin. Genome Biol. Evol. 2020, 12, 2125–2138. [Google Scholar] [CrossRef] [PubMed]
  27. Altemose, N.; Logsdon, G.-A.; Bzikadze, A.V.; Sidhwani, P.; Langley, S.A.; Caldas, G.V.; Hoyt, S.J.; Uralsky, L.; Ryabov, F.D.; Shew, C.J.; et al. Complete genomic and epigenetic maps of human centromeres. Science 2022, 376, eabl4178. [Google Scholar] [CrossRef] [PubMed]
  28. Doolittle, W.F.; Sapienza, C. Selfish genes, the phenotype paradigm and genome evolution. Nature 1980, 284, 601–603. [Google Scholar] [CrossRef] [PubMed]
  29. Orgel, L.E.; Crick, F.H.C. Selfish DNA: The ultimate parasite. Nature 1980, 284, 604–607. [Google Scholar] [CrossRef] [PubMed]
  30. Phillippy, A.M. New advances in sequence assembly. Genome Res. 2017, 27, xi–xiii. [Google Scholar] [CrossRef] [PubMed]
  31. Lower, S.S.; McGurk, M.P.; Clark, A.G.; Barbash, D.A. Satellite DNA evolution: Old ideas, new approaches. Curr. Opin. Genet. Dev. 2018, 49, 70–78. [Google Scholar] [CrossRef] [PubMed]
  32. Sedlazeck, F.J.; Lee, H.; Darby, C.A.; Schatz, M.C. Piercing the Dark Matter: Bioinformatics of Long-Range Sequencing and Mapping. Nat. Rev. Genet. 2018, 19, 329–346. [Google Scholar] [CrossRef] [PubMed]
  33. Tunjić Cvitanić, M.; Vojvoda Zeljko, T.; Pasantes, J.J.; García-Souto, D.; Gržan, T.; Despot-Slade, E.; Plohl, M.; Šatović, E. Sequence composition underlying centromeric and heterochromatic genome compartments of the Pacific Oyster Crassostrea gigas. Genes 2020, 11, 695. [Google Scholar] [CrossRef]
  34. Tunjić Cvitanić, M.; Pasantes, J.J.; García-Souto, D.; Cvitanić, T.; Plohl, M.; Šatović -Vukšić, E. Satellitome Analysis of the Pacific Oyster Crassostrea gigas reveals new pattern of Satellite DNA organization, highly scattered across the Genome. Int. J. Mol. Sci. 2021, 22, 6798. [Google Scholar] [CrossRef]
  35. Kunyavskaya, O.; Dvorkina, T.; Bzikadze, A.V.; Alexandrov, I.A.; Pevzner, P.A. Automated annotation of human centromeres with HORmon. Genome Res. 2022, 32, 1137–1151. [Google Scholar] [CrossRef] [PubMed]
  36. Gao, S.; Yang, X.; Guo, H.; Zhao, X.; Wang, B.; Ye, K. HiCAT: A tool for automatic annotation of centromere structure. Genome Biol. 2023, 24, 58. [Google Scholar] [CrossRef]
  37. Pech, M.; Igo-Kemenes, T.; Zachau, H.G. Nucleotide sequence of a highly repetitive component of rat DNA. Nucleic Acids Res. 1979, 7, 417–432. [Google Scholar] [CrossRef] [PubMed]
  38. Garrido-Ramos, M.A. Satellite DNA: An evolving topic. Genes 2017, 8, 230. [Google Scholar] [CrossRef]
  39. Petraccioli, A.; Odierna, G.; Capriglione, T.; Barucca, M.; Forconi, M.; Olmo, E.; Biscotti, M.A. A novel satellite DNA isolated in Pecten jacobaeus shows high sequence similarity among molluscs. Mol. Genet. Genom. 2015, 290, 1717–1725. [Google Scholar] [CrossRef]
  40. Sokolov, E.P. An improved method for DNA isolation from mucopolysaccharide-rich molluscan tissues. J. Mollusc. Stud. 2000, 66, 573–575. [Google Scholar] [CrossRef]
  41. Picariello, O.; Odierna, G.; Petraccioli, A.; Amor, N.; Feliciello, I.; Chinali, G. Characterization of two major satellite DNAs specific to the genus Discoglossus (Amphibia, Anura). Ital. J. Zool. 2012, 79, 385–394. [Google Scholar] [CrossRef]
  42. Hardie, D.C.; Gregory, T.R.; Hebert, P.D.N. From pixels to picograms, a beginners’ guide to genome quantification by Feulgen image analysis densitometry. J. Histochem. Cytochem. 2002, 50, 735–749. [Google Scholar] [CrossRef]
  43. Gregory, T.R. Animal Genome Size Database. Available online: http://www.genomesize.com (accessed on 14 March 2023).
  44. Mezzasalma, M.; Andreone, F.; Aprea, G.; Glaw, F.; Odierna, G.; Guarino, F.M. When can chromosomes drive speciation? The peculiar case of the Malagasy tomato frogs (genus Dyscophus). Zool. Anz. 2017, 268, 41–46. [Google Scholar] [CrossRef]
  45. Bao, W.; Kojima, K.K.; Kohany, O. Repbase Update, a database of repetitive elements in eukaryotic genomes. Mobile DNA 2015, 6, 11. [Google Scholar] [CrossRef]
  46. Smit, A.F.A.; Hubley, R.; Green, P. RepeatMasker Open-4.0. 2013–2015. Available online: http://www.repeatmasker.org (accessed on 14 March 2023).
  47. Altschul, S.F.; Gish, W.; Miller, W.; Myers, E.W.; Lipman, D.J. Basic local alignment search tool. J. Mol. Biol. 2020, 215, 403–410. [Google Scholar] [CrossRef] [PubMed]
  48. Kenny, N.J.; Namigai, E.K.O.; Marlétaz, F.; Hui, J.H.L.; Shimeld, S.M. Draft genome assemblies and predicted microRNA complements of the intertidal lophotrochozoans Patella vulgata, Mollusca, Patellogastropoda and Spirobranchus (Pomatoceros) lamarcki. Annelida, Serpulida. Mar. Genom. 2015, 24, 139–146. [Google Scholar] [CrossRef] [PubMed]
  49. Piskurek, O.; Jackson, D.J. Tracking the ancestry of a deeply conserved eumetazoan SINE domain. Mol. Biol. Evol. 2011, 28, 2727–2730. [Google Scholar] [CrossRef] [PubMed]
  50. Halstead-Nussloch, G.; Signorini, S.G.; Giulio, M.; Crocetta, F.; Munari, M.; Della Torre, C.; Weber, A.A.-T. The genome of the rayed Mediterranean limpet Patella caerulea (Linnaeus, 1758). Genome Biol. Evol. 2024, 1, evae070. [Google Scholar] [CrossRef] [PubMed]
  51. Šatović, E.; Vojvoda Zeljko, T.; Plohl, M. Characteristics and evolution of satellite DNA sequences in bivalve mollusks. Eur. Zool. J. 2018, 85, 94–103. [Google Scholar] [CrossRef]
  52. Markova, N.G.; Markov, G.G. Complex organization of a cryptic satellite DNA in the genome of the marine invertebrate Rapana thomasiana Grosse (Gastropoda). Biochim. Biophys. Acta 1983, 741, 7–14. [Google Scholar] [CrossRef] [PubMed]
  53. Biscotti, M.A.; Canapa, A.; Olmo, E.; Barucca, M.; Teo, C.H.; Schwarzacher, T.; Dennerlein, S.; Richter, R.; Heslop-Harrison, J.S. Repetitive DNA, molecular cytogenetics and genome organization in the king scallop (Pecten maximus). Gene 2007, 406, 91–98. [Google Scholar] [CrossRef] [PubMed]
  54. Levitsky, V.G.; Babenko, V.N.; Vershinin, A.V. The roles of the monomer length and nucleotide context of plant tandem repeats in nucleosome positioning. J. Biomol. Struct. Dynam. 2014, 32, 115–126. [Google Scholar] [CrossRef] [PubMed]
  55. Wang, Y.; Xu, Z.; Guo, X. A Centromeric satellite sequence in the Pacific Oyster (Crassostrea gigas Thunberg) Identified by Fluorescence In Situ Hybridization. Mar. Biotechnol. 2001, 3, 486–492. [Google Scholar] [CrossRef] [PubMed]
  56. Piskurek, O.; Austin, C.C.; Okada, N. Sauria SINEs: Novel short interspersed retroposable elements that are widespread in reptile genomes. J. Mol. Evol. 2006, 62, 630–644. [Google Scholar] [CrossRef]
  57. Luchetti, A.; Šatović, E.; Mantovani, B.; Plohl, M. RUDI, a short interspersed element of the V-SINE superfamily widespread in molluscan genomes. Mol. Genet. Genom. 2016, 291, 1419–1429. [Google Scholar] [CrossRef] [PubMed]
  58. Petraccioli, A.; Guarino, F.M.; Kupriyanova, L.; Mezzasalma, M.; Odierna, G.; Picariello, O.; Capriglione, T. Isolation and characterization of interspersed repeated sequences in the Common Lizard, Zootoca vivipara, and their conservation in Squamata. Cytogenet. Genome Res. 2019, 157, 65–76. [Google Scholar] [CrossRef] [PubMed]
  59. Paço, A.; Freitas, R.; Vieira-da-Silva, A. Conversion of DNA sequences: From a transposable element to a tandem repeat or to a gene. Genes 2019, 10, 1014. [Google Scholar] [CrossRef] [PubMed]
  60. McGurk, M.P.; Barbash, D.A. Double insertion of transposable elements provides a substrate for the evolution of satellite DNA. Genome Res. 2018, 28, 714–725. [Google Scholar] [CrossRef] [PubMed]
  61. Tollis, M.; Boissinot, S. The transposable element profile of the Anolis genome: How a lizard can provide insights into the evolution of vertebrate genome size and structure. Mob. Genet. Elem. 2011, 1, 107–111. [Google Scholar] [CrossRef]
  62. Mezzasalma, M.; Visone, V.; Petraccioli, A.; Guarino, F.M.; Capriglione, T.; Odierna, G. Non-random accumulation of LINE1 like sequences on differentiated snake W chromosomes. J. Zool. 2016, 300, 65–75. [Google Scholar] [CrossRef]
  63. Mezzasalma, M.; Capriglione, T.; Kupriyanova, L.; Odierna, G.; Pallotta, M.M.; Petraccioli, A.; Picariello, O.; Guarino, F.M. Characterization of two Transposable Elements and an Ultra-Conserved Element isolated in the genome of Zootoca vivipara (Squamata, Lacertidae). Life 2023, 13, 637. [Google Scholar] [CrossRef]
  64. Jensen, S.; Gassama, M.P.; Heidmann, T. Taming of transposable elements by homology dependent gene silencing. Nat. Genet. 1999, 21, 200–212. [Google Scholar] [CrossRef]
Figure 1. (A) A 1.5% agarose gel loaded with 5 μg of DNA of P. caerulea digested with HaeIII; (B) Alignment of two clone sequences of monomeric unit of PcH-sat (underlined segments are the primer pair sequences used to amplify PcH-sat from genomic DNA of studied Patella species and the relative alignment of amplified sequences reported in (C); lower case = primer pair). * = base identity among aligned sequences.
Genes 15 00541 g001
Figure 2. A 1.5% agarose gel (A,C) loaded with 5 µg of DNA of P. caerulea quickly digested with HaeIII (A), and 5 µg of DNA of P. depressa (P.d.), P. vulgata (P.v,), P. rustica (P.r.), P. ferruginea (P.f.), and P. ulyssiponensis (P.u.) digested O.N. with HaeIII (C), and the relative Southern blots probed with biotinylated genomic PcH-sat amplicons of P. caerulea (B,D) (BC = Blank Control).
Genes 15 00541 g002
Figure 3. Quantitative dot blot on scalar DNA amounts (10, 5, 2.5, 1.25, 1, and 0.5 μg) of P. depressa (P.d.), P. ulyssiponensis (P.u.), P. caerulea, P. vulgata (P.v.), P. rustica (P.r.), and P. ferruginea (P.f.) and scalar amounts (1.0, 0.5, 0.25, 0.125, 0.01, and 0.005 μg) of genomic amplicons of P. caerulea probed with the biotinylated clone 2 of PcH-sat of P. caerulea (BC = Blank Control).
Genes 15 00541 g003
Figure 4. Metaphase plate (A) and the relative karyotype (A′) probed with biotinylated genomic PcH-sat amplicons of P. caerulea. (B) Haploid ideogram of the C-banding +CMA + DAPI pattern, here originally redrawn from [2].
Genes 15 00541 g004
Figure 5. Alignment between the consensus sequence of Lgi-Nin-DC-SINE1 of L. gigantea [49] and the sequence of clone 2 of P. caerulea PcH-sat. Red and brown underlined lower-case traits refer to Box A and B for DNA polIII, respectively. The double underlined segment refers to Nin domain of L. gigantea. Colons (:) show transitions.
Genes 15 00541 g005
Figure 6. Alignment among the PcH-sat (from 1 to 153) and homologous traits, from up to down, of the chromosome 7 genome sequence of P. depressa (AN OX419721), an uncharacterized ncRNA of P. vulgata (AN XR_007683079), a nuclear hormone receptor mRNA of P. vulgata (AN XM_050542854), and an ATP-dependent RNA helicase mRNA of P. vulgata.
Genes 15 00541 g006
Figure 7. The alignment of clone 2 PcH-sat sequence of P. caerulea vs. the homologous trait of the first hits of deposited WGS archives of Patella, Lottia, and N. schrenkii species.
Genes 15 00541 g007
Table 1. Number and provenance of the studied samples of Patella.
SpeciesLocalityNumber
P. caeruleaPozzuoli, Naples, Italy3
Gaeta, Latina, Italy2
P. rusticaNisida, Naples, Italy2
Acciaroli, Salerno, Italy1
P. ulyssiponensisGaiola, Naples, Italy2
P. vulgataBaiona, Spain2
Porto, Portugal 1
P. depressaPorto, Portugal2
P. ferrugineaPorticcio, Corse, France1
Table 2. Results of query with clone 2 sequence of PcH-sat to BLAST WGS Patellogastropoda archives, filtered with 70% identity and 70% cover. Below: the alignments of the relative sequences of first hits against the sequence of clone 2 of PcH-sat of P. caerulea.
SpeciesNr. Hits Max Score% CoverE Value% IdentityOrient.Accession
P. caerulea291st hit28598%3.00 × 10−7594129+/−JAZGQO010000021
Last hits23393%2.00 × 10−5993.092+/−JAZGQO010000031
P. depressa3401st hit260100%3.00 × 10−6897.39%+/+CAOLEZ010000010
Last hit81.572%6.00 × 10−1476.58%+/+CAOLEW010000395
P. pellucida7261st hit23399%1.00 × 10−5994.08%+/−CAKJPO010001416 CAKJPO010001283
Last hit59.970%2.00 × 10−773.08%+/−
P. ulyssiponensis5571st hit279100%2.00 × 10−7199.35%+/−CAVMBP010000854
Last hit85.170%5.00 × 10−1579.59+/+CAVMBP010000752
P. vulgata6241st hit16675%2.00 × 10−3988.49%+/−CAKNZQ020000656
Last hit88.775%1.00 × 10−1574.50%+/−CAKNZQ020001418
L. scabra1111st hit12689%2.00 × 10−2785.59%+/−JARJEJ010000003
Last hit94.278%1.00 × 10−1781.90%+/+JARJEJ010000118
L. gigantea1131st hit11370%4.00 × 10−2481.89%+/+AMQO01003418
Last hit63.578%6.00 × 10−971.33%+/−AMQO01000500
N. schrenckii161st hit12986%7.00 × 10−2986.84%+/−JAUJPP010000003
Last hit68.072%2.00 × 10−1078.72%+/−JAUJPP010000958
Disclaimer/Publisher’s Note: The statements, opinions and data contained in all publications are solely those of the individual author(s) and contributor(s) and not of MDPI and/or the editor(s). MDPI and/or the editor(s) disclaim responsibility for any injury to people or property resulting from any ideas, methods, instructions or products referred to in the content.

