Article

Enhancing Soil Aggregate Stability and Organic Carbon in Northwestern China through Straw, Biochar, and Nitrogen Supplementation

1
College of Resources and Environmental Sciences, Gansu Agricultural University, Lanzhou 730070, China
2
State Key Laboratory of Aridland Crop Science, Gansu Agricultural University, Lanzhou 730070, China
*
Author to whom correspondence should be addressed.
Submission received: 21 March 2024 / Revised: 22 April 2024 / Accepted: 23 April 2024 / Published: 25 April 2024
(This article belongs to the Section Soil and Plant Nutrition)

Abstract

:
Enhancing soil stability through the incorporation of straw and biochar is well documented. Nevertheless, the combined impact of straw, biochar, and nitrogen supplementation on soil aggregates and organic carbon still needs to be explored, with limited attention given to various sieving methods in the existing literature. Therefore, the current experiment used four sieving methods—routine wet sieving (RoutW), fast-wetting sieving (FastW), slow-wetting sieving (SlowW), and wetting–stirring sieving (WetS)—to investigate the effects of adding straw (0 or 4.5 t ha−1), biochar (from maize straw, 0 or 15 t ha−1), and N (0 or 100 kg ha−1) on soil aggregate stability and soil organic C in silt–loam soil of rainfed farmland in northwest China. The field experiment was started in 2014; soil samples were collected in 2021. The results revealed that straw returned, biochar, and N addition significantly increased soil mean weight diameter (MWD) and soil organic C (SOC). Compared to CN0 (zero-amendment) plots, straw returned with nitrogen addition (SN100) significantly increased the MWD of aggregates by 130.3% (RoutW), 121.66% (FastW), 73.94% (SlowW), and 91.78% (WetS) in the 0–30 cm soil layer. The addition of biochar and nitrogen (BN100) treatment showed the most significant effects on the relative slaking index (RSI), relative mechanical breakdown index (RMI), and SOC; compared with CN0 treatment, BN100 plots can reduce RSI and RMI by 42.90% and 54.66% and increase SOC by 53.27% for all soil layers. Therefore, adding organic materials with N can enhance the stability of soil aggregates and SOC of silt–loam soils in northwest China. Integrating biochar as an organic soil amendment in the agricultural practices of northwest China presents a multifaceted solution that addresses soil health, crop productivity, and environmental sustainability. The current study provides valuable insights that support adopting this innovative approach, paving the way for future sustainable agricultural practices that can benefit both the region and the global community.

1. Introduction

Soil aggregates form essential elements of soil composition, influencing soil fertility in agroecosystems. These serve as important benchmarks in evaluating soil quality [1]. Soils with suitable aggregate structure and quality promote crop and root growth, improving nutrient utilization efficiency and higher yields [2]. The particle size distribution of various aggregates is crucial for maintaining a balanced composition of solid, liquid, and gas phases in the soil [3]. Soil aggregates are crucial components in preserving and safeguarding soil organic carbon (SOC); the preservation of SOC, in turn, promotes the formation of soil aggregates [4]. This intricate relationship underscores the importance of understanding the structural attributes of soil aggregates, as they profoundly influence the stability of SOC. One pivotal metric utilized for assessing this stability is the mean weight diameter (MWD) [5]. A higher MWD value signifies enhanced aggregate stability, reflecting the effectiveness of soil aggregation in storing and preserving SOC. This interconnectedness emphasizes studying soil aggregate properties as critical factors in maintaining soil health and carbon sequestration processes [6]. The stability of soil aggregates can be assessed by their resistance to slaking under pressure from air in soil pores during rapid wetting and their ability to withstand external stresses like raindrop impacts, tillage, and root penetration. The relative slaking index (RSI) indicates aggregate stability under the slaking process, while the relative mechanical breakdown index (RMI) reflects stability under external stresses. Lower RSI and RMI values indicate higher aggregate stability [7].
In recent times, there has been a notable increase in research focusing on the correlation between aggregates and organic carbon within agricultural soils. The primary objective of these studies is to gain insights into how human activities impact soil structure and organic carbon storage. Such research has mainly focused on tillage practices, fertilization, cropping patterns, and straw treatments [8,9,10,11]. An in-depth examination of aggregate stability and the distribution of organic carbon plays a pivotal role in comprehensively assessing soil quality and health. Through this detailed analysis, valuable insights can be gleaned, enabling the provision of informed guidance for sustainable agricultural management practices. By scrutinizing the interplay of these factors, a nuanced understanding of soil dynamics emerges, allowing for targeted interventions to enhance agricultural productivity while ensuring long-term environmental sustainability. The input of organic materials can also change soil aggregates’ SOC contents and distribution ratios, ultimately affecting soil aggregates’ SOC transfers and SOC fixations [12]. As an exogenous organic material, biochar has recently significantly enhanced soil aggregates [13]. Biochar, an inert solid material formed through high-temperature processes, boasts a stable aromatic structure alongside notable carboxylation [14]. Its emergence as a novel fertilizer marks a significant advancement in soil enhancement, capable of enhancing soil’s physical structure. Moreover, biochar is a potent soil amendment, amplifying soil’s carbon sequestration potential. Notably, it fosters the creation of soil aggregates while augmenting both SOC content and its constituent components [15].
Several investigations have highlighted the impact of N effectiveness in soil on regulating microbial growth and respiration [16]. A significant correlation exists between soil N effectiveness and microbial C use efficiency [17]. Adding N to soil can increase soil labile organic C by enhancing soil microbial activity. However, more studies have concluded that a high C/N ratio can increase the size of soil aggregates [18]. N additions will undoubtedly decrease the C/N ratio. Therefore, it is worth exploring its effect on soil aggregates by adding C and N. Several researchers have conducted different studies on the effects of biochar and straw treatment on soil physicochemical properties. The many nutrients in added straw or biochar can improve soil fertility and enhance soil microbial and enzyme activities, thus providing a suitable environment for crop growth and increasing yields [19].
While much research has been conducted on carbon sources in soil aggregates, integrating carbon and nitrogen sources has yet to be explored. This gap in the literature is further emphasized by the predominant use of routine wet sieving methods in these studies, with a conspicuous lack of diversity in sieving techniques. Indeed, other methods, such as fast sieving, slow sieving, and wetting–stirring, are seldom combined or even considered, underscoring the need for a more comprehensive approach. The effect of adding organic materials and N on the RSI and RMI can be further clarified by routine wet sieving, fast sieving, slow sieving, and wetting–stirring methods. Therefore, this study addresses the research gap by incorporating various sieving methods and examining the effects of straw, biochar, and N sources on SOC. Different sieving methods allow a more nuanced understanding of particle size aggregates and SOC proportions. The study also aimed to clarify the stability mechanisms of soil aggregates under the influence of C and N additions, elucidating the specific responses of each organic C to these amendments. It was hypothesized that adding these amendments would positively affect soil aggregate stability, leading to improved structural characteristics and increased sequestration of SOC. Additionally, alterations in the C/N ratio resulting from N addition were expected to induce changes in the size and stability of soil aggregates, possibly causing an increase in aggregate size. Lastly, the study explored the hypothesis that the combined application of biochar and straw with N fertilizer would enhance the composition of soil aggregates, improve soil organic C, stimulate microbial activity, and enhance enzyme functions. The final aim was to provide a scientific basis for establishing a rational fertilizer application system in the northwest China agricultural region.

2. Materials and Methods

2.1. Experimental Site

The Dingxi dry farming experimental station, situated at coordinates 35°28′ N, 104°44′ E and an elevation of 1971 m above sea level, was where the study took place. This station, affiliated with Gansu Agricultural University, is nestled in the Western Loess Plateau, a semi-arid region characterized by rugged terrain and deeply carved valleys. The soil here is predominantly silt–loam, with proportions of sand at 12.03%, silt at 77.33%, and clay at 10.64%, known locally as loessal soil. This type of soil is renowned for its low fertility. In the area where carbon (C) addition experiments were conducted, the pH of the soil in the upper 30 cm layer measured around 8.34. Soil organic carbon (SOC) content stood at 9.25 g kg−1, while total nitrogen (N) and phosphorus (P) content were measured at 1.01 g kg−1 and 0.75 g kg−1, respectively. The climatic conditions observed at the Dingxi station were characterized by an average annual rainfall of 390.9 mm and an annual evaporation rate of 1531 mm, leading to an aridity index of 2.53. Additionally, the region records an annual cumulative temperature exceeding 10 °C at 2239.1 °C, with a mean annual temperature of 6.4 °C. The area also experiences an annual radiation level of 5929 MJ m−2 and approximately 2476.6 h of sunshine throughout the year. Characterized by warm, sunny, and moist summers, the climate plays a significant role in agricultural activities. Soil samples were meticulously collected in August 2021 for analysis. The predominant crop cultivated in this region is spring wheat (Triticum aestivum L.).

2.2. Experimental Design and Treatment Description

The experiment added two carbon sources, specifically biochar and straw, and nitrogen fertilizer in urea (containing 460 g N kg−1). These additions were ordered in a randomized block design with six treatments and three replications. The experimental treatments consisted of CN0, which served as the control with no amendments, and CN100, which involved the application of 100 kg ha−1 of nitrogen annually. BN0, a total of 15 tons per hectare of biochar, was applied in 2014 and 2018. In the BN100 treatment, 15 tons of biochar per hectare was applied in both 2014 and 2018, along with an annual nitrogen application of 100 kg ha−1. Similarly, the SN0 treatment involved an annual application of 4.5 t ha−1 of straw, while the SN100 treatment received the same straw application rate mixed with an additional 100 kg ha−1 of nitrogen annually. All treatments received phosphorus fertilizer at a rate of 46 kg ha−1 P (superphosphate [Ca (H2PO4)2] containing 61 g P kg−1) at sowing. Table 1 presents a comprehensive depiction of the treatments employed in the study. Equal amounts of biochar were added to the soil every four years (2014 and 2018) based on the amount of organic carbon added through the straw treatment. The soil was enriched with biochar and straw by incorporating them to a depth of 20 cm using rotary tillage equipment. The biochar utilized in the experiment was obtained from a local provider (Golden Future Agriculture Technology Co., Ltd., Liaoning, China). The wheat straw from the previous harvest was measured and promptly placed back into the original plots following the threshing process, ensuring it was distributed uniformly.
The biochar had a total carbon content of 430 g kg−1 and a total nitrogen content of 1.04 g kg−1. The straw had a total carbon content of 380 g kg−1 and a total nitrogen content of 0.94 g kg−1. The spring wheat variety Dingxi 40 (Triticum aestivum L.) was planted consistently in mid-March at a seeding rate of 187.5 kg ha−1, using a direct drill planter at 20 cm row spacing. The harvest took place annually from late July to early August. The dimensions of each experimental plot were 3 m by 6 m.

2.3. Soil Sampling

Soil samples were obtained from five distinct locations within each plot using the plum sampling method after the August 2021 crop harvest. The collection was carried out at two different depths: 0–10 cm and 10–30 cm. Each soil sample, weighing approximately 1500 g, was meticulously combined in a plastic container to safeguard against aggregate breakdown. The collected soil samples from the same depth range underwent air-drying in the laboratory at an ambient temperature of around 25 °C. Subsequently, dry sieving procedures were implemented to acquire 5–8 mm aggregates, which were utilized for chemical and wet sieving analyses. Before conducting the analyses, meticulous efforts were made to eliminate any extraneous elements, including animal and plant debris, stones, and other undesirable materials, to ensure the accuracy of the results.

2.4. Routine Wet Sieving Method

As described by Elliott and Cambardella (1991) [20] and Cambardella and Elliott (1994) [21], a wet sieving technique was used to segregate soil aggregates into four distinct categories. These categories were delineated based on size [22,23]: large macroaggregates (≥2000 μm, LargeA), small macroaggregates (250–2000 μm, SmallA), the micro fraction (53–250 μm, MicroA), and the silt and clay fraction (<53 μm, SiltF). Initially, 100 g of air-dried soil, measuring 5–8 mm, was submerged in deionized water atop the uppermost sieve within a stack comprising three sieves with mesh sizes of 2, 0.25, and 0.053 mm. This procedure was repeated thrice for each sample and maintained for 5 min. Following this, the samples underwent vertical shaking, occurring 50 times over a 3 cm distance and spanning 2 min. The soil aggregates retained on each sieve were subsequently rinsed into beakers, and any fraction smaller than 0.053 mm was gathered from the bottom of the water container after 48 h. Following collection, all materials were subjected to drying in an oven at 40 °C for 48 h, weighed, and subsequently stored for further analysis.

2.5. The Le Bissonnais Method

The Le Bissonnais method, outlined by Le Bissonnais (1996) [24] and Amézketa (1999) [25], encompasses three distinct treatments: fast-wetting (FastW), slow-wetting (SlowW), and wetting–stirring (WetS). In each treatment, 10 g of aggregate was utilized by the Le Bissonnais method. For the FastW treatment, aggregates were delicately immersed in distilled water for 10 min. In the SlowW treatment, the aggregates were positioned on filter paper and exposed to a tension of −0.3 kPa for 30 min. As for the WetS treatment, aggregates underwent a two-step process: initial immersion in ethanol for 10 min, followed by transfer into a flask containing 200 mL of deionized water. The flask was sealed and agitated end-over-end 20 times within 1 min. Post-treatment, fragments were moved to a 0.05 mm sieve immersed in ethanol and manually oscillated up and down 20 times. The aggregates on the 0.05 mm sieve were dried in an oven at 40 °C. The mean weight diameter (MWD) was then determined through dry sieving, utilizing the same sieve assembly employed in the WetS method.

2.6. Determination of Soil Organic Carbon Content

The WCO (Wet Chemical Oxidation) method was used to determine SOC content [26,27]. A modified WCO method was employed to determine the SOC content. A total of 0.5 g of air-dried soil was placed in a 500 mL conical flask. Then, 5 mL of 0.1667 M K2Cr2O7 and 5 mL of H2SO4 were added to the flask. The mixture was thoroughly mixed and heated at 185 °C for 10 min. After cooling, 50 mL of distilled water was added, and filtration was carried out using Whatman No. 40 filter paper. A total of 4–5 drops of ferrous sulphate indicator was added to indicate the endpoint. Titration was performed using 0.5 M ferrous sulphate, with blank tests conducted each time to standardize the ferrous sulphate. Filtration was then performed to obtain a clear endpoint.

2.7. MWD, RSI, and RMI Calculation

Aggregate stability was measured as mean weight diameter (MWD). The formula for calculating this is as follows [28]:
MWD = i = 1 4 X i W i
The mean diameter (Xi) represents the average size of two neighboring aggregate fractions, while the mass percentage (Wi) indicates the proportion of the ith aggregate size fraction in relation to the total sample. RSI is an indicator of aggregate stability when subjected to rapid wetting and the slaking of air under pressure in soil pores. On the other hand, RMI reflects the stability of aggregates under external stresses like raindrop impacts, tillage, and root penetrations. Higher RSI and RMI values indicate lower stability of the aggregates [29].
RSI = (MWDSlowW − MWDFastW)/MWDRoutW
RMI = (MWDSlowW − MWDWetS)/MWDRoutW
where MWDRoutW is the MWD measured by routine wet sieving, MWDSlowW is the MWD measured by slow-wetting sieving, MWDFastW is the MWD measured by fast-wetting sieving, and MWDWetS is the MWD measured by wetting–stirring sieving.

2.8. Statistical Analyses

The statistical analyses were performed utilizing SPSS 19.0 software on a Windows 8 platform provided by IBM Corporation, based in Chicago, IL, USA. To evaluate treatment effects, a two-way (Nitrogen × Biochar and Nitrogen × Straw) analysis of variance (ANOVA) was conducted, with post hoc testing conducted using Duncan’s multiple-range test. Statistical significance was determined at a probability threshold of 0.05 unless otherwise stated.

3. Results

3.1. Soil Aggregate Distribution

In routine wet sieving (Figure 1a), the proportion of SiltF (<0.053 mm) generally increased with soil depth. In contrast, the proportions of the LargeA (≥2 mm), SmallA (0.25–2 mm), and MicroA (0.053–0.25 mm) fractions decreased. In the CN0, CN100, and BN0 tests, the SiltF fraction was the most abundant in the 0–10 cm soil layer, ranging from 36.66% to 52.87%. However, in the BN100, SN0, and SN100 plots, the MicroA fraction was the most dominant, accounting for 33.48–38.87%. The SN100 treatment had the highest LargeA, SmallA, and MicroA contents among all treatments.
In fast-wetting sieving (Figure 1b), the LargeA, SmallA, and MicroA fractions decreased with increasing soil depth while the proportion of the SiltF particle size fraction increased. Across all soil depths, the CN0 and CN100 plots had the highest proportion of SiltF fraction, ranging from 44.78% to 59.09%, respectively. However, the SN100 plot had the lowest proportion of SiltF among the treatments. The proportions of LargeA, SmallA, and MicroA particle sizes were in the order of SN100 > SN0 > BN100 > BN0 > CN100 > CN0 in the 0–30 cm soil layer. The treatments with added organic matter (SN0, SN100, BN0, and CN100) showed the highest proportions of SiltF among all the treatments, followed by the order MicroA > SiltF > SmallA > LargeA. In the slow-wetting sieving method (Figure 1c), the proportion of SiltF particle size increased with increasing soil depth, while the LargeA, SmallA, and MicroA grain size proportions decreased. The SiltF fraction was the most abundant in the CN0 and CN100 plots at 0–30 cm soil depth, ranging from 34.75 to 45.66%. In the wetting–stirring sieving method (Figure 1d), the proportion of SiltF size fraction increased with increasing soil depth, while the LargeA and SmallA size fractions decreased. The SiltF fraction was the most abundant in the CN0, CN100, and BN0 plots at 0–30 cm depth, ranging from 39.25 to 57.69%.

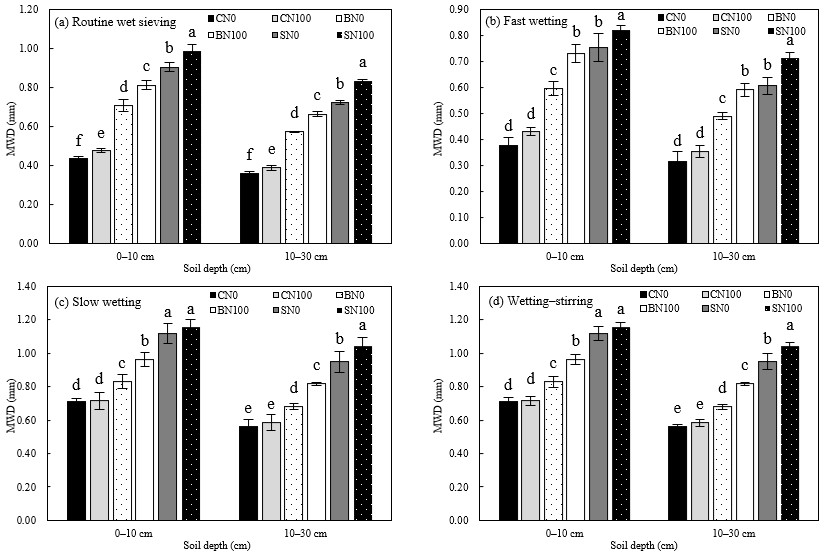
3.2. Soil Aggregate Mean Weight Diameter (MWD)

As shown in Figure 2a–d, in the 0–30 cm soil layers, mean weight diameter (MWD) values were higher under straw retention (SN0 and SN100) than under biochar addition (BN0 and BN100) and no organic material addition (CN0 and CN100). In the 0–10 cm layer (Figure 2a), SN100 treatment notably enhanced the mean weight diameter by routine wet sieving (MWDRoutW) by 126.99%, 106.43%, 39.55%, 21.61%, and 9.21% compared to CN0, CN100, BN0, BN100, and SN0 treatments, respectively. This trend persisted in the 10–30 cm layer; the value of MWDRoutW under SN100 treatment was 133.61%, 114.29%, 45.55%, 25.46%, and 15.41% higher than those for the CN0, CN100, BN0, BN100, and SN0 plots, respectively. As shown in Table 2, a two-factor ANOVA indicated that using the routine wet method, nitrogen (N), biochar, and straw significantly impacted MWD in both layers. The interaction of N and biochar significantly affected MWD across all soil depths, while the N and straw interaction affected MWD only at the second soil depth (10–30 cm). Both biochar addition and straw retention led to significant MWD improvements compared to the plots without organic material addition, with increases of 66.37% and 107.10%, 65.87%, and 108.61% in the 0–10 cm and 10–30 cm layers, respectively. Moreover, the MWD values in the N addition treatments were significantly higher than those in the no N addition treatments at both soil depths.
In the Figure 2b, for the observed soil depths (0–30 cm), the values of the mean weight diameter by fast-wetting sieving (MWDFastW) under straw retention and biochar addition plots were significantly higher than those under no organic material addition treatments. For the first soil layer (0–10 cm), compared with the CN0, CN100, BN0, BN100, and SN0 treatments, SN100 treatment significantly enhanced the MWDFastW by 117.75%, 90.68%, 37.83%, 12.37%, and 8.92%, respectively. In the 10–30 cm soil layer, the value of SN100 treatment was 125.57%, 100.91%, 45.74%, 20.54%, and 17.54% higher than those for the CN0, CN100, BN0, BN100, and SN0 plots, respectively. As shown in Table 2, Nitrogen, straw, and biochar significantly affected the soil aggregate MWD by using the fast-wetting sieving method for the two soil layers (0–10 and 10–30 cm), while the nitrogen × straw and nitrogen × biochar combination had no significant effects on the soil aggregate MWDFastW. The values of MWDFastW in the biochar addition (BN0 and BN100), straw retention (SN0 and SN100) plots for the 0–10 cm and 10–30 cm soil depths increased significantly by 64.23%, and 61.07%, 95.00%, and 96.67% compared to those in the no organic material addition plots (CN0 and CN100), respectively. Compared with the no nitrogen addition practices (CN0, BN0, and SN0), the nitrogen addition treatments (CN100, BN100, and SN100) significantly enhanced the MWDFastW by 14.81% and 17.53% for the 0–10 cm and 10–30 cm soil layers, respectively.
For the observed soil depths (Figure 2c), the mean weight diameter values by slow-wetting sieving (MWDSlowW) under straw retention and biochar addition plots were significantly higher than those under no organic material addition treatments. For the first soil layer (0–10 cm), compared with the CN0, CN100, BN0, BN100, and SN0 treatments, SN100 treatment significantly enhanced the MWDSlowW by 62.95%, 61.24%, 39.03%, 19.79%, and 3.09%, respectively. In the 10–30 cm soil layer, the value of SN100 treatment was 84.94%, 78.35%, 53.17%, 27.55%, and 9.78% higher than those for the CN0, CN100, BN0, BN100, and SN0 plots, respectively. The nitrogen × biochar combination had a significant (p ≤ 0.05) effect on the MWD by slow-wetting sieving method for the first soil depth (0–10 cm) but had no significant effect on the MWDSlowW for the second soil depth (10–30 cm). As shown in Table 2, the nitrogen × straw combination did not significantly affect the soil aggregate MWDSlowW in all soil depths (0–30 cm). Compared with the no organic material addition plots (CN0 and CN100), the biochar addition (BN0 and BN100) and straw retention (SN0 and SN100) plots resulted in significant improvements in the MWD of slow-wetting sieving method; those were increased by 25.94% and 59.66%, 30.46% and 73.50% for the 0–10 cm and 10–30 cm layers, respectively. In the 0–10 cm and 10–30 cm soil depths, the values of MWD by slow-wetting sieving method in the nitrogen addition treatments (CN100, BN100, and SN100) increased significantly (by 6.60% and 11.41%) compared to those in the no nitrogen addition practices (CN0, BN0, and SN0).
For 0–30 cm soil depths (Figure 2d), the values of the mean weight diameter by wetting–stirring sieving (MWDWetS) under straw retention (SN0 and SN100) plots were significantly (p ≤ 0.05) greater than those under biochar addition (BN0 and BN100) and no organic material addition (CN0 and CN100) practices. In the first soil layer (0–10 cm), compared with the CN0, CN100, BN0, BN100, and SN0 treatments, SN100 treatment significantly enhanced the MWDWetS by 81.70%, 65.72%, 43.61%, 22.44%, and 5.95%, respectively. For the 10–30 cm soil layer, the value of MWDWetS under SN100 treatment was 101.87%, 85.02%, 55.82%, 30.51%, and 10.91% higher than those for the CN0, CN100, BN0, BN100, and SN0 plots, respectively. Nitrogen, straw, and biochar significantly affected the soil aggregate MWD using the wetting–stirring sieving method for the two soil layers (0–10 and 10–30 cm). It can be seen from Table 2, the nitrogen × straw and nitrogen × biochar combination did not significantly affect the soil aggregate MWDWetS in the first soil layers (0–10 cm). The nitrogen × straw combination had no significant effects on the soil aggregate MWDWetS in the second soil layers (10–30 cm), while the nitrogen × biochar combination significantly affected the soil aggregate MWDWetS in the second soil layers (10–30 cm). The values of MWDWetS in the biochar addition (BN0 and BN100), straw retention (SN0 and SN100) plots for the 0–10 cm and 10–30 cm soil depths increased significantly by 31.14% and 35.93%, 68.47%, and 83.59% compared to those in the no organic material addition plots (CN0 and CN100), respectively. Compared with the no nitrogen addition practices (CN0, BN0, and SN0), the nitrogen addition treatments (CN100, BN100, and SN100) significantly enhanced the MWDWetS by 10.48% and 13.14% for the 0–10 cm and 10–30 cm soil layers, respectively.

3.3. RSI and RMI

The RSI reflects soil aggregate stability during rapid wetting. Lower RSI values indicate higher stability. Figure 3a shows RSI values for soil aggregates under different treatments at 0–30 cm soil depths. Straw retention (SN0 and SN100) and biochar addition (BN0 and BN100) significantly reduced RSI values compared to practices without organic material addition (CN0 and CN100) (p ≤ 0.05). However, the difference between SN0 and CN100 was not statistically significant at 10–30 cm soil depth. BN100 treatment notably reduced RSI by 62.54%, 52.00%, 13.55%, 29.25%, and 15.19% in the topsoil layer (0–10 cm) compared to CN0, CN100, BN0, SN, and SN100 treatments. In the 10–30 cm soil layer, BN0 treatment reduced RSI by 46.78%, 43.51%, 1.52%, 29.55%, and 15.42% compared to CN0, CN100, SN0, BN100, and SN100 plots. Table 3 shows that biochar and straw significantly influenced RSI in both soil layers (0–10 and 10–30 cm), while nitrogen (N) did not. Compared with the no organic material addition plots (CN0 and CN100), the biochar addition (BN0 and BN100) and straw retention (SN0 and SN100) plots resulted in significant improvements in the RSI; those were decreased by 54.62% and 45.45%, 44.77% and 28.70% for the 0–10 cm and 10–30 cm layers, respectively. N addition treatments (CN100, BN100, and SN100) can significantly reduce RSI by 18.65% and 7.69% compared to no N addition practices (CN0, BN0, and SN0) for the 0–10 cm and 10–30 cm soil layers, respectively.
The RMI measures aggregate stability under external stresses. Lower RMI values indicate higher stability. Figure 3b presents RMI values at different 0–30 cm soil depths under various treatments. In the 0–10 cm soil depths, RMI values under CN100, BN0, BN100, SN0, and SN100 treatments were significantly lower than those under CN0 treatments. However, RMI differences were insignificant at 10–30 cm soil depths. In the topsoil layer (0–10 cm), SN100 treatment significantly reduced RMI by 53.29%, 31.63%, 14.36%, 11.29%, and 17.08% compared to CN0, CN100, BN0, BN100, and SN0 treatments. In the 10–30 cm soil layer, SN100 treatment reduced RMI by 32.50%, 30.23%, 3.48%, 9.28%, and 9.67% compared to CN0, CN100, BN0, BN100, and SN0 plots. Only straw and biochar significantly affected RMI for the topsoil layer (0–10), while all other treatments had no significant effects (Table 3). The values of RMI in the biochar addition (BN0 and BN100), straw retention (SN0 and SN100) plots for the 0–10 cm and 10–30 cm soil depths decreased significantly by 36.32%, and 26.64%, 38.79%, and 27.71% compared to those in the no organic materials addition plots (CN0 and CN100), respectively. N addition treatments (CN100, BN100, and SN100) significantly reduced RMI by 20.48% and 2.46% for the 0–10 cm and 10–30 cm soil layers, respectively, compared to no N addition practices (CN0, BN0, and SN0).

3.4. Soil Organic C (SOC)

Figure 4 shows that in the first soil layer (0–10 cm), compared with the CN0, CN100, BN0, SN0, and SN100 treatments, the BN100 treatment significantly increased SOC by 62.22%, 45.95%, 16.91%, 33.06%, and 20.51%, respectively. For the 10–30 cm soil layer, the SOC value under BN100 treatment was 44.32%, 31.64%, 12.73%, 37.49%, and 24.52% higher than those for the CN0, CN100, BN0, SN0, and SN100 plots, respectively. As shown in Table 4, the two-factor ANOVA showed that N, biochar, and straw significantly influenced SOC in the two soil layers (0–10 and 10–30 cm). The combination of N × biochar significantly affected the SOC for all soil depths. In contrast, the combination of N × straw did not affect SOC for all soil depths. Compared with the plots with no organic material addition (CN0 and CN100), the biochar addition (BN0 and BN100) and straw retention (SN0 and SN100) plots resulted in significant improvements in SOC. Those values increased by 42.54% and 21.49%, 29.91% and 5.36% for the 0–10 cm, and 10–30 cm layers, respectively (Table 4). In the 0–10 cm and 10–30 cm soil depths, the values of SOC in the N addition treatments (CN100, BN100, and SN100) increased significantly (by 13.12% and 11.07%) compared to those in the no N addition practices (CN0, BN0, and SN0).

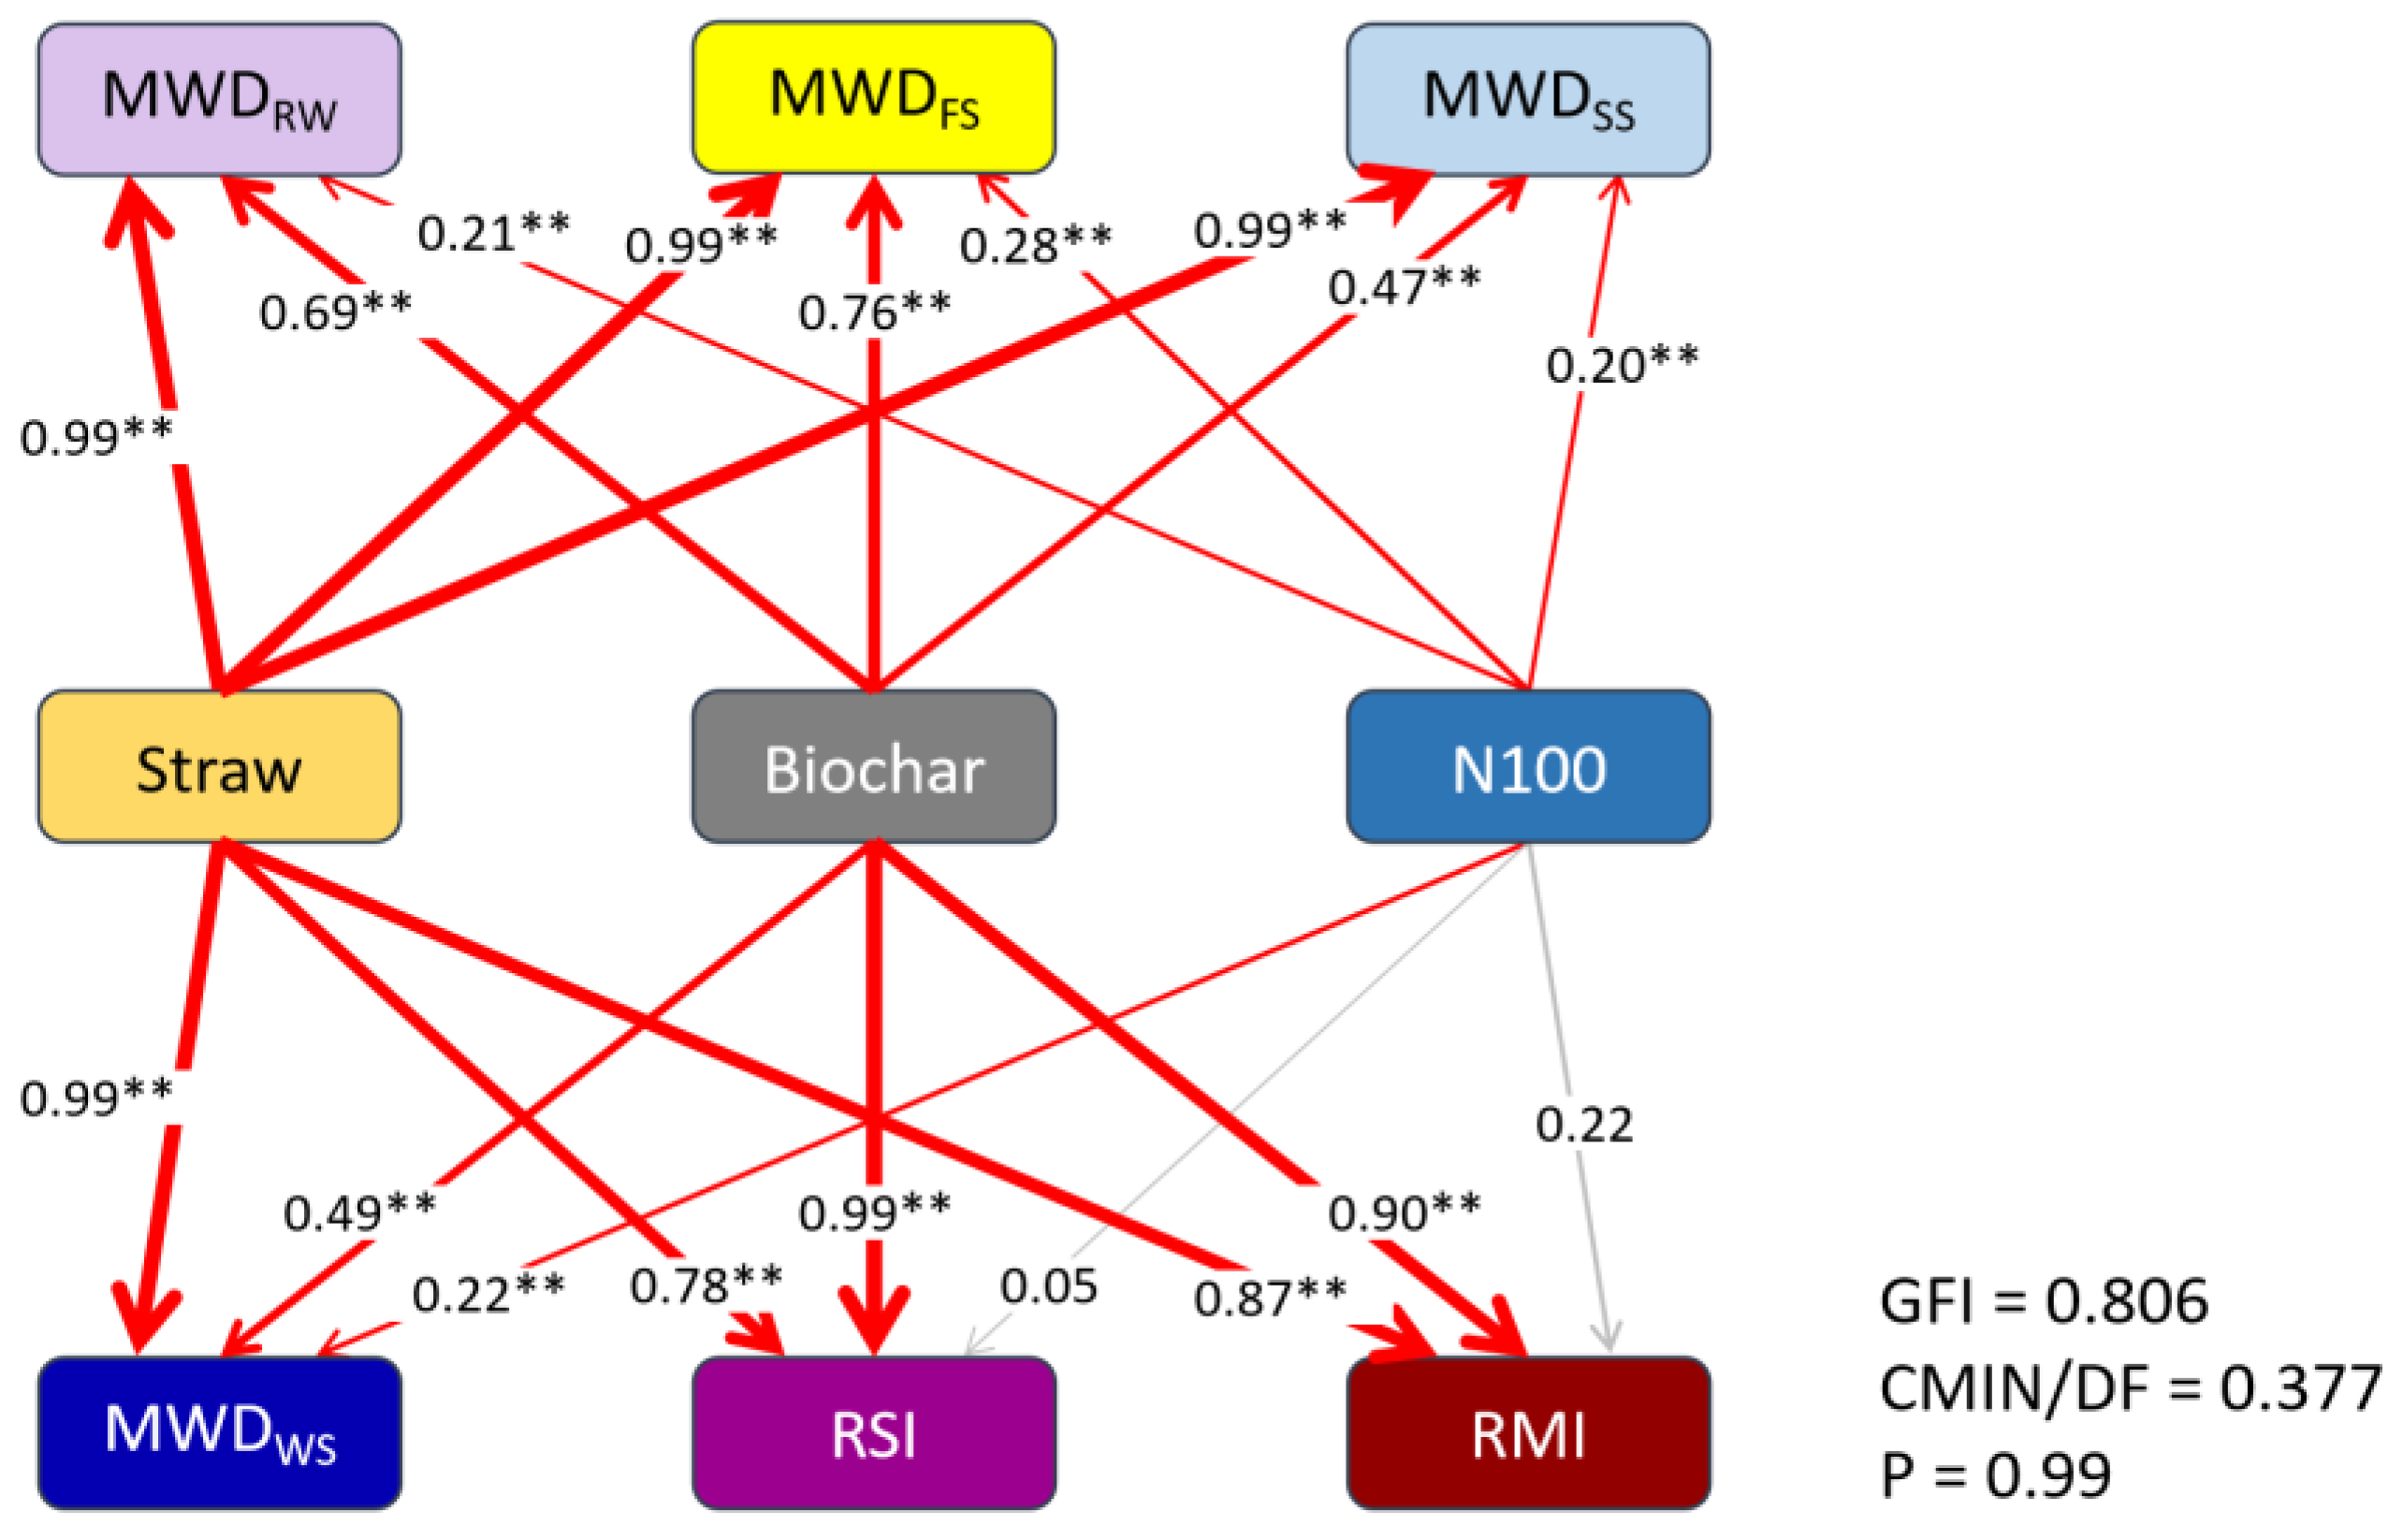
3.5. Structural Equation Model

Figure 5a illustrates the structural equation model depicting the impact of straw, biochar, and N on the mean weight diameter (MWD) and stability of soil aggregates. The thickness of the lines represents the normalization coefficient’s magnitude. Solid lines indicate positive correlations, while dashed lines indicate negative correlations. The line color indicates the significance level: red represents a 1% significance level, and gray indicates no significance. The results indicate that adding biochar, straw, and N to the soil significantly enhanced (p ≤ 0.01) the MWD values of soil aggregates using conventional wet sieving methods. The treatments ranked in terms of their effect on MWD values from largest to smallest were straw retention > biochar addition > N addition. Both straw and biochar additions significantly reduced RMI (p ≤ 0.01), while all three treatments significantly reduced RSI. Straw retention and biochar addition effects on RSI were significant at 1%, whereas N addition was significant at 5%. The treatments ranked in terms of their impact on RSI from largest to smallest were biochar addition > straw retention > N addition. Biochar addition had the greatest effect on RMI, followed by straw retention.

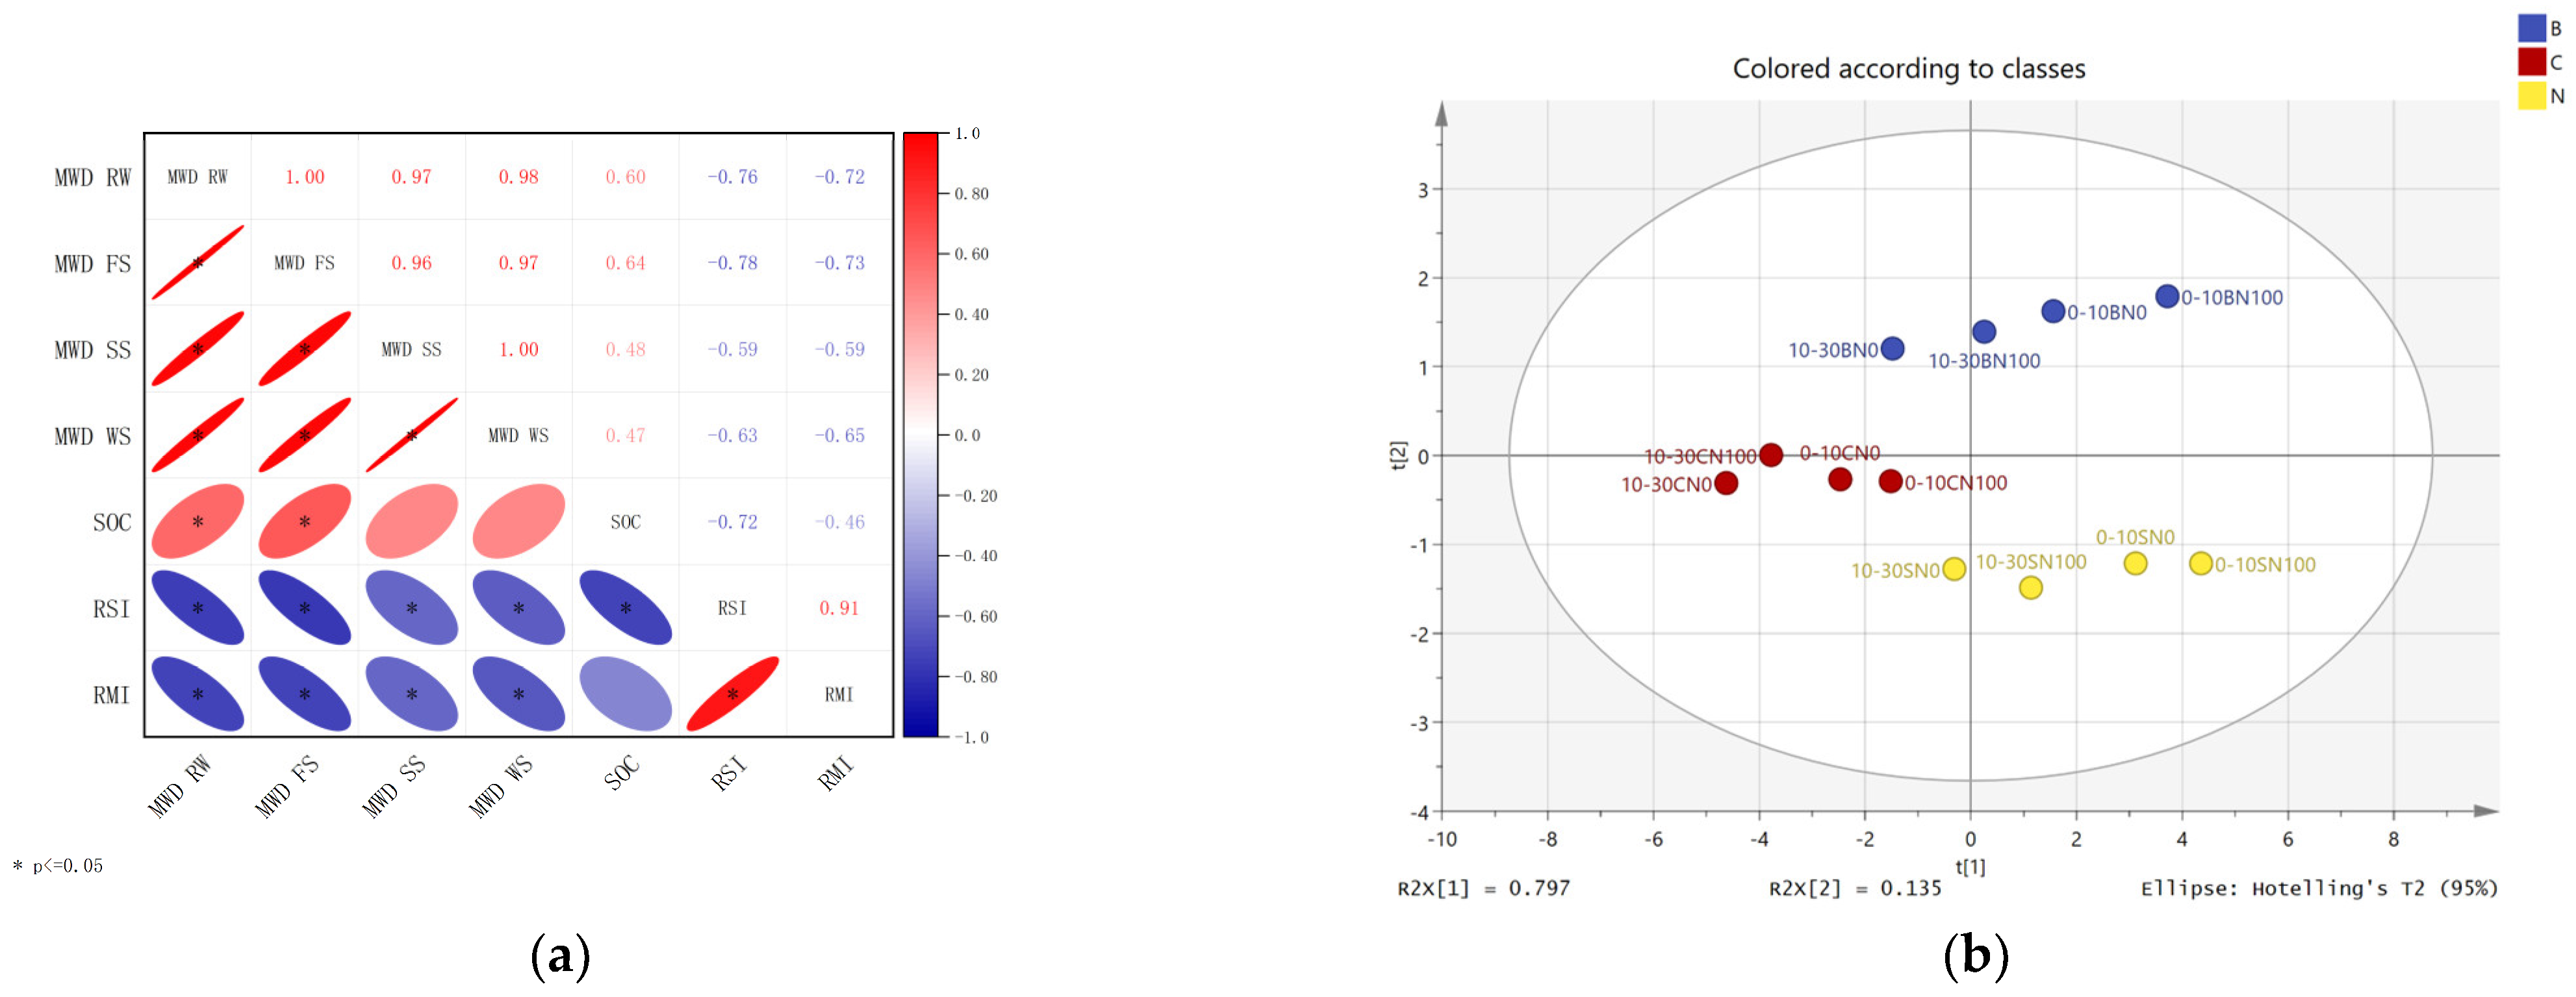
3.6. Correlation Analysis and Principal Component Analysis (PCA)

Figure 6a displays the correlation analysis between soil organic carbon (SOC) and the mean weight diameter (MWD) of soil aggregates. SOC showed a significant positive correlation (p ≤ 0.05) only with the MWD of soil aggregates measured by routine wet sieving and fast-wetting sieving methods. Furthermore, there was a significant negative correlation between SOC and RSI (p ≤ 0.05).
The first two principal components explained 93.40% of the total variance, indicating that the two extracted principal components could represent 93.40% of the 12 factors and that the extracted principal components were valuable in evaluating the soil quality (soil aggregate structure and soil organic carbon). Therefore, two principal components (Y1 and Y2) were extracted. Figure 6b shows the principal component scores and the composite score weighted by the ratio of the variance contribution of each principal component to the total variance contribution of the two principal components. From the principal component and composite scores, the composite scores of the 0–10 cm soil layer were higher than those of the 10–30 cm layer, indicating that the surface soil had a better aggregate structure and organic carbon than the lower layer. Combining all the soil layers, BN100 and SN100 scores were higher, indicating that adding nitrogen fertilizer and carbon sources (biochar and straw) can improve soil quality.

4. Discussion

4.1. Effect of Straw, Biochar, and N Applications on the Distribution of Soil Aggregates of Different Sizes

Regardless of the method used for sieving, the proportion of the SiltF (<0.053 mm) within soil aggregates tended to rise with increasing soil depth. In comparison, the percentages of LargeA (≥2 mm), SmallA (0.25–2 mm), and MicroA (0.053–0.25 mm) declined as soil depth increased. These trends suggest notable disparities in soil structure and physical characteristics at various depths. As soil depth increased, microbial activity and soil organic carbon content diminished, weakening the bonds between soil particles and favoring the formation of fine soil particles [28]. The influence of straw, biochar, and N additions was more pronounced in the topsoil layer (0–10 cm) compared to the deeper layer (10–30 cm). Consequently, the uppermost soil layer became increasingly susceptible to the formation of macroaggregates (>0.25 mm).
Numerous studies have highlighted that incorporating straw or biochar significantly improves the content and stability of soil macroaggregates [4,30]. In this investigation, adding straw, biochar, and N resulted in a heightened proportion of macroaggregates (≥0.25 mm) within the soil. The treatments were ranked as follows in terms of their effectiveness in improving LargeA fraction: SN100 > SN0 > BN100 > BN0 > CN100 > CN0. The primary factor contributing to this improvement was the addition of straw, which reduced soil bulk density and provided a substantial amount of organic matter. This, in turn, enhanced root activity and the activity of soil microorganisms [31,32]. The addition of straw and biochar positively affected soil porosity and root growth, which, in turn, facilitated the formation of soil aggregates [33]. However, biochar has a lower ability to bind to LargeA than straw due to its slow decomposition and limited utilization by microorganisms [34].
The formation of macroaggregates can offer physical protection to soil enzymes and enhance soil nutrient availability [35]. Furthermore, preserving nitrogen (N) during soil agglomeration promotes accumulation, particularly within macroaggregates. Applying biochar enhances soil aggregate stability and improves the physical safeguarding of organic matter, thereby increasing the overall nitrogen content in the soil [35]. Moreover, adding biochar can effectively suppress the activity of denitrifying bacteria, mitigating the loss of nitrogen (N) through denitrification. This helps to minimize N emissions and reduce overall N loss [35]. In this study, nitrogen (N) was introduced as a treatment, which enhanced microorganisms’ carbon (C) utilization, influenced soil aggregate formation, and increased macroaggregate content. However, Six et al. [36] observed that macroaggregates, being composed of organic materials, tend to increase in size with higher soil C/N ratios. However, intriguingly, this study’s introduction of nitrogen (N) yielded larger aggregates despite a decrease in the C/N ratio. This unexpected outcome could be ascribed to the intricate interplay among nitrogen addition, organic carbon formation, and soil microorganisms. This interaction likely mitigated electrostatic repulsion and bolstered bonding forces between soil particles, thereby fostering the formation of aggregates. Nevertheless, the findings underscore the enduring significance of incorporating an organic carbon source to augment macroaggregate content.

4.2. Effect of Straw, Biochar, and N Applications on the Stability of Soil Aggregates

The enhancement of the mean weight diameter (MWD) of soil aggregates at various depths was effectively achieved by incorporating straw, biochar, and nitrogen (N), as indicated by alternative sieving methods in this study. The observed increase in MWD can be primarily ascribed to reduced soil density and the significant supply of organic matter from straw addition, subsequently fostering microbial activity [32,37]. Both straw and biochar contribute positively to soil porosity, promoting aggregate formation [33]. Additionally, the inclusion of straw and biochar improves the efficiency of soil nutrient utilization [38]. The introduction of organic carbon sources leads to elevated levels of soil nitrate and ammonia nitrogen, attributed to the stimulation of ammonia-oxidizing bacteria and archaea gene abundance by aged biochar, along with the high adsorption capacity of biochar for NH4+ [39,40]. Interestingly, the impact of nitrogen (N) addition on MWD was less pronounced than carbon (C) sources. Treatment effects on MWD at a depth of 0–30 cm were ranked as follows: straw retention (SN100) > no straw retention (SN0) > biochar addition with N (BN100) > biochar addition without N (BN0) > N addition with C (CN100) > no N or C addition (CN0). Consequently, straw retention exerted the most significant influence on improving the MWD of soil aggregates, followed by the biochar addition treatment. The influence of N addition treatment on MWD was found to be negligible, consistent with the findings of Wang et al. [30]. Moreover, previous observations support the notion that retaining straw in the soil has a more substantial positive effect on the MWD of soil aggregates compared to adding biochar. This discrepancy is attributed to biochar’s stable aromatic structure and high carboxylic acid esterification, which make it relatively inert as a solid material produced at high temperatures [41,42]. Due to its recalcitrant nature, biochar presents challenges for microbial decomposition and utilization. Consequently, its binding capacity to soil aggregates is relatively weaker when compared to straw [34]. Additionally, the porous nature of biochar enhances the storage of compressed air within the capillary pores of the soil. When water rapidly enters the soil, it causes the diffusion of internal air and disrupts the structure of soil aggregates [43]. Furthermore, incorporating straw into the soil stimulates the growth of fungal hyphae and the secretion of extracellular organic polymers by microorganisms. This, in turn, leads to an increase in the mean weight diameter (MWD) of soil aggregates. Notably, the retention of straw has a more pronounced effect on enhancing the MWD of soil aggregates than adding biochar [30,44].
This study evaluated soil aggregates’ stability under different treatments using the RSI and RMI. Straw retention, biochar addition, and N addition all had a significant positive impact on RSI. It should be noted that straw retention and biochar addition had a 1% significance level for RSI. The N addition had only a 5% significance level for RSI. The response of RSI to each treatment was observed in the following order: biochar addition > straw retention > N addition. Both straw retention and biochar addition significantly improved the RMI (stability of aggregates under external stress) at a significance level of 0.01. The effect of biochar on RMI was greater than that of straw. Although biochar addition was less effective in binding macroaggregates than straw retention, it exhibited a greater potential for enhancing the stability of soil aggregates. One possible explanation is that the organic carbon derived from straw decomposition in macroaggregates is readily converted to soil CO2 by microorganisms, leading to its quick release [37,45]. Straw retention increased MBC [microbial biomass C (MBC)] more than biochar addition, and an increase in MBC promoted CO2 emissions [46]. The production of CO2 gas may make the soil aggregate structure unstable.

4.3. Effect of Straw, Biochar, and N Applications on Soil Organic C

Numerous studies have illustrated a robust correlation between soil organic carbon (SOC) accumulation and the addition of external organic matter, particularly within the top 20 cm of soil [1,30,45]. Incorporating biochar and straw into the soil resulted in a notable increase (p ≤ 0.01) in SOC content in this investigation. However, nitrogen (N) addition exhibited only a modest enhancement (p ≤ 0.05) in SOC. Zhao et al. [47] discovered that combining mineral fertilizers (N, P, and K) with biochar increased SOC concentration across various soil aggregate sizes, likely due to biochar’s interaction with soil minerals.
In the study by Wang et al., biochar’s impact on SOC was more significant than straw addition [30]. This aligns with prior research, demonstrating that SOC response to each treatment followed the biochar > straw > N treatment order. This discrepancy may stem from the substantial loss of decomposable carbon (C) from straw during decomposition and soil respiration. Moreover, biochar’s well-defined specific surface area and pore structure enable effective SOC storage, facilitating carbon and nitrogen cycling and enzyme activities [48,49]. Additionally, introducing biochar may alter the original SOC composition due to the recalcitrant nature of carbon produced during pyrolysis (biochar production). This recalcitrant organic carbon (ROC) is less prone to microbial decomposition, potentially reducing overall SOC decomposition by microorganisms [50,51]. Jin et al. [52] showed that excessive biochar application reduced the mineralization of accumulated organic C. Therefore, excessive biochar application may reduce the soil’s labile organic C.
Poeplau et al. found that N addition increased C use by microorganisms, stimulated microbial growth, and promoted C uptake [53]. This study’s findings align with the observed results, indicating that adding nitrogen (N) significantly contributed to the increase in soil organic carbon (SOC). In addition, N addition could promote the uptake of substrate C and nutrients by microorganisms and avoid excess C being used for microbial excretion and respiration, thus improving nutrient utilization [54,55]. Nevertheless, it is worth noting that the impact of nitrogen (N) addition on soil organic carbon (SOC) was relatively less pronounced compared to the effects of biochar addition and straw retention. This suggests that adding organic carbon sources is more influential in promoting the increase in SOC in the soil.

4.4. Limitations in Current Study, Future Prospectives, and Recommendations

While the study provides valuable insights into the effects of straw, biochar, and nitrogen applications on soil aggregate distribution, stability, and organic carbon content, several limitations should be considered. Firstly, the study’s scope was limited to a specific experimental setup, and the results may only directly apply to some soil types and environmental conditions. Additionally, the study focused primarily on short-term effects, and long-term implications of the treatments on soil health and productivity still need to be determined. Furthermore, the mechanisms underlying the observed effects, particularly regarding the interactions between straw, biochar, nitrogen, and soil microorganisms, require further elucidation.
Future research should address these limitations and explore additional soil management and sustainability aspects. Long-term field studies are needed to assess the persistence and stability of the observed effects over time and under different climatic conditions. Additionally, investigations into the underlying mechanisms of straw, biochar, and nitrogen interactions with soil microorganisms and aggregates would provide valuable insights into optimizing soil management practices. Moreover, research focusing on scaling up these findings to larger agricultural systems and assessing their economic feasibility and environmental impact would be beneficial for guiding policy decisions and agricultural practices.
Regarding recommendations, adopting integrated soil management approaches incorporating straw retention, biochar addition, and nitrogen optimization could help improve soil health, fertility, and carbon sequestration. Farmers and land managers should consider the specific characteristics of their soil and cropping systems when implementing these practices, as optimal strategies may vary depending on local conditions. Furthermore, education and outreach programs to raise awareness about the benefits of sustainable soil management practices could promote their adoption among farmers and stakeholders. Lastly, continued investment in research and innovation is essential for developing and refining soil management techniques that enhance agricultural sustainability and resilience to environmental challenges.

5. Conclusions

The addition of biochar, straw, and nitrogen into soil demonstrated pronounced benefits, notably augmenting the proportion of large soil aggregates and substantially increasing the size of soil aggregate structures, particularly with the SN100 treatment, featuring straw mulch combined with an annual application of 100 kg/ha of nitrogen, emerging as the most productive approach (significant at p ≤ 0.01). Adding straw and biochar significantly enhanced the stability of agglomerates under external stress (RMI) and the slaking of air under pressure in the pores of moist soil (RSI). The degree of RSI and RMI response for each treatment was biochar addition > straw retention > nitrogen addition. Additionally, both biochar and straw amendments substantially enriched soil organic carbon content. This study offers robust data in support of sustainable agricultural practices in northwest China and lays a robust foundation for the development of a scientifically grounded fertilization regime in the region’s agricultural landscapes.

Author Contributions

Conceptualization, J.W. and Y.Z.; methodology, J.W. and Y.Z.; software, B.T.; validation, B.T. and L.G.; investigation, B.T. and X.D.; resources, J.W. and Y.Z.; data curation, J.W.; writing—original draft preparation, J.W. and B.T.; writing—review and editing, J.W., B.T. and Y.Z.; visualization, P.Q.; supervision, W.G. and F.U.H.; project administration, L.C.; funding acquisition, J.W. All authors have read and agreed to the published version of the manuscript.

Funding

Funding for this research was provided by the Gansu Agricultural University Public Recruitment Doctoral Research Start-up Fund (No. GAU-KYQD-2018-39) and the Natural Science Foundation of Gansu Province (No. 20JR10RA543, 21JR7RA811).

Data Availability Statement

Data available on request from the authors.

Conflicts of Interest

The authors affirm that they possess no identifiable conflicting financial interests or personal affiliations that might seem to have influenced the findings presented in this paper.

References

  1. Xu, X.; Schaeffer, S.; Sun, Z.; Zhang, J.; An, T.; Wang, J. Carbon stabilization in aggregate fractions responds to straw input levels under varied soil fertility levels. Soil Tillage Res. 2020, 199, 104593. [Google Scholar] [CrossRef]
  2. Islam, M.U.; Guo, Z.; Jiang, F.; Peng, X. Does straw return increase crop yield in the wheat-maize cropping system in China? A meta-analysis. Field Crops Res. 2022, 279, 108447. [Google Scholar] [CrossRef]
  3. Hu, F.; Xu, C.; Ma, R.; Tu, K.; Yang, J.; Zhao, S.; Zhang, F. Biochar application driven change in soil internal forces improves aggregate stability: Based on a two-year field study. Geoderma 2021, 403, 115276. [Google Scholar] [CrossRef]
  4. Zhang, M.; Cheng, G.; Feng, H.; Sun, B.; Zhao, Y.; Chen, H.; Chen, J.; Dyck, M.; Wang, X.; Zhang, J.; et al. Effects of straw and biochar amendments on aggregate stability, soil organic carbon, and enzyme activities in the Loess Plateau, China. Environ. Sci. Pollut. Res. 2017, 24, 10108–10120. [Google Scholar] [CrossRef] [PubMed]
  5. Jang, H.; Kim, J.; Sicakova, A. Effect of Aggregate Size on Recycled Aggregate Concrete under Equivalent Mortar Volume Mix Design. Appl. Sci. 2021, 11, 11274. [Google Scholar] [CrossRef]
  6. Mohammadi, J.; Motaghian, M.H. Spatial Prediction of Soil Aggregate Stability and Aggregate-Associated Organic Carbon Content at the Catchment Scale Using Geostatistical Techniques. Pedosphere 2011, 21, 289–399. [Google Scholar] [CrossRef]
  7. Zhang, B.; Horn, R. Mechanisms of aggregate stabilization in Ultisols from subtropical China. Geoderma 2001, 99, 123–145. [Google Scholar] [CrossRef]
  8. Ma, S.; Kan, Z.; Qi, J.; Zhang, H. Effects of Straw Return Mode on Soil Aggregates and Associated Carbon in the North China Plain. Agronomy 2020, 10, 61. [Google Scholar] [CrossRef]
  9. Ding, Z.; Li, P.; Wu, X.; Gao, P.; Su, J.; Sun, S. Evaluation of the contact characteristics of graded aggregate using coarse aggregate composite geometric indexes—ScienceDirect. Constr. Build. Mater. 2020, 247, 118608. [Google Scholar] [CrossRef]
  10. Bai, N.; Zhang, H.; Zhou, S.; Sun, H.; Zhao, Y.; Zheng, X.; Li, S.; Zhang, J.; Lv, W. Long-term effects of straw return and straw-derived biochar amendment on bacterial communities in soil aggregates. Sci. Rep. 2020, 10, 7891. [Google Scholar] [CrossRef]
  11. Li, F.; Qiu, P.; Shen, B.; Shen, Q. Soil aggregate size modifies the impacts of fertilization on microbial communities. Geoderma Int. J. Soil Sci. 2019, 343, 205–214. [Google Scholar] [CrossRef]
  12. Yoo, G.; Yang, X.; Wander, M.M. Influence of soil aggregation on SOC sequestration: A preliminary model of SOC protection by aggregate dynamics. Ecol. Eng. 2011, 37, 487–495. [Google Scholar] [CrossRef]
  13. Bimüller, C.; Kreyling, O.; Kölbl, A.; von Lützow, M.; Kögel-Knabner, I. Carbon and nitrogen mineralization in hierarchically structured aggregates of different size. Soil Tillage Res. 2016, 160, 23–33. [Google Scholar] [CrossRef]
  14. Wang, F.; Liu, Y.; Liang, B.; Liu, J.; Zong, H.; Guo, X.; Wang, X.; Song, N. Variations in soil aggregate distribution and associated organic carbon and nitrogen fractions in long-term continuous vegetable rotation soil by nitrogen fertilization and plastic film mulching. Sci. Total Environ. 2022, 835, 155420. [Google Scholar] [CrossRef] [PubMed]
  15. Zhang, J.; Zhou, S.; Sun, H.; Lü, F.; He, P. Three-year rice grain yield responses to coastal mudflat soil properties amended with straw biochar. J. Environ. Manag. 2019, 239, 23–29. [Google Scholar] [CrossRef] [PubMed]
  16. Manzoni, S.; Taylor, P.; Richter, A.; Porporato, A.; Ågren, G.I. Environmental and stoichiometric controls on microbial carbon-use efficiency in soils. New Phytol. 2012, 196, 79–91. [Google Scholar] [CrossRef] [PubMed]
  17. Li, J.; Sang, C.; Yang, J.; Qu, L.; Xia, Z.; Sun, H.; Jiang, P.; Wang, X.; He, H.; Wang, C. Stoichiometric imbalance and microbial community regulate microbial elements use efficiencies under nitrogen addition. Soil Biol. Biochem. 2021, 156, 108207. [Google Scholar] [CrossRef]
  18. Lal, A.R. Tillage and drainage impact on soil quality: I. Aggregate stability, carbon and nitrogen pools. Soil Tillage Res. 2008, 100, 89–98. [Google Scholar]
  19. Wang, X.; Jia, Z.; Liang, L.; Zhao, Y.; Yang, B.; Ding, R.; Wang, J.; Nie, J. Changes in soil characteristics and maize yield under straw returning system in dryland farming. Field Crops Res. 2018, 218, 11–17. [Google Scholar] [CrossRef]
  20. Elliott, E.T.; Cambardella, C.A. Physical separation of soil organic matter. Agric. Ecosyst. Environ. 1991, 34, 407–419. [Google Scholar] [CrossRef]
  21. Cambardella, C.A.; Elliott, E.T. Carbon and nitrogen dynamics of soil organic matter fractions from cultivated grassland soils. Soil Sci. Soc. Am. J. 1994, 58, 123–130. [Google Scholar] [CrossRef]
  22. Wu, J.; Stephen, Y.; Cai, L.; Zhang, R.; Qi, P.; Luo, Z.; Dong, B. Effects of different tillage and straw retention practices on soil aggregates and carbon and nitrogen sequestration in soils of the northwestern China. J. Arid Land 2019, 11, 567–578. [Google Scholar] [CrossRef]
  23. Kihara, J.; Bationo, A.; Mugendi, D.N.; Martius, C.; Vlek, P.L.G. Conservation tillage, local organic resources, and nitrogen fertilizer combinations affect maize productivity, soil structure and nutrient balances in semi-arid Keny. In Innovations as Key to the Green Revolution in Africa: Exploring the Scientific Facts; Springer: Dordrecht, The Netherlands, 2011; Volume 90, pp. 155–167. [Google Scholar]
  24. Le Bissonnais, Y. Aggregate stability and assessment of soil crustability and erodibility: I. theory methodology. Eur. J. Soil Sci. 1996, 47, 425–437. [Google Scholar] [CrossRef]
  25. Amézketa, E. Soil aggregate stability: A review. J. Sustain. Agric. 1999, 14, 83–151. [Google Scholar] [CrossRef]
  26. Wei, H.; Xu, J.; Quan, G.; Zhang, J.; Qin, Z. Invasion of Praxelis clematidea increases the chemically non-labile rather than labile soil organic carbon in a tropical savanna. Arch. Agron. Soil Sci. 2018, 64, 441–447. [Google Scholar] [CrossRef]
  27. Liu, S.; Kong, F.; Li, Y.; Jiang, Z.; Xi, M.; Wu, J. Mineral-ions modified biochars enhance the stability of soil aggregate and soil carbon sequestration in a coastal wetland soil. Catena 2020, 193, 104618. [Google Scholar] [CrossRef]
  28. Zheng, H.; Liu, W.; Zheng, J.; Luo, Y.; Li, R.; Wang, H.; Qi, H. Effect of long-term tillage on soil aggregates and aggregate-associated carbon in black soil of Northeast China. PLoS ONE 2018, 13, e0199523. [Google Scholar] [CrossRef] [PubMed]
  29. Xiao, H.; Liu, G.; Zhang, Q. Quantifying contributions of slaking and mechanical breakdown of soil aggregates to splash erosion for different soils from the Loess plateau of China. Soil Tillage Res. 2018, 178, 150–158. [Google Scholar] [CrossRef]
  30. Wang, Y.; Pang, J.; Zhang, M.; Tian, Z.; Wei, T.; Jia, Z.; Ren, X.; Zhang, P. Is adding biochar be better than crop straw for improving soil aggregates stability and organic carbon contents in film mulched fields in semiarid regions?—Evidence of 5-year field experiment. J. Environ. Manag. 2023, 338, 117711. [Google Scholar]
  31. Liu, J.; Jiang, B.; Shen, J.; Zhu, X.; Yi, W.; Li, Y.; Wu, J. Contrasting effects of straw and straw-derived biochar applications on soil carbon accumulation and nitrogen use efficiency in double-rice cropping systems. Agric. Ecosyst. Environ. 2021, 311, 107286. [Google Scholar] [CrossRef]
  32. Ma, Q.J.; Zhang, Q.; Niu, J.; Li, X.G. Plastic-film mulch cropping increases mineral-associated organic carbon accumulation in maize cropped soils as revealed by natural 13C/12C ratio signature. Geoderma 2020, 370, 114350. [Google Scholar] [CrossRef]
  33. Mohamed, I.; Bassouny, M.A.; Abbas, M.H.; Ming, Z.; Cougui, C.; Fahad, S.; Ali, M. Rice straw application with different water regimes stimulate enzymes activity and improve aggregates and their organic carbon contents in a paddy soil. Chemosphere 2021, 274, 129971. [Google Scholar] [CrossRef] [PubMed]
  34. Chen, W.; Hu, X.; Zhang, Y.; Zhang, D.; Song, J. Estimation of Carbon Sequestration Potential of Rice Straw Pyrolyzing to Biochar. Environ. Sci. Technol. 2015, 38, 265–270. [Google Scholar]
  35. Zhang, C.; Zhao, X.; Liang, A.; Li, Y.; Song, Q.; Li, X.; Li, D.; Hou, N. Insight into the soil aggregate-mediated restoration mechanism of degraded black soil via biochar addition: Emphasizing the driving role of core microbial communities and nutrient cycling. Environ. Res. 2023, 228, 115895. [Google Scholar] [CrossRef] [PubMed]
  36. Six, J.; Bossuyt, H.; Degryze, S.; Denef, K. A history of research on the link between (micro)aggregates, soil biota, and soil organic matter dynamics. Soil Tillage Res. 2004, 79, 7–31. [Google Scholar] [CrossRef]
  37. Shen, J.; Tang, H.; Liu, J.; Wang, C.; Li, Y.; Ge, T.; Wu, J. Contrasting effects of straw and straw-derived biochar amendments on greenhouse gas emissions within double rice cropping systems. Agric. Ecosyst. Environ. 2014, 188, 264–274. [Google Scholar] [CrossRef]
  38. Olmo, M.; Villar, R.; Salazar, P.; Alburquerque, J.A. Changes in soil nutrient availability explain biochar’s impact on wheat root development. Plant Soil 2016, 399, 333–343. [Google Scholar] [CrossRef]
  39. Soinne, H.; Hovi, J.; Tammeorg, P.; Turtola, E. Effect of biochar on phosphorus sorption and clay soil aggregate stability. Geoderma 2014, 219, 162–167. [Google Scholar] [CrossRef]
  40. Duan, P.; Zhang, X.; Zhang, Q.; Wu, Z.; Xiong, Z. Field-aged biochar stimulated N2O production from greenhouse vegetable production soils by nitrification and denitrification. Sci. Total Environ. 2018, 642, 1303–1310. [Google Scholar] [CrossRef]
  41. Laird, D.; Fleming, P.; Wang, B.; Horton, R.; Karlen, D. Biochar impact on nutrient leaching from a Midwestern agricultural soil. Geoderma 2010, 158, 436–442. [Google Scholar] [CrossRef]
  42. Cao, X.; Ma, L.; Gao, B.; Harris, W. Dairy-manure derived biochar effectively sorbs lead and atrazine. Environ. Sci. Technol. 2009, 43, 3285–3291. [Google Scholar] [CrossRef] [PubMed]
  43. Grant, C.D.; Dexter, A.R. Air entrapment and differential swelling as factors in the mellowing of molded soil during rapid wetting. Aust. J. Soil Res. 1990, 28, 361–369. [Google Scholar] [CrossRef]
  44. Jastrow, J.D. Soil aggregate formation and the accrual of particulate and mineral-associated organic matter. Soil Biol. Biochem. 1996, 28, 665–676. [Google Scholar] [CrossRef]
  45. Yan, X.; Akiyama, H.; Yagi, K.; Akimoto, H. Global estimations of the inventory and mitigation potential of methane emissions from rice cultivation conducted using the 2006 Intergovernmental Panel on Climate Change Guidelines. Glob. Biogeochem. Cycles 2009, 23, GB2002. [Google Scholar] [CrossRef]
  46. Huang, R.; Tian, D.; Liu, J.; Lv, S.; He, X.; Gao, M. Responses of soil carbon pool and soil aggregates associated organic carbon to straw and straw-derived biochar addition in a dryland cropping mesocosm system. Agric. Ecosyst. Environ. 2018, 256, 576–586. [Google Scholar] [CrossRef]
  47. Zhao, H.; Wang, Z.; Liu, H.; Xiao, H.; Gao, M. Water-stable aggregates and aggregate-associated organic carbon after two years of biochar application. Arch. Agron. Soil Sci. 2023, 69, 2218–2232. [Google Scholar] [CrossRef]
  48. Song, D.; Xi, X.; Zheng, Q.; Liang, G.; Zhou, W.; Wang, X. Soil nutrient and microbial activity responses to two years after maize straw biochar application in a calcareous soil. Ecotoxicol. Environ. Saf. 2019, 180, 348–356. [Google Scholar] [CrossRef] [PubMed]
  49. Anderson, C.R.; Condron, L.M.; Clough, T.J.; Fiers, M.; Stewart, A.; Hill, R.A.; Sherlock, R.R. Biochar induced soil microbial community change: Implications for biogeochemical cycling of carbon, nitrogen and phosphorus. Pedobiologia 2011, 54, 309–320. [Google Scholar] [CrossRef]
  50. Lemke, R.L.; VandenBygaart, A.J.; Campbell, C.A.; Lafond, G.P.; Grant, B. Crop residue removal and fertilizer N: Effects on soil organic carbon in a long-term crop rotation experiment on a Udic Boroll. Agric. Ecosyst. Environ. 2010, 135, 42–51. [Google Scholar] [CrossRef]
  51. Haynes, R.J. Labile Organic Matter Fractions as Central Components of the Quality of Agricultural Soils: An Overview. Adv. Agron. 2005, 85, 221–268. [Google Scholar]
  52. Jin, Z.; Zhang, X.; Chen, X.; Du, Z.; Ping, L.; Han, Z.; Tao, P. Dynamics of soil organic carbon mineralization and enzyme activities after two months and six years of biochar addition. Biomass Convers. Biorefinery 2021, 10, 1153–1162. [Google Scholar] [CrossRef]
  53. Poeplau, C.; Helfrich, M.; Dechow, R.; Szoboszlay, M.; Tebbe, C.C.; Don, A.; Greiner, B.; Zopf, D.; Thumm, U.; Korevaar, H.; et al. Increased microbial anabolism contributes to soil carbon sequestration by mineral fertilization in temperate grasslands. Soil Biol. Biochem. 2018, 130, 167–176. [Google Scholar] [CrossRef]
  54. Russell, J.B.; Cook, G.M. Energetics of bacterial growth: Balance of anabolic and catabolic reactions. Microbiol. Rev. 1995, 59, 48–62. [Google Scholar] [CrossRef] [PubMed]
  55. Manzoni, S.; Porporato, A. Soil carbon and nitrogen mineralization: Theory and models across scales. Soil Biol. Biochem. 2009, 41, 1355–1379. [Google Scholar] [CrossRef]
Figure 1. (ad) Soil aggregate distribution in different soil depths using the routine wet sieving method, fast sieving method, slow sieving method, and wetting–stirring method (%). Values are means (n = 3), and error bars represent standard errors.
Agronomy 14 00899 g001
Figure 2. (ad) Soil aggregate MWDs in different soil depths by using different sieving methods (mm). Note: Small letters in the same soil depth denote significant differences among the various treatments at p ≤ 0.05, the same below.
Agronomy 14 00899 g002
Figure 3. (a,b) Soil aggregate relative slaking index and relative mechanical breakdown index in different soil depths. Note: RSI is the stability of aggregate under the slaking of air under pressure in the pores of moist soil; RMI is the stability of aggregate under external stress.
Agronomy 14 00899 g003
Figure 4. Soil organic carbon, soil dissolved organic carbon, soil micro biomass carbon, and soil readily oxidized organic carbon concentrations at different soil depths.
Agronomy 14 00899 g004
Figure 5. Structural equation modeling of the effect of each treatment condition on the mean weight diameter of soil aggregate and the stability of the aggregates. Note: **, represent 1% significance level; MWDRoutW is aggregate mean weight diameter by using routine wet sieving method; RSI is stability of aggregate under the slaking of air under pressure in the pores of moist soil; and RMI is stability of aggregate under external stress.
Agronomy 14 00899 g005
Figure 6. (a) Correlation analysis between soil organic carbon and MWD of soil aggregates. (b) PLS-DA. Note: * represent 5% significance level. B, C, and N classes represent biochar, control, and straw treatments, respectively.
Agronomy 14 00899 g006
Table 1. Experimental treatments’ descriptions.
TreatmentNutrient SourceDetailed Description
CN0N0Control (zero-amendment)
CN100100 kg(N) ha−1N applied annually
BN015 t ha−1 biocharBiochar applied in 2014 and 2018
BN10015 t ha−1 biochar + 100 kg(N) ha−1Biochar applied in 2014 and 2018, and N applied annually
SN04.5 t ha−1 straw4.5 t ha−1 of straw applied annually
SN1004.5 t ha−1 straw + 100 kg(N) ha−14.5 t ha−1 of straw and N applied annually
Table 2. Effects of nitrogen, straw, and biochar on soil aggregate MWD in different soil depths under four wet sieving methods.
Soil Depth (cm)Factors
NitrogenBiocharStrawNitrogen × BiocharNitrogen × Straw
MWDRoutW0–1052.40 ***540.16 ***1394.13 ***5.82 *2.32 n.s.
10–30362.44 ***2104.77 ***5704.29 ***28.15 ***47.14 ***
MWDFastW0–1022.86 ***143.79 ***319.31 ***3.84 n.s.0.10 n.s.
10–3043.75 ***169.39 ***428.33 ***2.61 n.s.4.55 n.s.
MWDSlowW0–109.46 **46.60 ***245.93 ***5.18 *0.19 n.s.
10–3014.76 **39.57 ***209.50 ***2.61 n.s.0.61 n.s.
MWDWetS0–1017.76 **69.67 ***344.40 ***2.37 n.s.0.01 n.s.
10–3044.03 ***119.00 ***657.47 ***5.58 *2.48 n.s.
Note: n.s., indicated that not significantly, *, significantly level at p ≤ 0.05. **, significantly level at p ≤ 0.01. ***, significantly level at p ≤ 0.001, respectively, the same below. The numbers in the table are F values; MWDRoutW is Mean Weight Diameter by routine-wet sieving; MWDFastW is Mean Weight Diameter by fast-wetting sieving; MWDSlowW is Mean Weight Diameter by slow-wetting sieving; MWDWetS is Mean Weight Diameter by wetting-stirring sieving.
Table 3. Effects of nitrogen, straw, and biochar on soil aggregate relative slaking index and relative mechanical breakdown index in different soil depths.
Soil Depth (cm)Factors
NitrogenBiocharStrawNitrogen × BiocharNitrogen × Straw
RSI0–101.60 n.s.72.58 ***50.40 ***2.13 n.s.1.42 n.s.
10–300.83 n.s.42.17 ***17.28 **0.23 n.s.0.27 n.s.
RMI0–100.37 n.s.11.84 **13.50 **2.80 n.s.1.58 n.s.
10–300.01 n.s.2.11 n.s.2.21 n.s.0.04 n.s.0.03 n.s.
Note: The numbers in the table are F values; RSI is relative slaking index; and RMI is relative mechanical breakdown index. n.s., indicated that not significantly. **, significantly level at p ≤ 0.01. ***, significantly level at p ≤ 0.001, respectively, the same below.
Table 4. Effects of nitrogen, straw, and biochar on soil organic C (SOC) in different soil depths.
Soil Depth (cm)Factors
NitrogenBiocharStrawNitrogen × BiocharNitrogen × Straw
SOC0–10252.82 ***1571.20 ***402.01 ***27.67 ***0.32 n.s.
10–30307.65 ***1841.27 ***72.40 ***14.92 ***0.39 n.s.
Note: The numbers in the table are F values; SOC is soil organic C; n.s., indicated that not significantly. ***, significantly level at p ≤ 0.001.
Disclaimer/Publisher’s Note: The statements, opinions and data contained in all publications are solely those of the individual author(s) and contributor(s) and not of MDPI and/or the editor(s). MDPI and/or the editor(s) disclaim responsibility for any injury to people or property resulting from any ideas, methods, instructions or products referred to in the content.

