

Simulation Model for Assessing High-Temperature Stress on Rice

1
Key Laboratory of Ministry of Education for Genetics, Breeding and Multiple Utilization of Crops, College of Agronomy, Fujian Agriculture and Forestry University, Fuzhou 350002, China
2
Institute of Agricultural Information, Jiangsu Academy of Agricultural Sciences, Nanjing 210014, China
*
Authors to whom correspondence should be addressed.
Agronomy 2024, 14(5), 900; https://0-doi-org.brum.beds.ac.uk/10.3390/agronomy14050900
Submission received: 25 March 2024
/
Revised: 22 April 2024
/
Accepted: 23 April 2024
/
Published: 25 April 2024
(This article belongs to the Topic Advances in Crop Simulation Modelling)
Abstract
:Rice is a staple grain crop extensively cultivated in Fujian Province, China. This study examined the impact of high-temperature stress on rice yield and its components, focusing on four representative rice varieties, including early and middle rice grown in Fujian Province. Results indicate significant yield losses, with the most severe reduction of 60.8% observed during the flowering stage of early rice and over 40% during the meiosis and flowering stages of middle rice. High-temperature stress primarily affects early rice yield more at the flowering stage than at the grain-filling stage, whereas in middle rice, it is more severe at the meiosis stage than at the flowering stage. Leveraging historical climatic data spanning the past 20 years, a simulation model for high-temperature stress on rice yield was developed to assess disaster-induced yield loss rates, aiming to enhance prevention and disaster damage assessment for rice under high-temperature stress. Application of the model to four rice planting sites in Fujian Province revealed contrasting temporal changes between loss rates and meteorological yield, with middle rice experiencing more severe damage than early rice. The model’s effectiveness is validated by the strong correspondence between yield loss rate and meteorological yield across different regions, highlighting its robust simulation capabilities.
1. Introduction
Nearly half of the world’s population relies on rice as their primary food crop [1,2], with China particularly dependent, where 60% of the population considers rice their staple food [3,4]. Ensuring the safety of rice production is crucial as rice is a more focused crop compared to any other crop. In Fujian Province, rice production accounts for 72% of total grain production, making the abundance or failure of rice a significant factor in local food security [5]. However, recent years have seen an increase in extreme heat events due to global warming, leading to more severe damage to rice production in Fujian [6,7,8].
In Fujian Province, the peak temperatures typically occur in July and August, coinciding with the crucial growth stages of early rice, including flowering and grain filling, as well as the meiosis and flowering stages of middle rice. These stages are highly sensitive to high temperatures, significantly impacting yield when exposed to prolonged heat [9]. The majority of current research on high temperatures and their impact on rice focuses on identifying vulnerable stages, understanding the causes, and developing mitigation strategies. Elevated temperatures during critical growth phases like meiosis, flowering, and grain filling affect important yield factors such as grain number per panicle, seed setting rate, and thousand-grain weight [10,11,12]. Existing research focuses on developing models to predict high-temperature-induced abortion in rice and quantifying its effects on seed setting rates. Some models directly adjust yield based on the relationship between high temperatures and seed setting rates during the flowering stage, neglecting factors such as daily temperature fluctuations and the flowering process [13,14]. Shi et al. (2007) developed a process-based model for high-temperature failure during rice flowering by incorporating daily changes in the flowering pattern of rice glumes, flowering and seed setting rates, and daily temperature fluctuations [15]. While the model aligned well with the developmental characteristics of rice glumes, it did not consider the effect of high temperature during meiosis or the cooling of panicle respiration (i.e., the temperature difference between the panicle and air) in the model. Oort et al. (2014) developed a model for rice population seed setting rates by integrating daily temperature variations, panicle respiratory cooling, daily flowering patterns, and factors related to high-temperature failure [16]. However, similar to other models, it did not consider the effect of high temperature during meiosis.
Commonly used rice growth models, such as CERES-Rice, SIMRIW, DSSAT, RCSODS, ORYZA, and RiceGrow inadequately consider the quantitative effects of high-temperature processes [17,18,19,20,21,22,23,24,25]. Specifically, the advantage of these crop growth models lies in simulating the effects of soil, water, and nutrients on crop growth and development, describing crop physiology, and making field management decisions. However, it lacks a quantitative assessment of high-temperature-induced heat damage losses in rice. While some models partially account for high temperature’s influence on seed setting rate during flowering, they overlooked its effects on grain number per panicle during meiosis and thousand-grain weight during the flowering and grain-filling stages. High temperatures during both meiosis and flowering affect seed setting rates and reduce thousand-grain weight, indicating a prolonged impact on rice plant photosynthetic capacity. Therefore, developing a quantitative model to assess the impact of high temperatures on various rice yield components throughout different growth stages is crucial for enhancing our understanding of rice growth and improving existing models.
This study elucidates the intrinsic links between high-temperature effects on yield components in early and middle rice stages through controlled and field experiments. It examines the effects of high-temperature stress on rice yield during critical growth periods, develops a model to simulate high-temperature effects on rice growth processes, and establishes a method for evaluating high-temperature damage to rice. This study aims to enhance existing rice growth models and improve the assessment of high-temperature damage in rice defense mechanisms.
2. Materials and Methods
2.1. Plant Materials and Experimental Site
The rice varieties used in this study were provided by the Institute of Crop Genetics and Improvement, College of Agriculture, Fujian Agriculture and Forestry University. For early rice, we selected the indica-type three-line hybrid rice varieties Rongshengyou1131 and T78you2155, whereas for middle rice, we selected the indica-type two-line hybrid rice Heliangyou676 and the indica-type temperature-sensitive three-line hybrid rice IIYou3301. To maintain consistency in genetic characteristics and to facilitate equipment, materials, and field management, the experiments were conducted at the rice experimental base of Jiangsu Academy of Agricultural Sciences (32°2′ N, 118°52′ E).
2.2. Experimental Design
Experiments were conducted from April to November 2021. Early rice was sown to seedling trays on 17 April 2021, followed by middle rice on 14 May. After one month, 300 seedlings of each variety were transplanted into plastic buckets (21 cm depth, 22 cm diameter), totaling 600 buckets. Each bucket accommodated two seedlings in individual holes, filled with 6.5 kg of loamy rice soil. A total of 4 kg of composite fertilizer (15% nitrogen, phosphorus, and potassium content) was used in the experiment. After one week of transplantation, 0.35 g of urea were applied per bucket. Additionally, the water level in the bucket was kept 1.5 cm above the soil. Agronomic management measures were implemented according to routine procedures.
When rice reached specific developmental stages, including meiosis (identified by complete withdrawal of raphe leaves), flowering (marked by over 50% of plants in the field flowering), and grain filling (where over 50% of seeds in the middle of rice panicles were filled with milky contents in the glumes), it was transferred to an artificial climatic box for high-temperature stress treatments [26]. Two temperature gradients were applied: T1 (35 °C) and T2 (41 °C) (rice cannot mature normally beyond 41 °C), each for D1 (3 d) and D2 (7 d). High-temperature treatment lasted 5 h daily (10:00–15:00), with lighting set at 1.2 × 10⁴ Lux. Plants were grown in natural conditions for the remaining time. Each rice variety underwent four treatments, with two buckets and two holes per bucket, totaling four replicates. Humidity in the climatic box was maintained at 85%, reflecting natural conditions during the test period. After high-temperature treatment, rice was returned to natural conditions until maturity, when factors were measured.
Table 1 displays the timing and duration of high-temperature treatment, whereas Figure 1 illustrates the changes in daily maximum and average temperatures in the natural environment before and after treatment. The maximum temperature in the natural environment exceeded 35 °C during certain periods of the experiment. To prevent naturally high temperatures from affecting the control group (CK), the experiment was conducted in an artificial climate chamber during the high-temperature treatment period (10:00–15:00), maintaining a suitable temperature for rice growth (30 °C).
2.3. Meteorological Data
We employed accumulated degree-hours of high temperature (ADHT) to characterize the comprehensive impact of high-temperature intensity and duration [27]. The calculation method is as follows:
where t0 and t1 denote the starting and ending times of high-temperature treatment, respectively. is the high-temperature index at the j-th moment of the i-th high-temperature day. is the temperature at the j-th moment of the i-th high-temperature day, and is the critical temperature affecting meiosis, flowering, and grain filling under high-temperature stress, set at 31 °C [28].
The developmental parameters from sowing to seedling emergence, seedling emergence to panicle differentiation, panicle differentiation to heading, and heading to maturity stages were denoted as P1, P2, P3, and P4, respectively. They were calculated as follows:
where GDDi is the growth degree day on day i, Ti is the average air temperature on day i, and TB, TO, and TH are the starting, optimum, and maximum temperatures for rice development, set to 10 °C, 30 °C, and 42 °C, respectively [17].
The high-temperature loss rate of yield and its components quantifies the reduction in yield and constitutive factors due to high temperature, calculated as follows:
where denotes the measured value of each factor under high-temperature stress treatment, and denotes the measured value at room temperature.
2.4. Modeling and Testing
2.4.1. Determination and Testing of Parameters in the Rice Growth Model
In this study, we independently developed and constructed the rice growth model with reference to the ORYZA 3.0 system for stage division and parameter settings [25]. The existing rice growth model divides the rice developmental stages into four: sowing to seedling emergence, seedling emergence to panicle differentiation, panicle differentiation to heading, and heading to maturity. The rice developmental index (DI) was used to express different growth processes: 0 for sowing, 1 for seedling emergence, 1.5 for panicle differentiation, 2 for heading, and 3 for maturity [17]. The meiosis stage generally begins approximately 15 d before heading, which coincides with the inverted 0.5 leaf age. Heading occurs around 10 d after the leaf blades have completely withdrawn. By integrating this information with a dynamic model for leaf age, we estimated that the meiosis stage corresponds to a DI of approximately 1.8.
We adopted the calculation method of rice growth period parameters from the CERES-Rice model [20] and used GDDi to simulate and predict the rice development process. After determining the growth period parameters based on experimental data, we used daily meteorological data from representative sampling sites in Fujian Province from 2017 to 2020, along with local sowing times, to simulate rice growth. Subsequently, we tested the model using regional experimental measurement data from 2017 to 2020. We evaluated the model’s performance using the relative root mean square error (rRMSE), calculated as follows:
where OBSi is the observed value, SIMi is the simulated value, and n is the sample size. An rRMSE of less than 10% indicates good simulation performance, whereas over 30% indicates poor performance.
2.4.2. Construction of High-Temperature Heat Damage Model and Assessment of Disaster Damage
By evaluating the impact of various high-temperature treatments on rice yield and its components and establishing the quantitative relationship between ADHT and yield constituents, we can estimate rice yield loss due to high temperatures during critical growth periods. Subsequently, high-temperature heat damage models for both early and middle rice can be developed.
In Equation (5), represents the combined yield loss rate under the influence of high temperature and heat damage in rice. is the loss rate of seed setting rate, denotes the loss rate of thousand-grain weight, and is the loss rate of grain number per panicle.
To establish quantitative relationships between ADHT and various yield components at different growth periods, OriginPro 9.0 was used for Logistic curve fitting [29]. Analysis of variance (ANOVA) of the experimental results was conducted using SPSS 25 software for one-way ANOVA, with the Duncan method employed for multiple comparative analyses.
When applying the rice high-temperature heat damage model to assess the damage of representative sampling sites in Fujian Province, the meteorological yield was used to eliminate the influence of agricultural technology development on historical yield. The calculation method is as follows:
where is the meteorological yield, is the actual yield, and is the trend yield.
3. Results
3.1. Effect of High Temperature on Rice Yield and Its Components at Different Growth Periods
3.1.1. Effect of High Temperature on Early Rice Yield and Its Components during Flowering
Longer durations of high-temperature treatment and higher temperatures corresponded to more pronounced declines in rice yield per plant (Table 2). Compared with CK, under D1 treatment, Rongshengyou1131 experienced yield decreases of 6.9% and 44.2%, and T78you2155 experienced decreases of 8.3% and 41.3% when subjected to T1 and T2 treatments, respectively. Under D2 treatment, Rongshengyou1131 exhibited yield reductions of 22.0% and 56.7%, and T78you2155 yield decreased by 23.4% and 60.8% under T1 and T2 treatments, respectively.
While high temperatures did not significantly affect the effective number of panicles or the grain number per panicle in the two varieties, they significantly impacted the seed setting rate. Compared to the CK, the seed setting rate decreased by 6.9–64.5% in Rongshengyou1131 and 4.4–58.7% in T78you2155. Thousand-grain weight decreased significantly (at the 0.05 level) only in the T2D2 treatment, with reductions of 7.7% in Rongshengyou1131 and 9.7% in T78you2155.
Therefore, the effect of high temperature during flowering was less pronounced on Rongshengyou1131 than on T78you2155. High-temperature stress significantly affected the seed setting rate of both varieties but had no significant impact on the number of panicles or grain number per panicle. Thousand-grain weight changed significantly only under T2D2 treatment.
All variations of yield components with ADHT were fitted using a logistic curve, showing a negative correlation (Equation (8)).
where represents the relative seed setting rate, denotes the relative thousand-grain weight, and is the relative grain number per panicle. represents the seed setting rate, denotes the thousand-grain weight, and is the grain number per panicle.
where is the high-temperature cumulative index under high-temperature treatments, whereas , , and are the fitting coefficients.
Because the number of panicles and grain number per panicle had already stabilized at the flowering stage of early rice, with no significant changes observed after high-temperature treatment (Table 2), only variations in seed setting rate and thousand-grain weight were considered in the yield components under high-temperature stress during this period. The curves depicting changes in relative seed setting rate and relative thousand-grain weight with ADHT after high-temperature treatment during flowering of early rice are presented in Figure 2a, alongside the fitting coefficients and R2 values in Table 3.
3.1.2. Effect of High Temperature on Early Rice Yield and Its Components during Grain Filling
Following high-temperature treatment during the grain-filling stage, the performance of the two early rice varieties differed. Rongshengyou1131 exhibited a significant decrease in yield per plant under T2 treatment, whereas T78you2155 experienced a notable decline after T1 treatment (Table 4). The seed setting rate of Rongshengyou1131 decreased significantly by 1.5% to 11.6% post-high temperature treatment, whereas T78you2155 did not show any significant reduction in seed setting rate.
High temperatures during the grain-filling stage significantly affected the thousand-grain weight of both varieties, with higher temperatures and longer treatment times leading to lower thousand-grain weights. Rongshengyou1131’s thousand-grain weight decreased by 1.1% to 8.7%, whereas T78you2155’s decreased by 0.9% to 9.0%. Overall, both varieties experienced similar degrees of influence from the high-temperature stress on thousand-grain weight.
The results indicate that the effect of high temperature during the grain-filling stage primarily affects the seed setting rate and thousand-grain weight of early rice. Both varieties exhibited varying degrees of yield reduction due to high temperature, whereas the effective number of panicles and grain number per panicle remained unaffected by high-temperature treatment during this stage.
3.1.3. Effect of High Temperature on Middle Rice Yield and Its Components during Meiosis
The effects of high temperatures during meiosis on the yield and its components of IIYou3301 and Heliangyou676 middle rice varieties are outlined in Table 5. Meiosis is one of the pivotal growth stages sensitive to temperature, which significantly influences panicle growth and development. Higher temperatures and prolonged treatment durations correlate with more pronounced decreases in the yield per middle rice plant (Table 5). Compared with CK, the single plant yield reduction ranged from 5.7% to 41.2% for IIYou3301 and 8.1% to 43.6% for Heliangyou676.
The grain number per panicle exhibited a significant decrease under high-temperature stress, with longer treatment durations exacerbating this decrease. The most significant reductions in grain number per panicle for IIYou3301 and Heliangyou676 were observed under the T2D2 treatment, reaching up to 15.2% and 17.4%, respectively. While the number of effective panicles remained unaffected, high-temperature stress notably impacted the seed setting rate and thousand-grain weight. Compared to CK, reductions in seed setting rate were minimal under T1D1 treatment, at 2.4% for IIYou3301 and 0.6% for Heliangyou676, and maximal under T2D2 treatment, at 26.8% and 30.8%, respectively. Thousand-grain weight reductions due to high temperature ranged from 1.1% to 8.8% for IIYou3301 and from 0.6% to 9.8% for Heliangyou676 during this stage.
The results indicate that high-temperature stress during meiosis does not significantly affect the effective number of panicles for both varieties. However, its impact on the seed setting rate outweighs that on the grain number per panicle and thousand-grain weight. Specifically, the seed setting rate of IIYou3301 was less affected by high temperature than that of Heliangyou676, whereas the grain number per panicle and thousand-grain weight exhibit similar responses to high-temperature stress for both varieties.
Figure 2c,e illustrate the variation in relative grain number per panicle, relative seed setting rate, and relative thousand-grain weight of middle rice with ADHT under different high-temperature treatments during grain filling. The fitting coefficients A1, x0, p, and their corresponding R2 values are shown in Table 6.
3.1.4. Effect of High Temperature on Middle Rice Yield and Its Components during Flowering
The effects of high temperatures during flowering on the yields and components of the middle rice varieties IIYou3301 and Heliangyou676 are presented in Table 7. It reveals a consistent negative correlation between single plant yield and temperature for both varieties, indicating that higher temperatures and longer treatment durations result in more pronounced declines in yield. For instance, compared to CK, IIYou3301 exhibited yield reductions ranging from 15.2% to 33.5% after high-temperature treatment at the flowering stage, whereas Heliangyou676 experienced reductions ranging from 15.1% to 42.1%. The yield decrease was more significant for Heliangyou676 following T2 treatment than for IIYou3301. High-temperature treatment did not significantly affect the number of panicles or grain number per panicle for either variety. However, there was a considerable decline in the seed setting rate and thousand-grain weight, with IIYou3301 and Heliangyou676 showing the smallest decreases in seed setting rate under T1D1 treatment (12.2% and 9.2%, respectively) and the largest under T2D2 treatment (34.5% and 37.0%, respectively). The thousand-grain weight of both varieties was less affected by high temperatures during flowering. Specifically, the thousand-grain weight of both varieties was less affected by the high temperature during T2D2, making the thousand-grain weight of both varieties more significant. The thousand-grain weight of the two varieties was less affected by the high temperature during the flowering stage, with the largest decreases of 5.7% and 5.2%, respectively.
The results indicate that during the high-temperature treatment at the flowering stage, the single plant yield of IIYou3301 was less affected by high temperatures than that of Heliangyou676. There was no significant impact on the number of panicles and grain number per panicle for both varieties. Additionally, the reduction in seed setting rate and thousand-grain weight showed similar patterns between the two varieties.
3.2. Establishment of a Simulation Model for High-Temperature Damage of Rice
3.2.1. Construction of a High-Temperature Damage Assessment Model for Rice in Fujian Province
Based on the experimental findings regarding the effects of high temperatures during various growth stages of both early and middle rice, quantitative relationships were established. These relationships encompassed the effects on seed setting rate, thousand-grain weight, and grain number per panicle. Consequently, the high-temperature heat damage rates for early and middle rice at different growth stages were determined (Table 8).
For early rice, the assessment model for high temperature and heat damage is as follows:
For middle rice, the assessment model for high temperature and heat damage is as follows:
Here, x in the model represents the ADHT at different growth stages.
3.2.2. Determination and Testing of Rice Growth Period Parameters
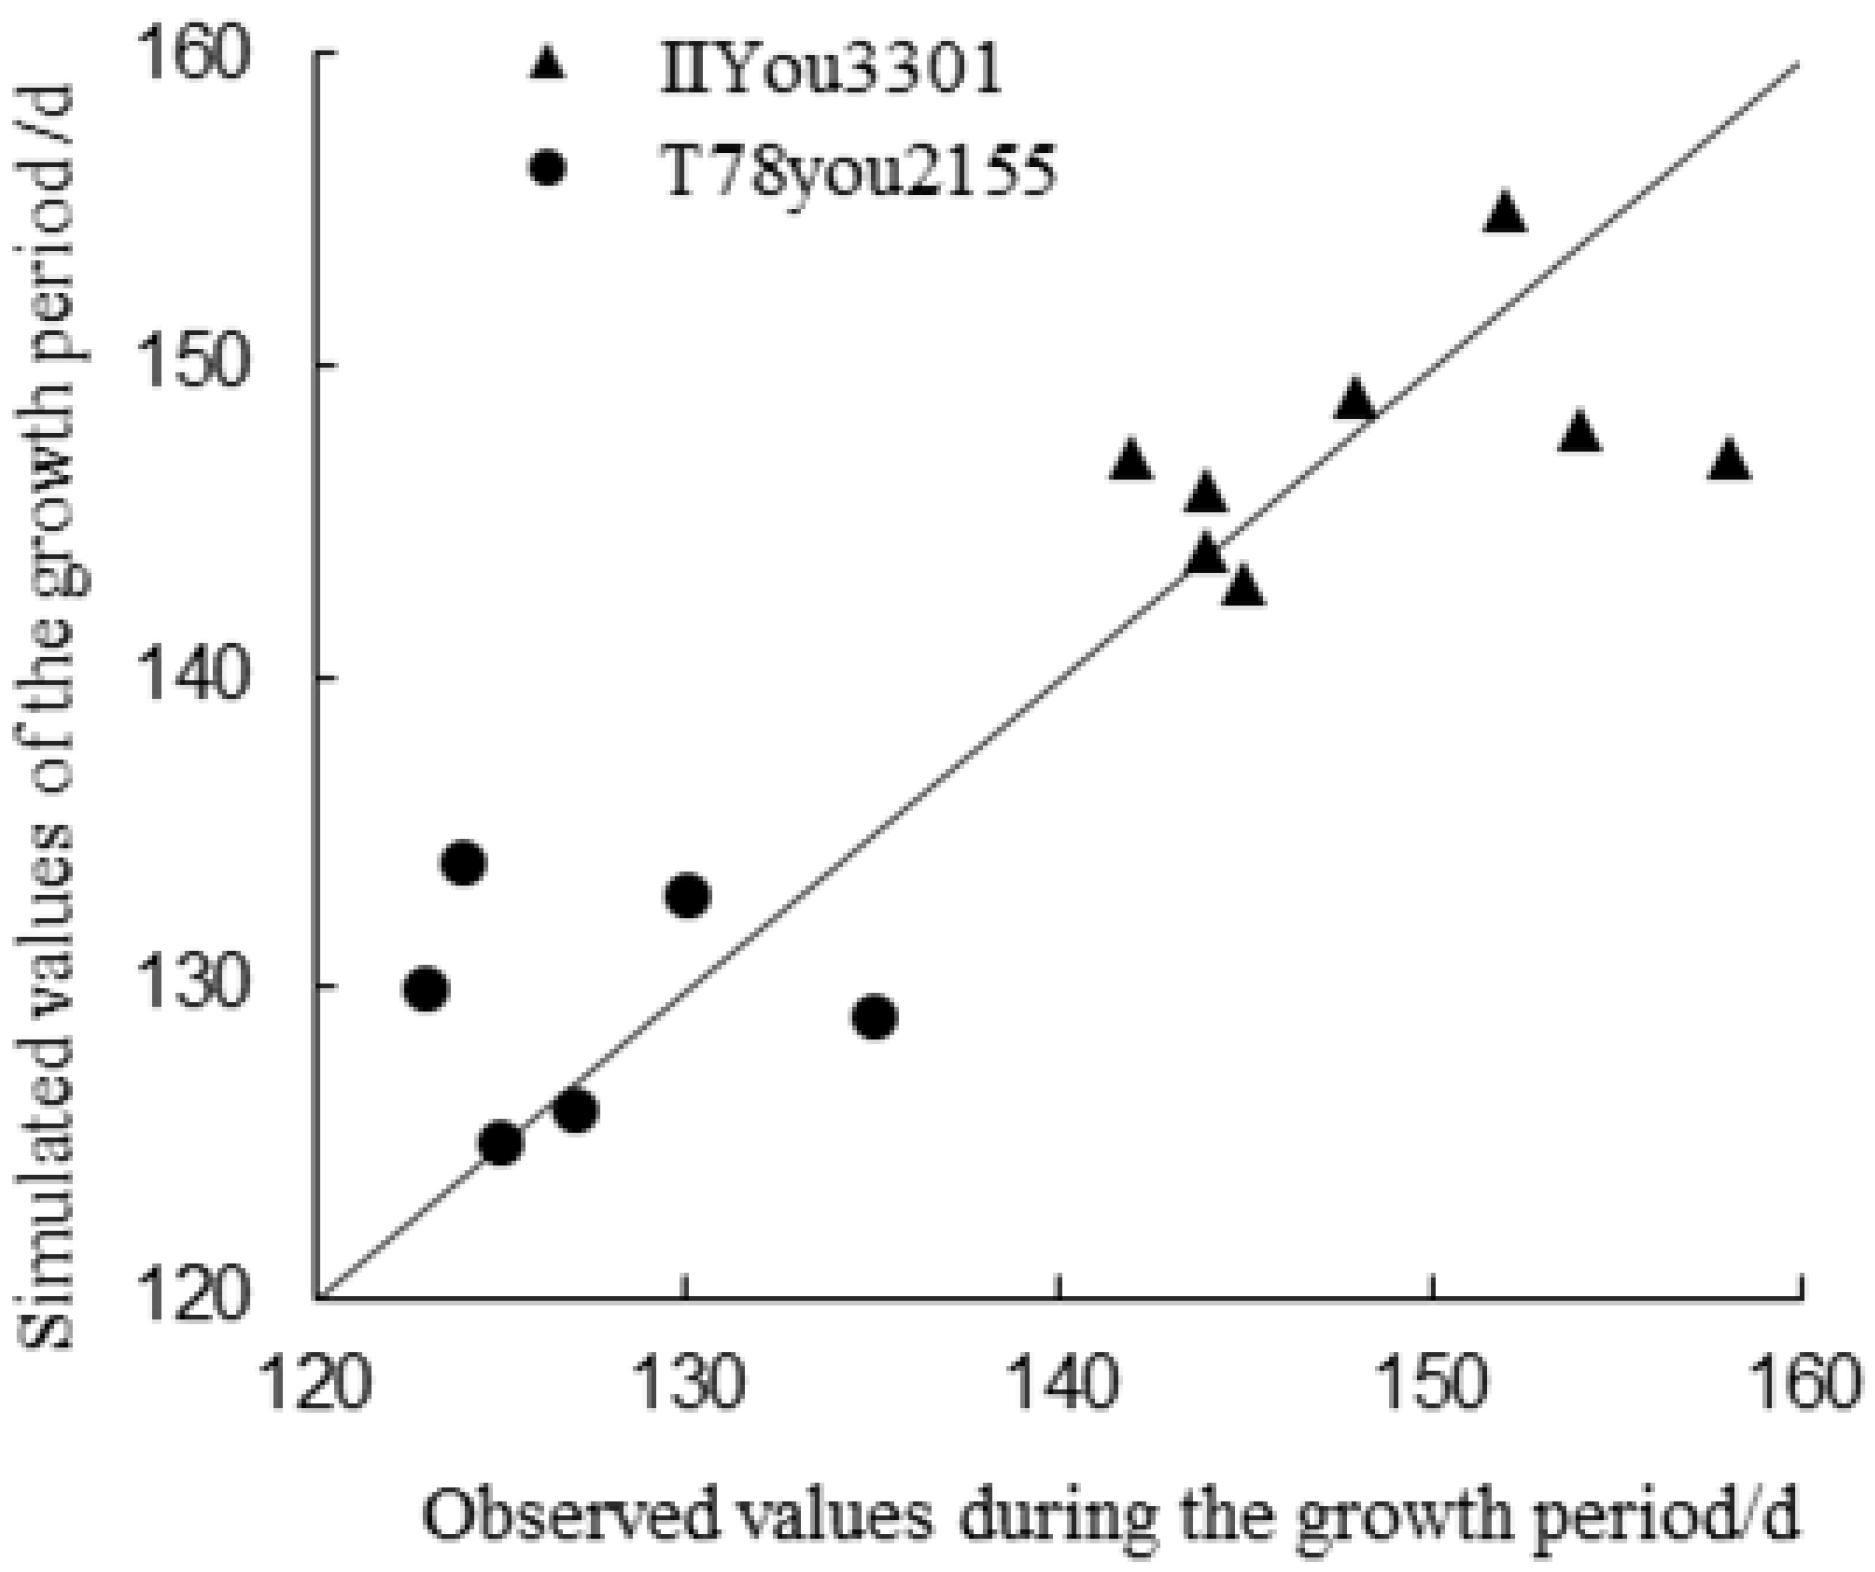
The growth period parameters for the four rice varieties were calculated using Equation (2) based on the experimental data (Table 9). These parameters were further validated using the rice growth model and data from regional trials conducted in Fujian Province from 2017 to 2020 (Figure 3). The obtained correlation coefficients and rRMSE from the testing phase were 0.89% and 3.81%, respectively. These results indicate the reliability and validity of the rice growth period parameters in this study.
3.2.3. Assessment of High Temperature Heat Damage Losses in Rice in Fujian Province
Utilizing the growth period parameters and the high-temperature heat damage model of rice, along with climatic data spanning the past two decades in Fujian Province, historical rice yields can be assessed for high-temperature damage.
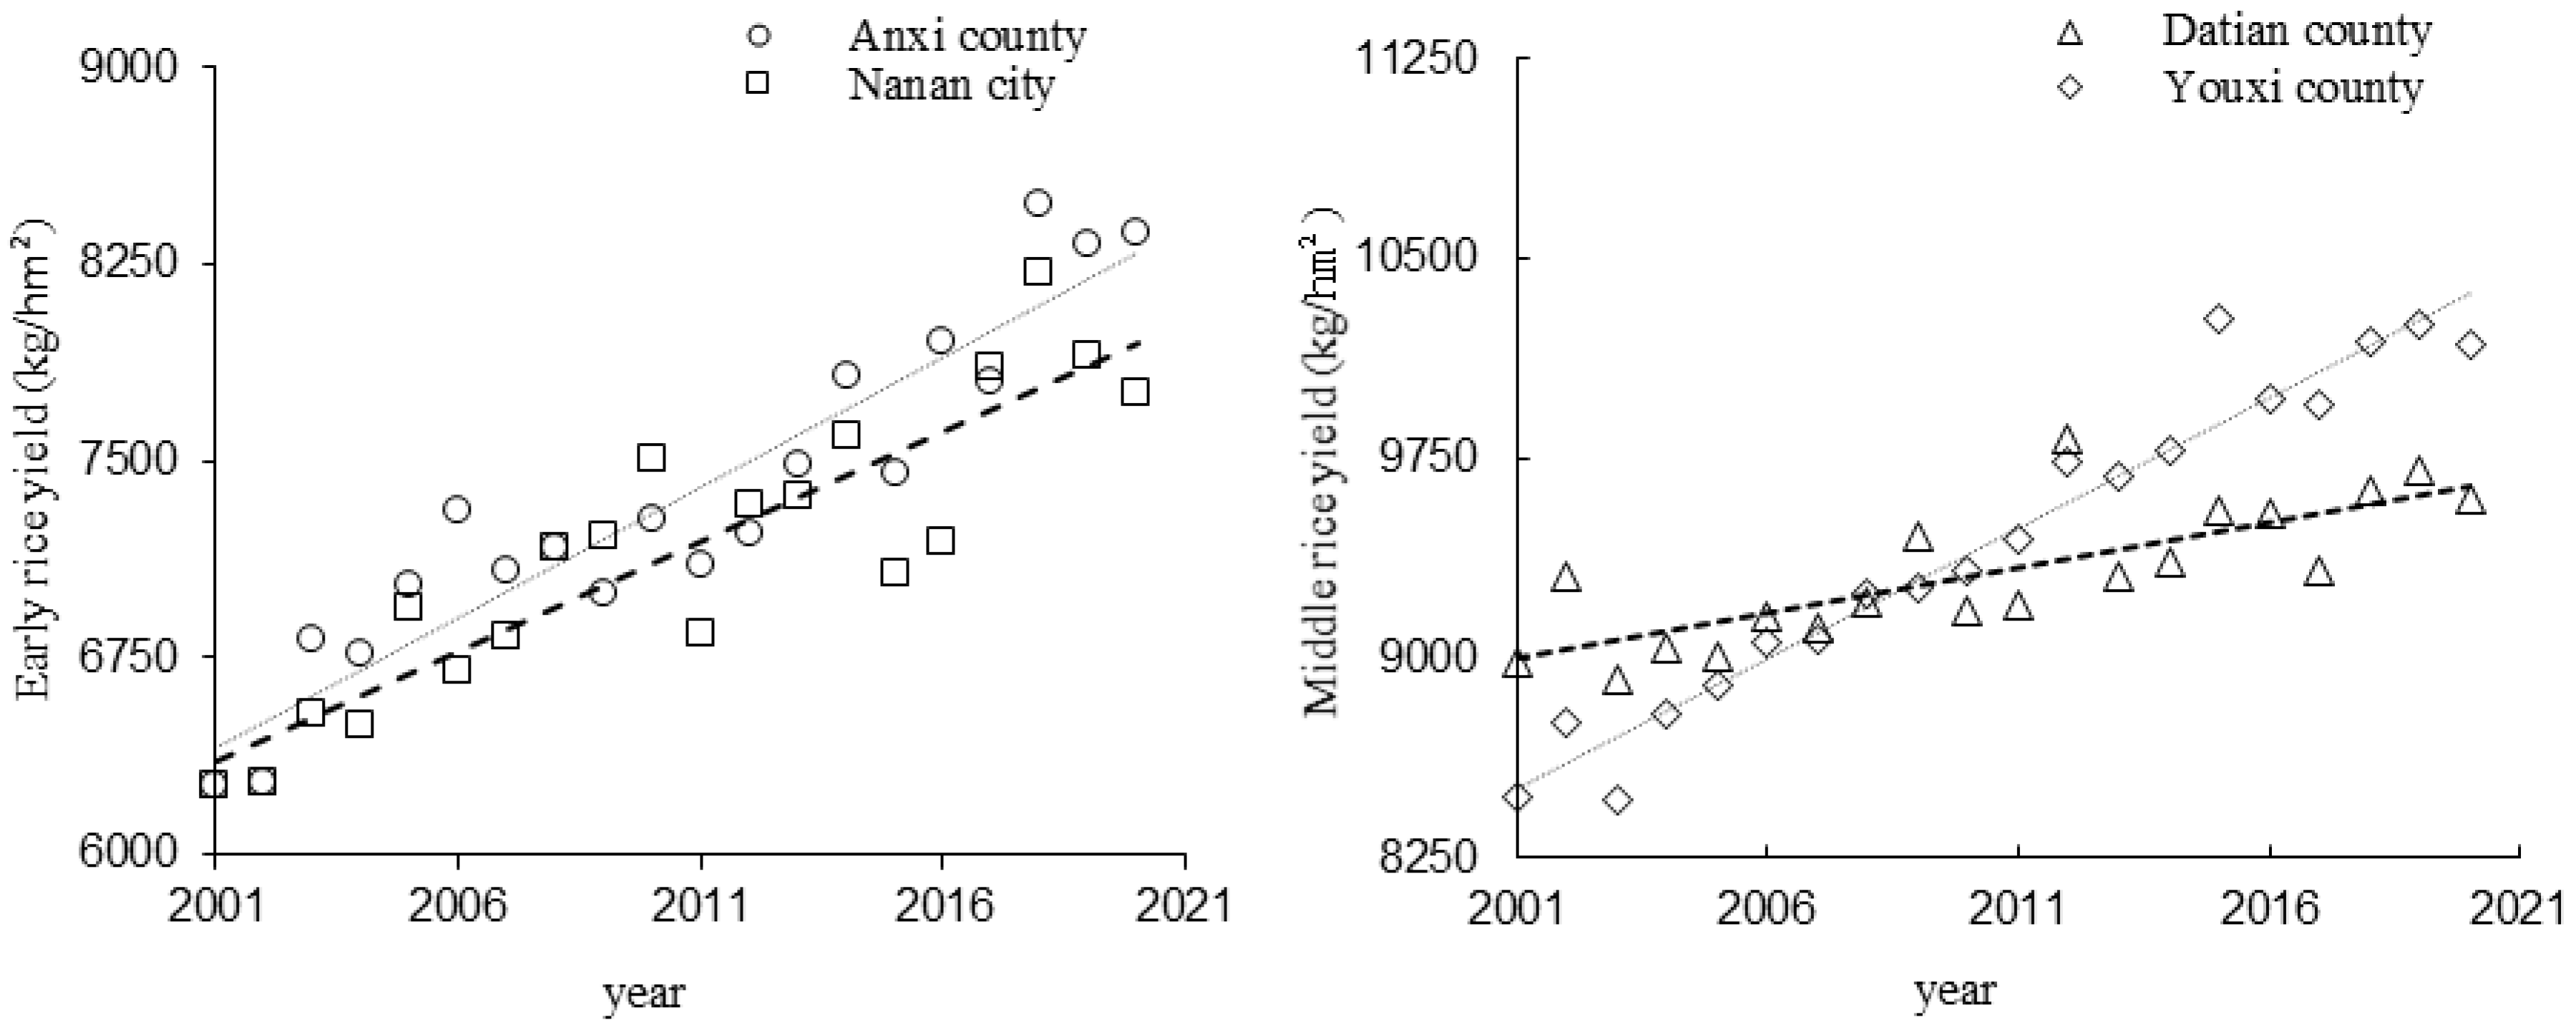
In this study, two sample sites each for early rice cultivation (Anxi and Nan’an) and middle rice cultivation (Datian and Youxi) were selected in Fujian Province. The meteorological yields of these four sites from 2001 to 2020 were assessed for disaster damage. To ensure accuracy, the actual yield was adjusted to account for planting techniques and other influencing factors (Figure 4).
The simulated rice yield loss rates due to high temperature and heat damage at these four sample sites over the past 20 years are depicted in Figure 5. Early rice in Anxi County and Nan’an City generally experienced heat-induced yield loss rates ranging from 0% to 15%, with peaks at 71.5% and 69.2% in 2015, respectively. Middle rice in Fujian Province showed more severe high-temperature hazards than early rice. The average heat-induced yield loss rates of both middle rice varieties in Datian County ranged from 40% to 70%. Datian County witnessed its highest heat-induced yield loss rate of 69.2% in 2017 and its lowest of 27.8% in 2012. Similarly, Youxi County experienced average heat-induced yield loss rates for middle rice ranging from 50.0% to 70.0%, with a peak of 72.8% in 2003 and a low of 47.1% in 2015.
The trend in meteorological yield changes over the years generally aligns with the results of the high-temperature heat damage model simulation. Years with higher simulated high-temperature damage rates correspond to lower meteorological yields, highlighting the greater susceptibility of middle rice in Fujian Province to high-temperature damage compared to early rice.
4. Discussion
The study revealed that high temperatures during the flowering and grain-filling stages of early rice and the flowering stage of middle rice primarily affected the reduction in seed setting rate and thousand-grain weight. Conversely, at the meiosis stage of middle rice, high temperatures significantly decreased the grain number per panicle, seed setting rate, and thousand-grain weight. This reduction in yield components is attributed to high-temperature stress accelerating leaf senescence, decreasing photosynthetic capacity, reducing the total amount of photosynthetically active products, and impeding the transport and accumulation of grains. Ultimately, this leads to a decline in the rate and quantity of dry matter accumulation in the grains, resulting in decreased yield [11,30,31]. Specifically, high temperatures during the meiosis stage substantially affect the grain number per panicle, seed setting rate, and thousand-grain weight, with a particularly severe effect on the seed setting rate due to decreased pollen fertility and glume degradation [32,33,34]. High temperatures at the flowering stage mainly reduced the seed setting rate due to induced floret sterility, hindering fertilization and decreasing yield [35,36,37]. Moreover, high-temperature treatment during the grain-filling stage induces high-temperature ripening of rice, affecting the timing and pace of grain filling in different parts of the same panicle, ultimately affecting the thousand-grain weight [38,39].
Quantifying the effect of high temperatures on yield components is crucial for constructing an accurate high-temperature heat damage model and enhancing simulation results. While existing rice growth models primarily focus on the effect of high temperature on yield, fewer studies delve into the quantitative effects of specific yield components, such as the grain number per panicle [10,11,12,13,14]. In this study, we meticulously analyzed the changes in grain number per panicle, thousand-grain weight, and seed setting rate under high-temperature stress during the meiosis, flowering, and grain-filling stages of rice. Subsequently, we developed a comprehensive model to simulate the loss components of rice yield under high-temperature conditions during four critical growth periods of both early and middle rice. This approach enables a quantitative assessment of high-temperature-induced heat damage losses in rice based on historical meteorological data from various rice planting sites in Fujian Province.
The model developed through controlled experiments aims to be universally applicable in simulating high-temperature heat damage, allowing for the assessment of heat damage across different regions and varieties through parameter adjustments. The experiments were conducted at the rice experimental base of Jiangsu Academy of Agricultural Sciences, primarily considering equipment capabilities and the field management expertise of the project team. Furthermore, the crop variety parameters essential for constructing the high-temperature heat damage model remain consistent, determined by the inherent genetic characteristics of each variety, and unaffected by the planting location. The model construction relied on establishing a quantitative relationship between high-temperature exposure and rice damage, with various high-temperature stress treatments conducted within artificial climate chambers. When validating the parameters of the rice growth stages determined in this study using regional experimental data from Fujian Province (2017–2020), the model demonstrated reliability and stability (Figure 3). Additionally, leveraging historical climate data from Fujian Province over the past 20 years, the model accurately simulated and evaluated high-temperature heat damage across four representative sampling sites. The simulation results aligned with the observed trend of meteorological yield changes over the years (Figure 5), further confirming the model’s universality and the credibility of its outcomes.
The IPCC AR6 report indicates that with global warming, extreme weather phenomena and meteorological disasters are occurring frequently [40]. Under the background of increasing meteorological disasters, the research on early warning monitoring and quantitative evaluation technology of meteorological disasters plays an important role in improving the level of agricultural production and promoting agricultural disaster insurance business. This study provides a reference method for gradually improving the quantitative analysis of the effect of high temperature on rice yield. Moreover, it is of great significance for the impact assessment of climate change and the productivity of alternative cropping systems to promote better and sustainable agriculture.
The influence of high temperature on different developmental stages within the same rice growth period varies. However, in constructing this high-temperature heat damage model, the weights of high-temperature influence at the beginning, flowering, and end of the growth period were not extensively accounted for. This oversight could potentially lead to simulation errors in the yield loss rate due to damage. Moreover, due to the plant’s respiration, the temperature of the glumes during the rice flowering stage can be slightly lower than the ambient air temperature, with a maximum difference of up to 3–4 °C. This temperature difference varies across different varieties [29], and the precise quantitative relationship between glume temperature and air temperature has not been established. Therefore, in this study, we used air temperature as a proxy for glume temperature, which might overestimate the simulated high-temperature damage loss rate compared to actual conditions. Furthermore, it is crucial to recognize that high-temperature damage to rice is influenced by multiple factors, not only temperature. Therefore, comprehensive studies on the effects of multifactorial stresses should complement research on high-temperature heat damage.
5. Conclusions
Exposure to high temperatures during various growth stages impacts rice differently. Specifically, high temperatures during the flowering and grain-filling stages of early rice and the meiosis and flowering stages of middle rice have distinct effects. Among these, the flowering stage of early rice is more adversely affected than the grain-filling stage, whereas the meiosis stage of middle rice is more impacted than the flowering stage. Overall, meiosis and flowering stages were the most sensitive to high temperatures, whereas high temperatures during the grain-filling stage had less impact on yield. For early rice, high temperatures during flowering and grain-filling stages mainly reduced the seed setting rate and thousand-grain weight. For middle rice, at the flowering and meiosis stage, there was a decline in the grain number per panicle, seed setting rate, and thousand-grain weight. High temperatures during the flowering and grain-filling stages of early rice did not significantly affect the number of panicles or the grain number per panicle.
Using the model developed in this study, we simulated heat damage losses in rice across four planting sites in Fujian Province over the past 20 years. The results align with meteorological yield trends, indicating that years with the highest and lowest heat damage rates correspond to the years with the lowest and highest meteorological yields, respectively. Furthermore, middle rice in Fujian Province experienced more severe high-temperature damage than early rice.
Author Contributions
H.Z., M.J., C.S. and X.C. planned the experiment. H.Z. conducted the study, and collected and analyzed the data. H.Z. and M.J. prepared the draft. X.C. and M.L. helped in sampling and taking measurements of physiological parameters. M.J. and C.S. assisted in drafting the manuscript and interpretation of the results. All authors have read and agreed to the published version of the manuscript.
Funding
This study was supported by the National Natural Science Foundation of China (31671574); the Social Development Guidance Project of Fujian Province (2020Y0018); and the Young and Middle-aged Teacher Education Research Project of Fujian Province (JAT220055).
Data Availability Statement
The data presented in this study are available from the corresponding author upon reasonable request.
Conflicts of Interest
The authors declare no conflicts of interest.
References
- Boonyaves, K.; Gruissem, W.; Bhullar, N.K. NOD promoter-controlled AtIRT1 expression functions synergistically with NAS and FERRITIN genes to increase iron in rice grains. Plant Mol. Biol. 2016, 90, 207–215. [Google Scholar] [CrossRef]
- Li, Y.; Tao, F. Rice yield response to climate variability diverges strongly among climate zones across China and is sensitive to trait variation. Field Crops Res. 2023, 301, 109034. [Google Scholar] [CrossRef]
- Xiong, J.; Ding, C.D.; Wei, G.B.; Ding, Y.F.; Wang, S.H. Characteristic of dry-matter accumulation and nitrogen-uptake of super-high-Yielding early rice in China. Agron. J. 2013, 105, 1142–1149. [Google Scholar] [CrossRef]
- Wang, Y.; Chen, J.; Sun, Y.; Jiao, Y.; Yang, Y.; Yuan, X.; Lærke, P.E.; Wu, Q.; Chi, D. Zeolite reduces N leaching and runoff loss while increasing rice yields under alternate wetting and drying irrigation regime. Agric. Water Manag. 2023, 277, 108130. [Google Scholar] [CrossRef]
- Fujian Bureau of Statistics. Fujian Statistical Yearbook of 2021; Fujian Bureau of Statistics: Fuzhou, China, 2021.
- Qiu, X.; Tang, L.; Zhu, Y.; Cao, W.; Liu, L. Quantification of Cultivar Change in Double Rice Regions under a Warming Climate during 1981–2009 in China. Agronomy 2019, 9, 794. [Google Scholar] [CrossRef]
- Zhang, T.; Cheng, C. Assessment of China’s high-temperature hazards: Accounting for spatial agglomeration. J. Geo-Inf. Sci. 2019, 21, 865–874. [Google Scholar] [CrossRef]
- Liang, Y.; Zhang, J.; Wang, J.; Xie, T. Interdecadal Variation of Summer Extreme Heat Events in the Beijing–Tianjin–Hebei Region. Atmosphere 2023, 14, 854. [Google Scholar] [CrossRef]
- Lu, S. Effects of high temperature on late growth and development of rice and preventive measures. Mod. Econ. Inf. 2009, 2, 145. [Google Scholar]
- Duan, H.; Tong, H.; Liu, Y.; Xu, Q.; Ma, J.; Wang, C. Research advances in the effect of heat and drought on rice and its mechanism. Chin. J. Rice Sci. 2019, 33, 206–218. [Google Scholar] [CrossRef]
- Yang, J.; Zhang, Y.; He, H.; Li, Y.; Chen, X.; Bian, J.; Jin, G.; Li, X.; Huang, S. Current status and research advances of high-temperature hazards in rice. Chin. J. Appl. Ecol. 2020, 31, 2817–2830. [Google Scholar] [CrossRef]
- Luo, Z.; Shi, C.; Jiang, M.; Liu, Y.; Xuan, S.; Jin, Z. Effect of high temperature on rice dry matter partition and yield component during booting stage. Chin. J. Agrometeorol. 2016, 37, 326–334. [Google Scholar] [CrossRef]
- Sun, Q.; Zhao, Y.; Zhang, Y.; Chen, S.; Ying, Q.; Lv, Z.; Chen, X.; Wang, D. Heat stress may cause a significant reduction of rice yield in China under future climate scenarios. Sci. Total Environ. 2022, 818, 151746. [Google Scholar] [CrossRef] [PubMed]
- Bouman, B.A.M.; Kropff, M.J.; Tuong, T.P.; Wopereis, M.C.S.; Berge, H.F.M.T.; Laar, H.H.V. ORYZA2000: Modeling Lowland Rice; International Rice Research Institute: Los Banos, Philippines, 2001; p. 235. [Google Scholar]
- Shi, C.; Jin, Z.; Tang, R.; Zheng, J. Model to Simulate high temperature-induced sterility of rice. Chin. J. Rice Sci. 2007, 2, 220–222. [Google Scholar] [CrossRef]
- Oort, P.; Saito, K.; Zwart, S.; Shrestha, S. A simple model for simulating heat induced sterility in rice as a function of flowering time and transpirational cooling. Field Crops Res. 2014, 156, 303–312. [Google Scholar] [CrossRef]
- Gao, L.; Jin, Z.; Huang, Y.; Chen, H.; Li, B. Computer Simulation and Optimization Decision System for Rice Cultivation; China Agricultural Science and Technology Press: Beijing, China, 1992. [Google Scholar]
- Tang, L.; Zhu, Y.; Hannaway, D.; Meng, Y.; Liu, L.; Chen, L.; Cao, W. RiceGrow: A rice growth and productivity model. NJAS Wagening. J. Life Sci. 2009, 57, 83–92. [Google Scholar] [CrossRef]
- Sudharsan, D.; Adinarayana, J.; Reddy, D.R.; Sreenivas, G.; Ninomiya, S.; Hirafuji, M.; Kiura, T.; Tanaka, K.; Desai, U.B.; Merchant, S.N. Evaluation of weather-based rice yield models in India. Int. J. Biometeorol. 2013, 57, 107–123. [Google Scholar] [CrossRef]
- Zhang, T.; Li, T.; Yang, X.; Simelton, E. Model biases in rice phenology under warmer climates. Sci. Rep. 2016, 6, 27355. [Google Scholar] [CrossRef]
- Horie, T. Global warming and rice production in Asia: Modeling, impact prediction and adaptation. Proc. Jpn. Acad. Ser. B Phys. Biol. Sci. 2019, 95, 211–245. [Google Scholar] [CrossRef] [PubMed]
- Nasir, I.R.; Rasul, F.; Ahmad, A.; Asghar, H.N.; Hoogenboom, G. Climate change impacts and adaptations for fine, coarse, and hybrid rice using CERES-Rice. Environ. Sci. Pollut. Res. Int. 2020, 27, 9454–9464. [Google Scholar] [CrossRef]
- Anser, M.K.; Hina, T.; Hameed, S.; Nasir, M.H.; Ahmad, I.; Naseer, M.A.u.R. Modeling Adaptation Strategies against Climate Change Impacts in Integrated Rice-Wheat Agricultural Production System of Pakistan. Int. J. Environ. Res. Public Health 2020, 17, 2522. [Google Scholar] [CrossRef]
- Casadebaig, P.; Debaeke, P.; Wallach, D. A new approach to crop model calibration: Phenotyping plus post-processing. Crop Sci. 2020, 60, 709–720. [Google Scholar] [CrossRef]
- Bouman, B.A.M.; van Laar, H.H. Description and evaluation of the rice growth model ORYZA2000 under nitrogen-limited conditions. Agric. Syst. 2006, 87, 249–273. [Google Scholar] [CrossRef]
- Lu, H.; Zhang, Y.; Feng, M.; Li, B.; Liu, A.; Mao, F.; Zhuang, L.; Li, Y.; Wu, M. Meteorological Grades of Hot Damage to Rice: GB/T37744―2019; State Administration for Market Regulation/State Standardization Administration: Beijing, China, 2019.
- Shi, P.; Tang, L.; Lin, C.; Liu, L.; Wang, H.; Cao, W.; Zhu, Y. Modeling the effects of post-anthesis heat stress on rice phenology. Field Crops Res. 2015, 177, 26–36. [Google Scholar] [CrossRef]
- Shi, C.; Jin, Z.; Zheng, J.; Tang, R. Quantitative analysis on the effects of high temperature at meiosis stage on seed-setting rate of rice florets. Acta Agron. Sin. 2008, 4, 627–631. [Google Scholar] [CrossRef]
- Tao, F.; Zhang, S.; Zhang, Z. Changes in rice disasters across China in recent decades and the meteorological and agronomic causes. Reg. Environ. Chang. 2013, 13, 743–759. [Google Scholar] [CrossRef]
- Arshad, M.S.; Farooq, M.; Asch, F.; Krishna, J.S.V.; Prasad, P.V.V.; Siddique, K.H.M. Thermal stress impacts reproductive development and grain yield in rice. Plant Physiol. Biochem. 2017, 115, 57–72. [Google Scholar] [CrossRef] [PubMed]
- Chen, S.; Wu, K.; Chen, M.; Chen, M.; Zhang, Y. High temperature damage at grain filling stage of early rice in Hainan: Effects on 1000-grain weight. Chin. Agric. Sci. Bull. 2018, 34, 8–11. [Google Scholar] [CrossRef]
- Hu, Q.; Wang, W.; Lu, Q.; Huang, J.; Peng, S.; Cui, K. Abnormal anther development leads to lower spikelet fertility in rice (Oryza sativa L.) under high temperature during the panicle initiation stage. BMC Plant Biol. 2021, 21, 428. [Google Scholar] [CrossRef]
- Cao, Y.; Duan, Y.; Yang, L.; Wang, Z.; Zhou, S.; Yang, J. Effect of heat-stress during meiosis on grain yield of rice cultivars differing in heat-tolerance and its physiological mechanism. Acta Agron. Sin. 2008, 34, 2134–2142. [Google Scholar] [CrossRef]
- Shi, C.; Jin, Z.; Tang, R.; Zheng, J. Response difference of seed setting rate of rice florets at the meiosis and anthesis stages to high temperature. Jiangsu J. Agric. Sci. 2010, 26, 1139–1142. [Google Scholar]
- Mahmood, A.; Wang, W.; Ali, I.; Zhen, F.; Osman, R.; Liu, B.; Liu, L.; Zhu, Y.; Cao, W.; Tang, L. Individual and Combined Effects of Booting and Flowering High-Temperature Stress on Rice Biomass Accumulation. Plants 2021, 10, 1021. [Google Scholar] [CrossRef] [PubMed]
- Chen, J.; Yan, H.; Liu, K.; Mu, Q.; Zhu, K.; Zhang, Y.; Tian, X. Seed-set of large-panicle rice cultivars suffered from high temperature at anthesis. Chin. J. Agrometeorol. 2018, 39, 84–91. [Google Scholar] [CrossRef]
- Song, Y.; Wu, C. Physiological mechanism of high temperature affecting fertility of rice spikelets: A review. Jiangsu Agric. Sci. 2020, 48, 41–48. [Google Scholar] [CrossRef]
- Shi, P.; Zhu, Y.; Tang, L.; Chen, J.; Sun, T.; Cao, W.; Tian, Y. Differential effects of temperature and duration of heat stress during anthesis and grain filling stages in rice. Environ. Exp. Bot. 2016, 132, 28–41. [Google Scholar] [CrossRef]
- Park, J.; Kim, E.; Jang, Y.; Kim, K. Screening and identification of genes affecting grain quality and spikelet fertility during high-temperature treatment in grain filling stage of rice. BMC Plant Biol. 2021, 21, 263. [Google Scholar] [CrossRef]
- Zhou, T.; Chen, Z.; Chen, X.; Zuo, M.; Jiang, J.; Hu, S. Interpreting IPCC AR6: Future global climate based on projection under scenarios and on near-term information. Clim. Chang. Res. 2021, 17, 652–663. [Google Scholar] [CrossRef]
Figure 1.
Fluctuations in daily maximum and average temperatures in the natural environment during the high-temperature treatment period.
Figure 1.
Fluctuations in daily maximum and average temperatures in the natural environment during the high-temperature treatment period.

Figure 2.
Changes in yield components of early rice and middle rice at the different stages with ADHT.
Figure 2.
Changes in yield components of early rice and middle rice at the different stages with ADHT.

Figure 3.
Comparison between simulated and observed values of rice growth period.

Figure 4.
Trends of rice yield at four representative sites from 2001 to 2020.

Figure 5.
High-temperature yield loss rate and meteorological yield in four representative sites from 2001 to 2020.
Figure 5.
High-temperature yield loss rate and meteorological yield in four representative sites from 2001 to 2020.


Table 1.
Dates of high-temperature treatment for each growth period.
| Growth Stages | Days | High-Temperature Treatment Dates | |||
|---|---|---|---|---|---|
| Rongshengyou1131 | T78you2155 | Heliangyou676 | IIYou3301 | ||
| Meiosis | 3 | - | - | 12–14 August | 12–14 August |
| 7 | - | - | 12–18 August | 12–18 August | |
| Flowering | 3 | 13–15 July | 15–17 July | 21–23 August | 24–26 August |
| 7 | 13–19 July | 15–21 July | 21–27 August | 24–30 August | |
| Grain filling | 3 | 23–25 July | 25–27 July | - | - |
| 7 | 23–29 July | 25–31 July | - | - | |
Table 2.
Effects of high temperature on early rice grain yield and its components at the flowering stage.
Table 2.
Effects of high temperature on early rice grain yield and its components at the flowering stage.
| Variety | Treatment | Yield per Plant (g) | Panicle Number per Plant | Grain Number per Panicle | Seed Setting Rate (%) | Thousand-Grain Weight (g) |
|---|---|---|---|---|---|---|
| Rongshengyou1131 | CK | 39.0 ± 3.1 a | 11.7 ± 0.6 a | 128.7 ± 4.2 a | 88.9 ± 1.8 a | 29.3 ± 0.9 a |
| T1D1 | 36.3 ± 1.4 a | 11.7 ± 0.6 a | 129.3 ± 8.1 a | 82.8 ± 3.0 b | 29.2 ± 0.3 a | |
| T2D1 | 21.8 ± 2.4 c | 12.3 ± 0.6 a | 130.0 ± 5.0 a | 47.2 ± 1.8 d | 28.7 ± 0.1 a | |
| T1D2 | 30.5 ± 2.8 b | 12.0 ± 1.0 a | 147.0 ± 8.5 a | 59.5 ± 4.1 c | 29.1 ± 0.7 a | |
| T2D2 | 16.9 ± 2.1 d | 13.0 ± 1.0 a | 152.3 ± 25.0 a | 31.6 ± 4.2 e | 27.0 ± 0.8 b | |
| T78you2155 | CK | 43.5 ± 0.4 a | 12.0 ± 1.0 a | 154.0 ± 13.5 a | 92.4 ± 1.2 a | 25.6 ± 0.2 a |
| T1D1 | 39.9 ± 1.5 b | 11.7 ± 1.2 a | 152.7 ± 13.7 a | 88.3 ± 4.2 a | 25.5 ± 0.1 a | |
| T2D1 | 25.5 ± 0.9 d | 12.0 ± 2.0 a | 160.3 ± 20.5 a | 55.0 ± 1.5 c | 25.1 ± 0.1 a | |
| T1D2 | 33.3 ± 0.6 c | 11.3 ± 1.5 a | 157.3 ± 12.2 a | 74.0 ± 4.6 b | 25.4 ± 0.1 a | |
| T2D2 | 17.1 ± 1.4 e | 12.3 ± 0.6 a | 156.7 ± 5.5 a | 38.2 ± 1.5 d | 23.1 ± 0.7 b |
Note: Values in the table represent Mean ± SD (n = 15). Different lowercase letters indicate significant differences among the five treatments in the same column at p < 0.05 (Duncan test).
Table 3.
Fitting coefficients and R2 values of relative seed setting rate (RSSR) and relative thousand-grain weight (RTGW) of early rice as a function of ADHT.
Table 3.
Fitting coefficients and R2 values of relative seed setting rate (RSSR) and relative thousand-grain weight (RTGW) of early rice as a function of ADHT.
| Variety | Yield Component | Coefficients and R2 | Growth Period | |
|---|---|---|---|---|
| Flowering | Grain Filling | |||
| Rongshengyou1131 | RSSR | A1 | 0.30919 | 0.88449 |
| x0 | 124.15253 | 141.46246 | ||
| p | 3.12029 | 80.68767 | ||
| R2 | 0.98793 | 0.9753 | ||
| RTGW | A1 | 0.92308 | 0.90966 | |
| x0 | 157.45788 | 119.08235 | ||
| p | 23.75546 | 3.00738 | ||
| R2 | 0.99117 | 0.96287 | ||
| T78you2155 | RSSR | A1 | 0.1723 | 143.55309 |
| x0 | 231.63321 | 32.65081 | ||
| p | 2.15866 | 0.98381 | ||
| R2 | 0.99788 | 0.98953 | ||
| RTGW | A1 | 0.90309 | 0.73854 | |
| x0 | 160.39405 | 532.20803 | ||
| p | 20.17034 | 1.55812 | ||
| R2 | 0.93831 | 0.98397 | ||
Table 4.
Effects of high temperature on early rice grain yield and its components during the grain-filling stage.
Table 4.
Effects of high temperature on early rice grain yield and its components during the grain-filling stage.
| Variety | Treatment | Yield per Plant (g) | Panicle Number per Plant | Grain Number per Panicle | Seed Setting Rate (%) | Thousand-Grain Weight (g) |
|---|---|---|---|---|---|---|
| Rongshengyou1131 | CK | 39.0 ± 3.1 a | 11.7 ± 0.6 a | 128.7 ± 4.2 a | 88.9 ± 1.8 a | 29.3 ± 0.9 a |
| T1D1 | 38.2 ± 0.8 a | 12.0 ± 2.0 a | 127.7 ± 18.0 a | 87.6 ± 3.1 ab | 28.9 ± 0.1 ab | |
| T2D1 | 34.8 ± 0.6 b | 13.0 ± 1.0 a | 125.3 ± 17.0 a | 78.7 ± 3.5 b | 27.3 ± 0.2 c | |
| T1D2 | 37.7 ± 0.9 a | 11.7 ± 1.5 a | 134.0 ± 16.1 a | 85.8 ± 0.6 ab | 28.4 ± 0.4 b | |
| T2D2 | 33.7 ± 1.0 b | 12.0 ± 1.0 a | 135.0 ± 19.1 a | 78.6 ± 7.8 b | 26.7 ± 0.2 c | |
| T78you2155 | CK | 43.5 ± 0.4 a | 12.0 ± 1.0 a | 154.0 ± 13.5 a | 92.4 ± 1.2 a | 25.6 ± 0.2 a |
| T1D1 | 41.0 ± 1.9 b | 12.0 ± 0.0 a | 146.3 ± 3.1 a | 92.0 ± 2.4 a | 25.4 ± 0.2 a | |
| T2D1 | 37.4 ± 0.9 cd | 12.3 ± 1.5 a | 141.7 ± 11.8 a | 89.6 ± 1.7 a | 24.1 ± 0.6 b | |
| T1D2 | 38.6 ± 0.9 c | 11.7 ± 1.2 a | 144.7 ± 9.0 a | 91.4 ± 1.6 a | 25.1 ± 0.4 a | |
| T2D2 | 35.7 ± 0.8 d | 12.0 ± 0.9 a | 144.7 ± 9.0 a | 89.0 ± 9.2 a | 23.3 ± 0.1 c |
Note: Values in the table represent Mean ± SD (n = 15). Different lowercase letters indicate significant differences among the five treatments in the same column at p < 0.05 (Duncan test).
Table 5.
Effects of high temperature on grain yield and its components of middle rice at meiosis stage.
Table 5.
Effects of high temperature on grain yield and its components of middle rice at meiosis stage.
| Variety | Treatment | Yield per Plant (g) | Panicle Number per Plant | Grain Number per Panicle | Seed Setting Rate (%) | Thousand-Grain Weight (g) |
|---|---|---|---|---|---|---|
| IIYou3301 | CK | 39.6 ± 0.8 a | 10.3 ± 0.6 a | 178.0 ± 4.4 a | 79.4 ± 3.6 a | 27.4 ± 0.7 a |
| T1D1 | 37.3 ± 1.0 b | 10.3 ± 0.6 a | 172.7 ± 4.5 a | 77.4 ± 2.9 a | 27.1 ± 0.7 ab | |
| T2D1 | 26.4 ± 0.8 d | 10.3 ± 1.2 a | 153.3 ± 11.4 b | 64.9 ± 4.1 b | 25.9 ± 1.0 ab | |
| T1D2 | 30.0 ± 1.6 c | 10.0 ± 1.0 a | 168.3 ± 7.6 a | 67.7 ± 3.2 b | 26.4 ± 1.4 ab | |
| T2D2 | 23.3 ± 1.0 e | 10.7 ± 0.6 a | 152.0 ± 7.9 b | 58.1 ± 3.6 c | 24.9 ± 1.4 b | |
| Heliangyou676 | CK | 41.9 ± 2.5 a | 10.3 ± 0.6 a | 178.7 ± 3.8 a | 80.9 ± 2.4 a | 28.1 ± 0.5 a |
| T1D1 | 38.5 ± 2.4 a | 10.7 ± 0.6 a | 174.0 ± 5.3 ab | 74.3 ± 2.6 b | 27.9 ± 0.5 ab | |
| T2D1 | 28.0 ± 1.9 c | 11.3 ± 0.6 a | 149.4 ± 5.5 c | 62.9 ± 1.8 c | 26.2 ± 0.9 cd | |
| T1D2 | 32.2 ± 1.4 b | 11.0 ± 0.0 a | 166.0 ± 10.0 b | 65.6 ± 1.2 c | 26.9 ± 0.5 bc | |
| T2D2 | 23.6 ± 1.4 d | 11.3 ± 0.6 a | 144.7 ± 3.2 c | 56.0 ± 5.6 d | 25.3 ± 0.6 d |
Note: Values in the table represent Mean ± SD (n = 15). Different lowercase letters indicate significant differences among the five treatments in the same column at p < 0.05 (Duncan test).
Table 6.
Fitting coefficients and R2 values for relative grain number per panicle (RGNP), relative seed setting rate (RSSR), and relative thousand-grain weight (RTGW) of middle rice in relation to ADHT.
Table 6.
Fitting coefficients and R2 values for relative grain number per panicle (RGNP), relative seed setting rate (RSSR), and relative thousand-grain weight (RTGW) of middle rice in relation to ADHT.
| Variety | Yield Component | Coefficients and R2 | Growth Period | |
|---|---|---|---|---|
| Meiosis Stage | Flowering | |||
| IIYou3301 | RGNP | A1 | 0.79163 | - |
| x0 | 190.10958 | - | ||
| p | 1.6427 | - | ||
| R2 | 0.91188 | - | ||
| RSSR | A1 | 0.71758 | 0.63319 | |
| x0 | 131.3975 | 86.16917 | ||
| p | 3.06856 | 2.03004 | ||
| R2 | 0.99626 | 0.99749 | ||
| RTGW | A1 | 0.89671 | 0.9426 | |
| x0 | 159.3183 | 147.44326 | ||
| p | 2.27027 | 24.82237 | ||
| R2 | 0.98153 | 0.99288 | ||
| Heliangyou676 | RGNP | A1 | 0.82309 | - |
| x0 | 101.51502 | - | ||
| p | 3.3079 | - | ||
| R2 | 0.96649 | - | ||
| RSSR | A1 | 0.61784 | 0.49348 | |
| x0 | 135.96037 | 174.41357 | ||
| p | 1.64385 | 1.44128 | ||
| R2 | 0.98955 | 0.98703 | ||
| RTGW | A1 | 0.89625 | 0.94831 | |
| x0 | 148.22261 | 147.52944 | ||
| p | 3.45369 | 44.2462 | ||
| R2 | 0.98773 | 1 | ||
Table 7.
Effects of high temperature on middle rice grain yield and its components during the flowering stage.
Table 7.
Effects of high temperature on middle rice grain yield and its components during the flowering stage.
| Variety | Treatment | Yield per Plant (g) | Panicle Number per Plant | Grain Number per Panicle | Seed Setting Rate (%) | Thousand-Grain Weight (g) |
|---|---|---|---|---|---|---|
| IIYou3301 | CK | 39.9 ± 0.8 a | 10.3 ± 0.6 a | 178.0 ± 4.4 a | 79.4 ± 3.6 a | 27.4 ± 0.7 a |
| T1D1 | 33.8 ± 4.0 b | 10.7 ± 1.2 a | 168.0 ± 19.1 a | 69.7 ± 5.1 b | 27.2 ± 0.4 a | |
| T2D1 | 27.3 ± 0.6 c | 10.0 ± 0.0 a | 181.3 ± 2.5 a | 57.0 ± 1.3 c | 26.4 ± 0.2 ab | |
| T1D2 | 26.6 ± 1.3 c | 9.7 ± 0.6 a | 174.3 ± 3.2 a | 58.5 ± 1.1 c | 27.0 ± 0.5 a | |
| T2D2 | 26.5 ± 1.5 c | 10.7 ± 0.6 a | 185.7 ± 5.5 a | 52.0 ± 2.7 c | 25.8 ± 0.1 b | |
| Heliangyou676 | CK | 41.9 ± 2.5 a | 10.3 ± 0.6 a | 178.7 ± 3.8 a | 80.9 ± 2.4 a | 28.1 ± 0.5 a |
| T1D1 | 35.5 ± 0.4 b | 10.7 ± 0.6 a | 162.7 ± 15.7 a | 73.4 ± 4.8 b | 28.1 ± 0.1 a | |
| T2D1 | 27.4 ± 1.3 d | 10.7 ± 1.5 a | 174.3 ± 10.8 a | 55.4 ± 6.4 d | 27.1 ± 0.9 ab | |
| T1D2 | 30.2 ± 0.6 c | 10.3 ± 2.1 a | 166.3 ± 24.3 a | 63.9 ± 1.3 c | 27.9 ± 0.5 ab | |
| T2D2 | 24.2 ± 0.7 e | 11.0 ± 1.7 a | 164.7 ± 15.5 a | 51.0 ± 3.3 d | 26.6 ± 1.2 b |
Note: Values in the table represent Mean ± SD (n = 15). Different lowercase letters indicate significant differences among the five treatments in the same column at p < 0.05 (Duncan test).
Table 8.
High temperature heat loss rate of early rice and middle rice at different growth periods.
| Variety | Growth Period | Loss Rate |
|---|---|---|
| Early rice | Flowering stage | {1 − {0.240745 + 0.759255/[1 + (x/177.8929)2.639475]} × {0.913085 + 0.086915/[1 + (x/158.926)21.9629]}} × 100% |
| Grain-filling stage | {1 − {0.92368 + 0.07632/[1 + (x/142.5078)56.66924]} × {0.8241 + 0.1759/[1 + (x/325.6452)2.28275]}} × 100% | |
| Middle rice | Meiosis stage | {1 − {0.80736 + 0.19264/[1 + (x/145.8123)2.4753]} × {0.66771 + 0.33229/[1 + (x/133.6789)2.356205]} × {0.89648 + 0.10352/[1 + (x/153.7705)2.86198]}} × 100% |
| Flowering stage | {1 − {0.563335 + 0.436665/[1 + (x/130.2914)1.73566]} × {0.945455 + 0.054545/[1 + (x/147.4864)34.53429]}} × 100% |
Note: x represents the ADHT (accumulated degree-hours of high temperature) of each key growth period.
Table 9.
Parameters of four rice varieties during developmental stages in Fujian Province.
| Parameters | Varieties | |||
|---|---|---|---|---|
| Rongshengyou1131 | T78you2155 | IIYou3301 | Heliangyou676 | |
| P1 | 92.04 | 92.04 | 81.98 | 81.98 |
| P2 | 1392.35 | 1392.35 | 1387.47 | 1387.47 |
| P3 | 904.12 | 925.56 | 1208.82 | 1184.76 |
| P4 | 709.08 | 732.45 | 976.79 | 948.42 |
Disclaimer/Publisher’s Note: The statements, opinions and data contained in all publications are solely those of the individual author(s) and contributor(s) and not of MDPI and/or the editor(s). MDPI and/or the editor(s) disclaim responsibility for any injury to people or property resulting from any ideas, methods, instructions or products referred to in the content. |
© 2024 by the authors. Licensee MDPI, Basel, Switzerland. This article is an open access article distributed under the terms and conditions of the Creative Commons Attribution (CC BY) license (https://creativecommons.org/licenses/by/4.0/).
Share and Cite
MDPI and ACS Style
Zhou, H.; Chen, X.; Li, M.; Shi, C.; Jiang, M. Simulation Model for Assessing High-Temperature Stress on Rice. Agronomy 2024, 14, 900. https://0-doi-org.brum.beds.ac.uk/10.3390/agronomy14050900
AMA Style
Zhou H, Chen X, Li M, Shi C, Jiang M. Simulation Model for Assessing High-Temperature Stress on Rice. Agronomy. 2024; 14(5):900. https://0-doi-org.brum.beds.ac.uk/10.3390/agronomy14050900
Chicago/Turabian StyleZhou, Haoyang, Xianguan Chen, Minglu Li, Chunlin Shi, and Min Jiang. 2024. "Simulation Model for Assessing High-Temperature Stress on Rice" Agronomy 14, no. 5: 900. https://0-doi-org.brum.beds.ac.uk/10.3390/agronomy14050900
Note that from the first issue of 2016, this journal uses article numbers instead of page numbers. See further details here.