Article

A Bio-Inspired Visual Perception Transformer for Cross-Domain Semantic Segmentation of High-Resolution Remote Sensing Images

1
College of Automation Engineering, Nanjing University of Aeronautics and Astronautics, Nanjing 210016, China
2
College of Electronic Information and Engineering, Nanjing University of Aeronautics and Astronautics, Nanjing 210016, China
3
China Greatwall Technology Group Co., Ltd., Shenzhen 518052, China
*
Author to whom correspondence should be addressed.
Submission received: 10 February 2024 / Revised: 12 April 2024 / Accepted: 23 April 2024 / Published: 25 April 2024
(This article belongs to the Special Issue Deep Learning and Computer Vision in Remote Sensing-III)

Abstract

:
Pixel-level classification of very-high-resolution images is a crucial yet challenging task in remote sensing. While transformers have demonstrated effectiveness in capturing dependencies, their tendency to partition images into patches may restrict their applicability to highly detailed remote sensing images. To extract latent contextual semantic information from high-resolution remote sensing images, we proposed a gaze–saccade transformer (GSV-Trans) with visual perceptual attention. GSV-Trans incorporates a visual perceptual attention (VPA) mechanism that dynamically allocates computational resources based on the semantic complexity of the image. The VPA mechanism includes both gaze attention and eye movement attention, enabling the model to focus on the most critical parts of the image and acquire competitive semantic information. Additionally, to capture contextual semantic information across different levels in the image, we designed an inter-layer short-term visual memory module with bidirectional affinity propagation to guide attention allocation. Furthermore, we introduced a dual-branch pseudo-label module (DBPL) that imposes pixel-level and category-level semantic constraints on both gaze and saccade branches. DBPL encourages the model to extract domain-invariant features and align semantic information across different domains in the feature space. Extensive experiments on multiple pixel-level classification benchmarks confirm the effectiveness and superiority of our method over the state of the art.

Graphical Abstract

1. Introduction

With the rapid development of earth observation technology, remote sensing images are becoming more easily accessible, greatly enriching remote sensing data resources. At present, remote sensing technology is widely used in fields such as environmental protection, urban construction, disaster forecasting, and disaster assessment. Driven by advances in artificial intelligence, semantic information and spatial information in remote sensing images can be captured through machine learning, which could reduce the reliance of traditional remote sensing information processing methods on prior knowledge. In recent years, machine learning models based on convolutional neural networks (CNNs) have been widely used in the field of semantic segmentation [1,2].
However, CNNs have limitations in their receptive field, as they can only capture local information. Attempting to obtain global semantic information through stacked convolutional layers and downsampling operations may result in the loss of detailed features. As illustrated in Figure 1, remote sensing images encompass a significant amount of both local information and global context information. To reduce the loss of global contextual features in the feature extraction process, many scholars have conducted in-depth research on the optimization of neural network architecture [3,4]. As a traditional neural network architecture, a deep semantic segmentation network lacks interpretability and reliability. Li proposed a collaborative boosting framework that combines data-driven deep learning modules and knowledge-guided ontology reasoning modules to optimize segmentation performance through the inference channel [5]. However, there are still problems when it comes to directly inputting remote sensing images into a Fully Convolutional Network (FCN) because the segmentation results of FCN are not sufficiently refined and lack guidance on prior knowledge. A multi-layer feature structure with a scale-sensing strategy helps us to distinguish between objects of different sizes for semantic segmentation [6].
In recent years, we have observed that transformers based on the self-attention mechanism have stronger global modeling capabilities than convolutional neural networks [7]. Considering the importance of context modeling for segmentation performance, Zheng replaced the stacked convolutional layer-based encoder with gradually decreasing spatial resolution with a pure transformer and designed a lightweight and efficient semantic segmentation model [8]. In existing transformer-based models, tokens are usually size-invariant, making them unsuitable for visual segmentation tasks. However, the transformer with a shifted-window attention model (SWIN Transformer) can better adapt to semantic segmentation tasks with different scales. To reduce the loss of spatial information in the transformer, a stage model with an adaptive fusion module is designed to extract coarse-grained and fine-grained features at various semantic scales [9]. By embedding the SWIN Transformer into the classic CNN-based Unet and establishing pixel-level correlation through the spatial interaction module to enhance the feature representation capability of blocked objects, the segmentation accuracy can be effectively improved [10]. However, since the data distribution of remote sensing images from different imaging sensors and geographical locations is often different, current general deep learning algorithms are not suitable for semantic segmentation of high-resolution remote sensing images. Semantic segmentation of high-resolution remote sensing images needs to work reliably and accurately across different sensors and other urban scenarios. However, after traditional deep learning algorithms have been successfully trained on their source domains, their generalization capabilities will eventually degrade when applied to new target domains with differences in data distribution. In response to changes in geographical location and imaging mode, setting up a dynamic optimization strategy with multiple weak supervision constraints can effectively reduce the adverse effects of data shift [11].
High-resolution remote sensing images contain rich contextual semantic information, and it is difficult for transformers to effectively extract contextual long-distance information in such complex images. Xiao enhances the transformer’s multi-scale representation by utilizing local features and global representations at different resolutions to achieve efficient context modeling [12]. Wei proposed a pyramid transformer encoder with a foreground-aware module that can supplement long-range dependency information to achieve accurate semantic segmentation [13]. Song constructed a multi-layer densely connected transformer with a dual-backbone attention fusion module, which can more effectively couple local–global context information [14]. Compared with remote sensing images with low spatial resolution, remote sensing images with high spatial resolution have richer surface information and texture features. General semantic segmentation algorithms struggle to deal with complex high-resolution remote sensing images.
In this article, we propose a novel transformer model with dynamic visual perception. We compare our method with several state-of-the-art methods on two publicly available datasets to ensure the effectiveness of the proposed method. Additionally, we conduct cross-domain semantic segmentation experiments and ablation analysis to further ensure the usability of our proposed method.
Our contributions are as follows:
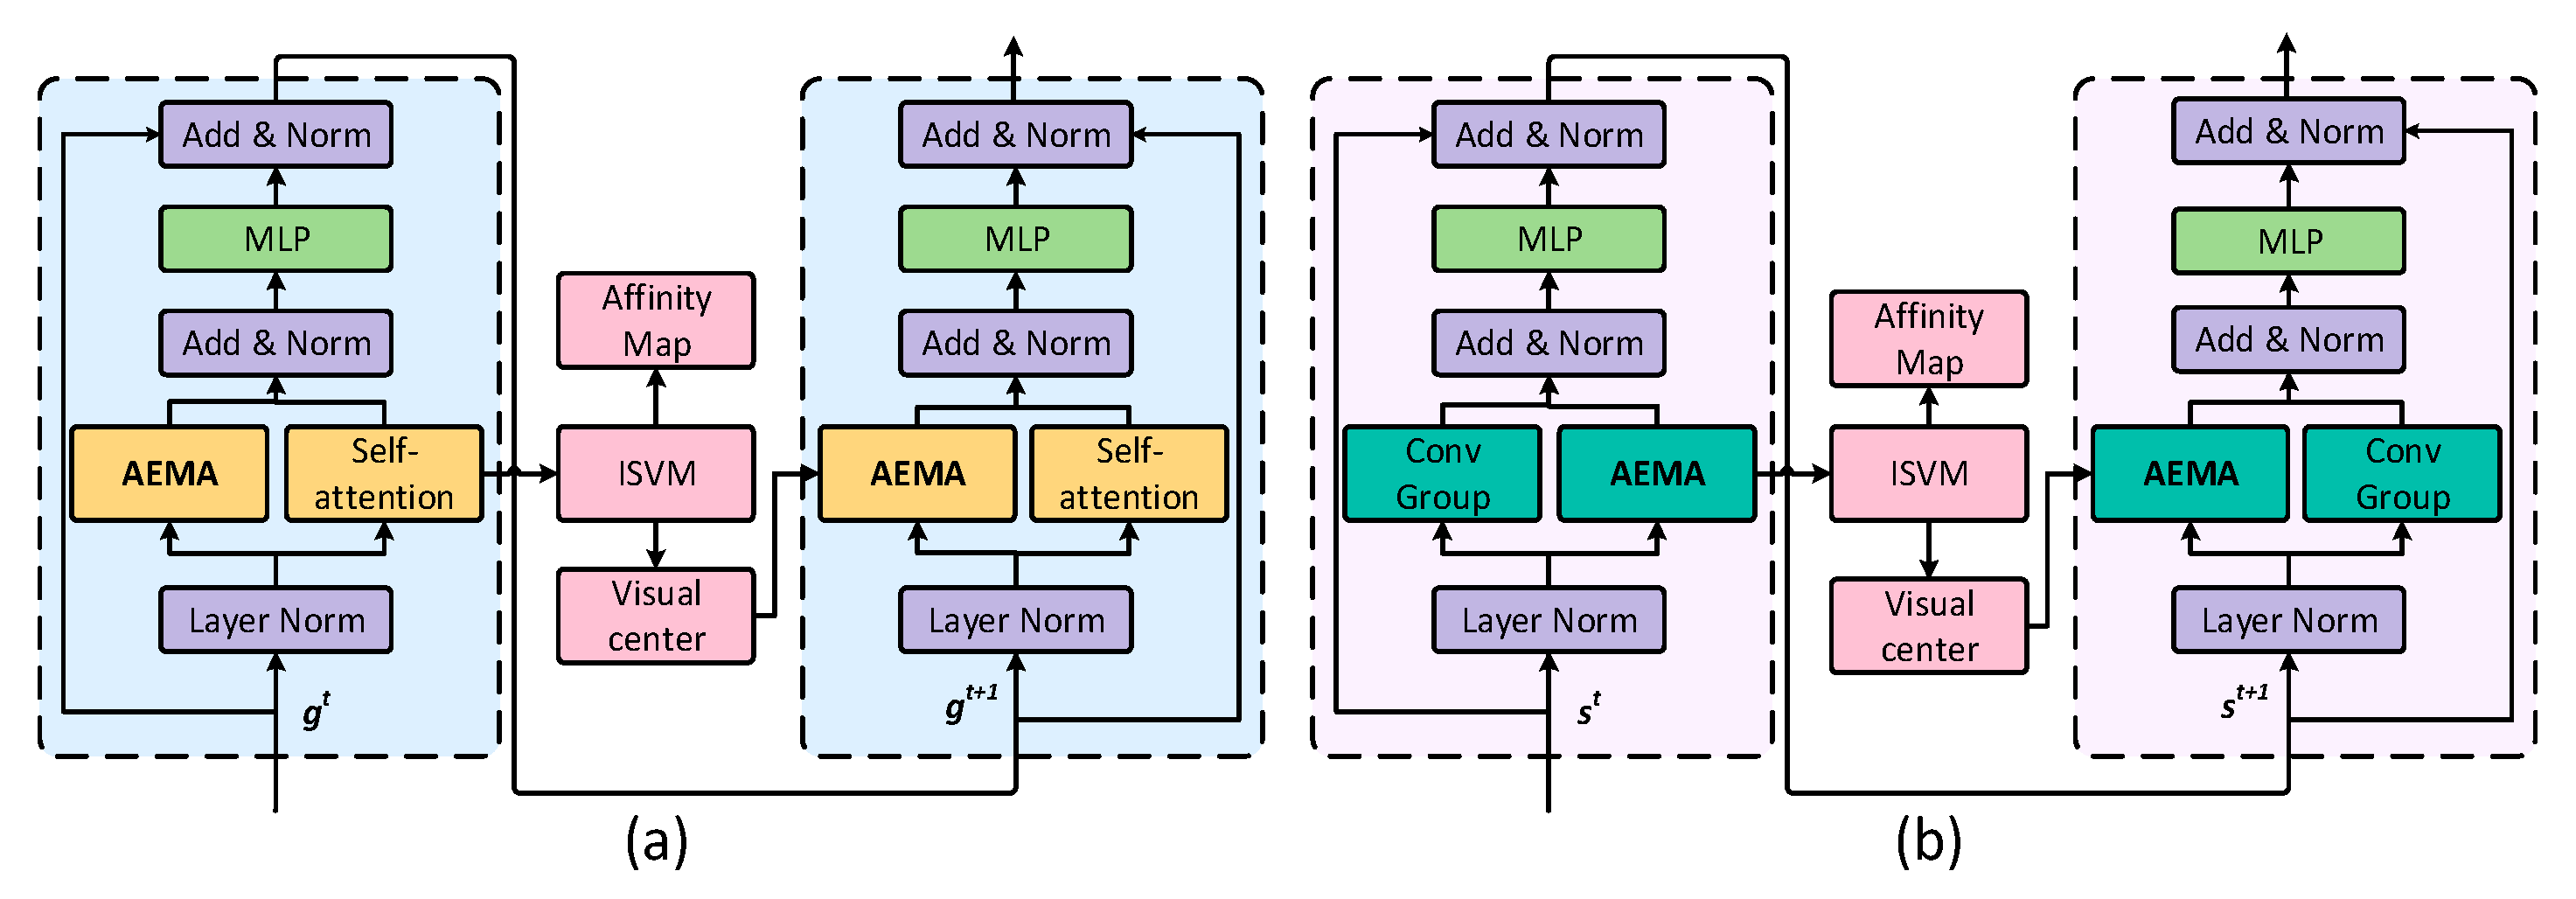
  • We propose a gaze–saccade transformer with an eye movement attention strategy (GSV-Trans), which simulates the eye movement model by adding adaptive eye movement attention (AEMA) to the gaze and saccade models for semantic segmentation on high-resolution remote sensing images.
  • We design an inter-layer short-term visual memory module (ISVM) capable of generating bidirectional inter-layer affinity for both top-down and bottom-up propagation. The ISVM module guides the visual perception window in calculating visual attention by simulating the spatiotemporal memory observed in human dynamic vision.
  • We design a dual-branch pseudo-labeling strategy (DBPL) with pixel-level and category-level affinity constraints to enhance the model’s capability to extract domain-invariant features.
Our paper is organized as follows: Section 2 discusses relevant research conducted in recent years. Section 3 details the overall structure of our proposed method. Section 4 presents and discusses the experimental results. Section 5 analyzes the conclusion and outlines future research directions.

2. Related Work

2.1. Cross-Domain Semantic Segmentation Algorithm for Remote Sensing Images

In this section, we review recent deep learning-based cross-domain semantic segmentation methods for remote sensing images. The diverse acquisition methods, regions, and times of the satellite images result in variations in data distribution and style characteristics across different datasets. These variations pose challenges for cross-domain semantic segmentation tasks in remote sensing images.
Some studies have found that adversarial learning can effectively mitigate inter-domain differences in the feature extraction process. Bai proposed an ensemble model that combines contrastive learning and adversarial learning to align the two domains in terms of the representation space and spatial layout. The experiments showed that the two branches can benefit one another, achieving excellent cross-domain semantic segmentation performances for remote sensing images [15]. In research that involved aligning the category levels of different domains, Huan used an integer-programming mechanism to model the category-level relationship between the source domain and the target domain, which can effectively improve the alignment of category features between different domains [16]. Some scholars have focused on extracting deep semantic features of high-resolution remote sensing images by capturing long-range contextual information. Mo proposed a transformer framework with a spatial pyramid pool shuffling module that can extract key details and information from limited visible pixels of occluded objects by learning long-range dependencies [17]. Peng used multi-scale context patches to guide local image patches to focus on different fine-grained objects to extract contextual features on a large scale [18].
In recent years, transformers have demonstrated excellent performance in the field of image semantic segmentation [19]. Compared with convolutional networks, the attention features extracted by transformers contain more contextual information and will not lose the detailed features of the samples during the downsampling process. Li proposed an adaptive contextual transformer model with an adjustable sliding window and designed a point-line-area pseudo-label filtering mechanism based on clustering and boundary extraction to filter unreliable pseudo-labels [20]. Ma proposed a new general image fusion framework based on cross-domain distance learning and SWIN Transformer, which achieves full integration of complementary information and global interaction through attention-guided cross-domain modules [21]. However, despite the transformer’s superior feature extraction capabilities compared to convolutional neural networks, further improvement and optimization are needed in the field of cross-domain semantic segmentation of complex high-resolution remote sensing images.

2.2. Deep Learning Models Based on Eye Vision

In this section, we review computational models based on eye vision and explore network architectures that simulate human vision. To aid comprehension and differentiation, we refer to the center of the visual field as the fovea and the surrounding areas as the periphery in this paper. The fovea receives a smaller visual range with a higher resolution, whereas the peripheral vision receives a blurred larger visual range with a lower resolution [22]. The process of fixating the visual image of a target stimulus at the fovea when observing a stationary object is called fixation. Saccade, an eye movement that aligns the fovea with a visual target of interest, is a bottom-up eye movement guided by vision rather than volition [23]. Jonnalagadda used the difference in the information received by the fovea and peripheral vision to build an image classification model for the fovea transformer, which can dynamically allocate resources to more complex images [24]. Shi proposed a bi-fovea self-attention inspired by the physiological structure and characteristics of eagle eye bi-fovea vision with a unified and efficient series of general pyramid backbone networks [25]. Aiming at the problem of depth degradation in transformers, Dai proposed a converged attention backbone that simulates biological foveal vision and continuous eye movements [26].
With the advancement of deep learning and medicine, numerous scholars are investigating the similarities and connections between neural networks and the structure of the eye. However, current computational models based on eye structure predominantly focus on the gaze model, overlooking the significance of saccades and micro-eye movements in vision. During the fixation process, the eyeballs do not remain completely still, but make small eye movements centered on the fixation point to offset the adaptive fading of the target stimulus [27]. Inspired by the human eye model, we proposed a gaze–saccade transformer with an eye movement attention strategy, which used an affinity network as an inter-layer short-term visual memory module to correct the eye movement attention model.

3. Methodology

In this section, we elaborate on the overall architecture of the proposed GSV-Trans with a gaze–saccade structure and introduce each component of the GSV-Trans in detail.
In this work, we deal with a labeled source domain dataset  S  and an unlabeled target domain dataset  T  that have the same target category but different shooting times, locations, and styles. We denote  x s R W × H × C  and  x t R W × H × C  as images sampled from the labeled source domain  S  and the unlabeled target domain  T . A part of the samples  x t 1  in the target domain participates in model training and the remaining samples  x t 2  serve as the test set. More precisely, each input to the model training process is two sets of image pairs  { x s 1 , x s 2 }  and  { x s 1 , x t 1 } .
Figure 2 shows the overall workflow of our proposed GSV-Trans. We design a transformer structure with gaze–saccade parallel branches as the generator in the adversarial generative network, which can produce domain-similar features. We use the discriminator designed by Yan [28] to determine whether the domain-similar features obtained by our proposed GSV-Trans come from the same data domain, to force the GSV-Trans to generate domain-similar features that can deceive the discriminator.
To extract long-distance contextual information from images, we designed two visual perception modes: gaze attention and eye movement attention. Before calculating attention, a simple complexity calculation module evaluates the complexity of the input image. When the input image is complex, the bottom-up attention generated by eye movement attention guides the attention module to allocate more computing power to areas with richer semantic information. Conversely, when the input image is simple, the top-down attention generated by gaze attention facilitates the rapid and stable extraction of features from the central area of the image.
The attention calculation within each block of the transformer is a relatively independent process. We aim to enhance the connectivity between blocks and further improve the overall visual perception ability of the transformer using visual perception attention. Therefore, we designed the inter-layer short-term visual memory module to generate the affinity map for each block. After a transformer block performs visual perception calculations and generates an affinity map through the inter-level short-term memory module, the visual perception window of the next block is guided by the affinity map of the upper-layer block, updating the visual center of attention.
The horizontal propagation of the feature map is considered spatial-level propagation, while the vertical propagation of the affinity map is considered temporal-level propagation. We fuse semantic information from different levels—temporal and spatial—respectively to extract long-distance contextual features. Considering the difference in feature distribution among samples from different domains, we designed a dual-branch pseudo-label module with pixel-level and category-level affinity constraints. This enhances the ability of the two parallel branches to extract similar domain features.

3.1. Gaze–Saccade Parallel Branches

GSV-Trans consists of two parallel branches: the gaze branch (GB) and the saccade branch (SB). The Gaze Branch comprises 12 gaze blocks, while the Saccade Branch comprises 9 saccade blocks. The structure of the gaze block and saccade block is detailed in Figure 3. The gaze branch simulates the gaze pattern, where the receptive field of the human eye remains fixed, while the saccade branch simulates the saccade pattern, where the visual center of the human eye drifts. During fixation, microsaccadic eye movements are suppressed to maintain the stability of the eyeballs, while rapid and slight visual drift serves as a slow control mechanism to correct fixation errors. Therefore, we added visual perception attention to the gaze branch. After each extraction of the visual center by the self-attention module of the fixed receptive field, it is passed to the next gaze block through the inter-layer short-term visual memory module.
The extraction of the visual center by the eye movement attention module is guided by images, representing bottom-up attention guidance that is not controlled by consciousness. A convolutional network is employed to roughly obtain global context feature maps from different receptive fields. These two attention computing modules enhance the saccade branch’s capability to extract global contextual long-range features.
Figure 4 illustrates the specific network structure of the proposed GSV-Trans. The GSV-Trans is specifically designed for cross-domain semantic segmentation of high-resolution remote sensing images. Its architecture comprises two main branches: the gaze branch and the saccade branch, each embodying distinct visual attention mechanisms inspired by human eye behavior. The gaze branch consists of multiple gaze blocks, each equipped with self-attention, local perception, and contextual perception modules. This branch mimics the behavior of fixating on local regions of an image, enabling focused analysis of critical details. Conversely, the saccade branch comprises several saccade blocks, each featuring self-attention, global perception, and contextual perception modules. This branch simulates the panoramic scanning of an image, facilitating the exploration of broader spatial contexts. A Dual-Branch Pseudo-Label Module is integrated to facilitate information sharing between the gaze and saccade branches, generating pixel-level and category-level pseudo-labels. This enhances the model’s generalization capability and cross-domain adaptation. Furthermore, an affinity network is employed to compute inter-layer correlations, aiding in the propagation and integration of semantic information across different levels of the network.

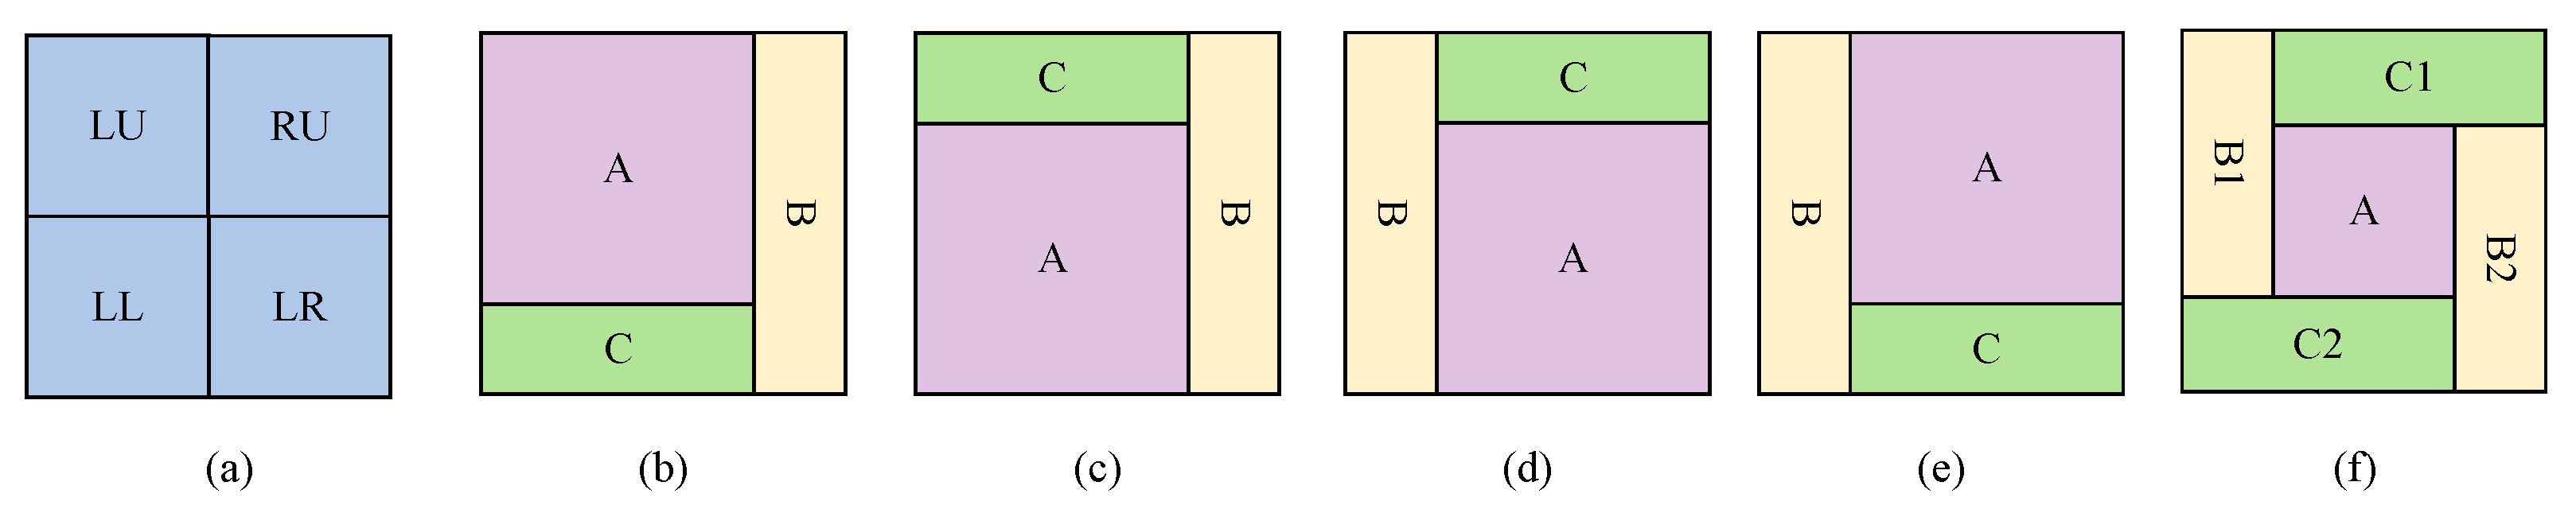
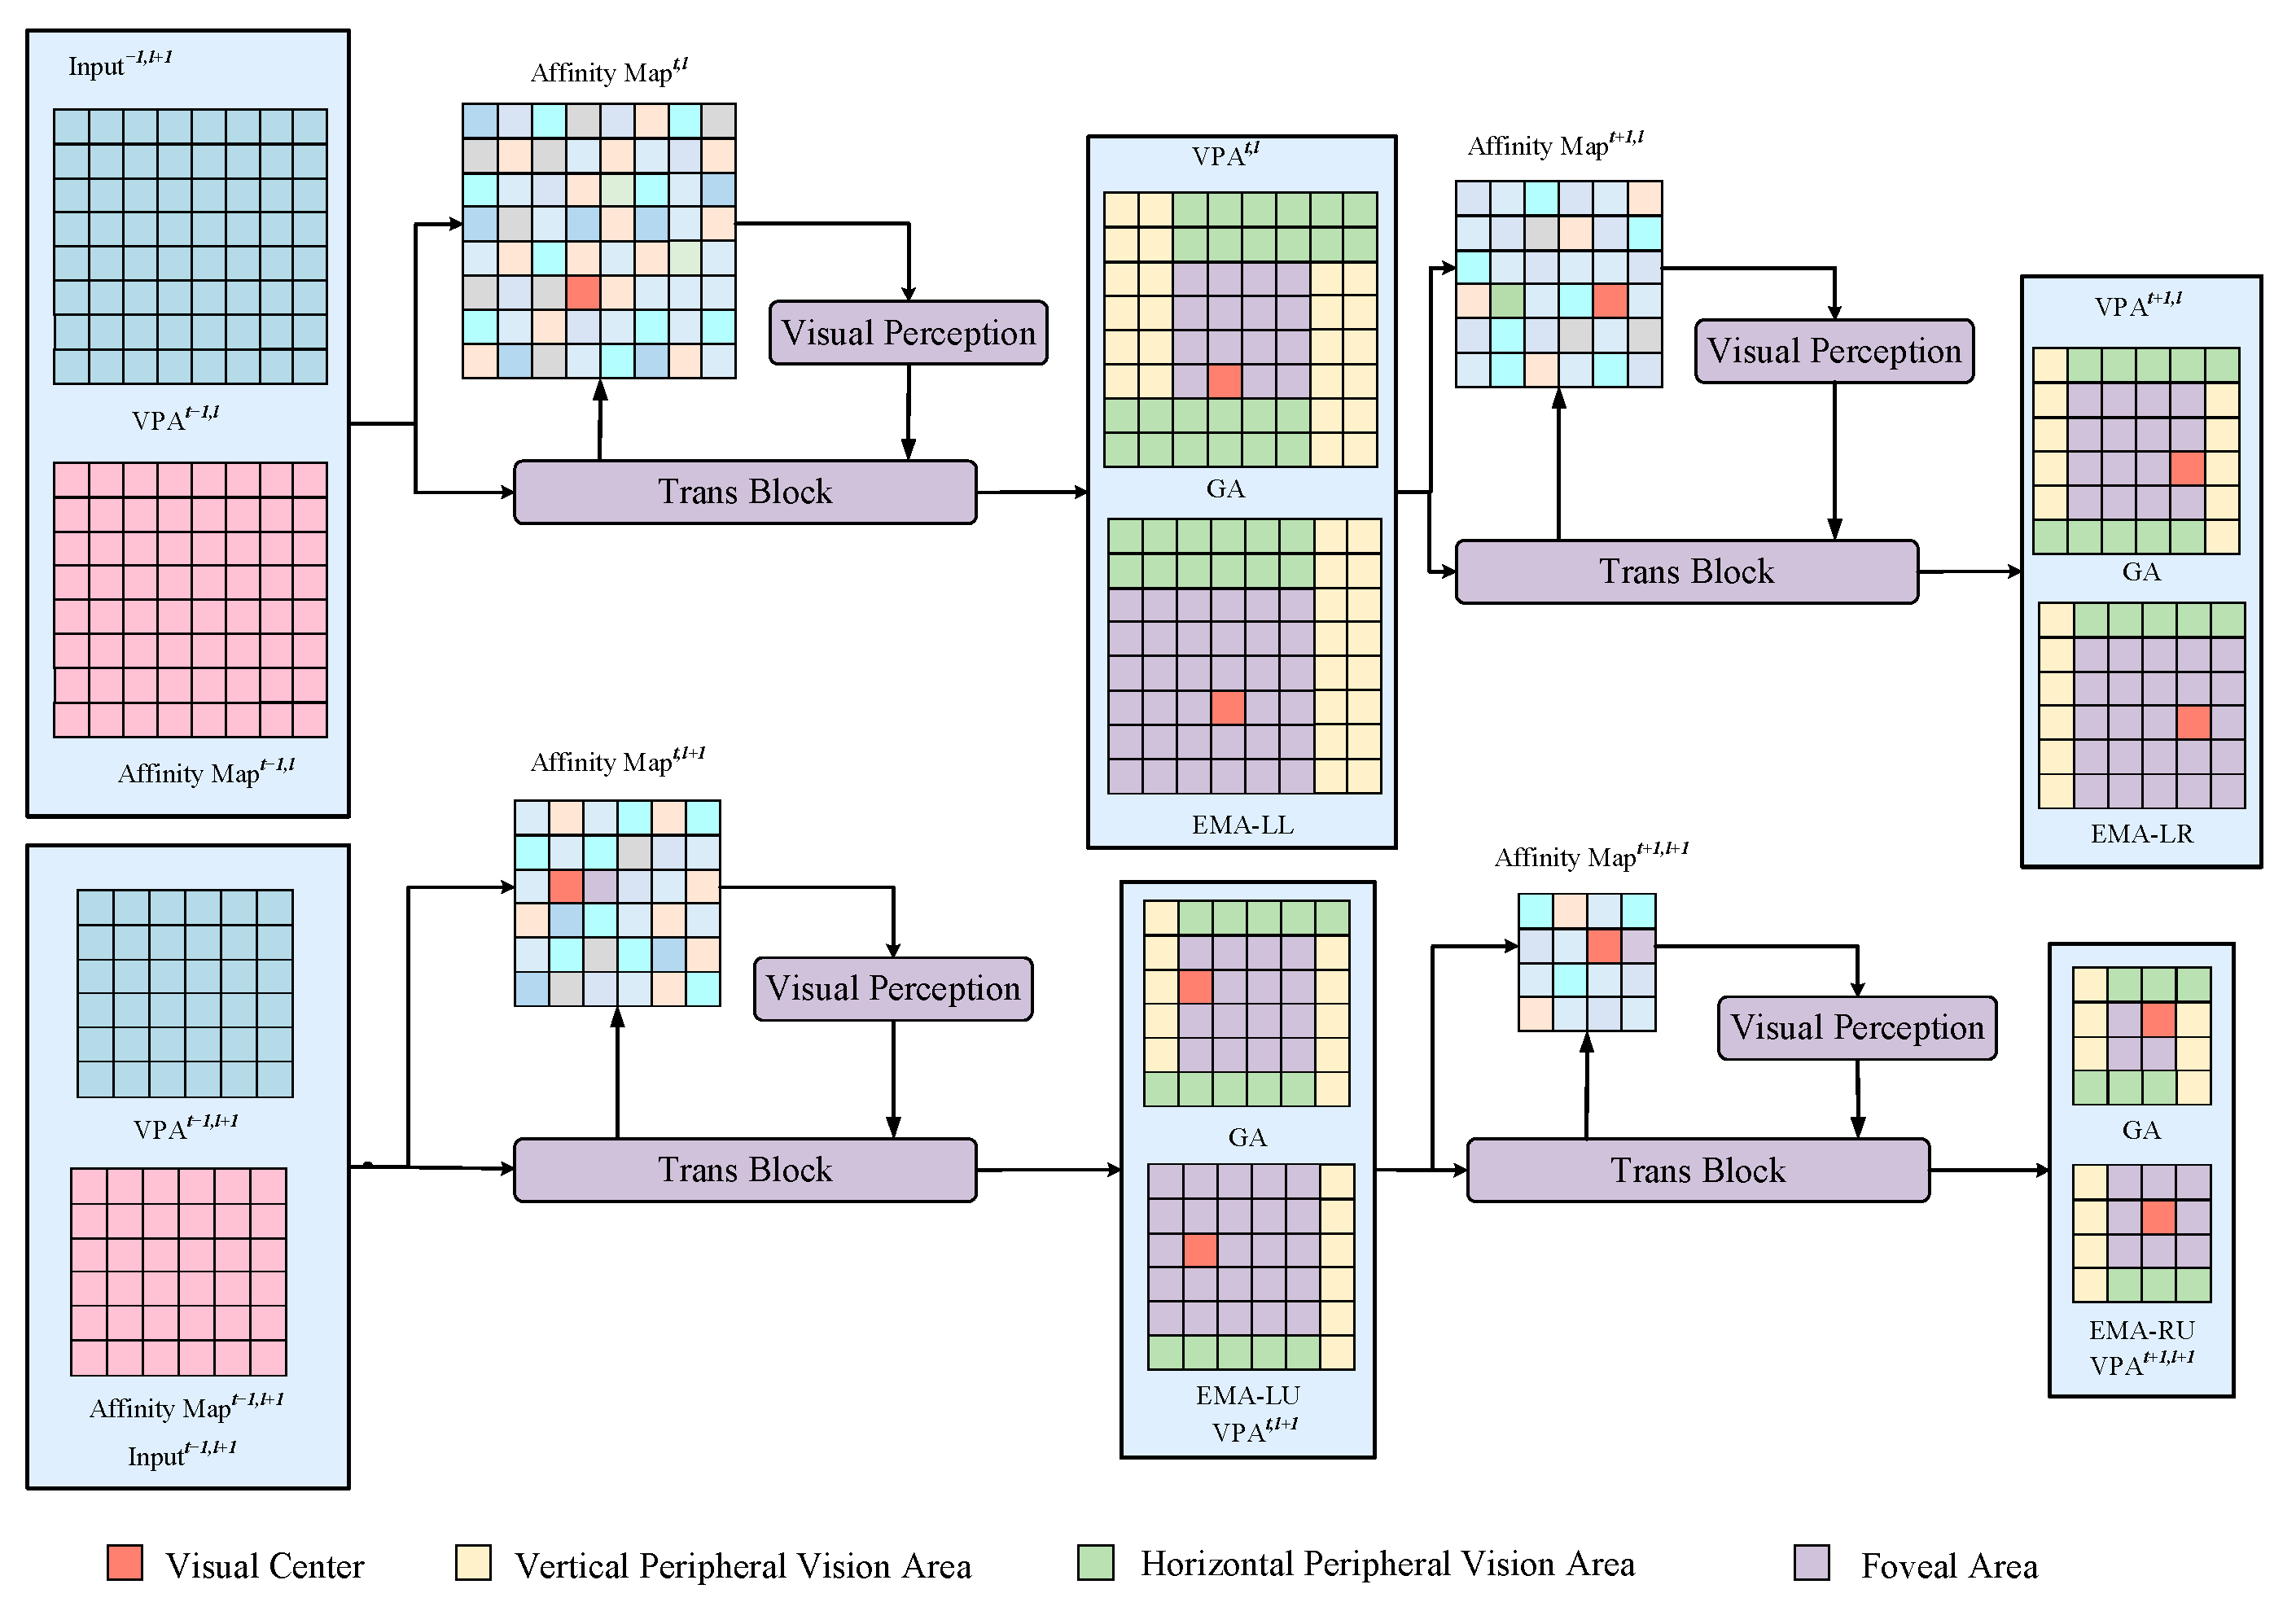
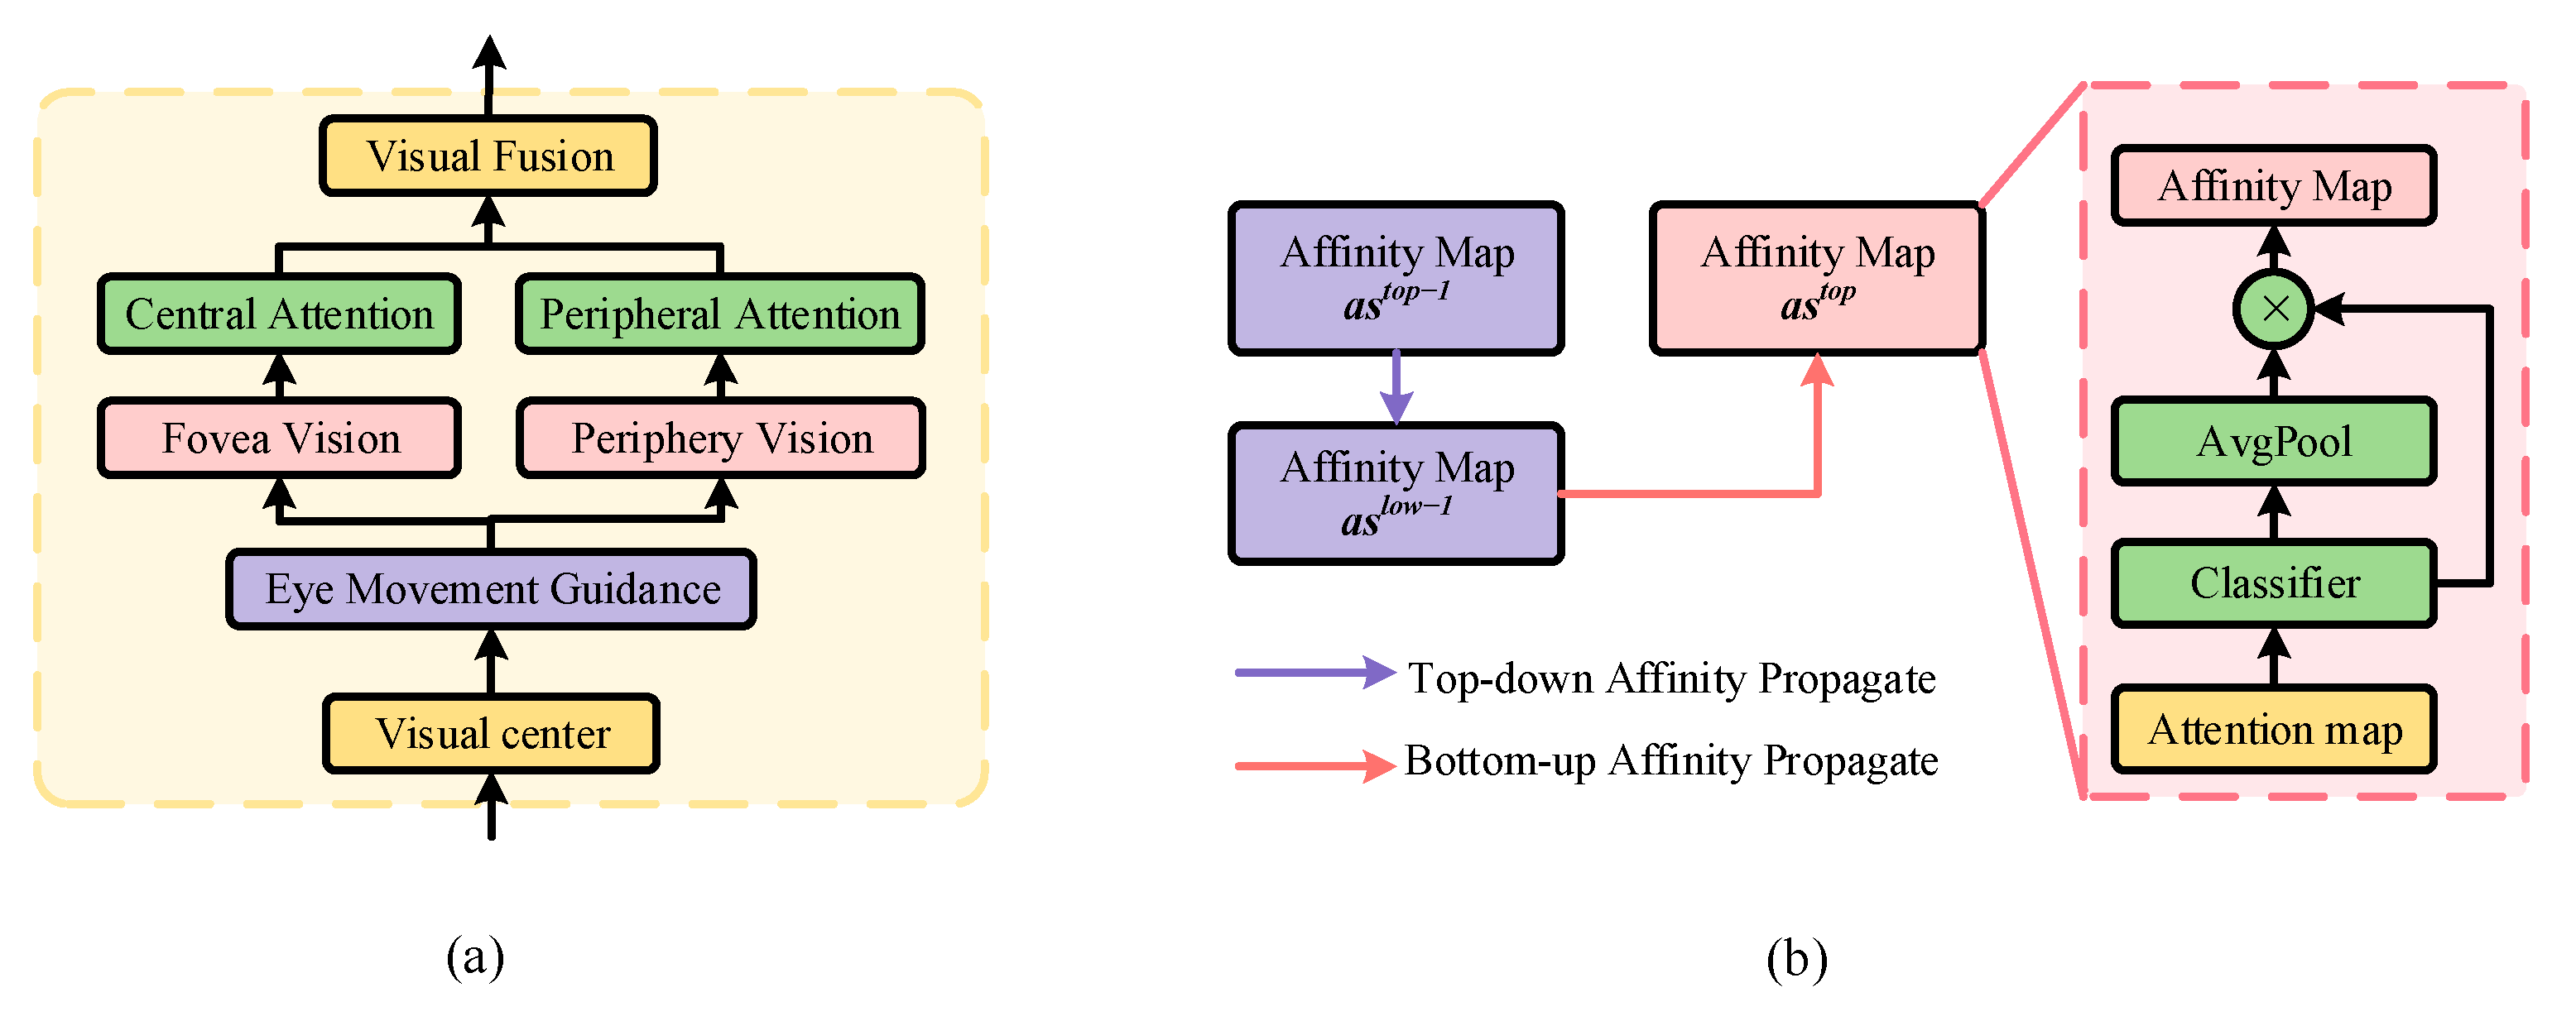
3.2. Visual Perception Attention

We designed two types of visual perception attention: gaze attention (GA) and eye movement attention (EMA). The center of gaze of attention is always the center point of the image. The gaze center of eye movement attention is the visual center. The visual center is jointly affected by the affinity of the current block and the previous block. The details of the extraction of the visual center will be described in Section 3.3.
The foveal area and peripheral vision area of the feature map are divided by the eye movement guidance module. The feature map received by the visual center is a high-resolution image, and the peripheral residual light area processes low-resolution features. After calculating the attention of the foveal area and the peripheral attention, respectively, the visual fusion module outputs the visual perception attention of the feature map. The difference between gaze attention and eye movement attention lies in the different methods of dividing the fovea and peripheral vision. Gaze perception keeps its visual center at the center of the image. As shown in Figure 5f, the foveal area is fixed as area A, while B1, B2, C1, and C2 are all peripheral areas. Assume that the input feature map is the treated receptive field and its area ratio is 1:3. As a top-down attention extraction method, gaze perception can stably extract features in the center area of the image and reduce the amount of calculation. In cases in which the semantic information within the image is complex, we aim to direct the attention module to allocate more computational resources to regions containing richer semantic content. This approach enables the generation of bottom-up attention, focusing computational efforts on areas rich in semantic content.
Figure 5 illustrates the division of the foveal area and peripheral region when the visual center of the image is situated at different positions. During each patch merge process, the visual centers corresponding to various levels of semantics vary. This enables the extraction of multiple visual centers representing diverse semantic information from the peripheral vision, thereby capturing more long-distance features.
Figure 5b–e depict schematic diagrams illustrating eye movement attention guided by image semantics. In these diagrams, the foveal area is denoted as area A, while areas B and C represent the peripheral regions. We assume that the input feature map has an area ratio of 9:7. Compared to gaze perception, eye movement perception enables the acquisition of multiple levels of long-distance semantic features and the allocation of more computational resources to areas rich in semantics. Gaze perception requires fewer computations and is therefore faster. Consequently, gaze perception is well suited for semantic segmentation tasks involving lower image complexity, while eye movement perception is better suited for tasks with higher image complexity.
To address high-resolution remote sensing images with varying complexities, we introduce adaptive eye movement attention (AEMA). As depicted in Figure 6, the determination of visual perceptual attention is influenced by both the visual center of the affinity map and the level of image complexity. We perform a simple complexity calculation on the input image, calculate the standard deviation  s t  and mean  m  of each layer, and set a complex coefficient  α [ 0 , 1 ] . If  s t α × m , the image is determined to be a complex image and this image uses eye movement attention. Otherwise, gaze attention is employed.
The input of TransBlock consists of a pair that combines VPA and Affinity Map. After the attention calculation guided by visual perception, it outputs a new pair which combines VPA and Affinity Map. The visual center of the attention module is extracted from the affinity map, which is represented by the red square in the figure. The input of the visual perception module is a pair comprising visual center and image complexity, and the output is the method of calculating VPA. The calculation methods for visual perception attention include two types: gaze attention (GA) and eye movement attention (EMA). The visual perception module determines whether attention calculation is based on global attention or dynamic attention according to different levels of image complexity. GA is well suited for semantic segmentation tasks involving lower image complexity, while EMA is better suited for tasks with higher image complexity. For GA, attention calculation is not influenced by the visual center. Regardless of where the visual center is located in the image, GA’s calculation method remains as depicted in Figure 5f. For EMA, the different positions of the visual center in the image determine the various calculation methods of EMA. More specifically, depending on the position of the visual center, EMA includes four calculation methods: EMA-LL, EMA-LR, EMA-LU, and EMA-RU. For example, when the visual center falls in the upper-left quadrant of the feature map, EMA’s calculation method, as shown in Figure 5b, involves computing attention separately for regions A, B, and C. This yields visual center attention and peripheral visual attention, which are then combined to form EMA-LU attention.

3.3. Inter-Layer Short-Term Visual Memory Module

The block diagram of visual perception attention is shown in Figure 7a. Generally, the attention calculation of the transformer lacks inter-level guidance, resulting in the loss of certain pieces of semantic information from previous levels. To address this limitation, we introduce an inter-layer short-term visual memory module aimed at providing affinity image and visual center guidance for the GSV-Trans. As depicted in Figure 7b, the attention map produced by multi-head attention is fed into the affinity network to obtain the affinity map. Considering that the gaze branch pays more attention to global attention while the eye movement branch focuses on visual perception attention, the affinity map for the gaze branch is obtained from the attention map of self-attention. Conversely, the eye movement branch receives the visual perception attention map as input for its affinity calculation.
The affinity propagation method from top to bottom is:
A M l o w 1 = ε × [ R ( A M t o p 1 ) A M l o w 1 ] + A M l o w 1
The affinity propagation method from bottom to top is:
A M t o p = ε × [ R ( A M l o w 1 ) A M t o p ] + A M t o p
A M t o p  is the affinity map of the current block in the upper layer,  A M l o w 1  is the affinity map of the upper-level block in the lower layer, and  A M t o p 1  is the affinity map of the upper-level block in the upper layer.  ε [ 0 , 1 ]  is a parameter that could adjust the degree of correction between levels. During the bidirectional affinity propagation process, it is necessary for the sizes of two affinity maps to be consistent for the multiplication operation.  R  refers to the process of changing the size of the affinity map. Specifically,  R  represents the operation of downsampling or upsampling the affinity maps. Downsampling involves using a 3 × 3 convolution with a stride of 4, while upsampling is accomplished through bilinear interpolation. The affinity of the upper layer is propagated from top to bottom to the next layer, while the affinity of the subsequent layer corrects the affinity of the upper layer from bottom to top. This achieves a two-way spatiotemporal propagation of affinity.
The affinity map reflects the significance of different regions within a feature map. Therefore, we extract the affinity center from the affinity map as the visual center of the attention module. The visual center is determined as the centroid of the area with the highest density of pixels sharing the same label. Specifically, we identify the layer with the highest cumulative sum of positive weights, indicating the prominence of pixels with identical labels. Subsequently, we compute the pixel center of gravity within this layer. Negative weights are disregarded, as our work solely emphasizes positive incentives.

3.4. Dual-Branch Pseudo-Label

In cross-domain semantic segmentation tasks, variations in the feature distribution among samples from different domains can result in inaccurate segmentation outcomes. To address this challenge, we introduce a dual-branch pseudo-label module that adds pixel-level and category-level affinity constraints. Figure 8 illustrates the specific structure of the DBPL module. This module aims to improve the semantic segmentation module’s capability to generate similar features within the domain.
Within each attention module of both the gaze branch and the saccade branch, gaze affinity and saccade affinity are obtained through the inter-layer short-term visual memory module. To obtain pixel-level and category-level affinity constraints, the following process is used:
A g p = i N [ avg ( stack ( A g 1 , A g 2 , , A g N ) , a x i s = 3 ) ]
A g c = avg ( stack ( A g 1 , A g 2 , , A g N ) , a x i s = 1 )
A s p = i M [ avg ( stack ( A s 1 , A s 2 , , A s M ) , a x i s = 3 ) ]
A s c = avg ( stack ( A s 1 , A s 2 , , A s N ) , a x i s = 1 )
P g s = conv [ concat ( A g p × A s c , A s p × A g c ) ]
We denote the pixel-level gaze affinity and category-level gaze affinity as  A g p  and  A g c A s p  and  A s c  represent the pixel-level saccade affinity and category-level saccade affinity. Avg represents the operation of calculating the average of the feature map along the axis. Stack represents the operation of stacking all affinity maps together.  N  and  M  are the number of blocks of the gaze branch and the saccade branch, respectively. Concat represents the operation of merging feature maps and conv represents the dimensionality reduction operation based on convolution.  A g p R 1 × H × H  and  A s p R 1 × H × H  represent the affinity between each pixel as a single-layer affinity map.  A g c R N ¯ × H × H  and  A s c R N ¯ × H × H  represent the affinity between categories,  N ¯  is the number of categories.  P g s R N ¯ × H × H  is the pseudo-label of the GSV-Trans segmentation model that imposes bidirectional constraints on the gaze branch and the saccade branch.
The input image pairs are  { x s 1 , x s 2 }  and  { x s 1 , x t 1 } x s 1  and  x s 2  belongs to the same domain,  x s 1  and  x t 1  belongs to the different domain. In the process of training the model, only the source domain sample has the label  L P ˜ g s  is the pseudo-label obtained after semantic segmentation of the source domain image. The target domain image obtains the pseudo-label { A ¯ g c A ¯ s c } through the gaze–saccade parallel branch. The process of the pseudo-label loss function is as follows:
L o s s p s = 1 N ¯ n = 1 N ¯ k = 1 K L n , k ln P ˜ g s , n , k
L o s s p t = 1 N ¯ × i A ¯ g c [ i ] × log ( 1 1 + exp ( A ¯ s c [ i ] ) ) + ( 1 A ¯ g c [ i ] ) × log ( exp ( A ¯ s c [ i ] ) 1 + exp ( A ¯ s c [ i ] ) )
L o s s p s  is the pseudo-label loss of the source domain image;  L o s s p t  is the pseudo-label loss of the target domain image. The loss function consists of the loss function of the segmenter and the loss function of the discriminator. The loss function of the GSV-Trans is
L F = L s e g + λ a d v , F L a d v , F + λ p s L o s s p s + λ p t L o s s p t
L s e g = i = 1 K n = 1 N ¯ L i n log p ( n | x i )
where K is the total number of pixels in each image,  p ( n | x i )  is the probability that the i-th pixel in x is predicted to be class n, and  L i n { 0 , 1 }  is the corresponding label as a binary vector.
L a d v , F = log ( D ( x t , x s 1 ) )
D represents the score by which the discriminator determines a pair of images to be from the same domain. The loss function of the discriminator is:
L D = log ( D ( x s 1 , x s 2 ) ) log ( 1 D ( x t , x s 1 ) )
The model training process of GSV-Trans is shown in Algorithm 1.
Algorithm 1: Training Process of GSV-Trans
Input: Samples  x s  with labels  L  from the source domain,  x t  from the target domain, the training iterations  N , gaze branch  G B ( ) , saccade branch  S B ( ) , affinity net  A ( ) , and discriminator  D .
Output: Prediction mask  P S  of  x s , prediction mask  P t  of  x t .
For  i  = 1 to  N  
Obtain attention map:  A g s = G B ( x s ) A s s = S B ( x s ) , A g t = G B ( x t ) , A s t = S B ( x t ) .
Obtain affinity map:  A f s = A ( x s ) A f t = A ( x t ) .
Update  A f s  and  A f t  by Equations (1) and (2).
Obtain pixel-level affinity pseudo-label  A g  and category-level affinity pseudo-label  A s  by Equations (3)–(6).
Obtain pixel label  P g s  by Equation (7).
Compute pseudo-label loss by Equations (8) and (9):  L o s s p s ( P g s , L ) L o s s p t ( A g , A s ) .
Updating  G B ( )  and  S B ( )  by minimizing  L F = L s e g + λ a d v , F L a d v , F + λ p s L o s s p s + λ p t L o s s p t .
Updating  D  by minimizing  L D = log ( D ( x s 1 , x s 2 ) ) log ( 1 D ( x t , x s 1 ) )  

4. Experiments

In this section, we first introduce the remote sensing image datasets and provide implementation details. Subsequently, we explore the effectiveness of each module of GSV-Trans. To further evaluate the performance of GSV-Trans, we conduct comparative experiments with algorithms that have demonstrated satisfactory results in the field of cross-domain semantic segmentation in recent years.

4.1. Datasets and Evaluation Metrics

ISPRS Vaihingen challenge dataset is a benchmark dataset of the ISPRS 2D semantic labeling challenge in Vaihingen, which is a village with many historic buildings, residential buildings, and small detached houses. It contains 32 three-band IRRG (Infrared, Red, and Green) VHR RSIs, each with a resolution of 2500 × 2000. Among the images, only 16 have pixel-level labels, including impervious surfaces, buildings, low vegetation, trees, and cars. From these labeled images, we randomly chose 10 for the training set, while the remaining labeled images constituted the testing set. The training images were cropped to a size of 512 × 512 with a 200-pixel overlap in both width and height.
ISPRS Potsdam Challenge Dataset comprises 38 IRR VHR RSIs, each with a resolution of 6000 × 6000 and a ground sample distance (GSD) of 5 cm. The Potsdam dataset was obtained from aerial photographs of Potsdam city in Germany using aircraft sensors. It consists of four bands (Infrared, Red, Green, and Blue), forming two types of images: IRRG and RGB. Among them, only 24 images have pixel-level labels for impervious surfaces, buildings, low vegetation, trees, and car classes. We randomly selected 15 images from the labeled images as the training set and the remaining labeled images as the testing set. We cropped the images in the training set to a size of 512 × 512 with a width and height overlap of 200 pixels, respectively. The test images were cropped into patches of the same size, with no overlap. Moreover, we applied horizontal flipping and vertical flipping to augment the training set and resize the images with a factor of {0.5, 1.5} to enlarge the training set.
The evaluating metrics follow the official advice. We adopt the Intersection over Union (IoU), mIoU, F1 score (F1), and mF1 as the evaluation criteria:
I o U ( P m , P g t ) = | P m P g t | | P m P g t |
m I o U = 1 N i = 1 N I o U i
where  N P m  and  P g t  are the number of categories, the set of predicted pixels, and the set of ground truth pixels.   and   represent intersection and union operations.
F 1 = 2 P r e × R e c P r e + R e c ,   P r e = t p t p + f p ,   R e c = t p t p + f n
m F 1 = 1 N i = 1 N F 1 i L a d v , F = log ( D ( x t , x s 1 ) )
where  t p f p , and  f n  represent the true positives, false positives, and false negatives, respectively.

4.2. Comparison Method and Implementation Details

To assess the performance, we conduct a comprehensive comparison between our proposed GSV-Trans model and several existing models, including TriADA [28], MCD [29], ResiDualGAN [30], CIA-UDA [16], DAFormer [31], SWIN-Unet [32], and SegVitv2 [33]. MCD is an unsupervised domain adaptation method for aligning source and target distributions based on task decision boundaries. It optimizes the feature extraction network through a max–min game to generate more efficient domain-invariant features. TriADA is a domain adaptation (DA) segmentation model that combines triplet feature sets from two domains. ResiDualGAN is an adversarial generative network featuring an in-network resizer module to mitigate differences in sample scale. CIA-UDA is an inter-domain category alignment algorithm with style transfer. In recent years, some transformer structures based on self-attention have been applied to the task of semantic segmentation of images. DAformer consists of a transformer encoder and a multi-level context-aware feature fusion decoder. SWIN-Unet is a SWIN transformer with a Unet-like structure and a shift window. SegViTv2 adopts a novel attention-to-mask decoder module for efficient semantic segmentation. It incorporates a shrunk structure in the encoder, which reduces computational costs significantly while maintaining competitive performance. Additionally, to further evaluate the effectiveness of GSV-Trans, we designed a baseline model trained solely on the source domain. This baseline model serves as a reference to assess the degree of domain shift.
To ensure the fairness of the experiments, the algorithm mentioned above is employed as the generator component of the generative adversarial network model in cross-domain semantic segmentation. The proposed GSV-Trans is compared with state-of-the-art semantic segmentation methods on both the ISPRS Vaihingen dataset and the ISPRS Potsdam Challenge dataset. In the semantic segmentation network, we utilize the SGD optimizer with a momentum of 0.9 and a weight decay of 0.0001. The initial learning rate is set to 0.00025. For the discriminator, we employ the Adam optimizer with betas of (0.9, 0.99), and the initial learning rate is set to 0.0001. The range of learning rates was determined through a series of preliminary experiments, while the remaining parameters followed common ranges observed in previous works in the field of semantic segmentation. The model was trained in 100,000 iterations on a GeForce RTX 3090 GPU device. These experiments were conducted using the PyTorch framework, version 1.7.1.

4.3. Cross-Domain Semantic Segmentation Task from Potsdam-IRRG to Vaihingen

We conducted a series of cross-domain semantic segmentation experiments from Potsdam to Vaihingen. Before the experiments, we resized the training images in both the Potsdam and Vaihingen datasets to a size of 512 × 512 pixels, with an overlap of 200 pixels in width and height. The test set images from both datasets were cropped into small patches of size 512 × 512 pixels without overlap. To augment the training set of Potsdam, we applied horizontal and vertical flipping as well as image resizing. The model was trained using 5415 labeled training images from Potsdam and 3232 unlabeled training images from Vaihingen. Additionally, 810 test images from Vaihingen were used for evaluation.

4.3.1. Ablation Study from Potsdam-IRRG to Vaihingen

We conducted ablation experiments using the Vaihingen dataset to verify the effectiveness of each model in our proposed architecture. The results are shown in Table 1. In ablation experiments, ISVM must be introduced with AEMA because ISVM is obtained through AEMA.
In addition, AEMA cannot be removed to separately analyze the SB structure because the attention module in SB uses adaptive eye movement attention. The mIoU and mF1 of GB that only calculate global self-attention after removing AEMA are 49.2% and 62.6%, respectively, which means that GB has basic semantic segmentation capabilities. After the AEMA module was inserted into GB, mIoU and mF1 increased by 2.9% and 2.0%, respectively, which proves that the adaptive eye movement module we proposed can effectively improve the performance of the transformer structure. The introduction of ISVM increased mIoU and mF1 by 1.5% and 2.2%, respectively, significantly improving the semantic segmentation accuracy of the model. Compared with the single-branch GB structure, the dual-branch model with GB and SB has mIoU and mF1 increased by 4.6% and 4.5%, respectively, which means that the dual-branch structure can significantly improve the model’s ability to extract domain-invariant features.
After introducing ISVM to the dual-branch structure with the eye movement module, mIoU, and mF1 increased by 1.1% and 1.2%. The introduction of DBPL further improved the consistency between the model’s prediction results and the actual labels. The above ablation experimental results in the Vaihingen dataset demonstrate the effectiveness of each key step in the GSV-Trans.

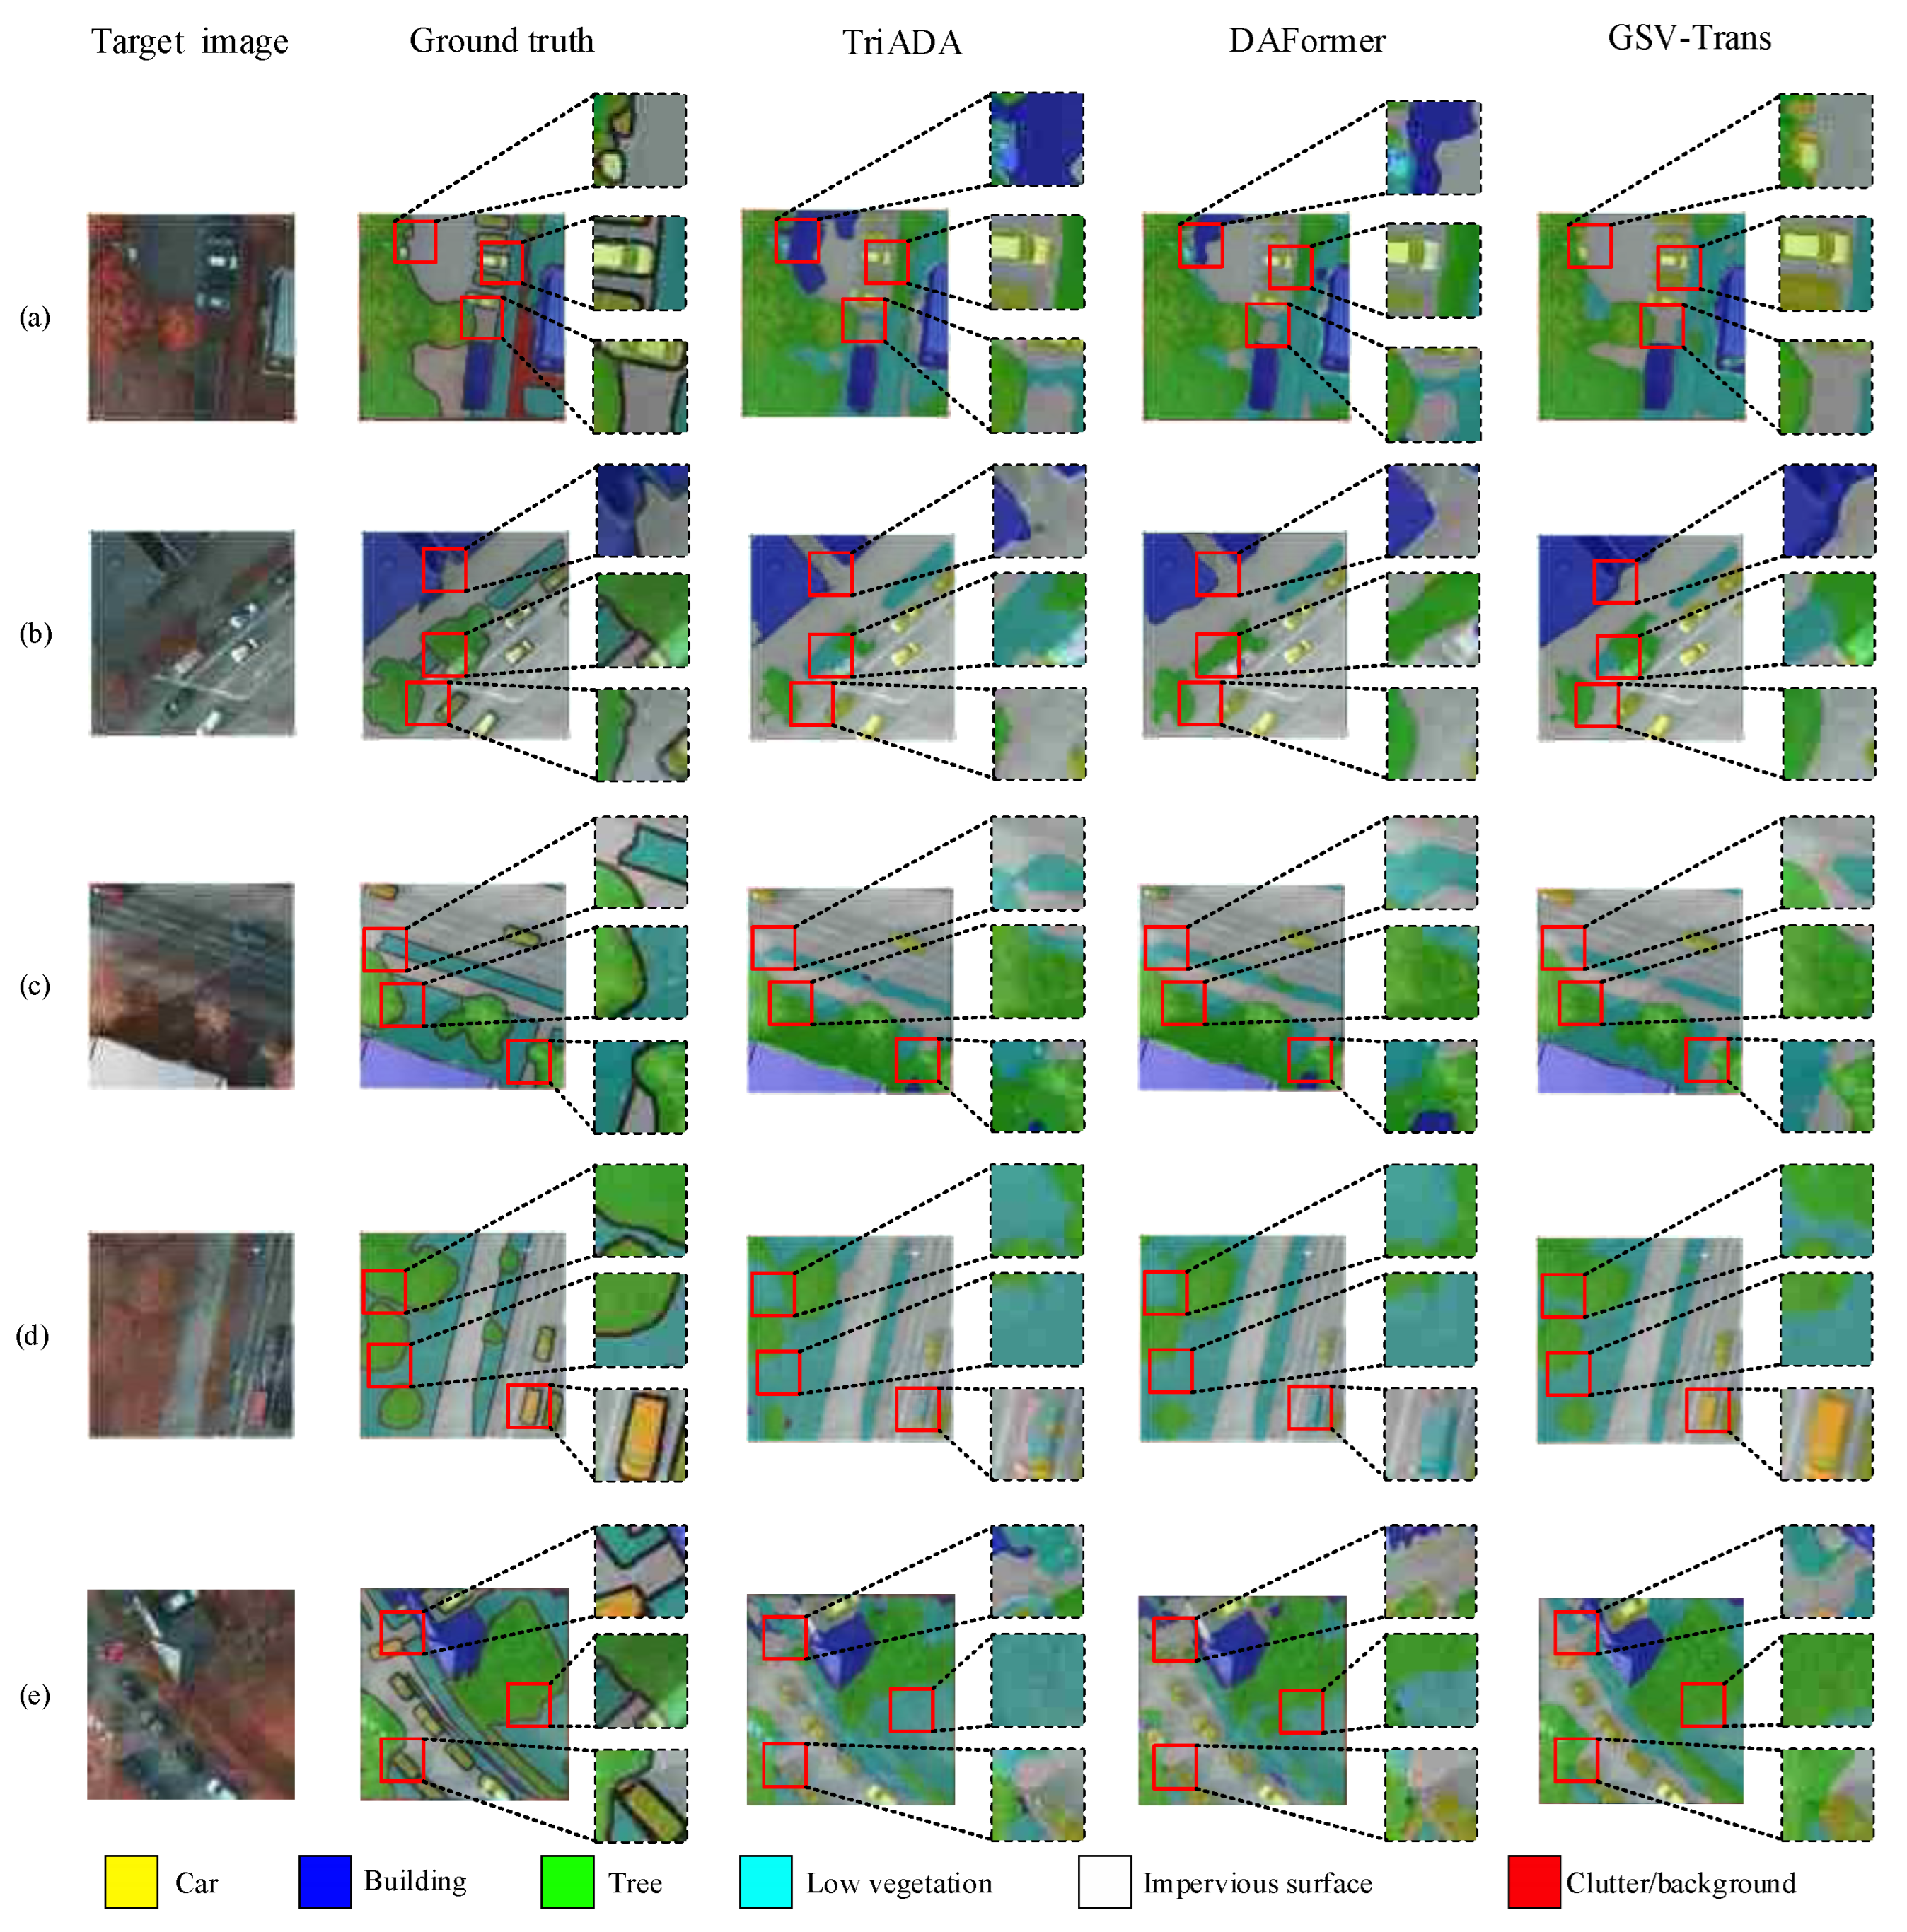
4.3.2. Compare with Other Methods from Potsdam-IRRG to Vaihingen

Table 2 shows the cross-domain semantic segmentation results of GSV-Trans and other methods on Potsdam to Vaihingen. MCD is a typical algorithm that uses the max–min game to extract domain-invariant features. In the semantic segmentation task of high-resolution remote sensing images with complex semantic information, the mIoU and mF1 of MCD are only 41.4% and 58.8%—13.7% and 10.8% lower than the GSV-Trans. Compared with the generative adversarial networks TriADA and ResiDualGAN, which use convolutional structures as the basic network model, the mIoU and mF1 of the GSV-Trans we proposed based on the attention module have been significantly improved, indicating that the attention module can learn richer features details from complex remote sensing images. CIA-UDA is an algorithm for inter-domain category alignment with style transfer. The semantic segmentation performance of CIA-UDA slightly improved compared to the previous algorithms, but the mIoU and mF1 were still 2.8% and 3.9% lower than the GSV-Trans, indicating the effectiveness of our proposed category-level and pixel-level pseudo-labeling strategies.
In addition, to evaluate the context information awareness capability of GSV-Trans and the effectiveness of the dual-branch structure, we conducted cross-domain semantic segmentation experiments using DAFormer and SWIN-Unet, which also have transformer structures. DAFormer inserts a context-aware module in the decoder, while our GSV-Trans obtains context awareness through visual perception in the encoder. The mIoU and mF1 of the GSV-Trans are 3.3% and 3.4% higher than those of the DAFormer, respectively, proving that compared to adding a context-aware module to the decoder, adding context awareness to the encoder can significantly enhance the learning and expression capabilities of the model. Compared with SWIN-Unet, which has a Unet-like structure and shift window, the mIoU and mF1 of our gaze–saccade dual-branch structure have been improved by 4.7% and 4.0%, respectively, proving that the gaze–saccade dual-branch structure can learn richer semantic information than the Unet-like structure. Compared to SegVitv2, GSV-Trans achieved an increase of 2.5% and 3.1% in mIoU and mF1 scores, respectively. As shown in Table 2, the semantic segmentation results of GSV-Trans in each category exceed those of other algorithms.
In addition, we visualize the cross-domain semantic segmentation results of GSV-Trans and the aforementioned algorithm from Potsdam to Vaihingen to intuitively demonstrate the advantages of the GSV-Trans. As shown in Figure 9, we provide visualization results for the Vaihingen dataset. It is evident from Figure 9 that the GSV-Trans can produce reasonable predictions in high-resolution cross-domain semantic segmentation tasks.
We conducted further comparative analysis using CIA-UDA and ResiDualGAN, which outperformed other comparative methods in the semantic segmentation task from Potsdam to Vaihingen, to further evaluate the segmentation performance of GSV-Trans. The experimental visualization results are shown in Figure 10. Compared with other methods, the experimental results of GSV-Trans are more consistent with the ground truth (GT). In Figure 10a, GSV-Trans accurately identifies two buildings that are far apart, indicating its ability to extract the feature consistency of similar pixels in long-distance contexts. Figure 10b reveals that the boundary demarcation capabilities of CIA-UDA and ResiDualGAN are significantly weaker than those of GSV-Trans. Both CIA-UDA and ResiDualGAN incorrectly identify the tree shadow part belonging to the impervious surface in Figure 10c as low vegetation, while GSV-Trans accurately distinguishes between low vegetation and impervious surface. Additionally, GSV-Trans achieves satisfactory results in capturing edge features (Figure 10d). Moreover, Figure 10e shows that GSV-Trans can accurately identify scattered small area pixels and extract the boundaries of trees and low vegetation.

4.4. Cross-Domain Semantic Segmentation Task from Vaihingen to Potsdam-IRRG

We conducted a series of cross-domain semantic segmentation experiments from Vaihingen to Potsdam. Before the experiments, we cropped the images in the training sets of Potsdam and Vaihingen to a size of 512 × 512, with an overlap of 200 pixels in width and height, respectively. The test set images of Potsdam and Vaihingen were cropped into small patches of 512 × 512 in size without overlap. We applied horizontal and vertical flipping as well as image resizing to augment Potsdam’s training set. The model was trained using 5415 labeled training images from Potsdam and 3232 unlabeled training images from Vaihingen, with 810 test images from Vaihingen used for evaluation. Similarly, the model was trained using 3232 labeled training images from Vaihingen and 5415 unlabeled training images from Potsdam, with 1296 test images from Potsdam being used for evaluation.

4.4.1. Ablation Study from Vaihingen to Potsdam-IRRG

To further verify the effectiveness of each key step of GSV-trans, we also conducted ablation experiments on the Potsdam dataset. The source domain and target domain were Vaihingen and Potsdam, respectively. The results are shown in Table 3. The introduction of adaptive eye movement attention increased the mIoU and mF1 of the GB model by 2.0% and 1.5%, respectively. This demonstrates that adaptive eye movement attention significantly improves the ability to extract distant contextual features compared to self-attention. The deployment of ISVM increased the mIoU and mF1 of GB with AEMA by 2.1% and 1.1%, respectively. This proves that the short-term memory model with affinity guidance can effectively improve the segmentation accuracy of the model. Compared with the single-branch structure with only GB, the mIoU and mF1 of the GB and SB dual-branch models increased by 7.3% and 3.0%, respectively. This indicates that the dual-branch structure can effectively improve the model’s ability to obtain global contextual features and different levels of semantic information.
Additionally, we observe that the introduction of DBPL helps align domain-similar features from the category and pixel levels, resulting in an improvement of mIoU and mF1 of the dual-branch structure by 1.1% and 1.2%, respectively. To verify the importance of bidirectional affinity propagation for visual perception, we inserted the ISVM module into the dual-branch model, resulting in increases in mIoU and mF1 of 1.3% and 1.8%, respectively. The ablation experimental results of the ISVM module and the DBPL module demonstrate that the short-term visual memory model with affinity guidance and the dual-branch pseudo-labeling strategy significantly improve the segmentation performance of the model.

4.4.2. Compare with Other Methods from Vaihingen to Potsdam-IRRG
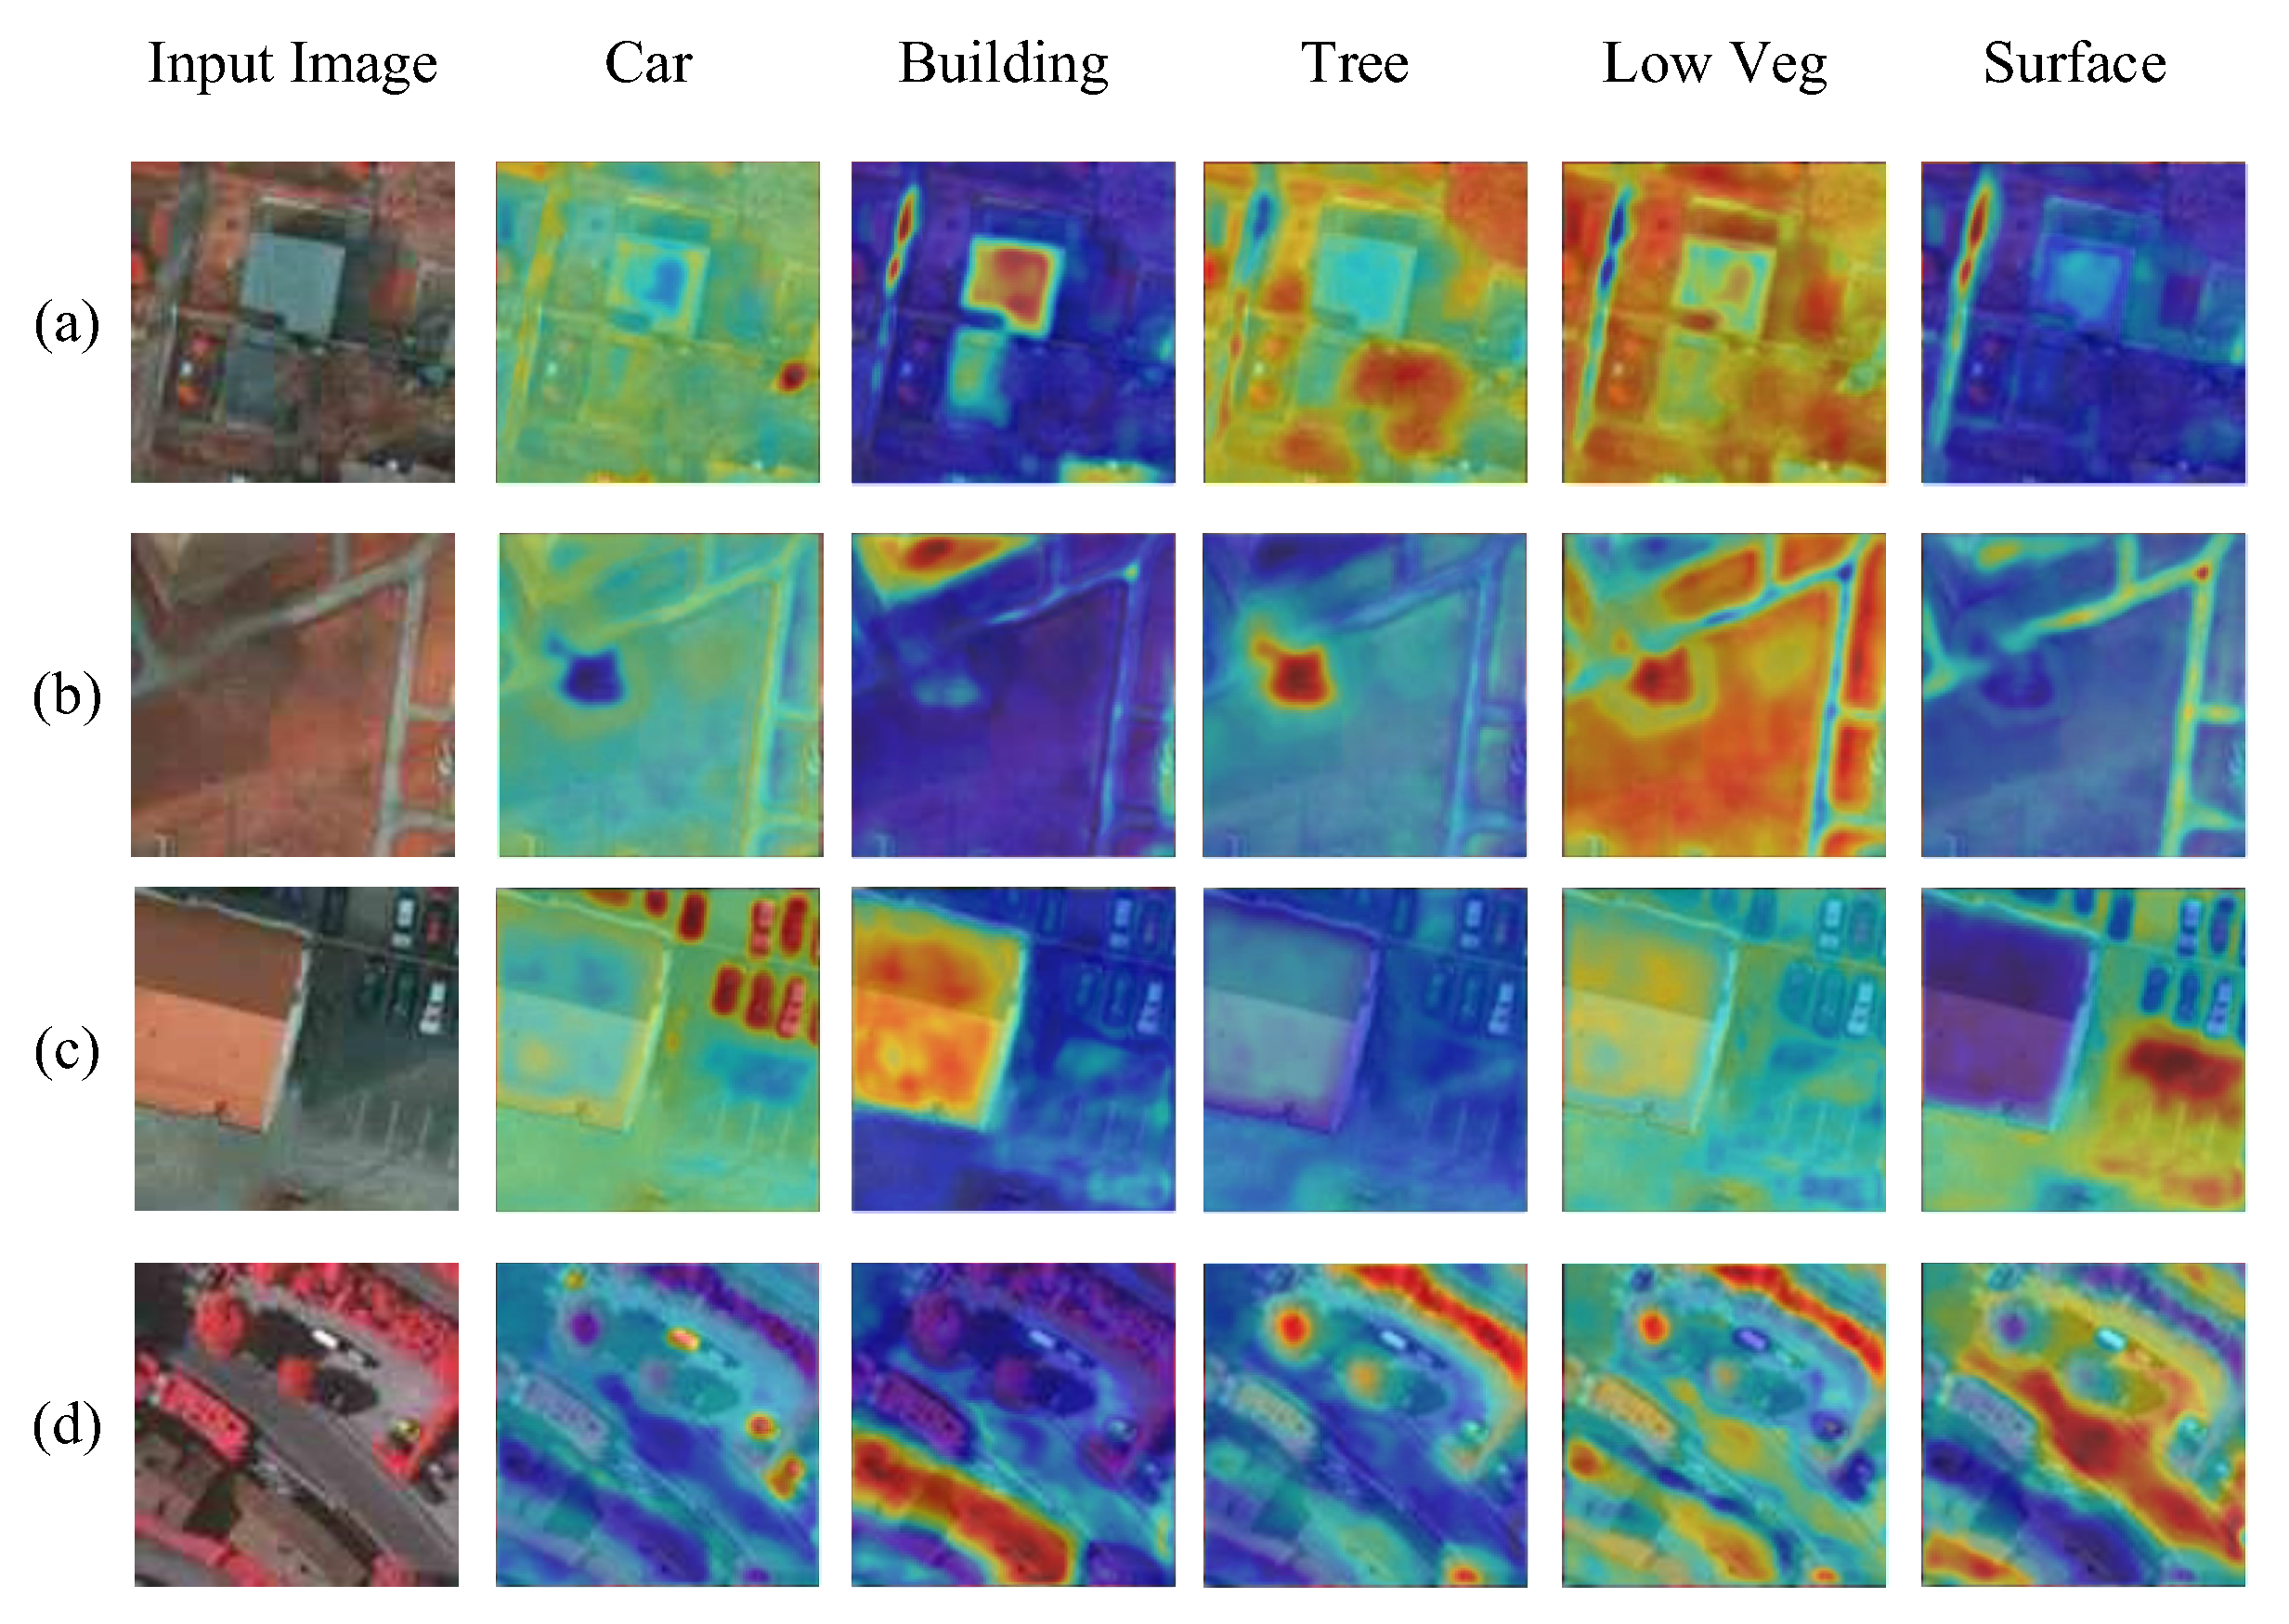
Table 4 presents the cross-domain semantic segmentation results of GSV-Trans and other methods on the Vaihingen to Potsdam task. The experimental results of the baseline show that trees and low vegetation in the Potsdam dataset exhibit significant differences between domains and pose challenges for accurate segmentation in cross-domain tasks. Compared with the baseline, GSV-Trans achieved significant increases in IoU for trees and low vegetation of 31.6% and 30.5%, respectively. Additionally, the F1 scores on trees and low vegetation increased by 24.3% and 29.0%, respectively. These results indicate that GSV-Trans is capable of producing accurate cross-domain semantic segmentation results, even in scenarios with large differences in feature distribution between domains. The mIoU and mF1 scores of MCD are 21.1% and 20.4% lower than those of GSV-Trans, respectively. This reflects the limitations of the generalized inter-domain category alignment method in the semantic segmentation task of high-resolution remote sensing images. Compared to SegVitv2, GSV-Trans achieved increases of 1.8% and 1.5% in mIoU and mF1 scores, respectively. This indicates that SegViTv2, which is suitable for typical scenes, performs less effectively in cross-domain semantic segmentation of high-resolution remote sensing images compared to our proposed GSV-Trans.
As shown in Table 4, the semantic segmentation results of GSV-Trans outperform those of other algorithms in each category. The experimental results demonstrate that our proposed GSV-Trans can effectively explore rich contextual long-range information in high-resolution remote sensing images, surpassing several other algorithms in extracting domain similarity features with smaller differences between domains.
Figure 11 presents the visualization results of the above model on the Vaihingen dataset. Compared with several other algorithms, GSV-Trans generates more accurate pixel-level category predictions. To further evaluate the segmentation performance of GSV-Trans, we conducted a comparative analysis using TriADA and DAFormer, which outperformed other methods in the semantic segmentation task from Vaihingen to Potsdam. The experimental visualization results are shown in Figure 12.
In Figure 12a, the occlusion of the car by trees causes TriADA and DAFormer to incorrectly identify the car as low vegetation. However, GSV-Trans successfully identifies the car blocked by trees, demonstrating its ability to effectively identify incomplete objects that are occluded. Figure 12b,c illustrate that GSV-Trans accurately captures pixel boundaries of different categories, indicating its excellent edge feature capture capabilities. Finally, Figure 12d,e show GSV-Trans has outstanding recognition ability for small pixel areas in complex images.
Table 5 presents the segmentation comparison results for the cross-domain semantic segmentation task between the Vaihingen and Potsdam datasets, considering different combinations of source and target domains. The model achieves an IoU of 65.2% and an F1 score of 79.6% when the Vaihingen dataset is used as the source domain and the Potsdam-RGB dataset as the target domain. These results indicate effective semantic segmentation, with a relatively high intersection over union and F1 score, showcasing the model’s ability to generalize well to the target domain. Conversely, when the Potsdam-RGB dataset serves as the source domain and the Vaihingen dataset serves as the target domain, the performance slightly decreases, yielding an IoU of 56.8% and an F1 score of 70.2%. Despite the decrease compared to the previous scenario, the model still demonstrates reasonable segmentation results, although not as high as when Vaihingen serves as the source domain. When using the Potsdam-IRRG dataset as the source domain and the Vaihingen dataset as the target domain, the model achieves an IoU of 55.1% and an F1 score of 69.6%. These scores are slightly lower than those obtained in the previous scenario, indicating a comparable performance between Potsdam-RGB and Potsdam-IRRG when transferred to the Vaihingen dataset. The model demonstrates consistent performance when transferring from Vaihingen to Potsdam-IRRG, with an IoU of 64.5% and an F1 score of 78.1%. These results suggest that the model generalizes well across different domains, maintaining effective semantic segmentation capabilities even when the target domain involves different spectral bands.

4.5. Affinity Map

In the inter-layer short-term visual memory module, we utilize the affinity network to extract the affinity map from the attention map generated by multi-head attention. The affinity map indicates the attention head’s level of interest in the semantic information across different areas. We utilize the affinity center as the visual center and establish affinity constraints at both the pixel level and category level, respectively.
To further evaluate the capability of our proposed inter-layer short-term visual memory module in extracting key pixels for image classification and localization, we present visualization results of the affinity map in Figure 13. Figure 13a–c display the visualization results of the affinity graph generated by GSV-Trans in the cross-domain semantic segmentation experiment from Vaihingen to Potsdam. Figure 13a demonstrates that the designed affinity network accurately locates and identifies small targets such as cars. The visualization result in Figure 13b illustrates that the affinity network accurately distinguishes between semantic information related to trees and low vegetation by capturing the semantic features of trees. Figure 13c demonstrates that the affinity map accurately captures activation coverage of the target area and generates an effective object localization mapping. Figure 13d presents the visualization result of the affinity graph generated by GSV-Trans in the cross-domain semantic segmentation experiment from Vaihingen to Potsdam. The visualization result in Figure 13d illustrates that the designed affinity network accurately identifies and locates scattered small target areas. Additionally, the visualization results of the affinity map demonstrate that the inter-layer short-term visual memory module effectively extracts semantic information that aids in segmentation and localization.

4.6. Confusion Matrix

In addition, to further analyze the segmentation of samples between classes in different domains, we present the confusion matrix of GSV-Trans in Figure 14. Figure 14a,b depict the confusion matrices obtained by cross-domain semantic segmentation of GSV-Trans on Potsdam to Vaihingen and Vaihingen to Potsdam, respectively. Figure 14a demonstrates the excellent high-precision segmentation performance of GSV-Trans on buildings, trees, and surfaces in the Vaihingen dataset. Figure 14b illustrates that GSV-Trans achieves extremely high accuracy in cars, buildings, low vegetation, and surfaces in the Potsdam dataset. The results of the confusion matrix demonstrate that GSV-Trans effectively learns features that amplify inter-class differences while reducing inter-domain differences.

5. Conclusions

In this paper, we proposed a novel transformer model with dynamic visual perception. The main framework of the model consists of a dual-branch architecture comprising a gaze branch and a saccade branch. The gaze branch simulates the fixed receptive field pattern of the human eye, while the saccade branch simulates the drifting of the human visual center during saccades. By introducing adaptive visual perception attention modules in both the gaze branch and saccade branch, our method effectively captures global contextual semantic information from images. The inter-layer short-term visual memory module integrates rich semantic information from both the temporal level and the spatial level, providing visual center guidance for the adaptive visual perception attention module. To obtain domain-invariant features that amplify inter-class differences while minimizing inter-domain differences, we designed a dual-branch pseudo-label module. This module possesses pixel-level and category-level affinity constraints to enhance the ability of two parallel branches to extract domain-similar features.
The cross-domain semantic segmentation experiments conducted on the Vaihingen and Potsdam datasets confirmed the effectiveness of the proposed GSV-Trans. Our proposed method has shown promising results in cross-domain semantic segmentation tasks on remote sensing datasets, but still has limitations. Firstly, the performance of our method may vary depending on the specific characteristics of the datasets, such as the complexity of the scenes, the quality of annotations, and variations in lighting and weather conditions. Secondly, although we have achieved competitive performance compared to existing methods, there is still room for improvement in terms of computational efficiency and generalization capability, especially when dealing with larger-scale datasets or more diverse domain shifts. For future work, we aim to address these limitations and further advance the field of cross-domain semantic segmentation. One direction is to explore more sophisticated attention mechanisms or architectural modifications to enhance the model’s ability to capture fine-grained semantic information and adapt to different domain shifts more effectively. Additionally, investigating semi-supervised or unsupervised learning approaches could alleviate the dependency on fully annotated datasets and facilitate model training in scenarios where labeled data are scarce or costly to obtain. Furthermore, extending our research to include experiments on datasets from various geographic regions and environmental conditions would provide a more comprehensive evaluation of the proposed method’s robustness and generalization capability. Overall, by addressing these challenges and exploring new research avenues, we aim to develop more robust, efficient, and versatile solutions for cross-domain semantic segmentation in remote sensing applications.

Author Contributions

Conceptualization, X.W. and H.W.; methodology, X.W.; software, X.W. and Y.J.; validation, X.W.; formal analysis, X.W.; investigation, X.Y. and J.C.; resources, H.W.; data curation, Y.J.; writing—original draft preparation, X.W.; writing—review and editing, H.W.; visualization, X.W.; supervision, H.W.; project administration, H.W.; funding acquisition, H.W. All authors have read and agreed to the published version of the manuscript.

Funding

This research was funded by the Postgraduate Research & Practice Innovation Program of Jiangsu Province (NO. KYCX23_0363), Interdisciplinary Innovation Fund for Doctoral Students of Nanjing University of Aeronautics and Astronautics, the Key Research and Development Project of Qixia 751 District in 2022 (NO. ZY202224), Jiangsu Provincial Key Laboratory of Culture and Tourism for Non-destructive Testing and Safety Traceability of Cultural Relics, Key Laboratory of Non-Destructive Testing and Monitoring Technology for High-Speed Transport Facilities of the Ministry of Industry and Information Technology.

Data Availability Statement

The data presented in this article are publicly available on GitHub at https://github.com/cindrew123/GSV-Trans (accessed on 24 April 2024).

Acknowledgments

The authors gratefully acknowledge the support from Nanjing University of Aeronautics and Astronautics.

Conflicts of Interest

The Author Xianming Yang was employed by the China Greatwall Technology Group Co., Ltd. The remaining authors declare that the research was conducted in the absence of any commercial or financial relationships that could be construed as a potential conflict of interest. The funders had no role in the design of the study; in the collection, analyses, or interpretation of data; in the writing of the manuscript; or in the decision to publish the results.

References

  1. Chen, L.-C.; Papandreou, G.; Kokkinos, I.; Murphy, K.; Yuille, A.L. DeepLab: Semantic image segmentation with deep convolutional nets, atrous convolution, and fully connected CRFs. IEEE Trans. Pattern Anal. Mach. Intell. 2017, 40, 834–848. [Google Scholar] [CrossRef] [PubMed]
  2. Chen, L.C.; Papandreou, G.; Schroff, F.; Adam, H. Rethinking atrous convolution for semantic image segmentation. arXiv 2017, arXiv:1706.05587. [Google Scholar]
  3. Ullah, I.; Jian, M.; Hussain, S.; Lian, L.; Ali, Z.; Qureshi, I.; Guo, J.; Yin, Y. Global context-aware multi-scale features aggregative network for salient object detection. Neurocomputing 2021, 455, 139–153. [Google Scholar] [CrossRef]
  4. Lin, C.-Y.; Chiu, Y.-C.; Ng, H.-F.; Shih, T.K.; Lin, K.-H. Global-and-Local Context Network for Semantic Segmentation of Street View Images. Sensors 2020, 20, 2907. [Google Scholar] [CrossRef] [PubMed]
  5. Li, Y.; Ouyang, S.; Zhang, Y. Combining deep learning and ontology reasoning for remote sensing image semantic segmentation. Knowl.-Based Syst. 2022, 243, 108469. [Google Scholar] [CrossRef]
  6. Liu, R.; Mi, L.; Chen, Z. AFNet: Adaptive Fusion Network for Remote Sensing Image Semantic Segmentation. IEEE Trans. Geosci. Remote Sens. 2021, 59, 7871–7886. [Google Scholar] [CrossRef]
  7. Wang, K.; Xu, C.; Li, G.; Zhang, Y.; Zheng, Y.; Sun, C. Combining convolutional neural networks and self-attention for fundus diseases identification. Sci. Rep. 2023, 13, 76. [Google Scholar] [CrossRef]
  8. Zheng, S.; Lu, J.; Zhao, H.; Zhu, X.; Luo, Z.; Wang, Y.; Fu, Y.; Feng, J.; Xiang, T.; Torr, P.H.; et al. Rethinking semantic segmentation from a sequence-to-sequence perspective with transformers. In Proceedings of the IEEE/CVF Conference on Computer Vision and Pattern Recognition, Nashville, TN, USA, 20–25 June 2021; pp. 6877–6886. [Google Scholar]
  9. Gao, H.; Liu, H.; Yang, M.; Chen, L.; Wan, Y.; Xiao, Z.; Qian, Y. STransFuse: Fusing SWIN Transformer and Convolutional Neural Network for Remote Sensing Image Semantic Segmentation. IEEE J. Sel. Top. Appl. Earth Obs. Remote Sens. 2021, 14, 10990–11003. [Google Scholar] [CrossRef]
  10. He, X.; Zhou, Y.; Zhao, J.; Zhang, D.; Yao, R.; Xue, Y. Swin Transformer Embedding Unet for Remote Sensing Image Semantic Segmentation. IEEE Trans. Geosci. Remote Sens. 2022, 60, 4408715. [Google Scholar] [CrossRef]
  11. Li, Y.; Shi, T.; Zhang, Y.; Chen, W.; Wang, Z.; Li, H. Learning deep semantic segmentation network under multiple weakly-supervised constraints for cross-domain remote sensing image semantic segmentation. ISPRS J. Photogramm. Remote Sens. 2021, 175, 20–33. [Google Scholar] [CrossRef]
  12. Xiao, T.; Liu, Y.; Huang, Y.; Li, M.; Yang, G. Enhancing Multiscale Representations With Transformer for Remote Sensing Image Semantic Segmentation. IEEE Trans. Geosci. Remote Sens. 2023, 61, 5605116. [Google Scholar] [CrossRef]
  13. Wei, X.; Zhou, X. FLDNet: A Foreground-Aware Network for Polyp Segmentation Leveraging Long-Distance Dependencies. In International Conference on Neural Information Processing; Springer Nature Singapore: Singapore, 2023; pp. 477–487. [Google Scholar]
  14. Song, P.; Li, J.; An, Z.; Fan, H.; Fan, L. CTMFNet: CNN and Transformer Multiscale Fusion Network of Remote Sensing Urban Scene Imagery. IEEE Trans. Geosci. Remote Sens. 2022, 61, 5900314. [Google Scholar] [CrossRef]
  15. Bai, L.; Du, S.; Zhang, X.; Wang, H.; Liu, B.; Ouyang, S. Domain Adaptation for Remote Sensing Image Semantic Segmentation: An Integrated Approach of Contrastive Learning and Adversarial Learning. IEEE Trans. Geosci. Remote Sens. 2022, 60, 5628313. [Google Scholar] [CrossRef]
  16. Ni, H.; Liu, Q.; Guan, H.; Tang, H.; Chanussot, J. Category-Level Assignment for Cross-Domain Semantic Segmentation in Remote Sensing Images. IEEE Trans. Geosci. Remote Sens. 2023, 61, 5608416. [Google Scholar] [CrossRef]
  17. Mo, Y.; Li, H.; Xiao, X.; Zhao, H.; Liu, X.; Zhan, J. Swin-Conv-Dspp and Global Local Transformer for Remote Sensing Image Semantic Segmentation. IEEE J. Sel. Top. Appl. Earth Obs. Remote Sens. 2023, 16, 5284–5296. [Google Scholar] [CrossRef]
  18. Yin, P.; Zhang, D.; Han, W.; Li, J.; Cheng, J. High-Resolution Remote Sensing Image Semantic Segmentation via Multiscale Context and Linear Self-Attention. IEEE J. Sel. Top. Appl. Earth Obs. Remote Sens. 2022, 15, 9174–9185. [Google Scholar] [CrossRef]
  19. Vaswani, A.; Shazeer, N.; Parmar, N.; Uszkoreit, J.; Jones, L.; Gomez, A.N.; Kaiser, L.; Polosukhin, I. Attention is all you need. Advances in neural information processing systems. Adv. Neural Inf. Process. Syst. 2017, 30, 5998–6008. [Google Scholar]
  20. Li, Y.; Yi, Z.; Wang, Y.; Zhang, L. Adaptive Context Transformer for Semisupervised Remote Sensing Image Segmentation. IEEE Trans. Geosci. Remote Sens. 2023, 61, 5621714. [Google Scholar] [CrossRef]
  21. Ma, J.; Tang, L.; Fan, F.; Huang, J.; Mei, X.; Ma, Y. SwinFusion: Cross-domain Long-range Learning for General Image Fusion via Swin Transformer. IEEE/CAA J. Autom. Sin. 2022, 9, 1200–1217. [Google Scholar] [CrossRef]
  22. Stewart, E.E.M.; Valsecchi, M.; Schütz, A.C. A review of interactions between peripheral and foveal vision. J. Vis. 2020, 20, 2. [Google Scholar] [CrossRef]
  23. McDowell, J.E.; Dyckman, K.A.; Austin, B.P.; Clementz, B.A. Neurophysiology and neuroanatomy of reflexive and volitional saccades: Evidence from studies of humans. Brain Cogn. 2008, 68, 255–270. [Google Scholar] [CrossRef]
  24. Jonnalagadda, A.; Wang, W.Y.; Manjunath, B.S.; Eckstein, M.P. Foveater: Foveated transformer for image classification. arXiv 2021, arXiv:2105.14173. [Google Scholar]
  25. Shi, Y.; Sun, M.; Wang, Y.; Wang, R.; Sun, H.; Chen, Z. EViT: An Eagle Vision Transformer with Bi-Fovea Self-Attention. arXiv 2023, arXiv:2310.06629. [Google Scholar]
  26. Shi, D. TransNeXt: Robust Foveal Visual Perception for Vision Transformers. arXiv 2023, arXiv:2311.17132. [Google Scholar]
  27. Pritchard, R.M. Stabilized Images on the Retina. Sci. Am. 1961, 204, 72–79. [Google Scholar] [CrossRef] [PubMed]
  28. Yan, L.; Fan, B.; Liu, H.; Huo, C.; Xiang, S.; Pan, C. Triplet adversarial domain adaptation for pixel-level classification of VHR remote sensing images. IEEE Trans. Geosci. Remote Sens. 2019, 58, 3558–3573. [Google Scholar] [CrossRef]
  29. Saito, K.; Watanabe, K.; Ushiku, Y.; Harada, T. Maximum classifier discrepancy for unsupervised domain adaptation. In Proceedings of the IEEE Conference on Computer Vision and Pattern Recognition, Salt Lake City, UT, USA, 18–22 June 2018; pp. 3723–3732. [Google Scholar]
  30. Zhao, Y.; Guo, P.; Sun, Z.; Chen, X.; Gao, H. ResiDualGAN: Resize-Residual DualGAN for Cross-Domain Remote Sensing Images Semantic Segmentation. Remote Sens. 2023, 15, 1428. [Google Scholar] [CrossRef]
  31. Hoyer, L.; Dai, D.; Gool, L.V. Daformer: Improving network architectures and training strategies for domain-adaptive semantic segmentation. In Proceedings of the IEEE Conference on Computer Vision and Pattern Recognition, New Orleans, LA, USA, 19–24 June 2022; pp. 9914–9925. [Google Scholar]
  32. Cao, H.; Wang, Y.; Chen, J.; Jiang, D.; Zhang, X.; Tian, Q.; Wang, M. Swin-Unet: Unet-like pure transformer for medical image segmentation. In European Conference on Computer Vision; Springer Nature Switzerland: Cham, Switzerland, 2022; pp. 205–218. [Google Scholar]
  33. Zhang, B.; Liu, L.; Phan, M.H.; Tian, Z.; Shen, C.; Liu, Y. SegViT v2: Exploring Efficient and Continual Semantic Segmentation with Plain Vision Transformers. Int. J. Comput. Vis. 2024, 132, 1126–1147. [Google Scholar] [CrossRef]
Figure 1. Illustration of the global and local context information. The yellow arrows in the diagram represent global context information, the blue arrows represent local context information.
Remotesensing 16 01514 g001
Figure 2. An overview of the GSV-Trans.
Remotesensing 16 01514 g002
Figure 3. Illustration of the gaze and saccade blocks. The gaze block generates affinity maps using a self-attention map and an inter-layer short-term visual memory module (ISVM). Similarly, the saccade block generates affinity maps using adaptive eye movement attention (AEMA) and ISVM. (a) is the process of attention extraction by two gaze blocks through ISVM. (b) is the process of attention extraction by two saccade blocks through ISVM.
Remotesensing 16 01514 g003
Figure 4. Illustration of the semantic segmentation network in GSV-Trans. The visual center propagates horizontally, while the affinity propagates vertically. Effective acquisition of global semantic information is achieved through the propagation of visual center and affinity maps. The illustrated network is used to output predicted semantic segmentation results.
Remotesensing 16 01514 g004
Figure 5. The division comprises the foveal area and peripheral vision, denoted as LU, RU, LL, and LR, representing the left upper, right upper, left lower, and lower right areas of the image, respectively. (a) divides the feature map into four regions: LU, RU, LL, and LR. The foveal area is denoted as area A, while areas B and C represent the peripheral regions. When the visual center is located in the LU region, the calculation of EMA is denoted as EMA-LU. The division of the central area and peripheral regions is shown in (b). When the visual center is in the LL region, EMA calculation is denoted as EMA-LL, and the division of the central area and peripheral regions is shown in (c). When the visual center is in the LR region, EMA calculation is denoted as EMA-LU, and the division of the central area and peripheral regions is shown in (d). When the visual center is in the RU region, EMA calculation is denoted as EMA-RU, and the division of the central area and peripheral regions is shown in (e). (f) illustrates the division of central area and peripheral regions for gaze attention. In gaze attention, the peripheral regions consist of B1, B2, C1, and C2, while the central area is denoted as A.
Remotesensing 16 01514 g005
Figure 6. Illustration of the visual perception attention. The gaze block and saccade block are collectively referred to as TransBlock. The red square positioned at the center of the affinity map represents the visual center of the attention map. The affinity map passes the visual center to the visual perception module and determines whether to calculate GA or EMA visual perception attention based on image complexity.
Remotesensing 16 01514 g006
Figure 7. Illustration of the visual perception propagation. (a) is the illustration of the EM attention. (b) is the illustration of the affinity propagation.
Remotesensing 16 01514 g007
Figure 8. Illustration of the dual-branch pseudo-label. The solid arrows represent the data flow transmission path. The dashed arrows represent branch data flow. During the computation process, the branch data flow passes through each module of both the Gaze Branch and the Saccade Branch separately. The ellipsis indicates that the branch data flow passes through the affinity map output of each block.
Remotesensing 16 01514 g008
Figure 9. Visualization comparisons from Potsdam to Vaihingen.
Remotesensing 16 01514 g009
Figure 10. Comparing the segmentation results of CIA-UDA and ResiDualGAN from Potsdam-IRRG to Vaihingen. Figures (a), (b), (c), (d) and (e) respectively represent the results of semantic segmentation of 5 different target domain images through different algorithms.
Remotesensing 16 01514 g010
Figure 11. Visualization comparisons from Vaihingen to Potsdam-IRRG.
Remotesensing 16 01514 g011
Figure 12. Comparing the segmentation results of TriADA and DAFormer from Vaihingen to Potsdam-IRRG. Figure (a), (b), (c), (d) and (e) respectively represent the results of semantic segmentation of 5 different target domain images through different algorithms.
Remotesensing 16 01514 g012
Figure 13. Affinity Map of GSV-Trans. (ac) depict visualizations of the affinity map from Vaihingen to Potsdam. (d) illustrates the visualization of the affinity map from Potsdam to Vaihingen. The red color indicates a high value, while the blue color indicates a low value.
Remotesensing 16 01514 g013
Figure 14. Confusion matrix of GSV-Trans: (a) represents the Confusion matrix from Vaihingen to Potsdam-IRRG, while (b) represents the Confusion matrix from Potsdam-IRRG to Vaihingen.
Remotesensing 16 01514 g014
Table 1. Ablation comparison experiments from Potsdam-IRRG to Vaihingen (%). “GB” and “SB” indicate the gaze branch and the saccade branch. “ISVM” indicates the inter-layer short-term visual memory module. “AEMA” indicates the adaptive eye movement attention. “DBPL” indicates the dual-branch pseudo-label.
GBSBISVMAEMADBPLmIoUmF1
49.262.6
52.164.6
53.666.8
53.867.1
54.567.5
54.968.3
55.169.6
Table 2. The segmentation comparison results (%) of the mIoU and mF1 of the cross-domain semantic segmentation task from Potsdam-IRRG to Vaihingen.
MethodCarBuildingTreeLow VegSurfaceAvg
IoUF1IoUF1IoUF1IoUF1IoUF1mIoUmF1
Baseline7.224.542.151.435.650.123.146.126.833.226.941.1
MCD16.734.656.169.646.268.130.349.457.872.341.458.8
TriADA26.540.373.580.954.070.238.459.164.677.851.466.0
ResiDualGAN28.142.873.580.554.271.740.757.264.176.552.165.6
CIA-UDA28.544.072.978.253.870.839.558.265.877.252.365.7
DAFormer28.744.573.180.754.171.239.858.663.576.051.866.2
SWIN-Unet28.143.171.080.253.070.036.157.664.277.350.465.6
SegVitv228.945.374.583.656.272..437.158.066.278.952.666.5
GSV-Trans30.147.175.185.857.973.443.760.967.580.655.169.6
Table 3. Ablation comparison experiments from Vaihingen to Potsdam-IRRG (%). “GB” and “SB” indicate the gaze branch and the saccade branch. “ISVM” indicates the inter-layer short-term visual memory module. “AEMA” indicates the adaptive eye movement attention. “DBPL” indicates the dual-branch pseudo-label.
GBSBISVMAEMADBPLmIoUmF1
55.173.1
57.174.6
59.275.7
62.476.1
63.577.3
63.777.9
64.578.1
Table 4. The segmentation comparison results (%) of the mIoU and mF1 of the cross-domain semantic segmentation task from Vaihingen to Potsdam-IRRG.
MethodCarBuildingTreeLow VegSurfaceAvg
IoUF1IoUF1IoUF1IoUF1IoUF1mIoUmF1
Baseline40.152.544.353.120.944.629.546.240.860.235.151.3
MCD41.455.142.850.335.656.243.758.253.766.743.457.7
TriADA59.969.171.581.248.666.857.972.168.381.961.274.2
ResiDualGAN58.768.572.982.946.965.153.267.961.777.158.772.3
CIA-UDA57.567.671.382.847.666.255.368.065.178.559.472.6
DAFormer58.669.971.282.547.466.356.669.967.181.760.274.1
SWIN-Unet57.170.670.681.346.064.853.667.863.278.158.172.5
SegVitv260.175.173.984.650.167.258.973.870.582.462.776.6
GSV-Tran62.276.775.285.852.568.960.075.072.684.164.578.1
Table 5. The segmentation comparison results (%) of the mIoU and mF1 of the cross-domain semantic segmentation task.
Source DomainTarget DomainAvg
IoUF1
VaihingenPotsdam-RGB65.279.6
Potsdam-RGBVaihingen56.870.2
Potsdam-IRRGVaihingen55.169.6
VaihingenPotsdam-IRRG64.578.1
Disclaimer/Publisher’s Note: The statements, opinions and data contained in all publications are solely those of the individual author(s) and contributor(s) and not of MDPI and/or the editor(s). MDPI and/or the editor(s) disclaim responsibility for any injury to people or property resulting from any ideas, methods, instructions or products referred to in the content.

