
Study on Pyrolysis Characteristics of Phosphate Tailings under H2O Atmosphere
1
College of Chemistry and Chemical Engineering, Guizhou University, Guiyang 550025, China
2
Guizhou Key Laboratory for Green Chemical and Clean Energy Technology, Guiyang 550025, China
3
College of Chemical Engineering, Guizhou Minzu University, Guiyang 550025, China
4
Guizhou Provincial Engineering Research Center of Efficient Utilization for Waster, Guiyang 550025, China
*
Author to whom correspondence should be addressed.
Materials 2024, 17(9), 2012; https://0-doi-org.brum.beds.ac.uk/10.3390/ma17092012
Submission received: 11 March 2024
/
Revised: 21 April 2024
/
Accepted: 22 April 2024
/
Published: 25 April 2024
Abstract
:The pyrolysis separation of calcium and magnesium from phosphate tailings is an important process due to its high-value resource utilization. In this paper, aiming to address the problems of high energy consumption, a slow decomposition rate and the low activity of decomposition products in the high-temperature pyrolysis of phosphate tailings, the medium-temperature pyrolysis of phosphate tailings under a H2O atmosphere was carried out, and the phase reconstruction and activation of pyrolysis process were discussed. The results showed that compared with N2, air and CO2 atmospheres, the pyrolysis process of phosphate tailings in a H2O atmosphere was changed from two stages to one stage, the starting decomposition temperature was reduced to 500 °C and the decomposition time was shortened to 30 min. The order of the influence of each factor on the pyrolysis of phosphate tailings was temperature > H2O pressure > holding time. Under the optimized pyrolysis conditions, the yield of CaMg(CO3)2 decomposition of phosphate tailings into MgO and CaO was 97.3% and 98.1%, respectively, and the reactivity of MgO was 31.6%. The distribution of Ca and Mg elements in the phosphate tailings after pyrolysis showed a negative correlation, and both of them no longer formed associated compounds; Ca mainly existed in the form of Ca(OH)2, Ca5(PO4)3F, CaSiO3 and CaF2, and Mg mainly existed in the form of MgO, MgF2 and Mg(OH)2.
1. Introduction
The phosphate rock resources in China are abundant but not rich. More than 90.8% of them are medium and low-grade dolomite collophane with a P2O5 content less than 30% [1,2]. It must be enriched by economic and effective beneficiation to meet the requirements of phosphate ore for wet processing [3]. Phosphate ore flotation will produce a large amount of phosphate tailings. It is reported that for every 1t of phosphate concentrate produced, 0.44t of phosphate tailings will be generated [4]. At present, the utilization of phosphate tailings is mainly focused on pit filling [5], phosphate tailings re-election [6], construction material preparation [7,8], fertilizer production and other uses, with an overall utilization rate of less than 10% [9]. A large number of phosphate tailings are still being processed by stockpiling, resulting in a waste of resources and jeopardizing the safety of the ecological environment [10]. Hence, carrying out basic research to comprehensively utilize and develop phosphate tailings is of great value in accelerating the rational disposal and resource utilization of phosphate tailings, and is also an urgent need to support the sustainable development of the fertilizer industry, chemical industry and even the national economy.
The main mineral composition of phosphate tailings in the Weng’an area of Guizhou Province is dolomite, which accounts for about 80% of the total phosphate tailings [11], and the content of magnesium oxide in the phosphate tailings is 17–20%, which belongs to high-magnesium phosphate tailings [12,13]. The separation and extraction of magnesium from high-magnesium phosphate tailings as a raw material for magnesium series products are a vital way to utilize phosphate tailings with high-value resources. Currently, the methods of magnesium extraction from phosphate tailings are divided into dry and wet methods. The dry method is mainly calcination–carbonization [14], calcination–leaching [15] and the ammonia cycle method [16]; the wet method includes extraction–reverse extraction, nitric acid magnesium removal and so on. The wet process usually uses nitric acid, sulfuric acid and other acidic reagents for the acid leaching of phosphate tailings [17,18,19]; phosphate tailings containing calcium, magnesium, iron and other elements are dissolved at the same time, resulting in subsequent magnesium separation and extraction difficulties, as there will be new solid waste (such as gypsum, etc.) [20], meaning the process is complex. The dry method involves calcining the phosphate tailings at a high temperature first, so that the dolomite in the phosphate tailings decomposes to generate calcium oxide and magnesium oxide, and then separating and extracting calcium and magnesium through digestion, carbonization, ammonium leaching [21], etc. The process route of this method is relatively simple and highly feasible. Nevertheless, the pain point of the dry process is the high energy consumption of the phosphate tailing pyrolysis process as well as the difficulties in the control of the physical phase and physical properties of the product. With a low calcination temperature, the energy provided cannot meet the needs of C-O bond breaking in dolomite; therefore, dolomite decomposition is not complete, and the rate of the pyrolysis reaction is slower [22]. When the temperature is too high, the energy consumption is high, and at the same time, excessive sintering will lead to a decrease in the reactivity of the pyrolysis products [23], affecting the regulation of digestion, carbonization and other subsequent processes.
The pyrolysis atmosphere has a large influence on the decomposition of carbonates. The thermal decomposition of dolomite in air is divided into two stages [24]; the first stage is the decomposition of dolomite into CaCO3 and MgO and the release of CO2, and the second stage is the further decomposition of CaCO3 into CaO and CO2. The decomposition temperatures of the two stages are close to each other, with a small difference in temperature, and there are even signs of overlap in the mid-temperature stage. However, under a CO2 atmosphere, the decomposition of CaCO3 and CaO carbonization in the second stage are reversible reactions [25], while the decomposition of dolomite to CaCO3 and MgO in the first stage is an irreversible reaction. Therefore, increasing the partial pressure of CO2 can inhibit the decomposition of CaCO3 and increase the temperature difference between the two phases of decomposition [26]; so, medium-temperature pyrolysis of dolomite under this atmosphere can initially achieve the phase separation of calcium and magnesium. The results of the previous study of our group show that the calcination of phosphate tailings under a CO2 atmosphere to achieve the decomposition of dolomite into CaCO3 and MgO is feasible, but the required CO2 partial pressure is higher and the reaction time is longer. In addition, later on, when water leaching follows carbonization in the separation process of magnesium and calcium, a part of the CaCO3 is prone to enter the liquid phase to form a Ca(HCO3)2 solution, which leads to the incomplete separation of calcium and magnesium.
It has been shown that water vapor has an accelerating effect on the decomposition of carbonate minerals [27,28,29,30]. Shuai Guo investigated the calcination of limestone in a water vapor atmosphere. The results showed that the presence of water vapor increased the reaction rate and shortened the reaction time, which was caused by the adsorption of H2O on the active site of Ca-O* and the formation of hydrogen bonds through the intermolecular interactions of H2O [31]. Guido Giammaria studied the effect of water vapor on the decomposition of calcium carbonate. The results showed that the decomposition rate was accelerated fourfold when 1.25% steam concentration was introduced. The apparent activation energy decreased from 201 kJ/mol to 140 kJ/mol, which was caused by the formation of HCO3− on the surface of carbonate due to water molecules and the decomposition of HCO3− into OH− [32]. Taiga Tone studied the effect of water vapor on the thermal decomposition of five different kinds of calcium carbonate. The results showed that there was an acceleration effect. The mineral aragonite was the most sensitive to water vapor. With the increase in water vapor pressure, the reaction temperature decreased significantly [33]. The generalized kinetic process of the thermal decomposition of calcium carbonate at different temperatures and the values of p(H2O) were investigated by introducing the adjusting function (AF) of p(H2O), and some meaningful results were obtained. Comparing the above analysis, it was found that the binding force of O* and H2O in CO3 is stronger than that of CO2 [34]. This makes the adsorption rate of dolomite by H2O faster and more significant compared to CO2 [35]. Therefore, H2O can accelerate the release rate of CO2 during the thermal decomposition of dolomite by replacing CO2.
Based on the above analysis, and in view of the problems of high energy consumption, a slow decomposition rate and the low activity of decomposition products in the high-temperature decomposition of phosphate tailings in the current dry process, the medium-temperature pyrolysis of phosphate tailings under a H2O atmosphere was studied in this paper. The influencing factors, phase reconstruction and phase activation of the pyrolysis process were discussed in order to achieve the controllable decomposition and activity regulation of the pyrolysis process of phosphate tailings, and to provide support for the subsequent separation and high-value utilization of calcium and magnesium in phosphate tailings.
2. Experimental Materials and Methods
2.1. Materials
Phosphate tailings were taken from Guizhou Chuanheng Co. (Fuquan, China) The main chemical composition and physical phase analysis of the raw materials are shown in Table 1 and Figure 1, respectively. The raw materials were dried at 80 °C for 24 h, mixed and prepared for use after grinding to a particle size of less than 300 mesh.
2.2. Experimental Procedure
Figure 2 shows the process flow diagram of the phosphate tailing pyrolysis experiment. The phosphate tailings were pyrolyzed in a high-temperature tubular furnace using a corundum crucible device. The pyrolysis conditions were as follows: steam pressure 0.00–0.04 MPa, heating rate 5–20 K/min, pyrolysis temperature 600–800 °C and holding time 30–120 min. The pyrolyzed phosphate tailings were cooled to room temperature to test their phase composition and phase activity.
2.3. Determination of Properties of Pyrolysis Phosphate Tailings
2.3.1. Decomposition Rate of CaMg(CO3)2 in Phosphate Tailings
The pyrolyzed phosphate tailings treated under different conditions were reacted with ammonium chloride, then filtered and washed. The concentration of Ca2+ and Mg2+ in the filtrate was detected by flame furnace atomic absorption spectrometry. The measured concentration of Ca2+ and Mg2+ was converted into the mass of CaO and MgO. Based on the mass of CaO and MgO in the pyrolyzed phosphate tailings treated at 1200 °C, the yield of CaMg(CO3)2 decomposed into CaO and MgO in phosphate tailings under different experimental conditions was calculated according to Formulas (1) and (2):
where ω(CaO) and ω(MgO) represent the yield of CaMg(CO3)2 decomposition to CaO and MgO, %; mCaO and mMgO are the mass of CaO and MgO leached from the pyrolyzed phosphate tailings under experimental conditions, g; m1200CaO and m1200MgO are the mass of CaO and MgO leached from the pyrolyzed phosphate tailings at 1200 °C, g.
2.3.2. Detection of MgO Activity in Pyrolyzed Phosphate Tailings
According to the standard YB/T 4019-2006 [36], 2.00 g of pyrolyzed phosphate tailings was weighed in a glass weighing bottle, 20 mL of deionized water was added, the lid was covered and a slight gap was left. Hydration was carried out at constant temperature and humidity (temperature 20 °C ± 2 °C; relative humidity 75 ± 5%) for 24 h. The weighing bottle containing the sample was placed in a drying oven, and the sample was dried until it was nearly dry at (105 ± 5) °C, and then the temperature was raised to (150 ± 5) °C until it was completely dry (to a constant amount). The quantity of the samples before and after the hydration test was weighed. The calculation of MgO activity was performed by using Equation (3):
In Equation (3), ω1 is the mass of the test material, g; ω2 is the mass of the test material after hydration, g; 0.45 is the coefficient of the increase in the mass of activated magnesium oxide converted to magnesium oxide after hydration.
2.4. Sample Characterization Methods
The pyrolysis characteristics of the phosphate tailings were analyzed using the thermal analyzer NETZSCH STA 449F3 from NETZSCH, Selb, Germany. The test conditions were as follows: phosphate tailings sample mass of 33.50 mg, a temperature range of room temperature—900 °C, a heating rate of 10 K/min, the carrier gas was nitrogen and water vapor, a water vapor flow rate of 7.5 g/h and a N2 flow rate of 170 mL/min.
The products were detected by an X-ray diffractometer with the following conditions: a Cu-Kα target as the ray source, a tube current and tube voltage of 40 mA and 40 KV, respectively, a swept range of 5–90° and a scanning speed of 2 °•min−1. Finally, the data were analyzed by MDI jade 6 software. Quantitative physical phase analysis of the pyrolytic phosphate tailings was carried out using Rietveld analysis and TOPAS academic software (http://www.topas-academic.net/).
The samples were detected using an X-ray photoelectron spectrometer. The testing conditions were as follows: a power of 200 W, combined with the ability to use C1s (284.8 eV) correction. The results were analyzed using Thermo Avantage v5.9921 software and plotted using the relevant software.
A scanning electron microscope and energy spectrometer (SEM-EDX) were used to analyze the micromorphology and elemental distribution of the samples, and the test conditions were as follows: an acceleration voltage of 0.1–30 kV, an electron beam current of 1–2 nA, a vacuum of the sample of 10−4 Pa, an effective area of the energy spectrometry detector of 50 mm2, and an energy resolution of Mn Kα better than 127 eV.
The elemental correlation and elemental distribution of the pyrolysis phosphate tailings were analyzed by an electron probe microanalyzer (EPMA) under the following conditions: a voltage of 15 kV, a current of 30 nA and a beam spot diameter of 5 μm.
3. Results and Discussion
3.1. Characterization of Phosphate Tailing Pyrolysis under H2O Atmosphere
3.1.1. Thermodynamic Calculations of Pyrolysis Processes
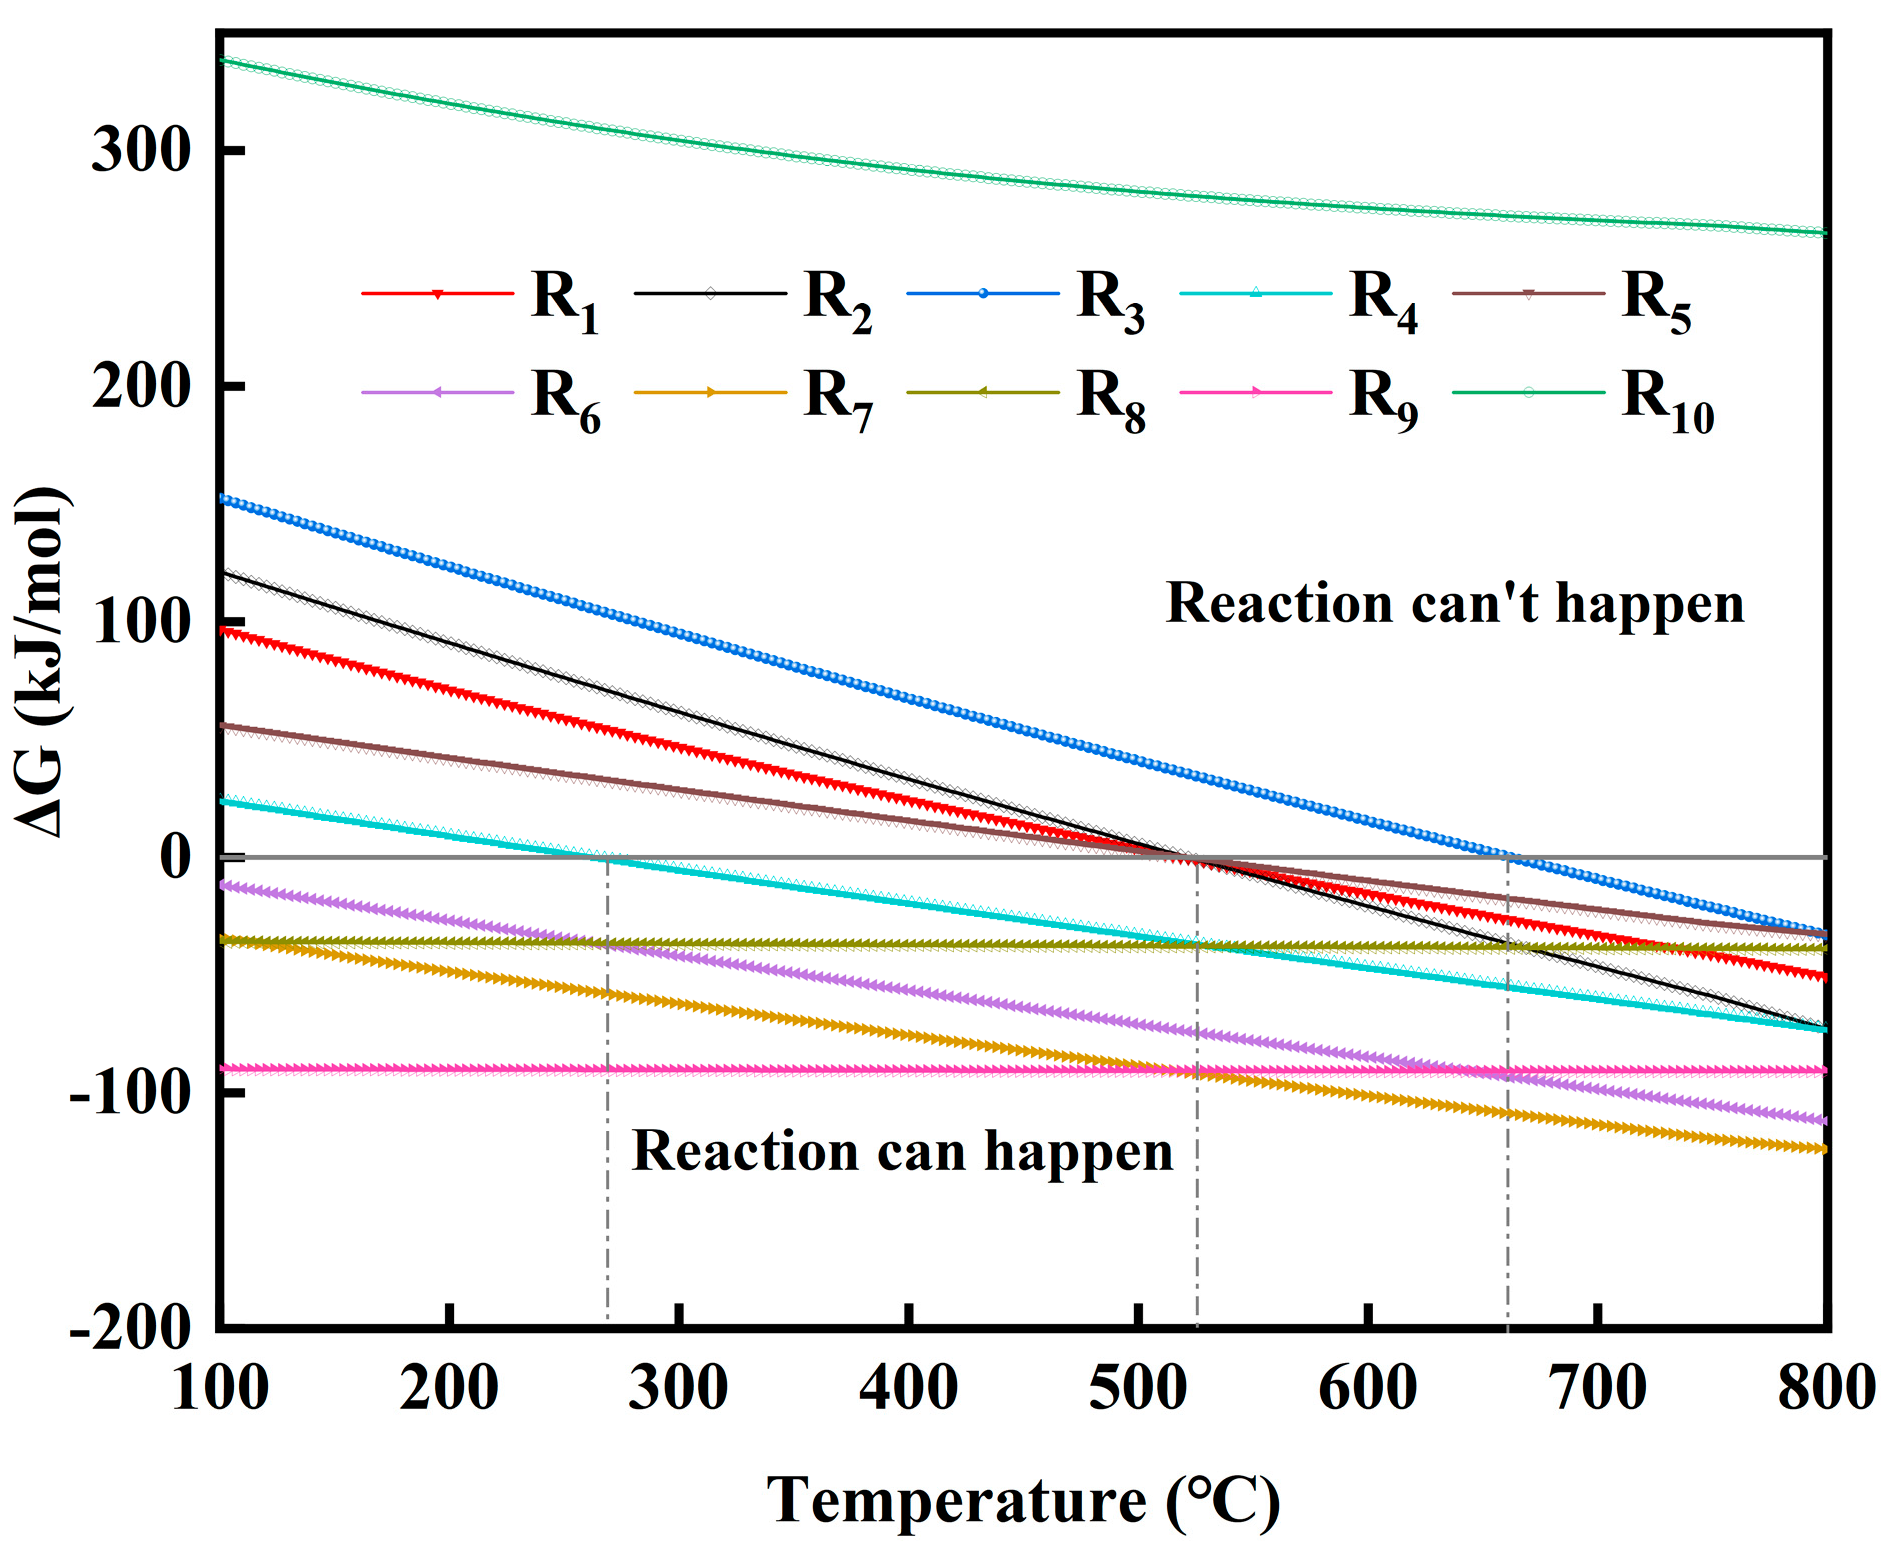
The pyrolysis process of phosphate tailings under a H2O atmosphere includes the pyrolytic separation of dolomite in phosphate tailings, the pyrolytic activation of the vein minerals (the main chemical composition of SiO2) and the interactions between pyrolysis products; the possible reaction equations in the system are shown in Table 2. The thermodynamic calculation of the series of equations was carried out using HSC 6.0 software, and the results are shown in Figure 3.
As can be seen from Figure 3, R1 and R2 can be spontaneous when the temperature is higher than 518 °C, and R3 can be spontaneous when the temperature is higher than 665 °C, indicating that the pyrolysis process of phosphate tailings in a H2O atmosphere is mainly the decomposition of CaMg(CO3)2 under the action of water molecules releasing CO2 to generate Ca(OH)2 and Mg(OH)2. When the temperature is higher than 270 °C and 520 °C, R4 and R5 can be carried out spontaneously, and the Δ G of the reactions decreases with the increase in temperature, which indicates that increasing the temperature is conducive to the strengthening of the intermediate products Ca(OH)2 and Mg(OH)2. R5 needs to take place at higher temperatures, which is favorable to the preservation of the Ca(OH)2 phase in the products. The trends of Δ G values for reactions R6, R7, R8 and R9 show that Ca(OH)2, Mg(OH)2, CaO and MgO will react with SiO2 to form the corresponding silicates, with the most pronounced trend in the formation of calcium silicate. R10 shows that none of the Ca5(PO4)3F reacts with water throughout the entire temperature range.
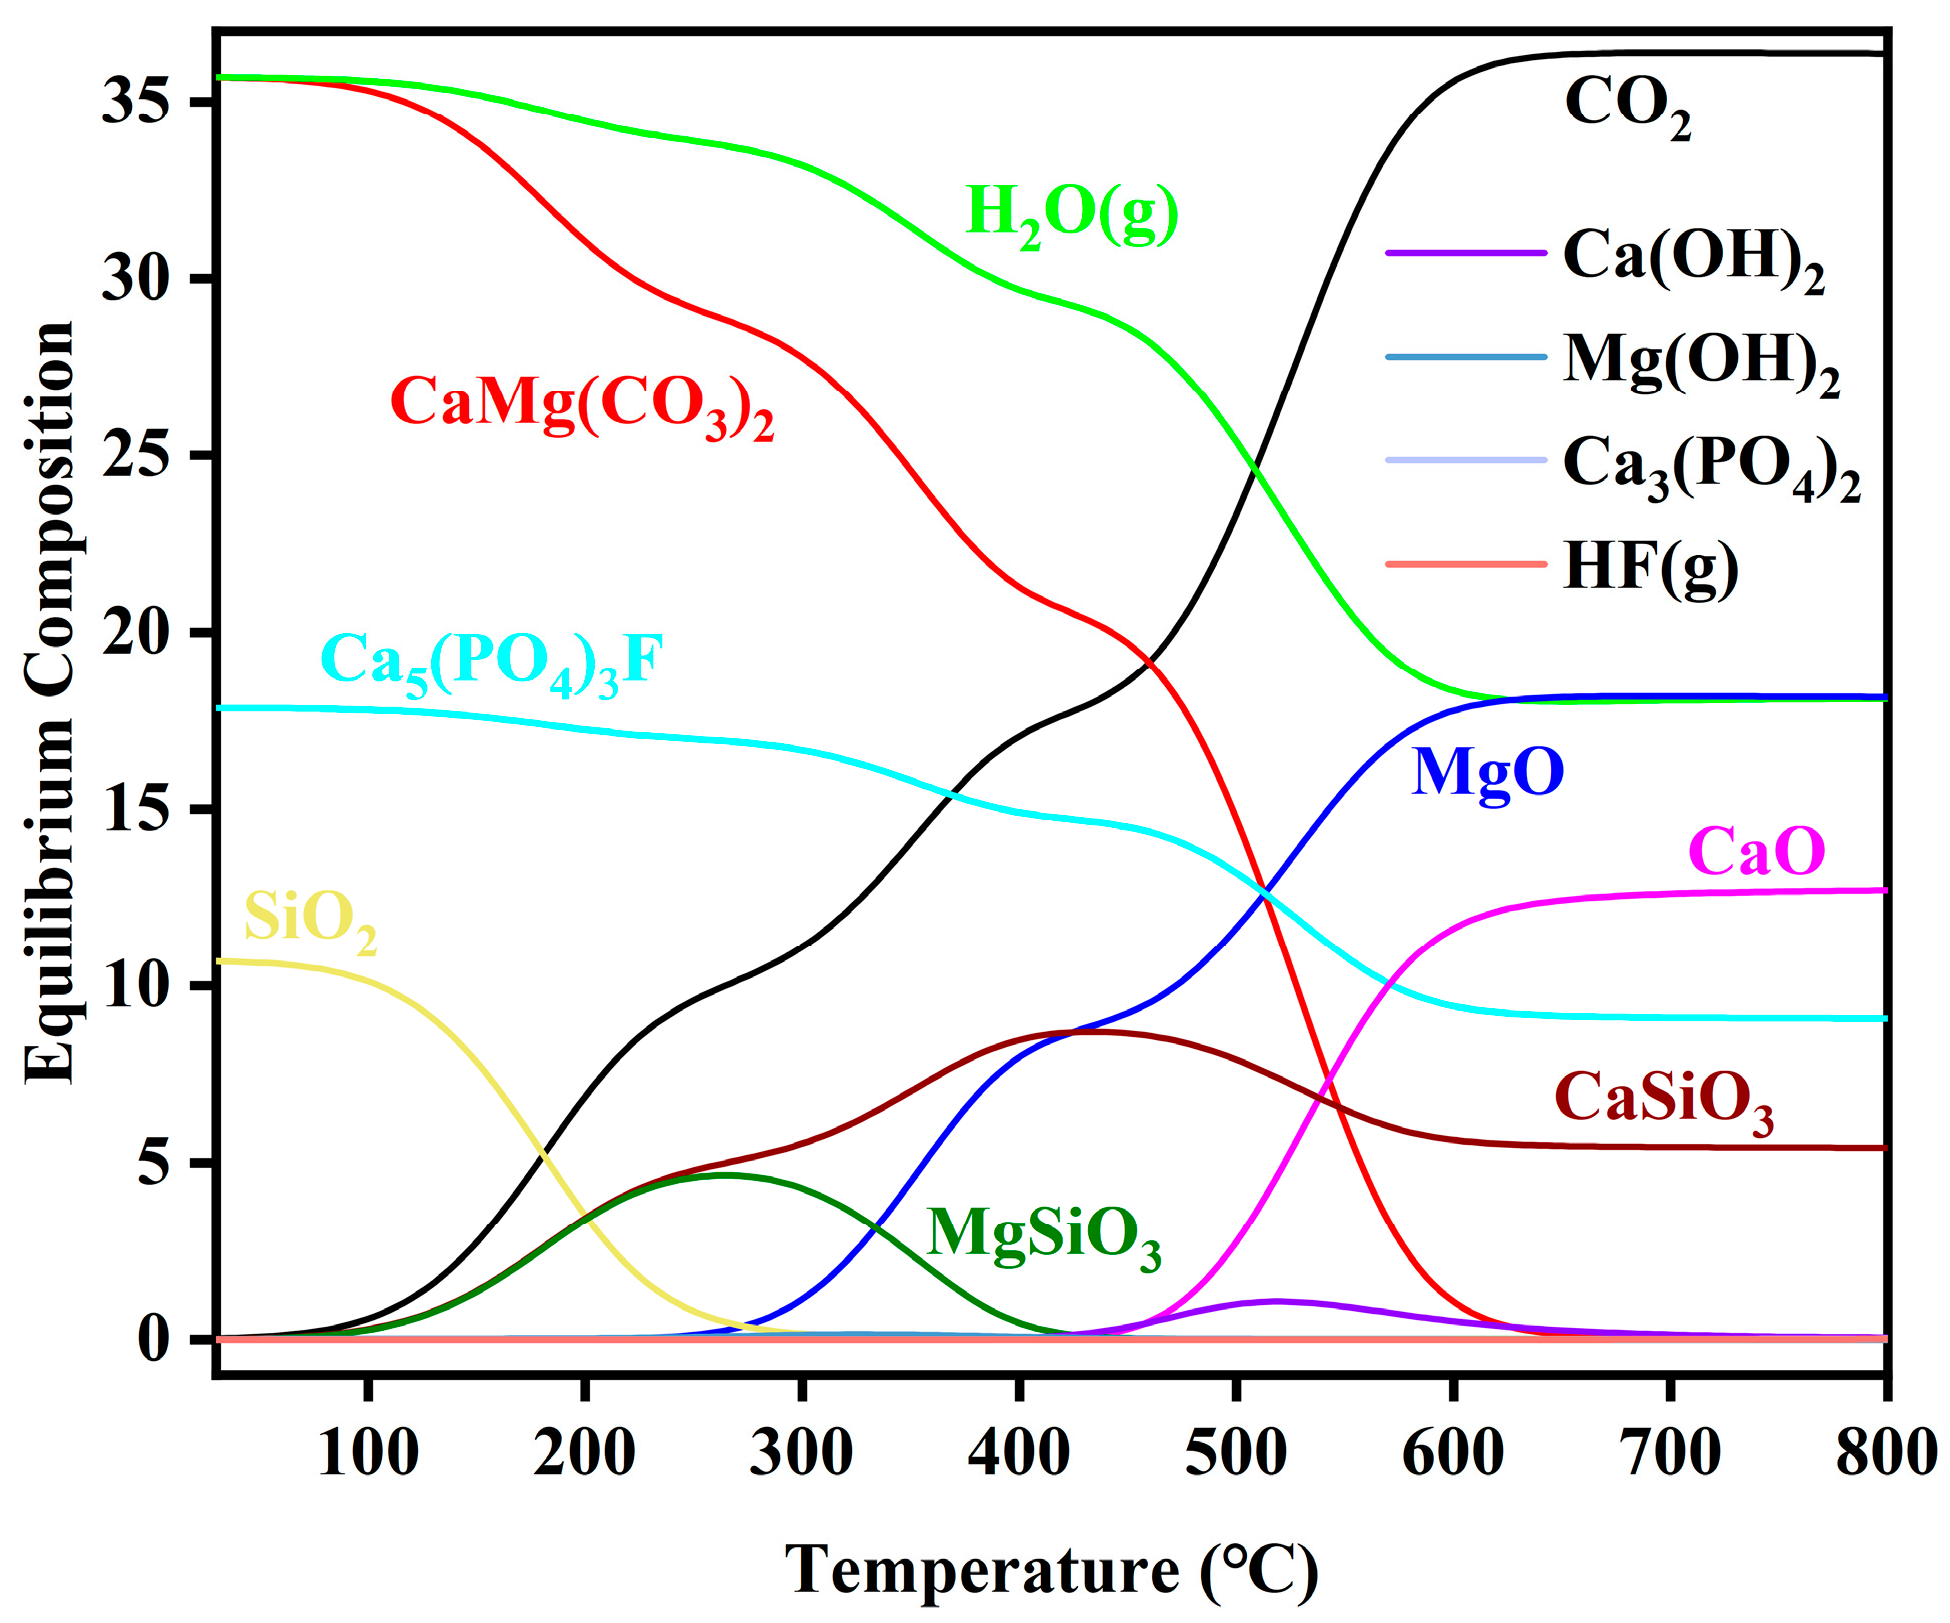
The thermodynamic equilibrium composition of phosphate tailings decomposition versus temperature is shown in Figure 4 (calculated material ratios: 1 kmolCaMg(CO3)2, 1 kmolH2O, 0.5 kmolCa5(PO4)3F and 0.3 kmolSiO2). The decomposition process of phosphate tailings begins with the reaction of CaMg(CO3)2 with H2O(g) to form Ca(OH)2 and Mg(OH)2. Mg(OH)2 and Ca(OH)2 are unstable and have a strong tendency to decompose to form MgO and CaO. In this process, Mg(OH)2 decomposes to MgO and H2O at a faster rate, and Ca(OH)2 is relatively stable and decomposes only at higher temperatures. In addition, SiO2 and the intermediate products Ca(OH)2 and Mg(OH)2 can also react to produce the corresponding silicates. With the increase in temperature, the silicate composition in the system increases first and then decreases. At the same time, with the increase in temperature, MgSiO3 is unstable and decomposes into MgO and SiO2, while CaSiO3 is relatively stable and can be well retained in the system, which is consistent with the subsequent experimental results.
From Figure 4, it can be inferred that the main reactions occurring in the pyrolysis of phosphate tailings under a H2O atmosphere are as follows:
CaMg(CO3)2 + H2O → Mg(OH)2•Ca(OH)2 + CO2
Mg(OH)2•Ca(OH)2 → Mg(OH)2 + Ca(OH)2 + CO2
Mg(OH)2 → MgO +H2O(g)
Ca(OH)2 → CaO +H2O(g)
In the meantime, there are ongoing intermediate reactions:
SiO2 + Ca(OH)2 → CaSiO3 + H2O
SiO2 + Mg(OH)2 → MgSiO3 + H2O
SiO2 + CaO → CaSiO3 + H2O
SiO2 + MgO → MgSiO3 + H2O
3.1.2. TG-DTG Analysis of Phosphate Tailings
The TG/DTG curves of phosphate tailings in different atmospheres are shown in Figure 5. As seen in Figure 5a, the thermal decomposition of phosphate tailings in N2, air and CO2 atmospheres showed a similar trend, with decomposition reactions all starting after 65 min. However, in the H2O atmosphere, there was an obvious weight loss in the sample after 30 min, and the mass tended to be constant after the reaction time exceeded 60 min. As seen in Figure 5b, the decomposition of phosphate tailings under the H2O atmosphere started at about 500 °C, and the weight loss reached the maximum at 730 °C; meanwhile, in N2, air or CO2 atmospheres, the decomposition of the samples started after 730 °C, and the main weight loss peaks were all above 800 °C.
The DTG curves also showed that under N2, air or CO2 atmospheres, the decomposition of phosphate tailings all showed two obvious stages (with two weight loss peaks), and the first stage was mainly the decomposition of CaMg(CO3)2 in phosphate tailings, releasing CO2 to generate MgO and CaCO3. The second stage was the decomposition of CaCO3. However, in the H2O atmosphere, the decomposition of phosphate tailings had only one stage (only one weight loss peak). Combined with the results of the thermodynamic analysis, it can be concluded that this stage was mainly due to the release of CO2 from CaMg(CO3)2 in phosphate tailings under the action of water molecules to generate Ca(OH)2 and MgO, as well as the further decomposition of the intermediate product Ca(OH)2. The above analysis showed that compared with other atmospheres, the pyrolysis of phosphate tailings in the H2O atmosphere was faster, the pyrolysis temperature was lower and the complete pyrolysis time was shorter, which indicates that water vapor had a promoting effect on the pyrolysis of phosphate tailings.
3.2. Effect of Pyrolysis Conditions on Phase Reconstruction and Activity of Phosphate Tailings
3.2.1. Effect of H2O Pressure
Figure 6 shows the XRD diagrams of the phosphate tailings after pyrolysis under different H2O pressures (heating rate of 10 K/min, pyrolysis temperature of 750 °C and holding time of 60 min), from which it can be seen that the mineral composition of phosphate tailings after pyrolysis under a H2O atmosphere underwent a large change. Without H2O, the main phase composition of the sample was MgO and CaCO3, in addition to Ca5(PO4)3F and SiO2; with the H2O atmosphere, the pyrolysis products of the phosphate tailings were mainly MgO and Ca(OH)2, which is attributed to the fact that CaCO3 was produced through the pyrolysis of phosphate tailings combined with H2O to generate Ca(OH)2 and promote the release of CO2. Ca(OH)2 was further decomposed to produce CaO and H2O, and at the same time, the highly active CaO and H2O had a tendency to combine to produce Ca(OH)2 in the reverse direction.
As can be seen in Figure 6, the peaks of Ca(OH)2 and MgO showed a tendency to enhance and then weaken with the increase in H2O pressure. This is explained by the continuous passage of H2O into the system, which adsorbs and dissociates into OH− and H+ on the active sites of CaMg(CO3)2. H+ has a small radius and diffuses more readily to the surface of calcium and magnesium carbonates to form HCO3− [37], resulting in the CO2 therein escaping more readily to the outside [38]. OH− from the dissociation of H2O recombines with Ca2+ and Mg2+ to form Ca(OH)2 and Mg(OH)2, but Mg(OH)2 is extremely unstable and will continue to decompose into MgO. In addition, the peak of Ca5(PO4)3F in the graph remains almost unchanged, which is due to the fact that the pyrolysis conditions at this point in time do not reach the conditions required for its decomposition. It is noteworthy that the peak of SiO2 is significantly weakened, which may be caused by the reaction of SiO2 with the products Ca(OH)2 or CaO to form CaSiO3.
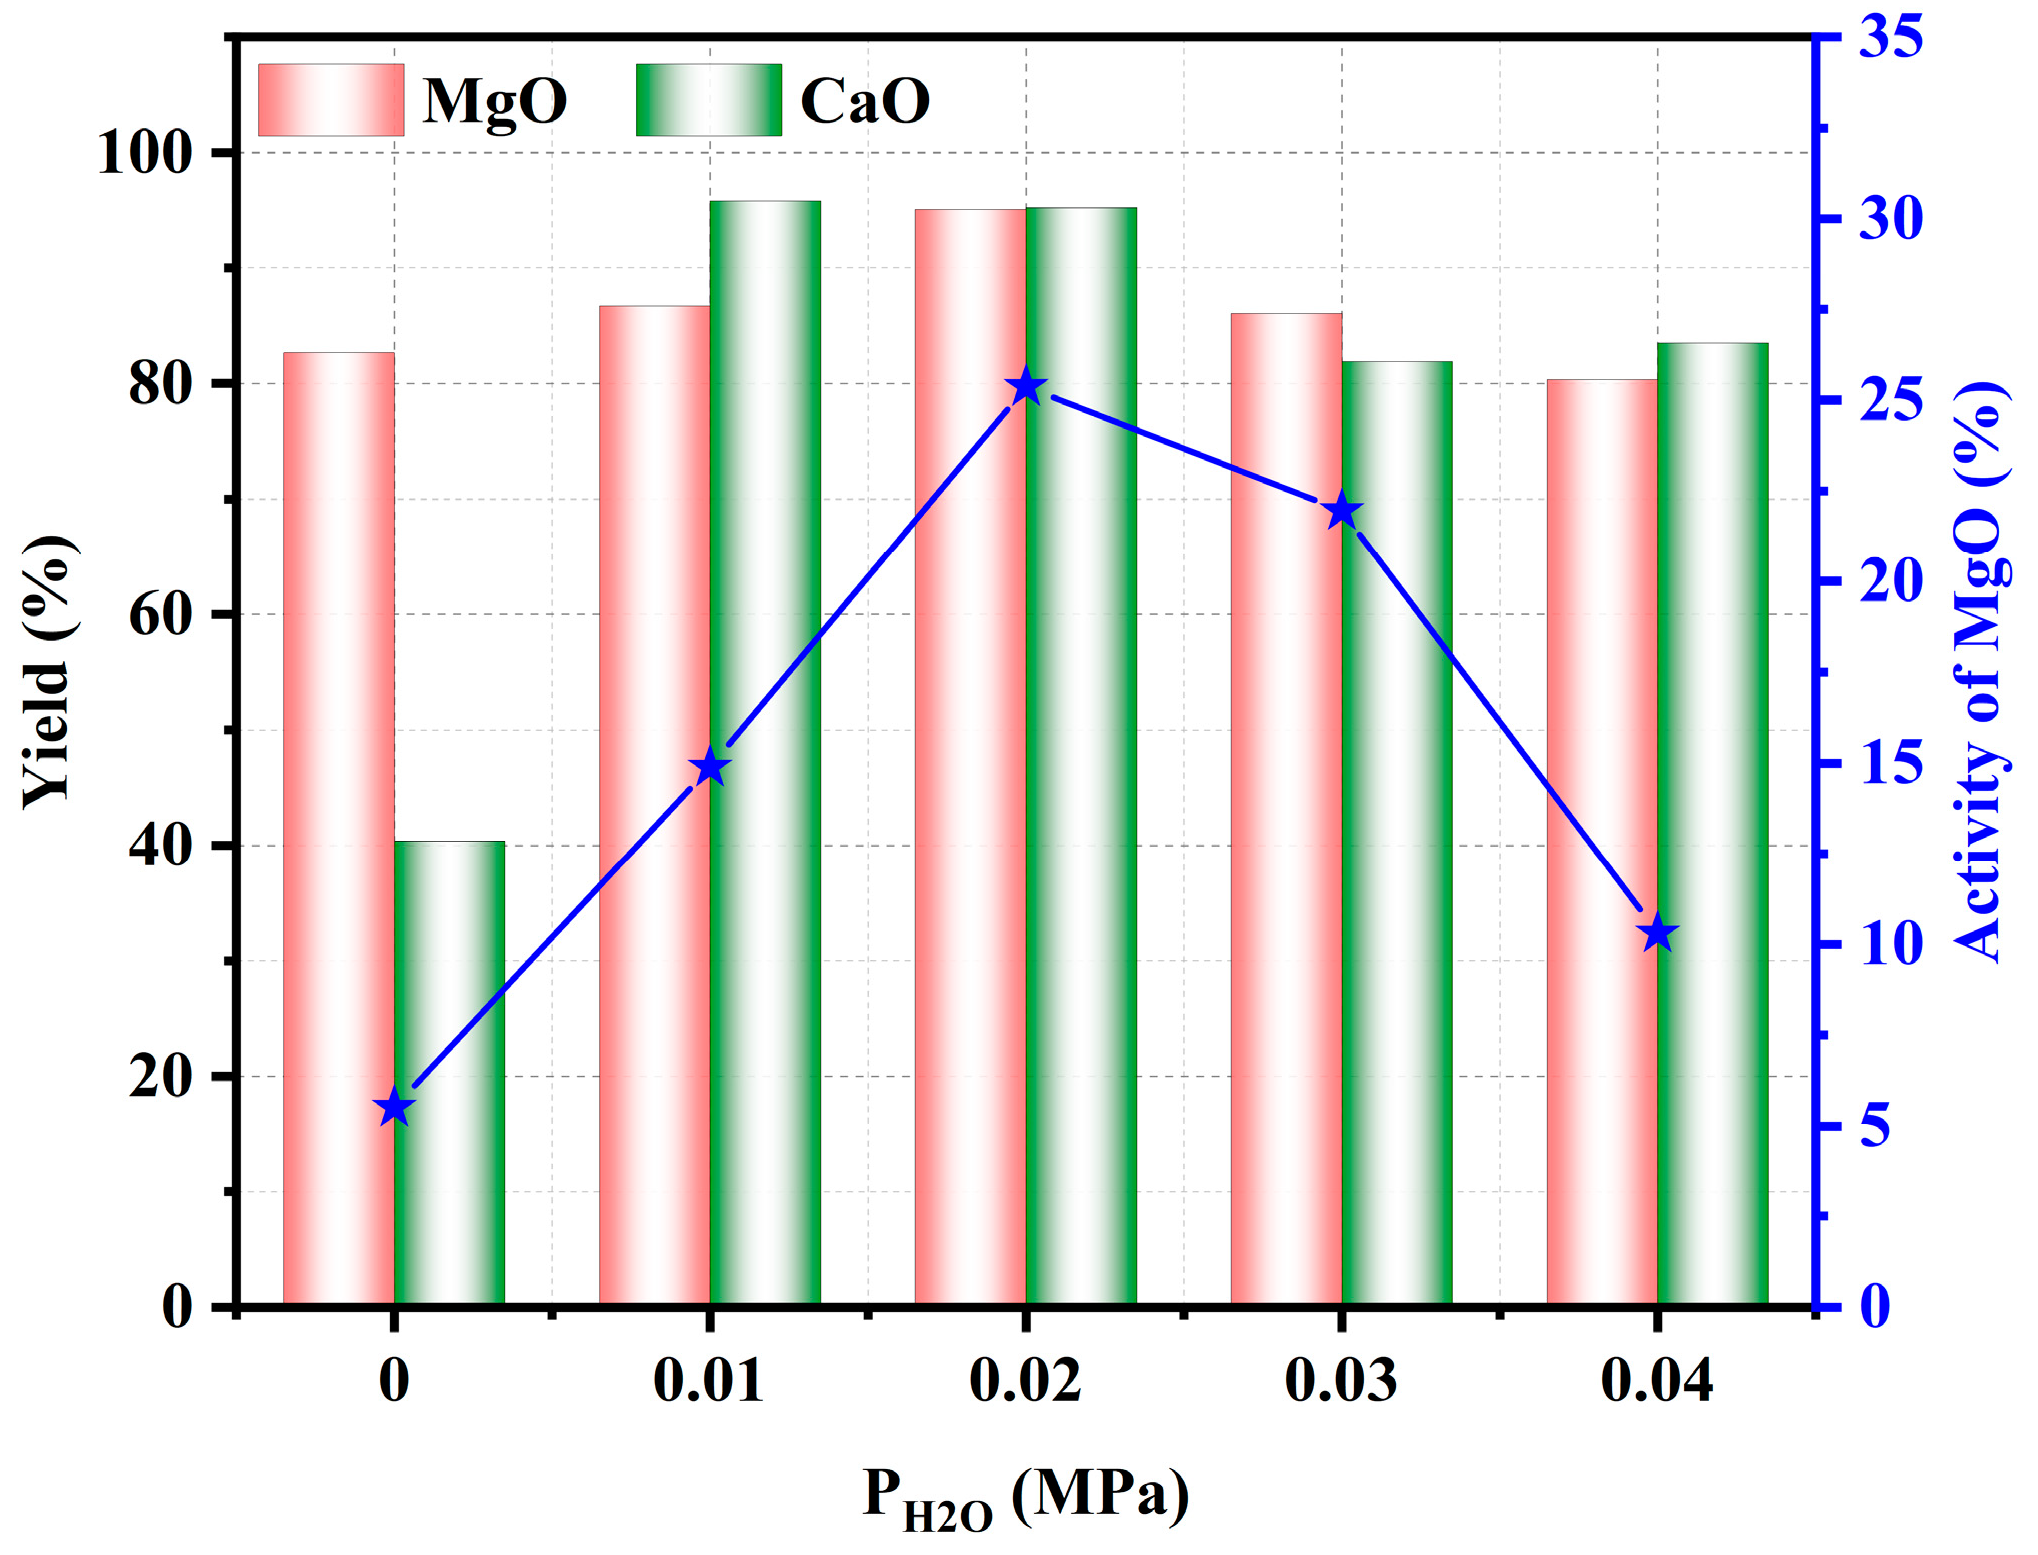
Figure 7 shows the effect of H2O pressure on the yield of MgO and CaO and the activity of MgO. The yield of MgO in the pyrolyzed phosphate tailings increased from 82% to 95.7% when the H2O pressure was increased from 0.00 MPa to 0.02 MPa; and the yield of CaO increased from 39% to 95.12%. Both MgO and CaO yields in the pyrolyzed phosphate tailings showed a decreasing trend after the H2O pressure exceeded 0.02 MPa. This is attributed to the fact that the H2O pressure of 0.02 MPa had provided enough OH− to accommodate the decomposition of CaMg(CO3)2 to form Ca(OH)2 and MgO. Nevertheless, too high a H2O pressure may promote the reaction of MgO and CaO with SiO2 to form MgSiO3 and CaSiO3 in the system, leading to a decrease in the yield of MgO and CaO. In addition, the activity of MgO in the pyrolyzed phosphate tailings reached the maximum value of 25.5% when the H2O pressure was 0.02 MPa. Continuing to increase the H2O pressure, the activity of MgO decreased to 10.3%. Taking all of these considerations into account, the H2O pressure should be controlled at around 0.02 MPa.
3.2.2. Effect of Pyrolysis Temperature
Figure 8 shows the XRD diagrams of the pyrolyzed phosphate tailings at different pyrolysis temperatures (0.02 MPaH2O, heating rate 10 K/min and holding time 60 min). As can be seen from Figure 8, the main physical phase components were MgO, Ca(OH)2, Ca5(PO4)3F and SiO2. When the temperature was increased from 725 °C to 800 °C, it can be seen from the local magnification diagram that the peaks of MgO were gradually strengthened, while the peaks of Ca(OH)2 were weakened. In addition to that, the peaks of SiO2 showed a tendency to weaken or even disappear. This may be due to the fact that the increase in temperature promotes the crystallization of MgO, while Ca(OH)2 and SiO2 have an enhanced tendency to react with the increase in temperature to form CaSiO3, which leads to the enhancement of the characteristic peaks of MgO and the weakening of the characteristic peaks of Ca(OH)2 and SiO2.
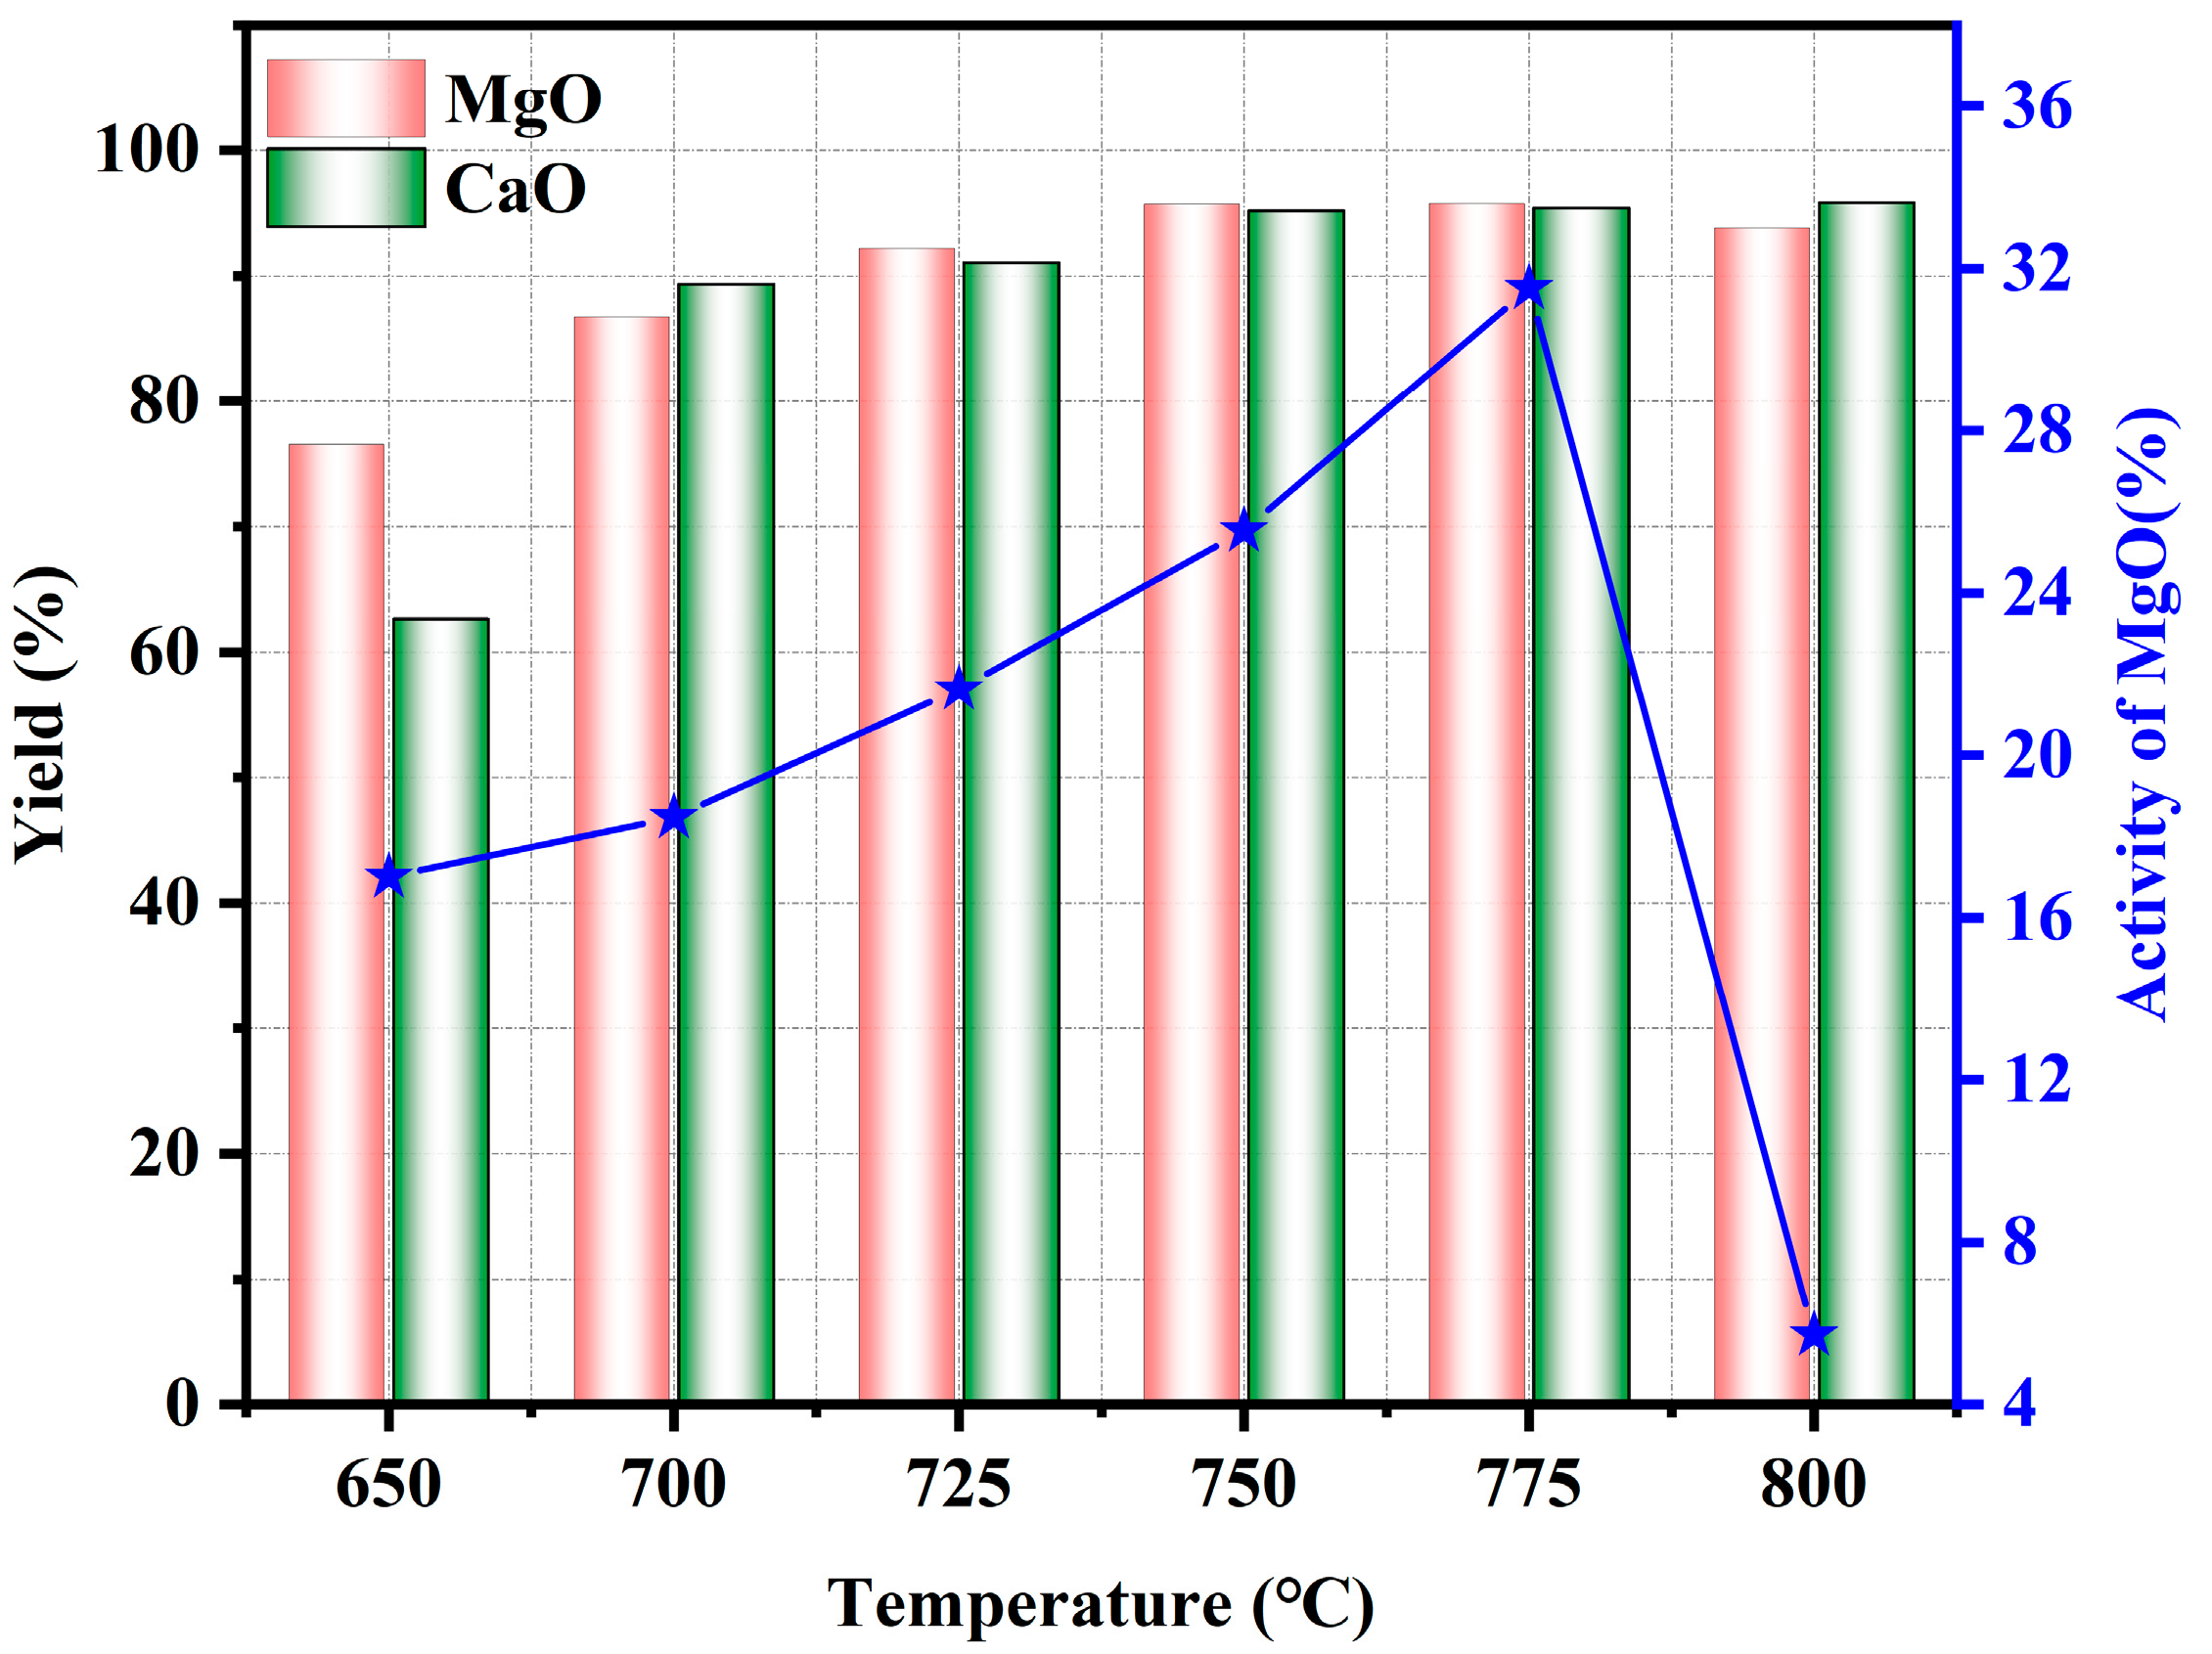
Figure 9 shows the effect of pyrolysis temperature on the pyrolysis properties of phosphate tailings. With the increase in pyrolysis temperature, the yields of CaO and MgO showed a tendency to increase first and then to equilibrate. When the temperature was increased from 650 °C to 700 °C, the yield of CaO in the pyrolyzed phosphate tailings increased from 62% to 89%, and the yield of MgO increased from 76% to 87%. Continuing to increase the temperature, the yield of both increased slowly. This is because as the temperature rose, CaMg(CO3)2 in the phosphate tailings was gradually decomposed into MgO and Ca(OH)2, and Ca(OH)2 was further decomposed into CaO. It can also be found from Figure 9 that the activity of MgO showed a trend of gradual growth followed by a sharp drop with the increase in temperature. It reached a maximum value of 31.5% at a temperature of 775 °C, and the MgO activity declined to 5.7% above this temperature. Therefore, in order to maximize the yield of CaO and MgO as well as the activity of MgO in the pyrolyzed phosphate tailings, the pyrolysis temperature should be controlled at about 775 °C.
3.2.3. Effect of Holding Time
Figure 10 shows the XRD patterns of the pyrolyzed phosphate tailings at different holding times (0.02 MPa H2O, heating rate of 10 K/min and pyrolysis temperature of 775 °C). When the holding time was increased from 30 min to 60 min, the peaks of MgO and Ca(OH)2 in the product were slightly enhanced, and the peak of SiO2 was more obvious. Continuing to extend the holding time, the peaks of all three showed a tendency to weaken. Especially when the holding time was more than 60 min, the peak of SiO2 was obviously weakened, which further indicated that SiO2 could react with Ca(OH)2 to form CaSiO3.
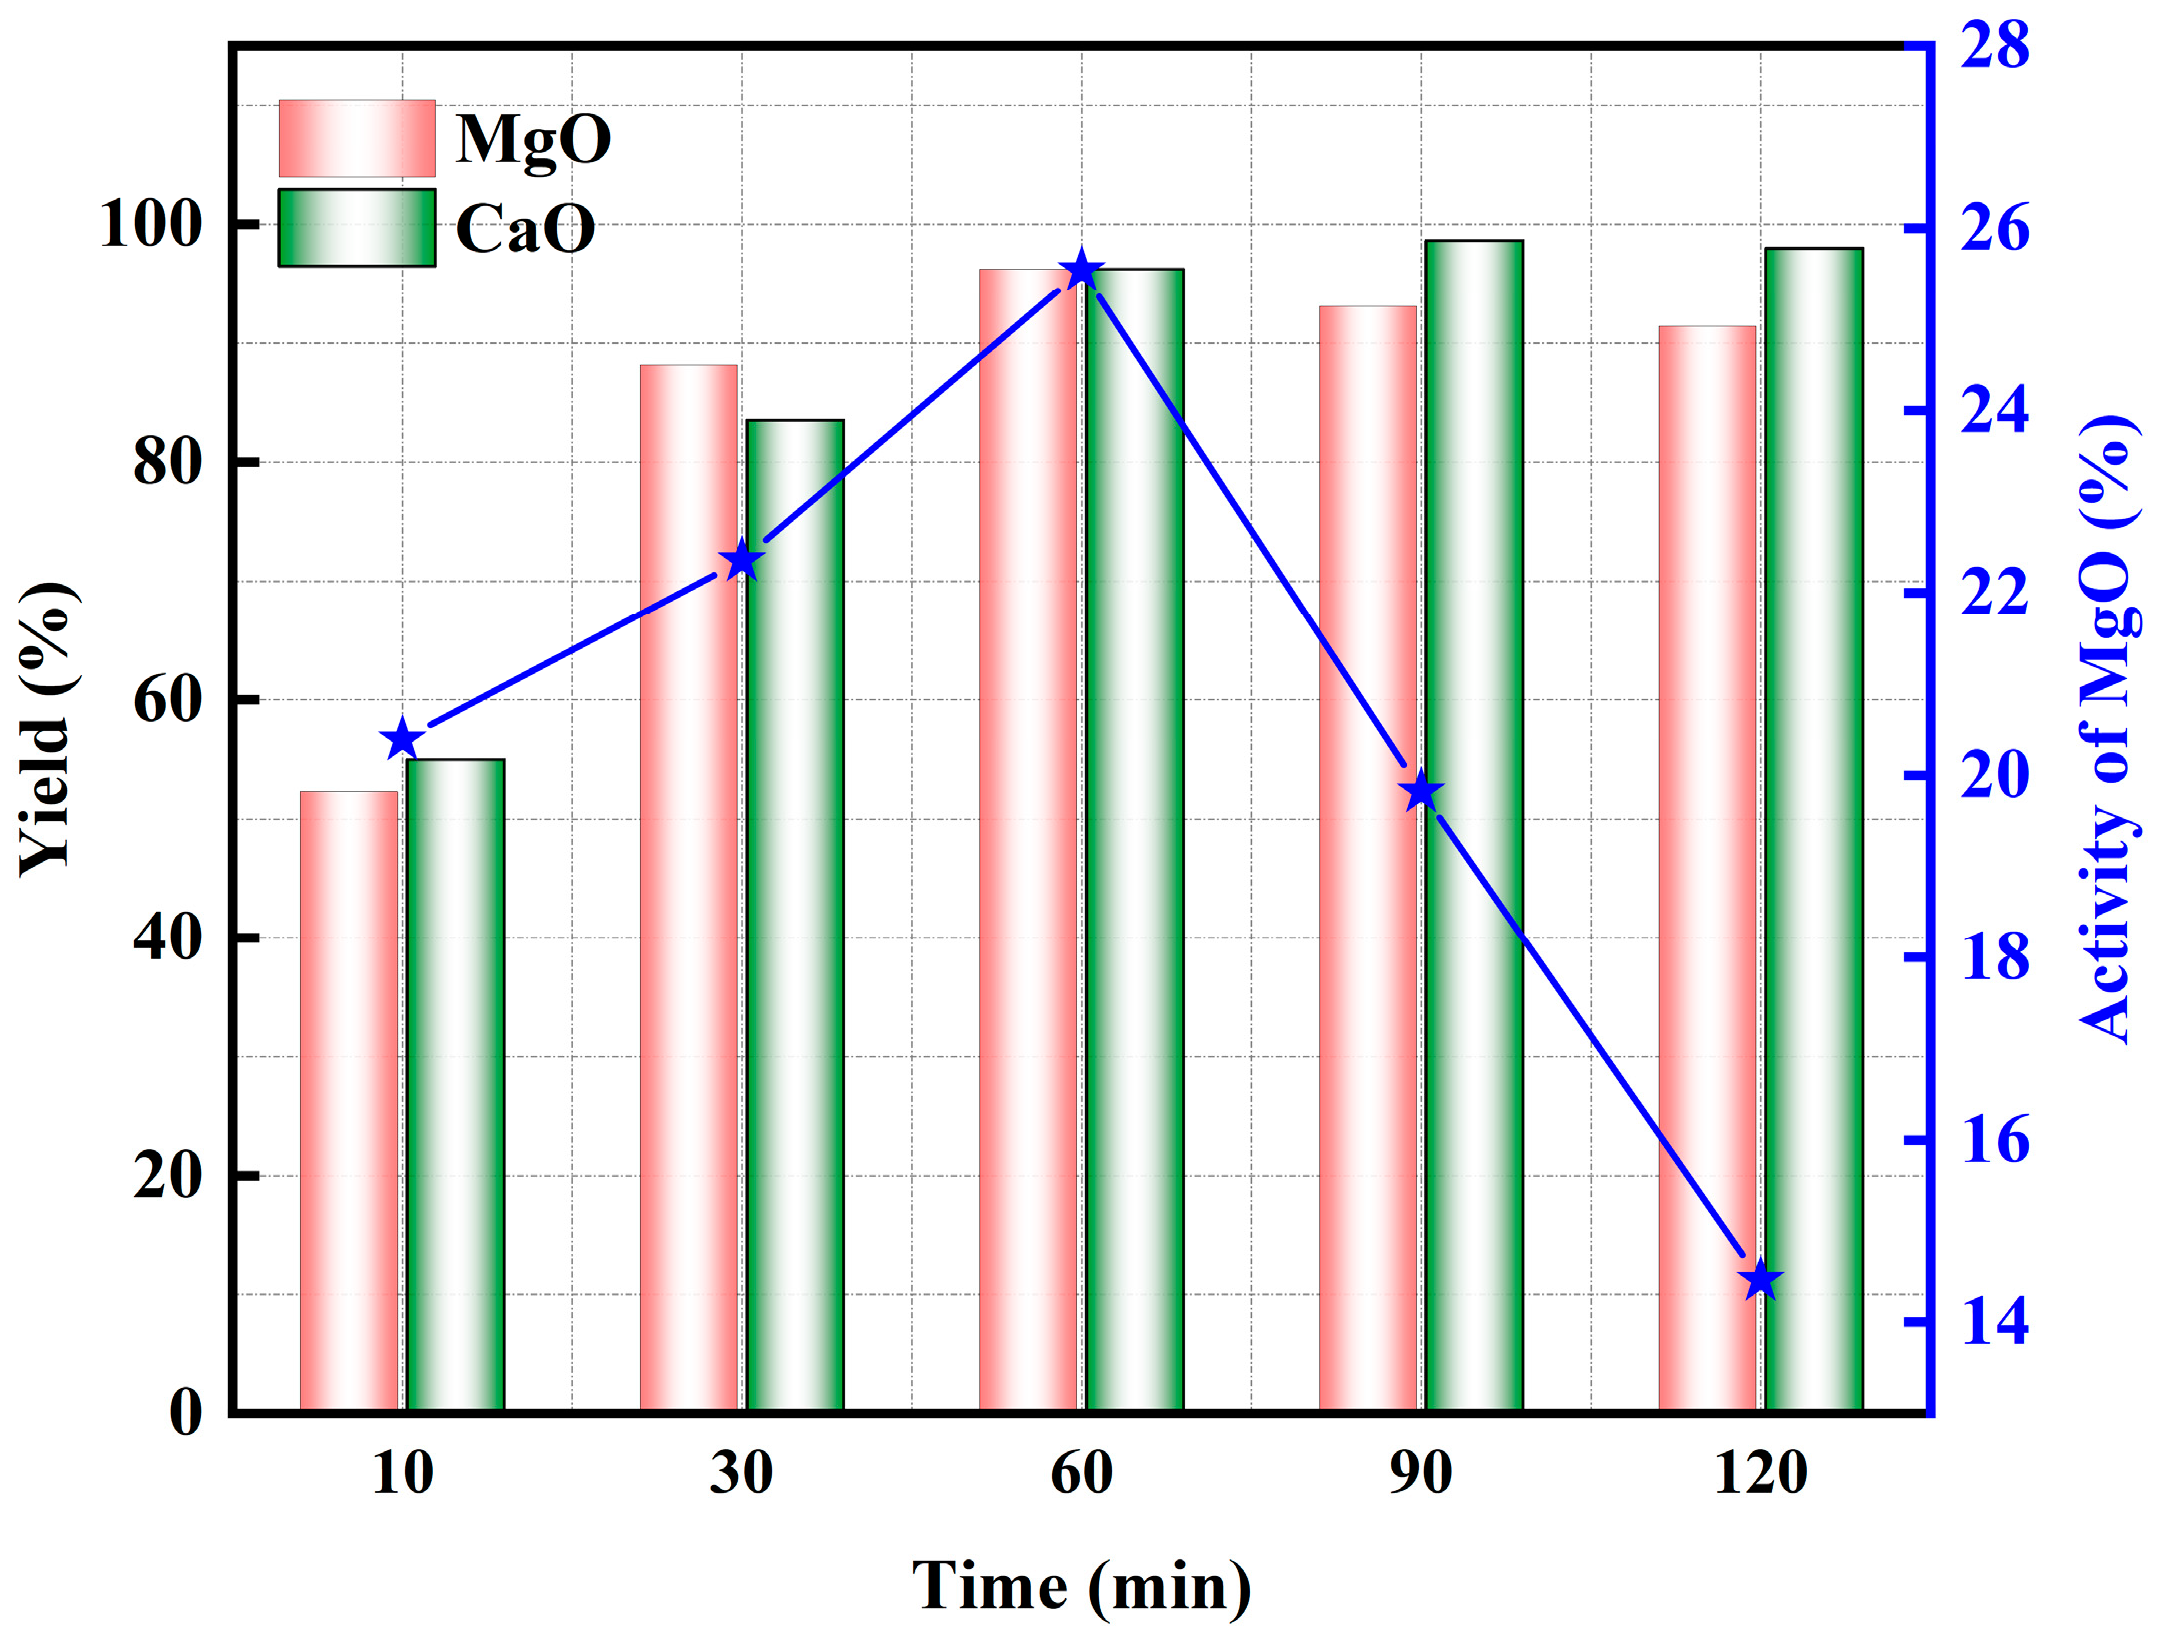
Figure 11 shows the effect of holding time on the pyrolysis properties of phosphate tailings. When the holding time was extended from 10 min to 60 min, the yield of MgO and CaO in the pyrolyzed phosphate tailings increased from 52.31% and 54.99% to 96.24%, respectively, and the activity of MgO increased from 20.39% to 25.54%. This result indicates that an appropriate prolongation of the holding time is favorable to promote the decomposition of the reactants [39]. When the holding time exceeded 60 min, the yield of MgO and CaO decreased, and the activity of MgO reduced linearly, indicating that too long a holding time is not conducive to the maintenance of the activity of MgO. Therefore, the optimal holding time is 60 min.
3.2.4. Effect of Heating Rate
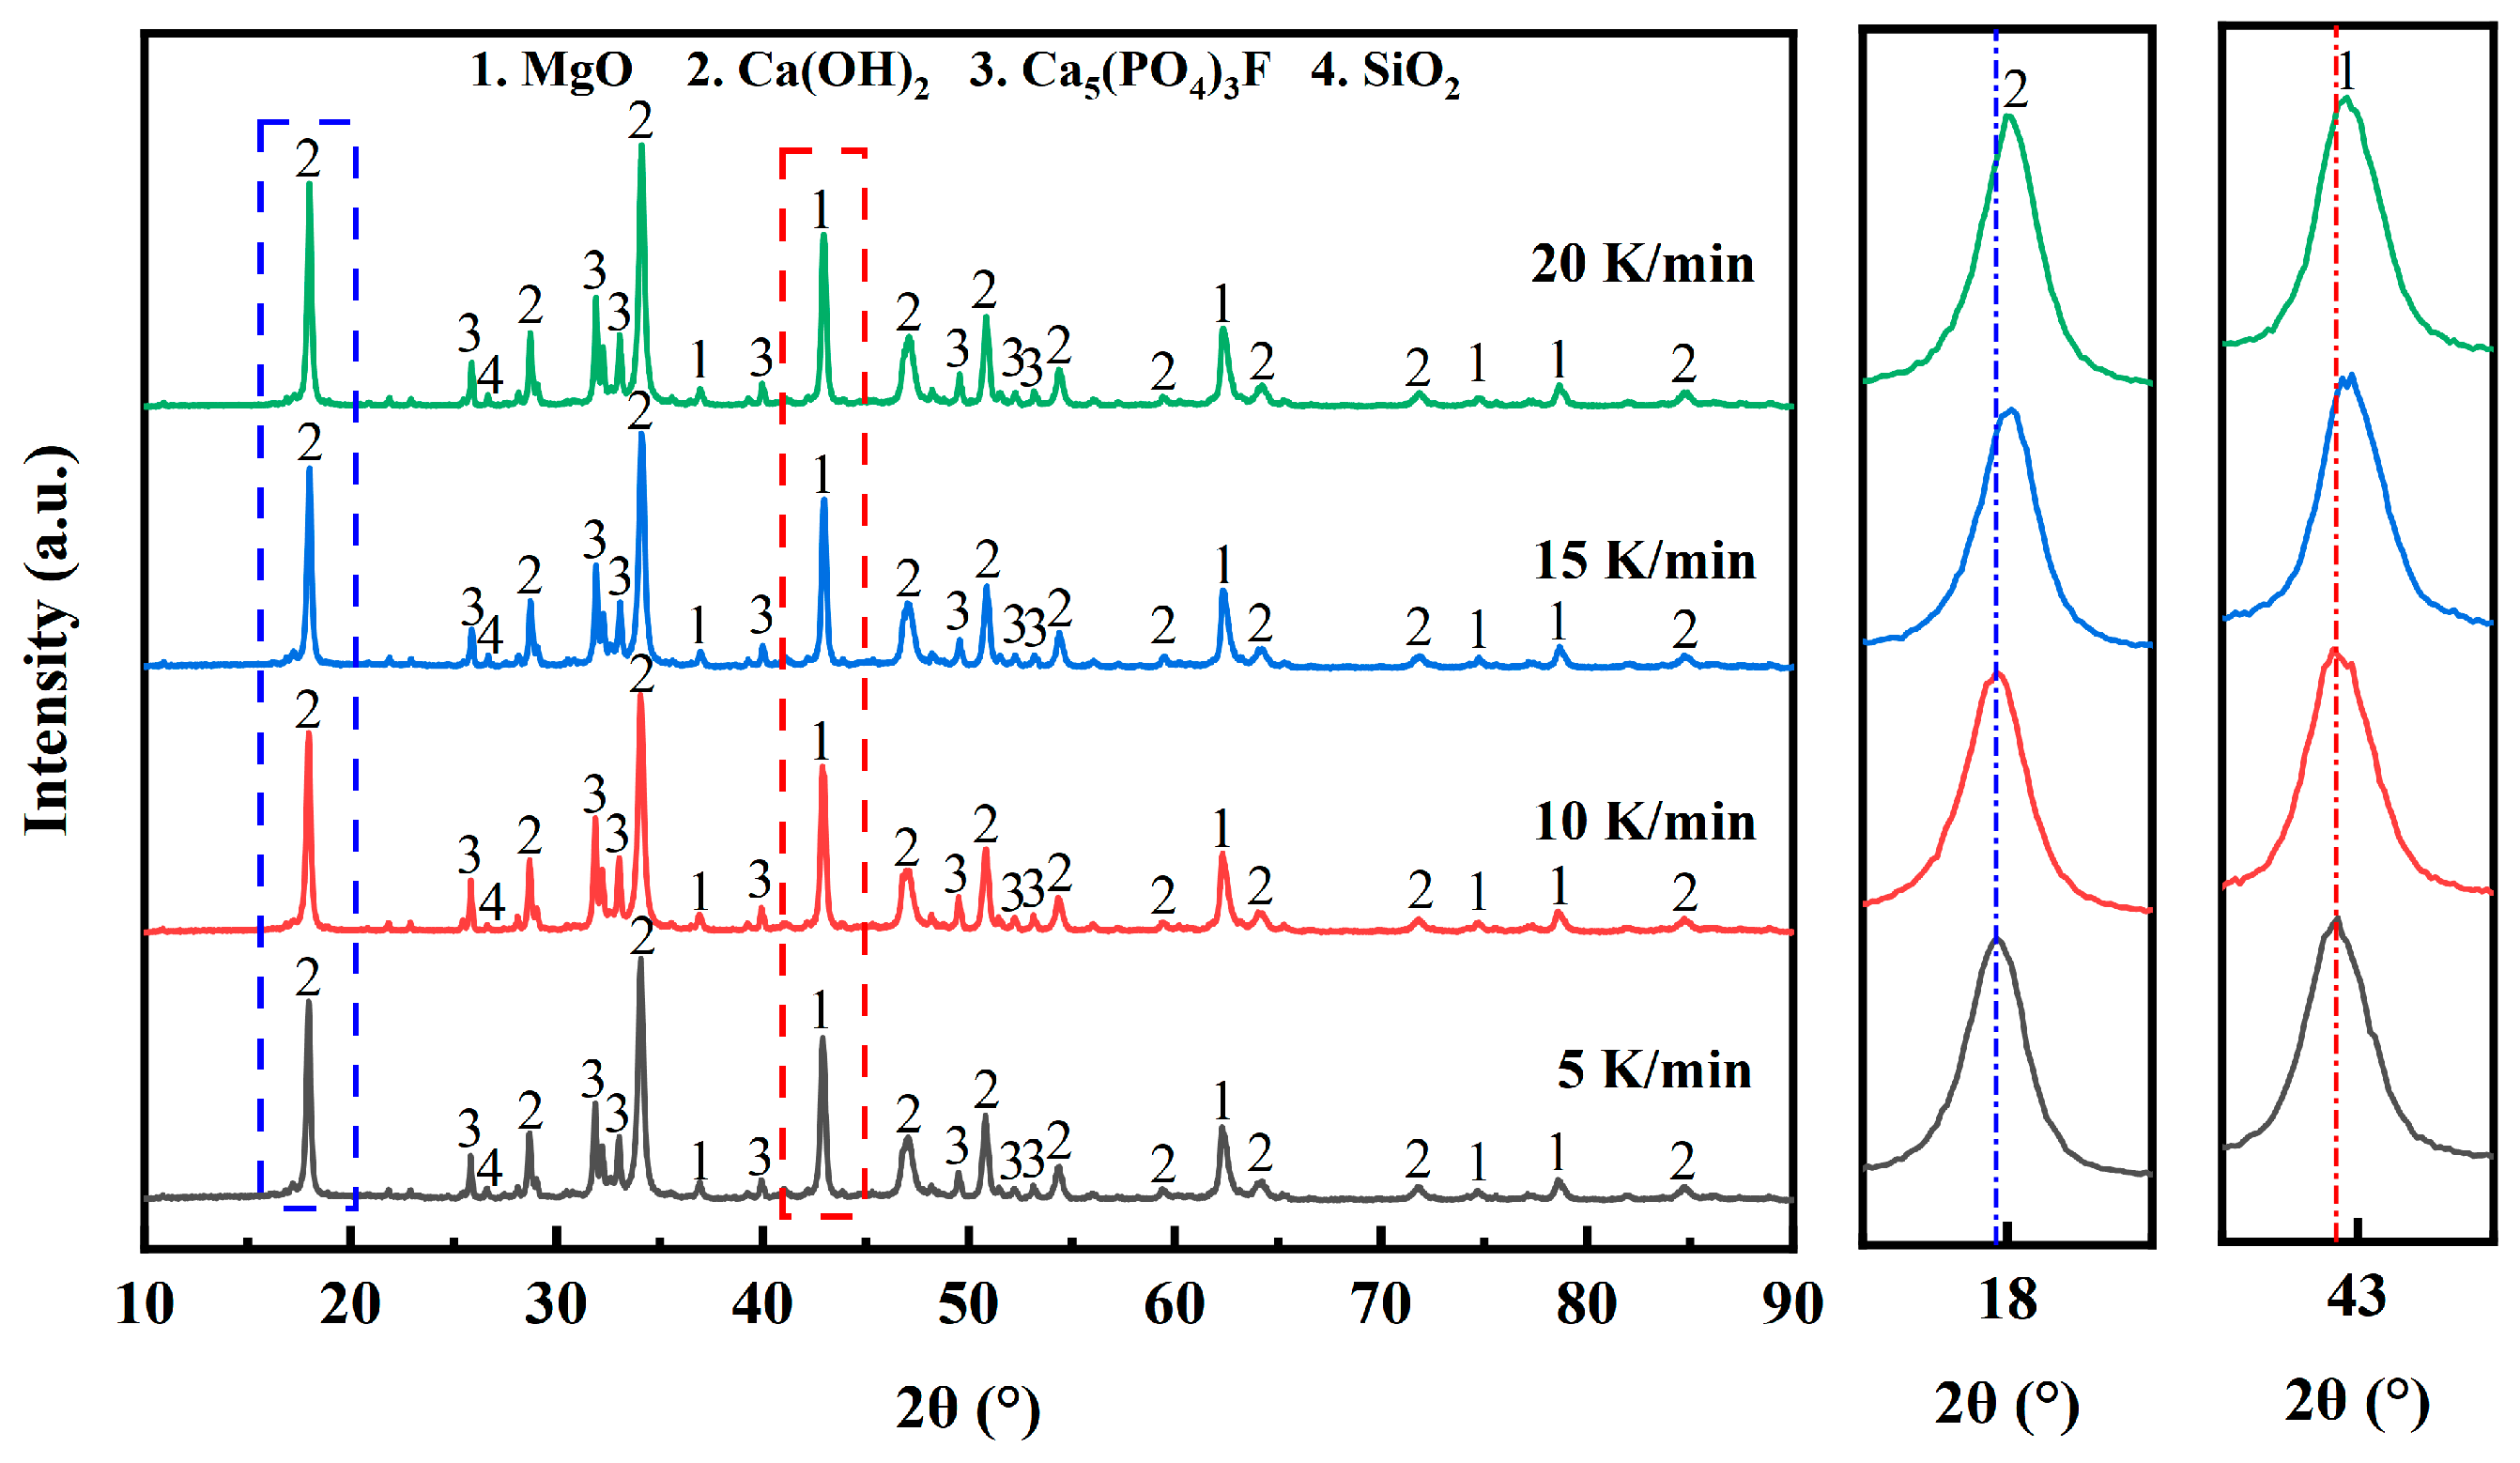
Figure 12 shows the XRD patterns of the pyrolyzed phosphate tailings at different heating rates (0.02 MPa H2O, pyrolysis temperature 750 °C and holding time 60 min). As can be seen from Figure 12, the heating rate has a certain effect on the crystal surface position of MgO and Ca(OH)2, and their characteristic peaks can be gradually observed to shift to the right as a whole when increasing the heating rate from 5 K/min to 20 K/min. This may be attributed to the fact that too high a heating rate makes the substances unevenly heated and insufficiently decomposed. The effect of water vapor makes the surface plasmonic arrangement of the pyrolysis products’ (Ca(OH)2 and MgO) particles disordered, and the increase in surface energy makes the product ions adsorb OH− on the surface to form lattice defects such as positive ion vacancies or grain boundary defects, which leads to the rightward shift of the characteristic peaks [40].
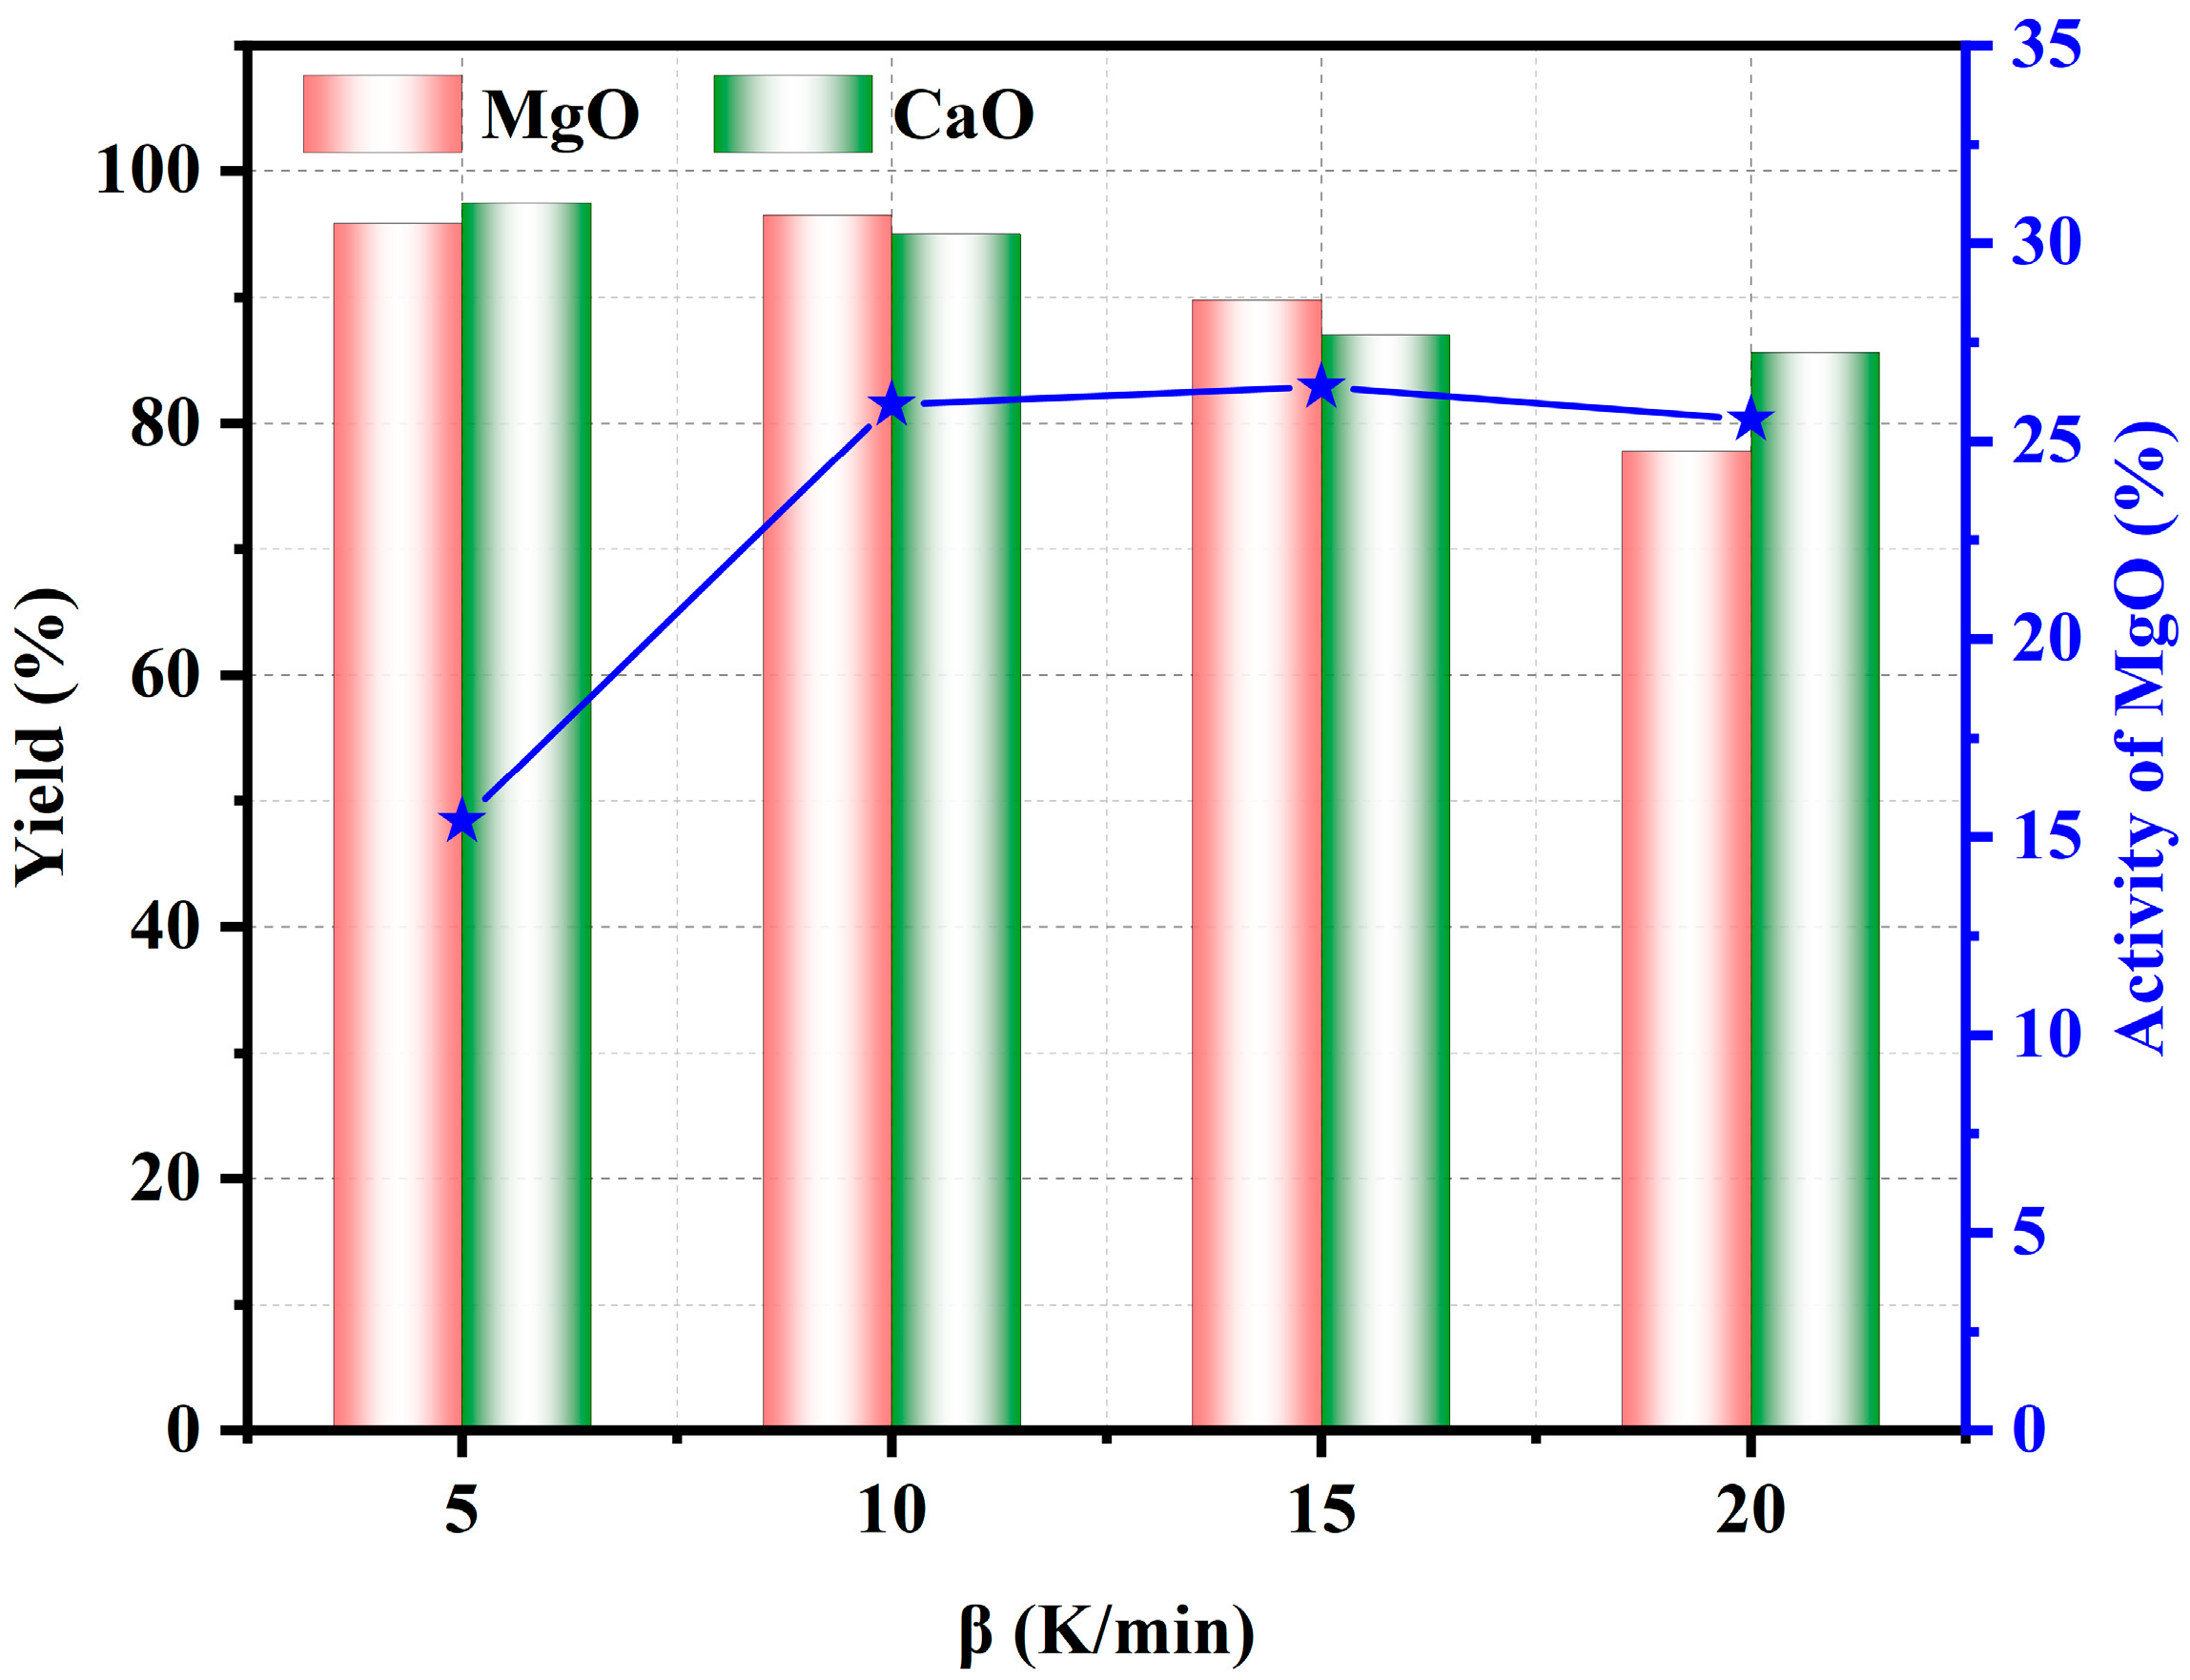
Figure 13 shows the effect of heating rate on the pyrolysis properties of phosphate tailings. As can be seen from Figure 13, the yield of CaO and MgO in the pyrolyzed phosphate tailings decreased with the increase in the heating rate, while the activity of MgO showed the opposite trend. When the heating rate was 5 K/min, the yield of CaO and MgO was relatively high, but the activity of MgO was the lowest. When the heating rate was increased to 10 K/min, the yield of CaO and MgO decreased slightly, but both exceeded 95%, and the activity of MgO increased significantly. These results indicate that at a lower heating rate, the temperature gradient within each substance in the phosphate tailings was very small, and although the reactants decomposed sufficiently at this time, the lattice defects of the products were reduced due to their well-developed lattice, which made their reactivity lower. The activity of MgO remained almost unchanged when the heating rate exceeded 10 K/min, while the yield of CaO and MgO decreased significantly. Therefore, a heating rate of 10 K/min is a suitable choice.
3.3. Response Surface Method Optimization and Analysis of Phosphate Tailing Pyrolysis Process Conditions under H2O Atmosphere
On the basis of a single-factor experimental analysis, seventeen groups of experiments with three levels of three influencing factors, namely, pyrolysis temperature, holding time and H2O pressure, were determined, and the yield of MgO was taken as the response value, and Box–Behnken response surface design and data analysis were applied in Design Expert 13.0 software. The specific experimental factors and the values of each level are shown in Table 3, and the experimental design scheme and experimental results are shown in Table 4.
The model was analyzed by using Design Expert 13.0 software and the analytical optimization results are displayed in Figure 14 and Table 5. From the distribution of residuals versus predicted values in Figure 14a, the residual values were uniformly distributed at both ends of the 0 scale, and there was no anomaly in the residuals, which indicates that the fit is good and the residual values are reasonable. From the relationship between the residuals and the number of experiments in Figure 14b, the distribution of the residuals is uniform, which indicates that the residuals are small and have little effect on the experimental results. From the relationship between the measured and predicted values in Figure 14c, the experimental data points are close to the fitted line, which indicates that the error between the experimental and predicted values is small.
Table 5 presents the results of the response surface ANOVA. The regression model p-value < 0.0001 indicates that the model is highly significant; at p > 0.1, the model is not significant [41]. As can be seen from Table 5, factors A, B, C, AB, BC, A2, B2 and C2 are significant terms of the quadratic model. This indicates that H2O pressure, temperature and holding time have a more significant effect on the magnesium oxide yield, and that H2O pressure and temperature, and temperature and holding time have an interaction and squaring effect on the magnesium oxide yield. The F-value of the misfit term relative to the pure error is 1.29, which indicates that the misfit term is not significant. Due to noise, there is a 39.22% probability of having such a large F-value for the misfit term model, and the misfit term being insignificant is good for the fitted model. The regression coefficient of this quadratic model is 0.9995, the predicted R2 is 0.9961 and the adjusted R2 is 0.9990, and the difference between the two is 0.0029 (<0.2), which is a good degree of fit with a small test error. The following regression equation was obtained after fitting the model with the yield of MgO as the response value:
Y = 96.55 + 3.69A + 5.06B + 1.02C − 3.16AB + 0.65BC − 19.08A2 − 5.63B2 − 3.96C2
The response surface analysis plots and corresponding contours of each parameter of the phosphate tailing pyrolysis process were derived from the regression equations, as shown in Figure 15. It can be seen that the greatest influence on the MgO yield is the temperature, followed by the H2O pressure and finally the holding time. The optimum pyrolysis conditions of phosphate tailings are as follows: A is 0.02 MPa, B is 758 °C and C is 1.08 h. Under this experimental condition, the MgO yield can be predicted to reach 97.4%.
The optimization results of the above pyrolysis conditions were experimentally verified, and the results obtained by repeating the experiment three times are shown in Table 6. The average yield of CaO and MgO in the three parallel experiments was 98.1% and 97.3%, respectively, and the average activity of MgO was 31.6, which is basically consistent with the predicted results, indicating that the above regression model has good accuracy and reliability.
3.4. Existence and Distribution of Calcium and Magnesium in Pyrolysis Phosphate Tailings
3.4.1. Mineral Phase Composition
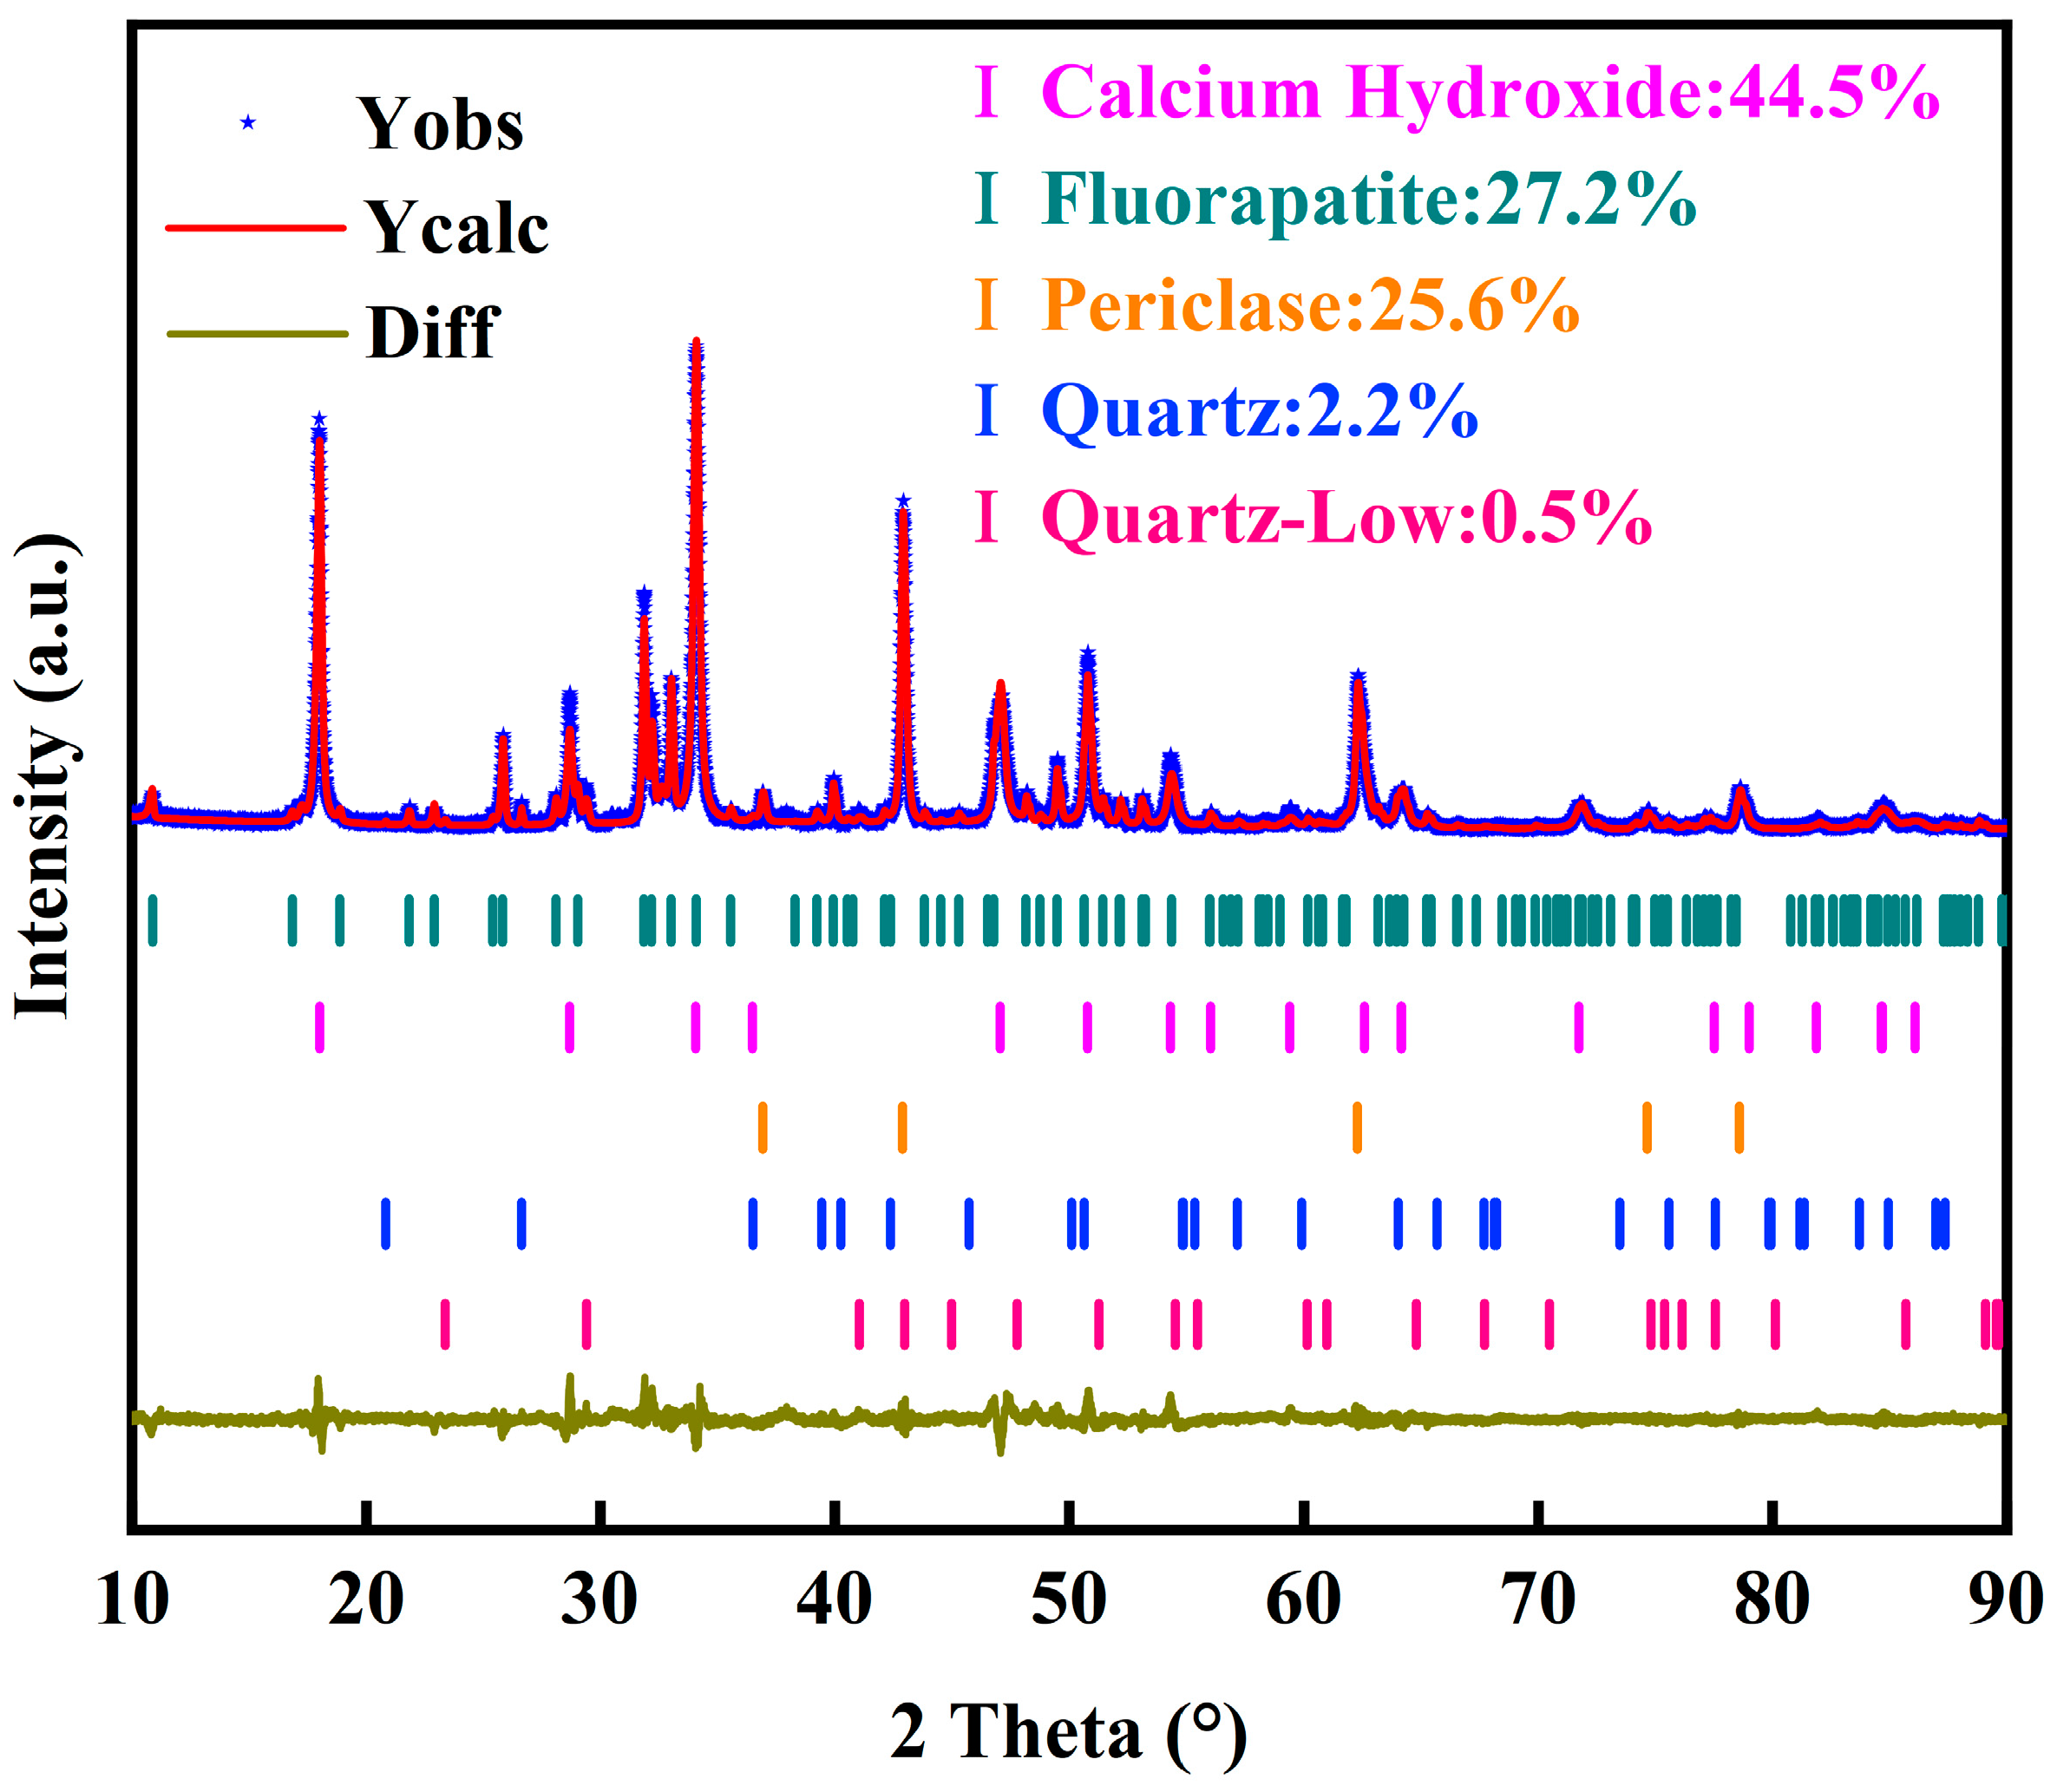
The XRD pattern of pyrolysis phosphate tailings was simulated by the Rietveld method and its physical phase composition was quantitatively analyzed, and the results are shown in Figure 16. As can be seen in Figure 16, the main mineral phase compositions in the pyrolyzed phosphate tailings were calcium hydroxide, magnesium oxide, fluorapatite and quartz, of which the calcium hydroxide content was the highest, at 44.5%, followed by a fluorapatite content of 27.2% and a magnesium oxide content of 25.6%, and the quartz content was the lowest, at 2.2%; the results of the crystal structure of each physical phase fitting are shown in Table 7.
The XPS spectra of Ca, Mg, Si, F and P are shown in Figure 17. The X-ray photoelectron spectroscopy database of the National Institute of Standards and Technology (NIST) of the United States was used in this work [42]. In addition to the main phases Ca(OH)2, MgO, Ca5(PO4)3F and SiO2 in the pyrolyzed phosphate tailings, the presence of CaSiO3 was found at a Si2p spectral binding energy of 102.36 eV, which suggests that Ca(OH)2 in the pyrolysis product does react with SiO2 to form CaSiO3 (no MgSiO3 was found). This result is consistent with the thermodynamic computational simulations. Moreover, the F1s spectral binding energies were 685.70 eV, 684.80 eV and 683.90 eV, which represent the presence of CaF2, MgF2 and KF, respectively. P2p spectral splitting fitted three peaks corresponding to binding energies of 134.10 eV, 133.40 eV and 132.80 eV, which were analyzed to be derived from NaH2PO4, CaHPO4 and Na2HPO4, respectively. It can be seen that there are also very small amounts of other impurity components in the pyrolyzed phosphate tailings.
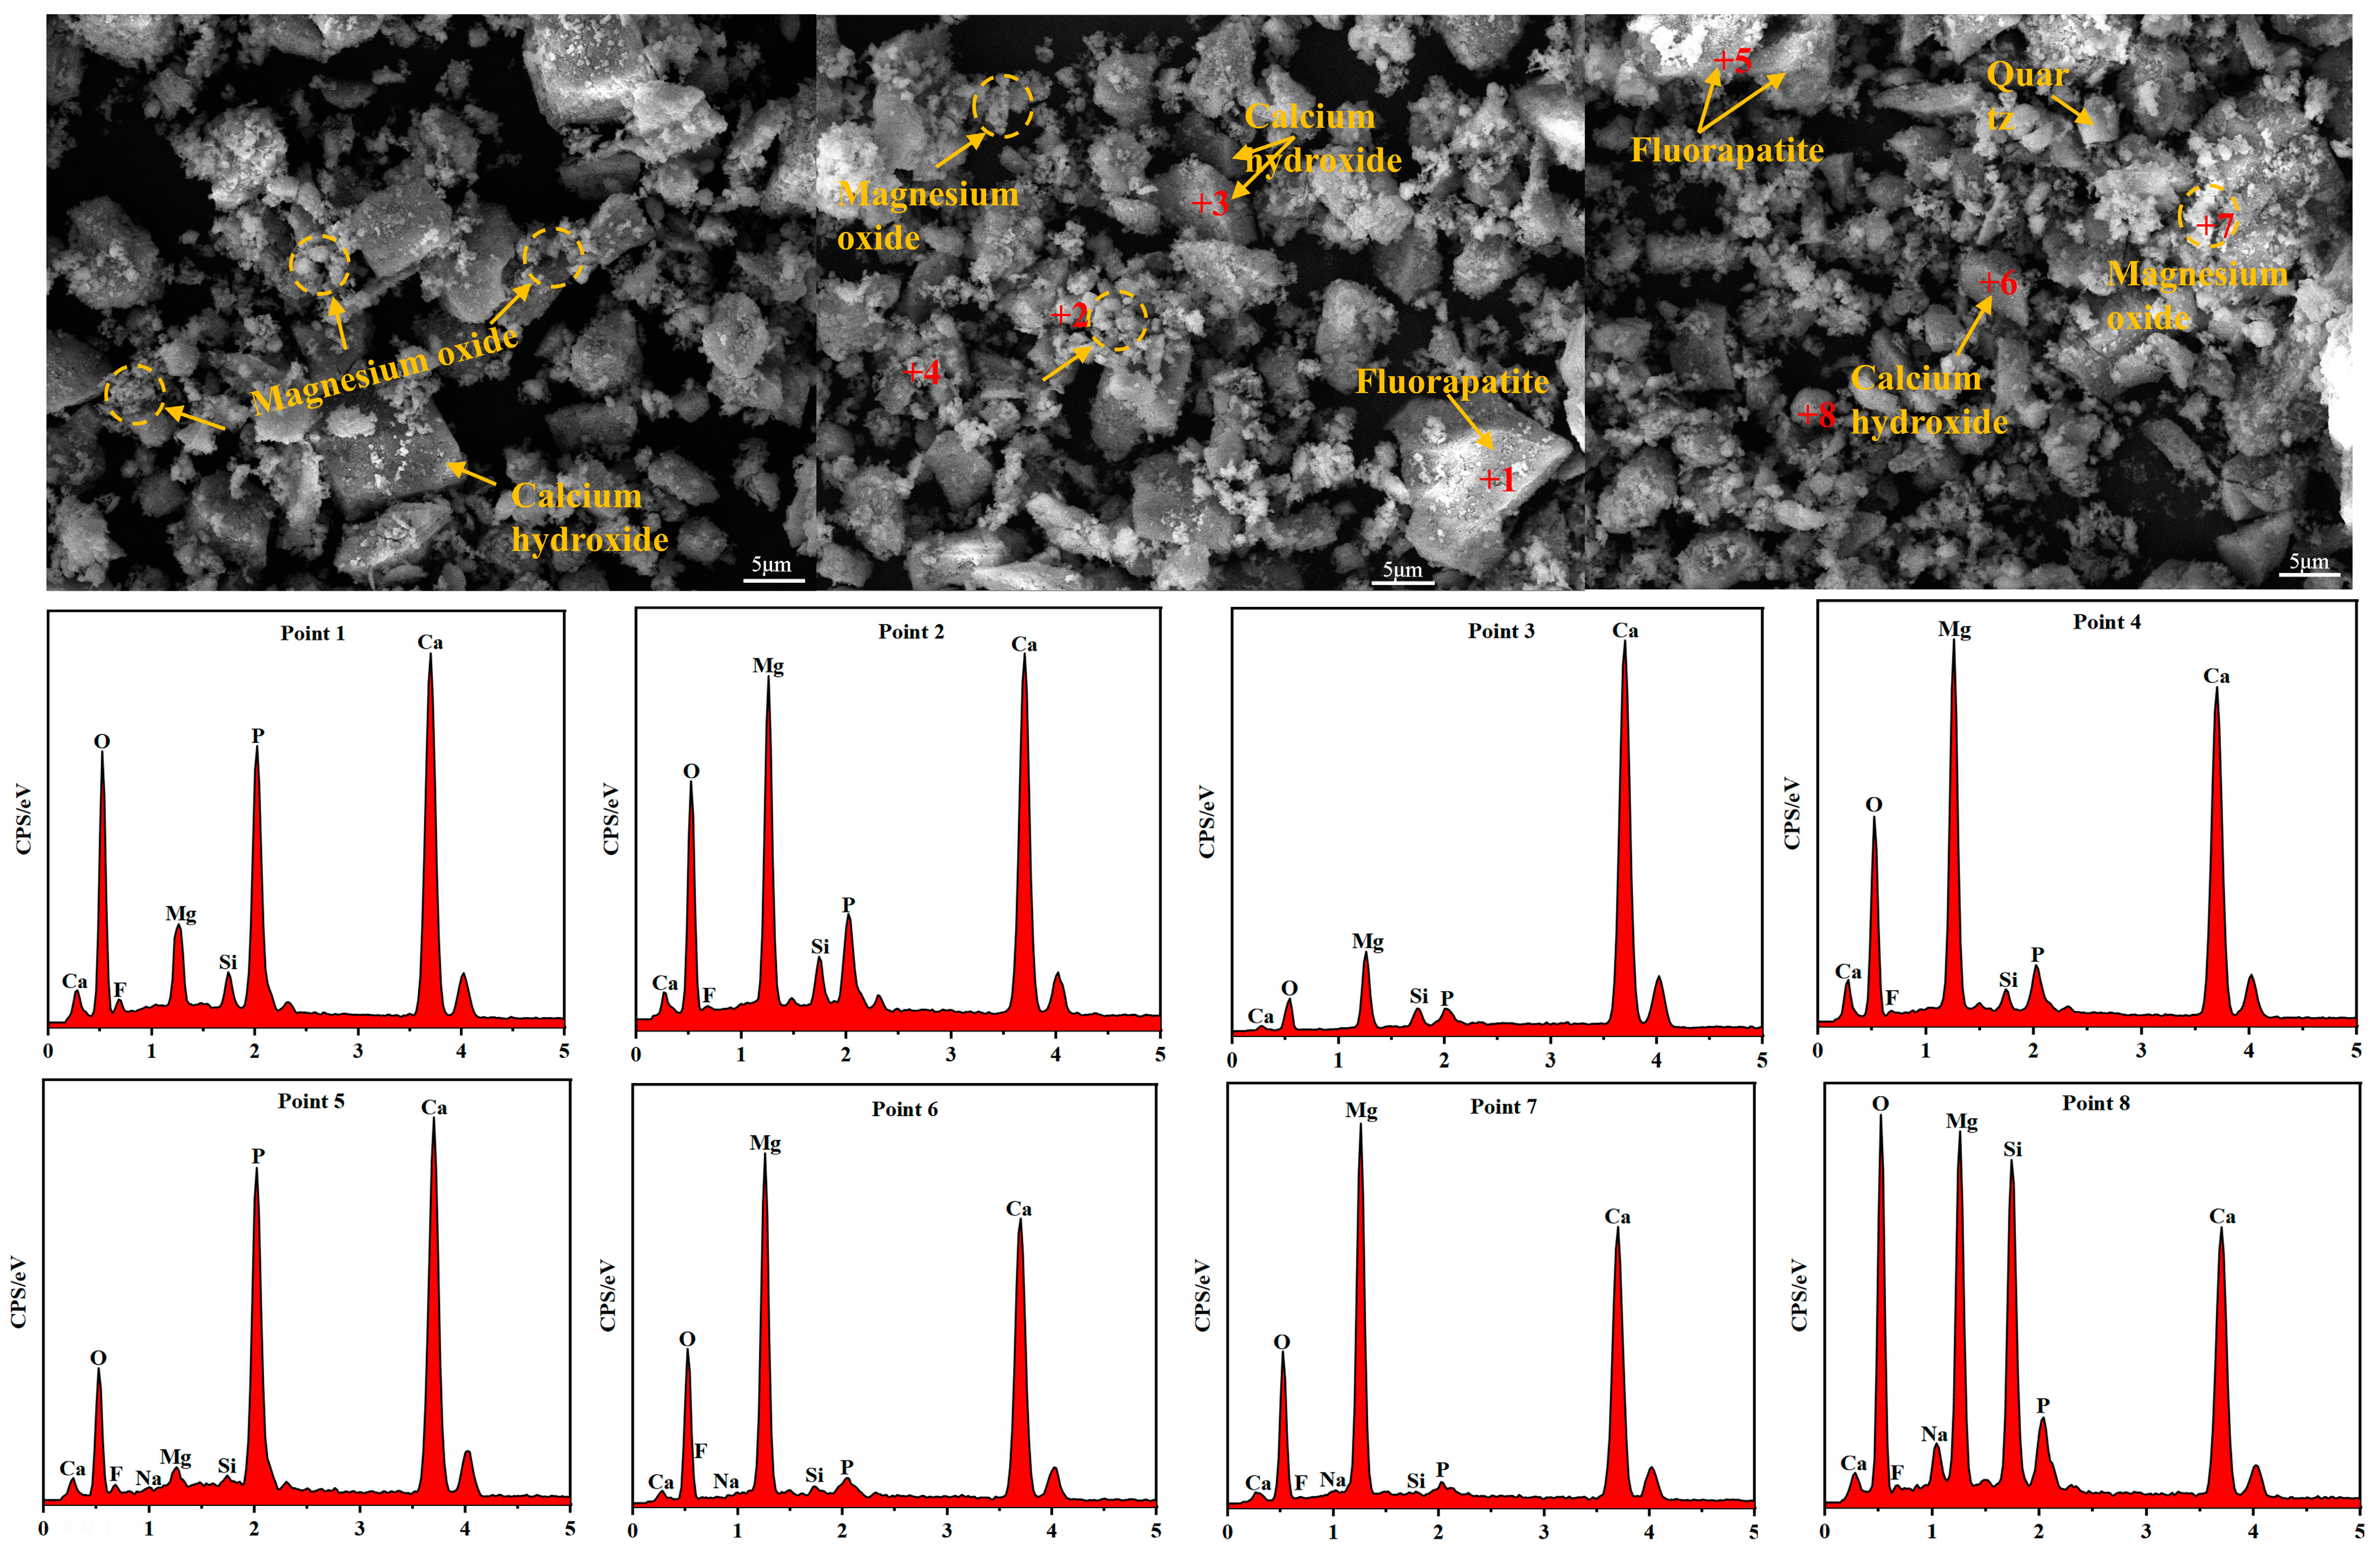
3.4.2. Microscopic Morphology
The microscopic morphology of the pyrolyzed phosphate tailings is shown in Figure 18. As seen in Figure 18, the pyrolysis products have diverse morphologies, with obviously flocculent, smooth and large agglomerates, being similar to cubic lumps and small spherical materials. According to the analysis of the EDS point scan results, it can be seen that the small spherical agglomerates at point 1 and the loose agglomerates at point 5 are mainly fluorapatite [43], the rhombic lumps at point 3 and point 6 mainly represent calcium hydroxide [44,45], and the crumbly material at point 4 and flocculent material at point 7 are mainly magnesium oxide [46]. It can be seen from the EDS results of the irregular large lumps at point 2, the rhombic lumps at point 6 and the flocculated material at point 7 that cubic calcium hydroxide has a large amount of magnesium oxide attached to its surface, while the 8-point spherical material is a silica-containing material, which is mainly calcium silicate or silicon dioxide, and combined with the results of the correlation scatter plot of Mg-Si, the presence of magnesium silicate is considered very unlikely.
3.4.3. Distribution of Calcium and Magnesium in Pyrolytic Phosphate Tailings
The correlation scatter plot of the content of each element in the pyrolyzed phosphate tailings is shown in Figure 19. From the results of the correlation scatter plots of Ca-Mg, Ca-P, Ca-Si, Ca-F and P-F, it can be seen that the content of Ca had an obvious negative correlation with the content of Mg, indicating that Ca and Mg in the calcined phosphate tailings were no longer forming correlation compounds, and that the calcium magnesium carbonates had been decomposed completely. The content of Ca was positively correlated with the content of P and Si up to 80%, and the positive correlation was significantly weakened after exceeding this percentage. The content of Ca was significantly positively correlated with the content of F up to 25%, and the correlation was weakened after exceeding this value, and the content of F and the content of P also showed this trend. These results indicate the presence of fluorapatite, calcium fluoride, calcium hydrogen phosphate and calcium silicate in the pyrolysis products.
The correlation scatter plot results of Mg-Si, Mg-P and Mg-F show that the content of Mg had a negative correlation with the content of Si, and the negative correlation with the content of P was more obvious. The content of Mg had a weak positive correlation with the content of F, which indicates that there was a very small possibility of the existence of magnesium silicate and magnesium phosphate in the pyrolyzed phosphate tailings. Combined with the previous XPS results, it can be seen that there was also magnesium fluoride in the sample, and the scatter plot results are consistent with the previous results.
The content of P showed a certain positive correlation with the content of Na, and combined with the results of XPS analysis, it was concluded that there was also sodium hydrogen sulphate in the product.
The correlation scatter plots of F-K, F-Si, and F-Na suggest that the content of F showed a weak positive correlation with the content of K and Na. The scatter distribution shows that the contents of K and Na were small and therefore could not be detected in the previous XRD characterization method. The content of F showed a weak positive correlation with the content of Si in a very low range, indicating that a small amount of Si and F formed the corresponding compounds, which might be caused by the presence of K2SiF6 [44].
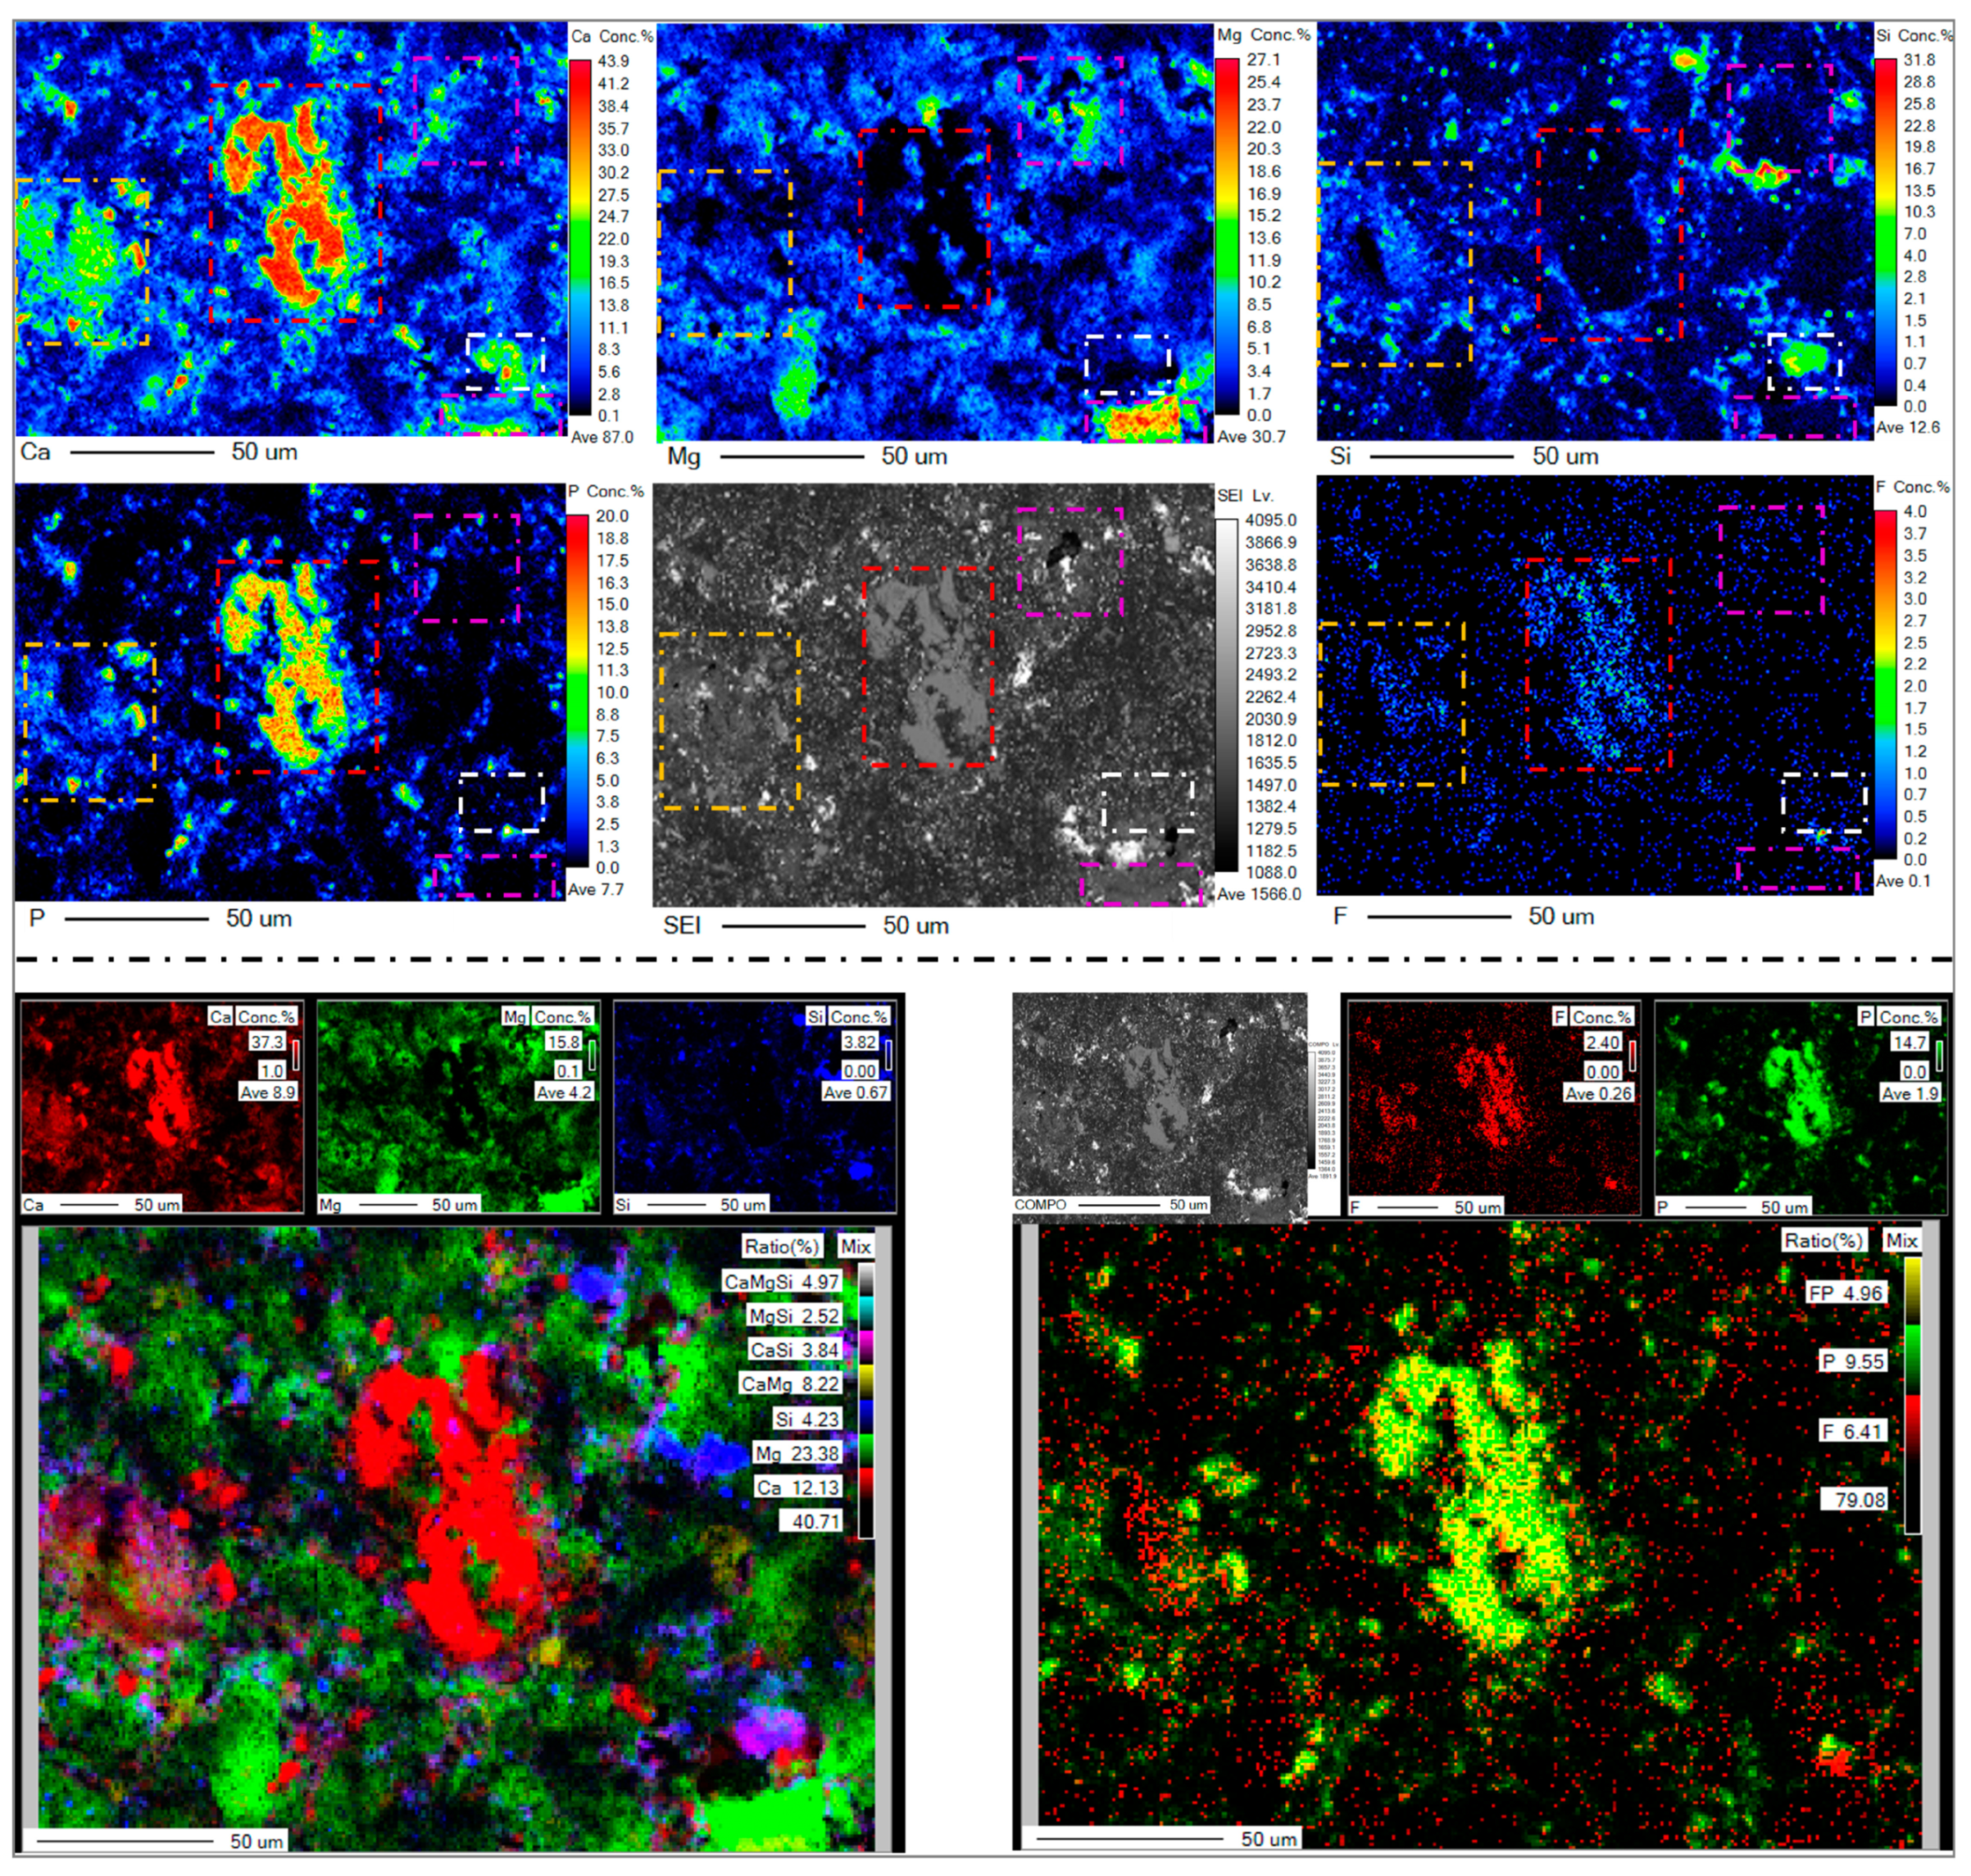
The EPMA surface scanning mapping results of Ca, Mg and other elements in the pyrolyzed phosphate tailings are shown in Figure 20. It can be seen from Figure 20 that the distribution of Ca and Mg elements was uneven, and the overall distribution contained small particles or was even powder-intensive. By carefully comparing the distribution maps of each element, it can be seen that the content of the Ca element was also relatively high in the area with a high content of P and F elements, and the content of Mg and Si was relatively low (such as the red box area in the picture). In the area with a high content of the P element, the content of Ca was obviously higher, and the content of F and Mg was relatively small (such as the orange box area in the figure). The content of Ca was significantly higher in the area with a higher Si content, and the content of Mg, P and F was lower (as shown in the white box area in the figure). The content of other elements in the area with a high content of Ca and Mg was obviously low (such as the purple box area in the figure). These results indicate that the distribution of P and F in pyrolyzed phosphate tailings had a high correlation with the distribution of Ca, the distribution of P had a high correlation with the distribution of Ca, and the distribution of Si in pyrolyzed phosphate tailings had a high correlation with the distribution of Ca. These results are in agreement with the quantitative EPMA analysis, i.e., Ca and Mg no longer form associative compounds, with Ca mainly in the form of Ca5(PO4)3F, CaHPO4, Ca(OH)2, CaF2 and CaSiO3, and Mg mainly as MgO, Mg(OH)2 and MgF2, which opens up the possibility of further separation of calcium and magnesium.
4. Conclusions
(1) Compared with N2, air and CO2 atmospheres, the pyrolysis process of phosphate tailings under a H2O atmosphere was changed from two stages to one stage, which was mainly the decomposition of CaMg(CO3)2 under the action of water molecules to generate Ca(OH)2 and Mg(OH)2 and to release CO2, as well as the decomposition of the intermediate products Ca(OH)2 and Mg(OH)2. The starting decomposition temperature of this process was lowered to 500 °C, and the decomposition time was shortened to 30 min, with the pyrolysis rate being faster, which indicates that the decomposition of phosphate tailings by water vapor had an obvious promotion effect.
(2) Under the H2O atmosphere, the influence of each factor on the pyrolysis process of phosphate tailings was in the following order: temperature > H2O pressure > holding time. When the H2O pressure was 0.02 MPa, the temperature was 758 °C, the holding time was 1.08 h and the heating rate was 10 K/min, the MgO and CaO yield was the highest, at 97.3% and 98.1%, respectively, and the MgO activity was 31.6%. The CaMg(CO3)2 decomposition of the phosphate tailings was more complete.
(3) After the pyrolysis of phosphate tailings in the H2O atmosphere, its main component was Ca(OH)2 at 44.5%, followed by Ca5(PO4)3F at 27.2%, MgO at 25.6%, and SiO2 with the lowest content of 2.2%. The distribution of Ca and Mg elements in the phosphate tailings after pyrolysis showed a negative correlation, indicating that the two no longer formed associated compounds, in which Ca mainly existed in the form of Ca5(PO4)3F, CaHPO4, Ca(OH)2, CaF2 and CaSiO3, and Mg mainly existed in the form of MgO, Mg(OH)2 and MgF2, which provides a possibility for further separation of calcium and magnesium.
Author Contributions
Y.Y.: sample preparation for the experiment; experimental data analysis and the writing of the manuscript. Y.Z.: Yanping Yang’s postgraduate tutor helped to revise the manuscript. D.N. and J.C. are other advisers. C.S. is a member of the research group. All authors have read and agreed to the published version of the manuscript.
Funding
This research was supported by Guizhou Chuanheng Chemical Co., Ltd. (grant no. K22-0114-030).
Institutional Review Board Statement
Not applicable.
Informed Consent Statement
Not applicable.
Data Availability Statement
Data are contained within the article.
Conflicts of Interest
The authors declare no conflicts of interest.
References
- Zhou, F.; Yang, L.; Zhang, L.; Cao, J.; Zhang, H. Investigation of decomposition of dolomite and distribution of iodine migration during the calcination-digestion process of phosphate ore. Hydrometallurgy 2019, 188, 174–181. [Google Scholar] [CrossRef]
- Li, X.; Shu, J.; Zhao, H. A Critical Review on Approaches for phosphate Ore Flotation Tailings Treatment and Disposal Technology: Environment Properties, Comprehensive Utilization, and Resource Utilization. Ind. Eng. Chem. Res. 2024, 63, 1191–1199. [Google Scholar] [CrossRef]
- Wu, J.; Xiao, Y.; Yang, X.; Xu, D.; Zhang, Z.; Zhong, Y.; Wang, X. Leaching kinetics for magnesium extraction from phosphate rock in the nitric acid method. Miner. Eng. 2022, 189, 107894. [Google Scholar] [CrossRef]
- Yuan, X.M.; Xie, H.J.; Nie, D.P.; Zhang, Y.; Zhou, L.; Wu, Y.Y.; Wen, Z. Thermogravimetric and spectroscopic analyses along with the kinetic modeling of the pyrolysis of phosphate tailings. RSC Adv. 2023, 13, 16741–16748. [Google Scholar] [CrossRef] [PubMed]
- Li, P.Y.; Zhang, D.D.; Ning, P.; Zhang, H.F.; Wang, S.D.; Li, C.; Wu, Q.; Li, S.L. Study on resource utilization of phosphate tailings. Chem. Miner. Process. 2019, 48, 66–70. [Google Scholar] [CrossRef]
- Boujlel, H.; Daldoul, G.; Tlil, H.; Souissi, R.; Chebbi, N.; Fattah, N.; Souissi, F. The beneffciation processes of low-grade sedimentary phosphates of Tozeur-Nefta Deposit (Gafsa-Metlaoui basin: South of Tunisia). Minerals 2018, 9, 2–15. [Google Scholar] [CrossRef]
- Gu, K.; Lang, L.; Li, D.S. Preparation of magnesium oxysulfate cement with calcined phosphate tailings. J. Mater. Civ. Eng. 2022, 34, 04022358. [Google Scholar] [CrossRef]
- Moukannaa, S.; Nazari, A.; Bagheri, A.; Loutou, M.; Sanjayan, J.G.; Hakkou, R. Alkaline fused phosphate mine tailings for geopolymer mortar synthesis: Thermal stability, mechanical and microstructural properties. J. Non-Cryst. Solids 2019, 511, 76–85. [Google Scholar] [CrossRef]
- Gu, K.; Chen, B.; Yan, P.; Wang, J.M. Recycling of phosphate tailings and acid wastewater from phosphate chemical industrial chain to prepare a high valueadded magnesium oxysulfate cement. J. Clean. Prod. 2022, 369, 133343. [Google Scholar] [CrossRef]
- Li, P.; Zhang, J.; Luo, B.; Li, Y.; Ji, J.; He, D.; Tian, Q.; Chen, Y. Kinetics of carbothermal reduction process of different size phosphate rocks. Open Eng. 2021, 11, 281–293. [Google Scholar] [CrossRef]
- Wang, C.X.; Guo, Y.J.; Liu, L.F. Review and Prospect of research on resource utilization of phosphate tailings. Yunnan Chem. Technol. 2023, 50, 1–6. [Google Scholar] [CrossRef]
- Cui, Y.G.; Zhang, H.; Guo, J.K.; Wang, Y.Q.; Du, B.K.; Xue, J. Study on kinetics of heat treatment on high-magnesium phosphate tailings with different dolomite content. Ind. Miner. Process. 2023, 52, 65–70. [Google Scholar] [CrossRef]
- Wei, C.T.; Wang, Z.J.; Zhao, T. Comparative study on characteristics of high Mg-containing phosphate tailings in Yunnan, Guizhou and Sichuan. Phosphate Compd. Fertil. 2023, 38, 36–38. [Google Scholar] [CrossRef]
- Lei, S.; Gan, Y.; Cao, Z.; Wang, S.; Zhong, H. The preparation of high purity mgo and precision separation mechanism of mg and ca from dolomite. Min. Metall. Explor. 2020, 37, 1221–1230. [Google Scholar] [CrossRef]
- Royani, A.; Sulistiyono, E.; Prasetiyo, A.B.; Subagja, R.; Amal, M.I.; Herbirowo, S.; Hasbi, M.Y.; Lestari, Y.; Annur, D.; Malau, D.P. Extraction of magnesium from calcined dolomite ore using hydrochloric acid leaching. AIP Conf. Proc. 2018, 1964, 020017. [Google Scholar] [CrossRef]
- Xie, J.; Liu, S.; Tao, S.; Hu, H.; Liu, X. Study on preparation of magnesium carbonate hydroxide by carbonization method from high-Mg phosphate tailings. Inorg. Chem. Ind. 2021, 53, 135–139. [Google Scholar] [CrossRef]
- Yu, Y.H.; Du, C.M. Leaching of phosphorus from phosphate tailings and extraction of calcium phosphates: Toward comprehensive utilization of tailing resources. J. Environ. Manag. 2023, 347, 119159. [Google Scholar] [CrossRef]
- Wang, B.; Zhou, Z.; Xu, D.; Wu, J.; Yang, X.; Zhang, Z.; Yan, Z. A new enrichment method of medium–low grade phosphate ore with high silicon content. Miner. Eng. 2022, 181, 107548. [Google Scholar] [CrossRef]
- Yu, Y.H.; Du, C.M.; Zhang, Y.T.; Yuan, R.Y. Phosphorus recovery from phosphate tailings through a two-stage leaching-precipitation process: Toward the harmless and reduction treatment of P-bearing wastes. Environ. Manag. 2024, 248, 118328. [Google Scholar] [CrossRef]
- Lv, L.; Zheng, D.Y.; Tang, S.W.; Zhang, T.; Liu, W.Z. Phosphate ore particles dissolution kinetics in hydrochloric acid based on a structure-related segmented model. Powder Technol. 2021, 392, 141–149. [Google Scholar] [CrossRef]
- Huang, C.; Zong, J.; Xu, J.; Yan, F. Fabrication of tubular magnesium oxide nanocrystals via combining ammonium sulfate leaching and precipitation method and it’s crystal growth behavior. Powder Technol. 2017, 320, 80–88. [Google Scholar] [CrossRef]
- Zarghami, S.; Ghadirian, E.; Arastoopour, H.; Abbasian, J. Effect of Steam on Partial Decomposition of Dolomite. Ind. Eng. Chem. Res. 2015, 54, 5398–5406. [Google Scholar] [CrossRef]
- Bai, L.; Ma, Y.; Zhao, W.; Deng, Y.; Li, S. Optimization and mechanism in preparing active magnesium oxide from magnesite. J. Therm. Anal. Calorim. 2017, 129, 1103–1109. [Google Scholar] [CrossRef]
- Galai, H.; Pijolat, M.; Nahdi, K.; Trabelsi-Ayadi, M. Mechanism of growth of MgO and CaCO3 during a dolomite partial decomposition. Solid State Ion. 2007, 178, 1039–1047. [Google Scholar] [CrossRef]
- Samtani, M.; Dollimore, D.; Wilburn, F.W.; Alexander, K. Isolation and identification of the intermediate and final products in the thermal decomposition of dolomite in an atmosphere of carbon dioxide. Thermochim. Acta 2001, 367–368, 285–295. [Google Scholar] [CrossRef]
- Valverde, J.M.; Perejon, A.; Medina, S.; Perez-Maqueda, L.A. Thermal decomposition of dolomite under CO2: Insights from TGA and in situ XRD analysis. Phys. Chem. Chem. Phys. 2015, 17, 30162–30176. [Google Scholar] [CrossRef] [PubMed]
- Beruto, D.T.; Vecchiattini, R.; Giordani, M. Effect of mixtures of H2O (g) and CO2 (g) on the thermal half decomposition of dolomite natural stone in high CO2 pressure regime. Thermochim. Acta 2003, 404, 25–33. [Google Scholar] [CrossRef]
- Silakhori, M.; Jafarian, M.; Chinnici, A.; Saw, W.; Venkataraman, M.; Lipiński, W.; Nathan, G.J. Effects of steam on the kinetics of calcium carbonate calcination. Chem. Eng. Sci. 2021, 246, 116987. [Google Scholar] [CrossRef]
- Medina-Carrasco, S.; Valverde, J.M. In situ XRD analysis of dolomite calcination under CO2 in a humid environment. Crystengcomm 2020, 22, 6502–6516. [Google Scholar] [CrossRef]
- Deng, Y.; Liu, J.; Li, S.; Dewil, R.; Zhang, H.; Baeyens, J.; Mikulčić, H. The steam-assisted calcination of limestone and dolomite for energy savings and to foster solar calcination processes. J. Clean. Prod. 2022, 363, 132640. [Google Scholar] [CrossRef]
- Guo, S.; Wang, H.; Liu, D.; Yang, L.; Wei, X.; Wu, S. Understanding the Impacts of Impurities and Water Vapor on Limestone Calcination in a Laboratory-Scale Fluidized Bed. Energy Fuels 2015, 29, 7572–7583. [Google Scholar] [CrossRef]
- Giammaria, G.; Lefferts, L. Catalytic effect of water on calcium carbonate decomposition. J. CO2 Util. 2019, 33, 341–356. [Google Scholar] [CrossRef]
- Tone, T.; Hotta, M.; Koga, N. Acceleration Effect of Atmospheric Water Vapor on the Thermal Decomposition of Calcium Carbonate: A Comparison of Various Resources and Kinetic Parameterizations. ACS Sustain. Chem. Eng. 2022, 10, 11273–11286. [Google Scholar] [CrossRef]
- Li, Z.; Wang, Y.; Xu, K.; Yang, J.; Niu, S.; Yao, H. Effect of steam on CaO regeneration, carbonation and hydration reactions for CO2 capture. Fuel Process. Technol. 2016, 151, 101–106. [Google Scholar] [CrossRef]
- Wang, Y.; Thomson, W.J. The effects of steam and carbon dioxide on calcite decomposition using dynamic X-ray diffraction. Chem. Eng. Sci. 1995, 50, 1373–1382. [Google Scholar] [CrossRef]
- YB/T 4019-2006; Test Methods for Chemical Activity of Caustic Burned Magnesia. Standards Press of China: Beijing, China, 2007.
- Zhou, C.G.; Yrjas, P.; Engvall, K. Reaction mechanisms for H2O-enhanced dolomite calcination at high pressure. Fuel Process. Technol. 2021, 217, 106830. [Google Scholar] [CrossRef]
- He, D.; Ou, Z.; Qin, C.; Deng, T.; Yin, J.; Pu, G. Understanding the catalytic acceleration effect of steam on CaCO3 decomposition by density function theory. Chem. Eng. J. 2020, 379, 122348. [Google Scholar] [CrossRef]
- Zhang, J.; Li, R.; Nie, D.P.; Zhang, Y. Preparation of building ceramic bricks using waste residue obtained by mutual treatment of electrolytic manganese residue and red mud. Ceram. Int. 2023, 49, 22492–22505. [Google Scholar] [CrossRef]
- Yan, M.; Huang, J.; Yang, M.; Zhang, H.; Zhu, Y.; Zhou, N.; Wang, J. Synthesis and magnetic studies of Mn/Fe/Co doping V2SnC ternary ceramics. Ceram. Int. 2023, 49, 13916–13923. [Google Scholar] [CrossRef]
- Chang, J.; Srinivasakannan, C.; Sun, X.X.; Jia, F.K. Optimization of microwave-assisted manganese leaching from electrolyte manganese residue. Green Process. Synth. 2020, 9, 2–12. [Google Scholar] [CrossRef]
- Yang, J.; Ma, L.; Yang, J.; Guo, Z.; Liu, H.; Zhang, W. Chemical looping gasification of phosphogypsum as an oxygen carrier: The Ca and S migration mechanism using the DFT method. Sci. Total Environ. 2019, 689, 854–864. [Google Scholar] [CrossRef] [PubMed]
- Li, R.; He, W.L.; Duan, J.F.; Feng, S.X.; Zhu, Z.Y.; Zhang, Y. Existing form and distribution of fluorine and phosphate in phosphate rock acid-insoluble residue. Environ. Sci. Pollut. Res. 2022, 29, 7758–7771. [Google Scholar] [CrossRef] [PubMed]
- Zhang, H.; Wang, W.; Li, L.; Liu, J. Starch-Assisted Synthesis and Characterization of Layered Calcium Hydroxide Particles. J. Inorg. Organomet. Polym. Mater. 2018, 28, 2399–2406. [Google Scholar] [CrossRef]
- Costagliola, M.A.; Prati, M.V.; Perretta, G. Post combustion CO2 capture with calcium and lithium hydroxide. Sci. Rep. 2022, 12, 10518. [Google Scholar] [CrossRef]
- Huang, L.; Yang, Z.; Wang, S. Influence of calcination temperature on the structure and hydration of MgO. Constr. Build. Mater. 2020, 262, 120776. [Google Scholar] [CrossRef]
Figure 1.
XRD pattern of the phosphate tailings.

Figure 2.
Process flow chart of phosphate tailing pyrolysis experiment.

Figure 3.
Gibbs free energy versus temperature for each reaction during pyrolysis of phosphate tailings.
Figure 3.
Gibbs free energy versus temperature for each reaction during pyrolysis of phosphate tailings.

Figure 4.
Variation in thermodynamic equilibrium composition of phosphate tailings decomposition with temperature.
Figure 4.
Variation in thermodynamic equilibrium composition of phosphate tailings decomposition with temperature.

Figure 5.
TG (a) and TG-DTG (b) curves of phosphate tailings under different gas atmospheres.

Figure 6.
XRD patterns of pyrolyzed phosphate tailings at different H2O pressures.

Figure 7.
Influence of H2O pressure on pyrolysis properties of phosphate tailings.

Figure 8.
XRD patterns of pyrolyzed phosphate tailings at different temperatures.

Figure 9.
Influence of pyrolysis temperature on pyrolysis properties of phosphate tailings.

Figure 10.
XRD patterns of pyrolyzed phosphate tailings at different holding times.

Figure 11.
Influence of holding time on pyrolysis properties of phosphate tailings.

Figure 12.
XRD patterns of pyrolyzed phosphate tailings at different heating rates.

Figure 13.
Influence of heating rate on pyrolysis properties of phosphate tailings.

Figure 14.
Diagnostic modeling of MgO yield in pyrolysis phosphate tailings. (a) Residuals and predicted values; (b) residuals and number of experiments; (c) actual and predicted values.
Figure 14.
Diagnostic modeling of MgO yield in pyrolysis phosphate tailings. (a) Residuals and predicted values; (b) residuals and number of experiments; (c) actual and predicted values.

Figure 15.
Interaction of various factors on MgO yield ((a) A + B; (b) A + C; (c) B + C).

Figure 16.
Rietveld refinement of pyrolyzed phosphate tailings under optimal pyrolysis conditions.

Figure 17.
High-resolution XPS spectra of Ca2p, Mg1s, Si2p, F1s and P2p in pyrolytic phosphate tailings under optimal pyrolysis conditions.
Figure 17.
High-resolution XPS spectra of Ca2p, Mg1s, Si2p, F1s and P2p in pyrolytic phosphate tailings under optimal pyrolysis conditions.

Figure 18.
Microstructure of pyrolyzed phosphate tailings.

Figure 19.
Quantitative EPMA scatter plot data for Ca, Mg, Si, F, P, K and Na (at.%).

Figure 20.
EPMA-mapped images of distribution of Ca, Mg, Si, F and P.


Table 1.
Chemical composition of phosphate tailings (mass%).
| CaO | MgO | P2O5 | SiO2 | Fe2O3 | Al2O3 | F | SO3 | Na2O | K2O | CO2 | Others |
|---|---|---|---|---|---|---|---|---|---|---|---|
| 33.96 | 18.49 | 5.58 | 1.97 | 0.26 | 0.29 | 0.61 | 0.70 | 0.04 | 0.01 | 38.03 | 0.06 |
Table 2.
The possible reaction equations of thermal decomposition of the phosphate tailings in a H2O atmosphere.
Table 2.
The possible reaction equations of thermal decomposition of the phosphate tailings in a H2O atmosphere.
| Reaction | Process |
|---|---|
| R1 | CaMg(CO3)2 + 2H2O = Ca(OH)2 + Mg(OH)2 + 2CO2(g) |
| R2 | CaMg(CO3)2 + H2O = Ca(OH)2 + MgO + 2CO2(g) |
| R3 | CaMg(CO3)2 + H2O = CaO + Mg(OH)2 + 2CO2(g) |
| R4 | Mg(OH)2 = MgO + H2O(g) |
| R5 | Ca(OH)2 = CaO + H2O(g) |
| R6 | Mg(OH)2 + SiO2 = MgSiO3 + H2O(g) |
| R7 | Ca(OH)2 + SiO2 = CaSiO3 + H2O(g) |
| R8 | MgO + SiO2 = MgSiO3 |
| R9 | CaO + SiO2 = CaSiO3 |
| R10 | 2Ca5(PO4)3F + 2H2O = Ca(OH)2 + 2HF(g) + 3Ca3(PO4)2 |
Table 3.
Factors and levels designed with Box–Behnken.
| Variable | Symbol Coded Level | |||
|---|---|---|---|---|
| Uncoded Coded | Low Center High | |||
| −1 | 0 | 1 | ||
| H2O pressure | A | 0.00 | 0.02 | 0.04 |
| Temperature | B | 700 | 750 | 800 |
| Holding time | C | 0.5 | 1 | 1.5 |
Table 4.
Box–Behnken experimental results.
| Std No. | Coded Level of Variables | Actual Level of Variables | Yield of MgO (%) | ||||
|---|---|---|---|---|---|---|---|
| A | B | C | A | B | C | ||
| (1) | 0 | 0 | 0 | 0.02 | 750 | 1 | 96.6 |
| (2) | 1 | 0 | −1 | 0.04 | 750 | 0.5 | 75.8 |
| (3) | 0 | 1 | 1 | 0.02 | 800 | 1.5 | 92.6 |
| (4) | −1 | −1 | 0 | 0.00 | 700 | 1 | 60.2 |
| (5) | 1 | −1 | 0 | 0.04 | 700 | 1 | 73.9 |
| (6) | 0 | 0 | 0 | 0.02 | 750 | 1 | 96.9 |
| (7) | 0 | −1 | −1 | 0.02 | 700 | 0.5 | 80.1 |
| (8) | 0 | 0 | 0 | 0.02 | 750 | 1 | 96.6 |
| (9) | −1 | 1 | 0 | 0.00 | 800 | 1 | 76.1 |
| (10) | −1 | 0 | −1 | 0.00 | 750 | 0.5 | 69.1 |
| (11) | 0 | 0 | 0 | 0.02 | 750 | 1 | 95.9 |
| (12) | −1 | 0 | 1 | 0.00 | 750 | 1.5 | 70.6 |
| (13) | 1 | 1 | 0 | 0.04 | 800 | 1 | 77.2 |
| (14) | 0 | −1 | 1 | 0.02 | 700 | 1.5 | 83.3 |
| (15) | 0 | 0 | 0 | 0.02 | 750 | 1 | 96.6 |
| (16) | 0 | 1 | −1 | 0.02 | 800 | 0.5 | 91.9 |
| (17) | 1 | 0 | 1 | 0.04 | 750 | 1.5 | 78.7 |
Table 5.
Analysis of variance of MgO yield response surface.
| Source | Sum of Squares | df | Mean Square | F-Value | p-Value | |
|---|---|---|---|---|---|---|
| Model | 2203.54 | 9 | 244.84 | 1709.15 | <0.0001 | significant |
| A | 109.11 | 1 | 109.11 | 761.66 | <0.0001 | significant |
| B | 204.47 | 1 | 204.47 | 1427.34 | <0.0001 | significant |
| C | 8.25 | 1 | 8.25 | 57.57 | 0.0001 | significant |
| AB | 40.04 | 1 | 40.04 | 279.51 | <0.0001 | significant |
| AC | 0.4153 | 1 | 0.4153 | 2.90 | 0.1324 | |
| BC | 1.68 | 1 | 1.68 | 11.70 | 0.0111 | significant |
| A2 | 1533.08 | 1 | 1533.08 | 10702.03 | <0.0001 | significant |
| B2 | 133.67 | 1 | 133.67 | 933.09 | <0.0001 | significant |
| C2 | 66.01 | 1 | 66.01 | 460.77 | <0.0001 | significant |
| Lack of Fit | 0.4931 | 3 | 0.1644 | 1.29 | 0.3299 | not significant |
| Pure Error | 0.5096 | 4 | 0.1274 | |||
| R2 | 0.9995 | |||||
| Adjusted R2 | 0.9990 | |||||
| Predicted R2 | 0.9961 |
Table 6.
Validation of optimization results of experiment.
| 1 | 2 | 3 | Average | |
|---|---|---|---|---|
| CaO | 98.4 | 97.8 | 98.2 | 98.1 |
| MgO | 97.2 | 97.6 | 97.3 | 97.3 |
| Activity of MgO | 31.9 | 31.4 | 31.6 | 31.6 |
Table 7.
XRD fine-modified fitted crystal structure data.
| Mineral Phase | Lattices Parameters | Space Group | Volume (Å) | |||||
|---|---|---|---|---|---|---|---|---|
| a (Å) | b (Å) | c (Å) | α (°) | β (°) | γ (°) | |||
| Ca5(PO4)3F | 9.39121(15) | 9.39121(15) | 6.89328(16) | 90 | 90 | 120 | P63/m | 526.502(21) |
| Ca(OH)2 | 3.59186(7) | 3.59185(7) | 4.9213(2) | 90 | 90 | 120 | P-3m1 | 54.985(3) |
| MgO | 4.21322(5) | 4.21322(5) | 4.21322(5) | 90 | 90 | 90 | Fm-3m | 74.790(3) |
| SiO2 | 4.39251(90) | 4.39251(90) | 5.0433(22) | 90 | 90 | 120 | P3221 | 84.269(50) |
| SiO2-low | 4.9195(14) | 4.9195(14) | 5.4032(26) | 90 | 90 | 120 | P3121 | 113.247(86) |
Disclaimer/Publisher’s Note: The statements, opinions and data contained in all publications are solely those of the individual author(s) and contributor(s) and not of MDPI and/or the editor(s). MDPI and/or the editor(s) disclaim responsibility for any injury to people or property resulting from any ideas, methods, instructions or products referred to in the content. |
© 2024 by the authors. Licensee MDPI, Basel, Switzerland. This article is an open access article distributed under the terms and conditions of the Creative Commons Attribution (CC BY) license (https://creativecommons.org/licenses/by/4.0/).
Share and Cite
MDPI and ACS Style
Yang, Y.; Zhang, Y.; Nie, D.; Sun, C.; Cao, J. Study on Pyrolysis Characteristics of Phosphate Tailings under H2O Atmosphere. Materials 2024, 17, 2012. https://0-doi-org.brum.beds.ac.uk/10.3390/ma17092012
AMA Style
Yang Y, Zhang Y, Nie D, Sun C, Cao J. Study on Pyrolysis Characteristics of Phosphate Tailings under H2O Atmosphere. Materials. 2024; 17(9):2012. https://0-doi-org.brum.beds.ac.uk/10.3390/ma17092012
Chicago/Turabian StyleYang, Yanping, Yu Zhang, Dengpan Nie, Chenxin Sun, and Jianxin Cao. 2024. "Study on Pyrolysis Characteristics of Phosphate Tailings under H2O Atmosphere" Materials 17, no. 9: 2012. https://0-doi-org.brum.beds.ac.uk/10.3390/ma17092012
Note that from the first issue of 2016, this journal uses article numbers instead of page numbers. See further details here.