
Grid Quality Services from Smart Boilers: Experimental Verification on Realistic Scenarios for Micro-Grids with Demand-Side Management Oriented to Self-Consumption

Abstract
:1. Introduction
2. Smart Boiler Concept
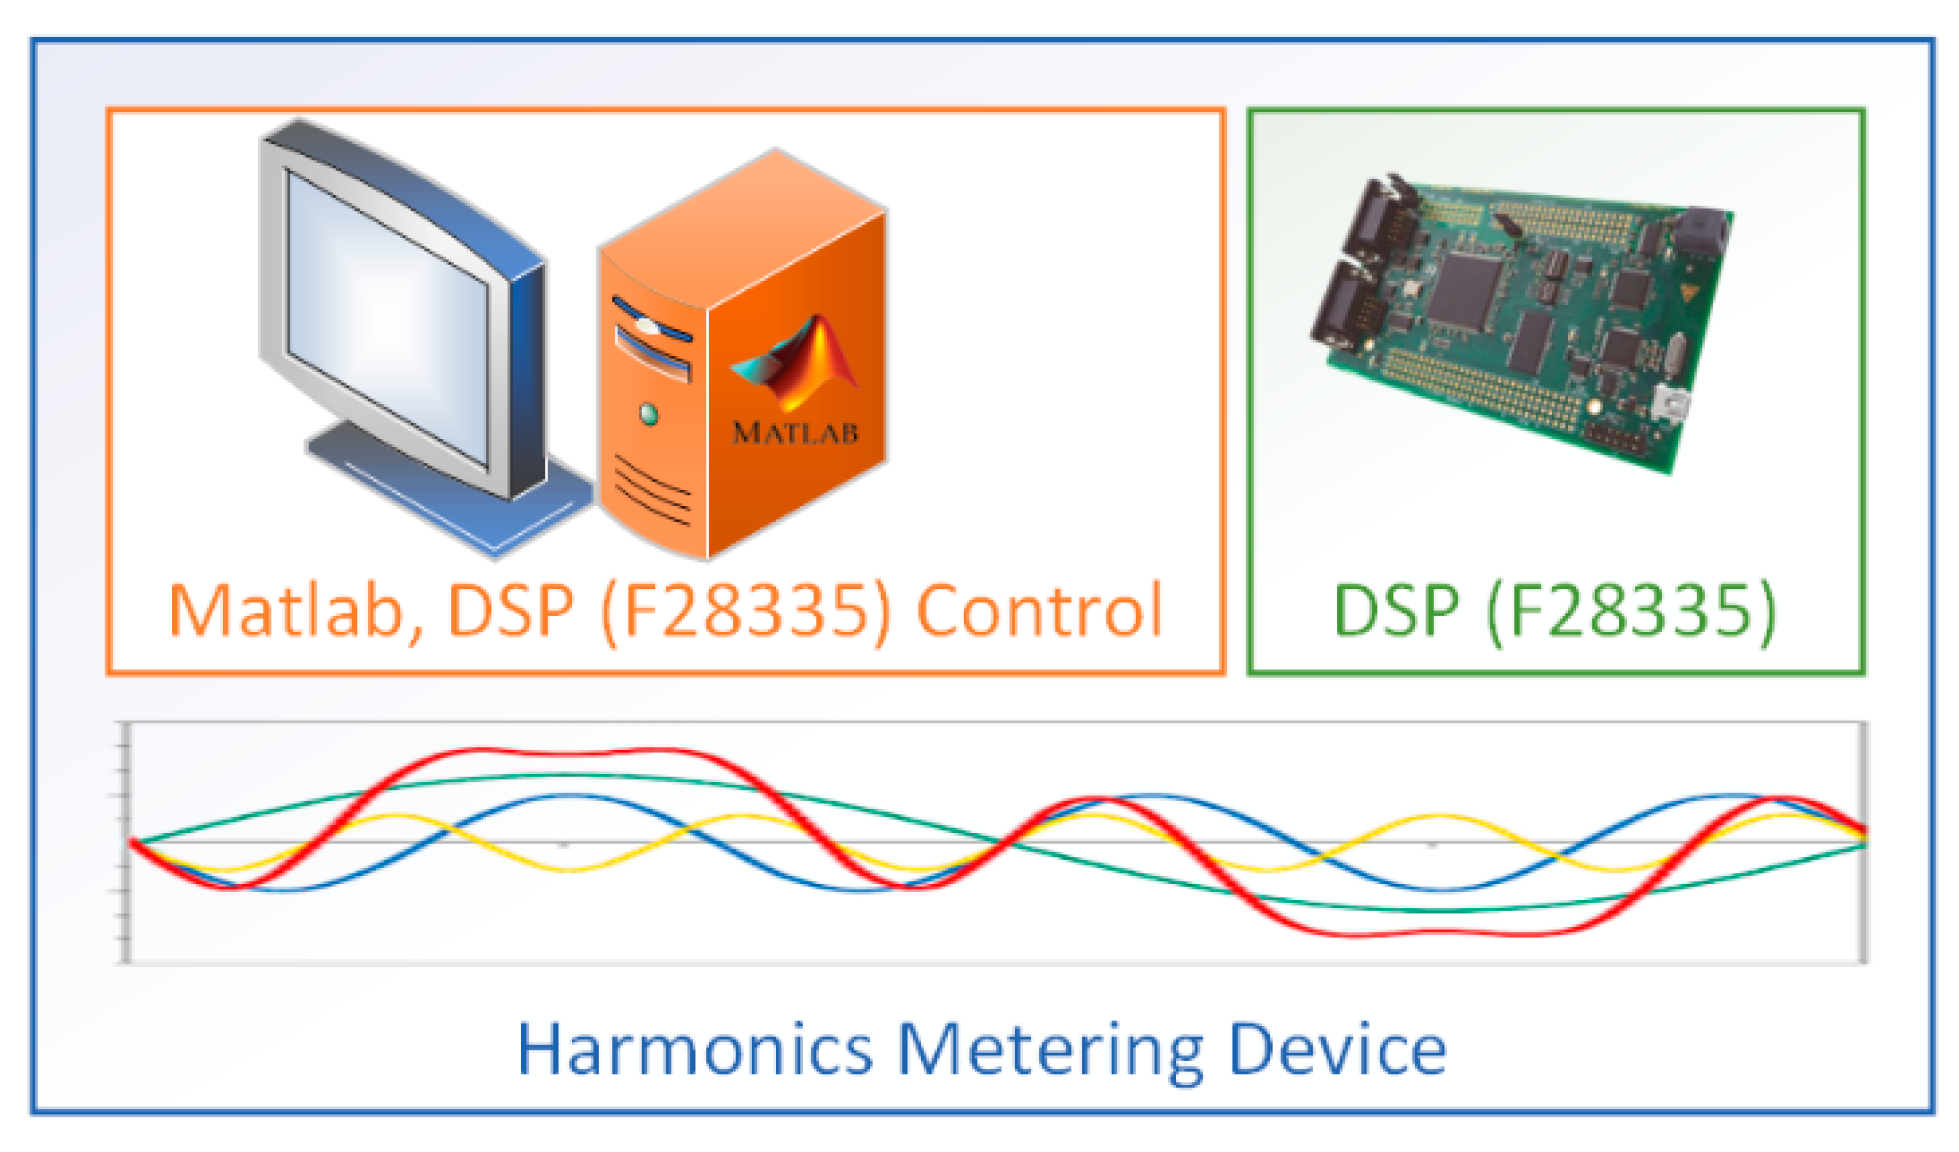
3. Smart Boiler Hardware and Control
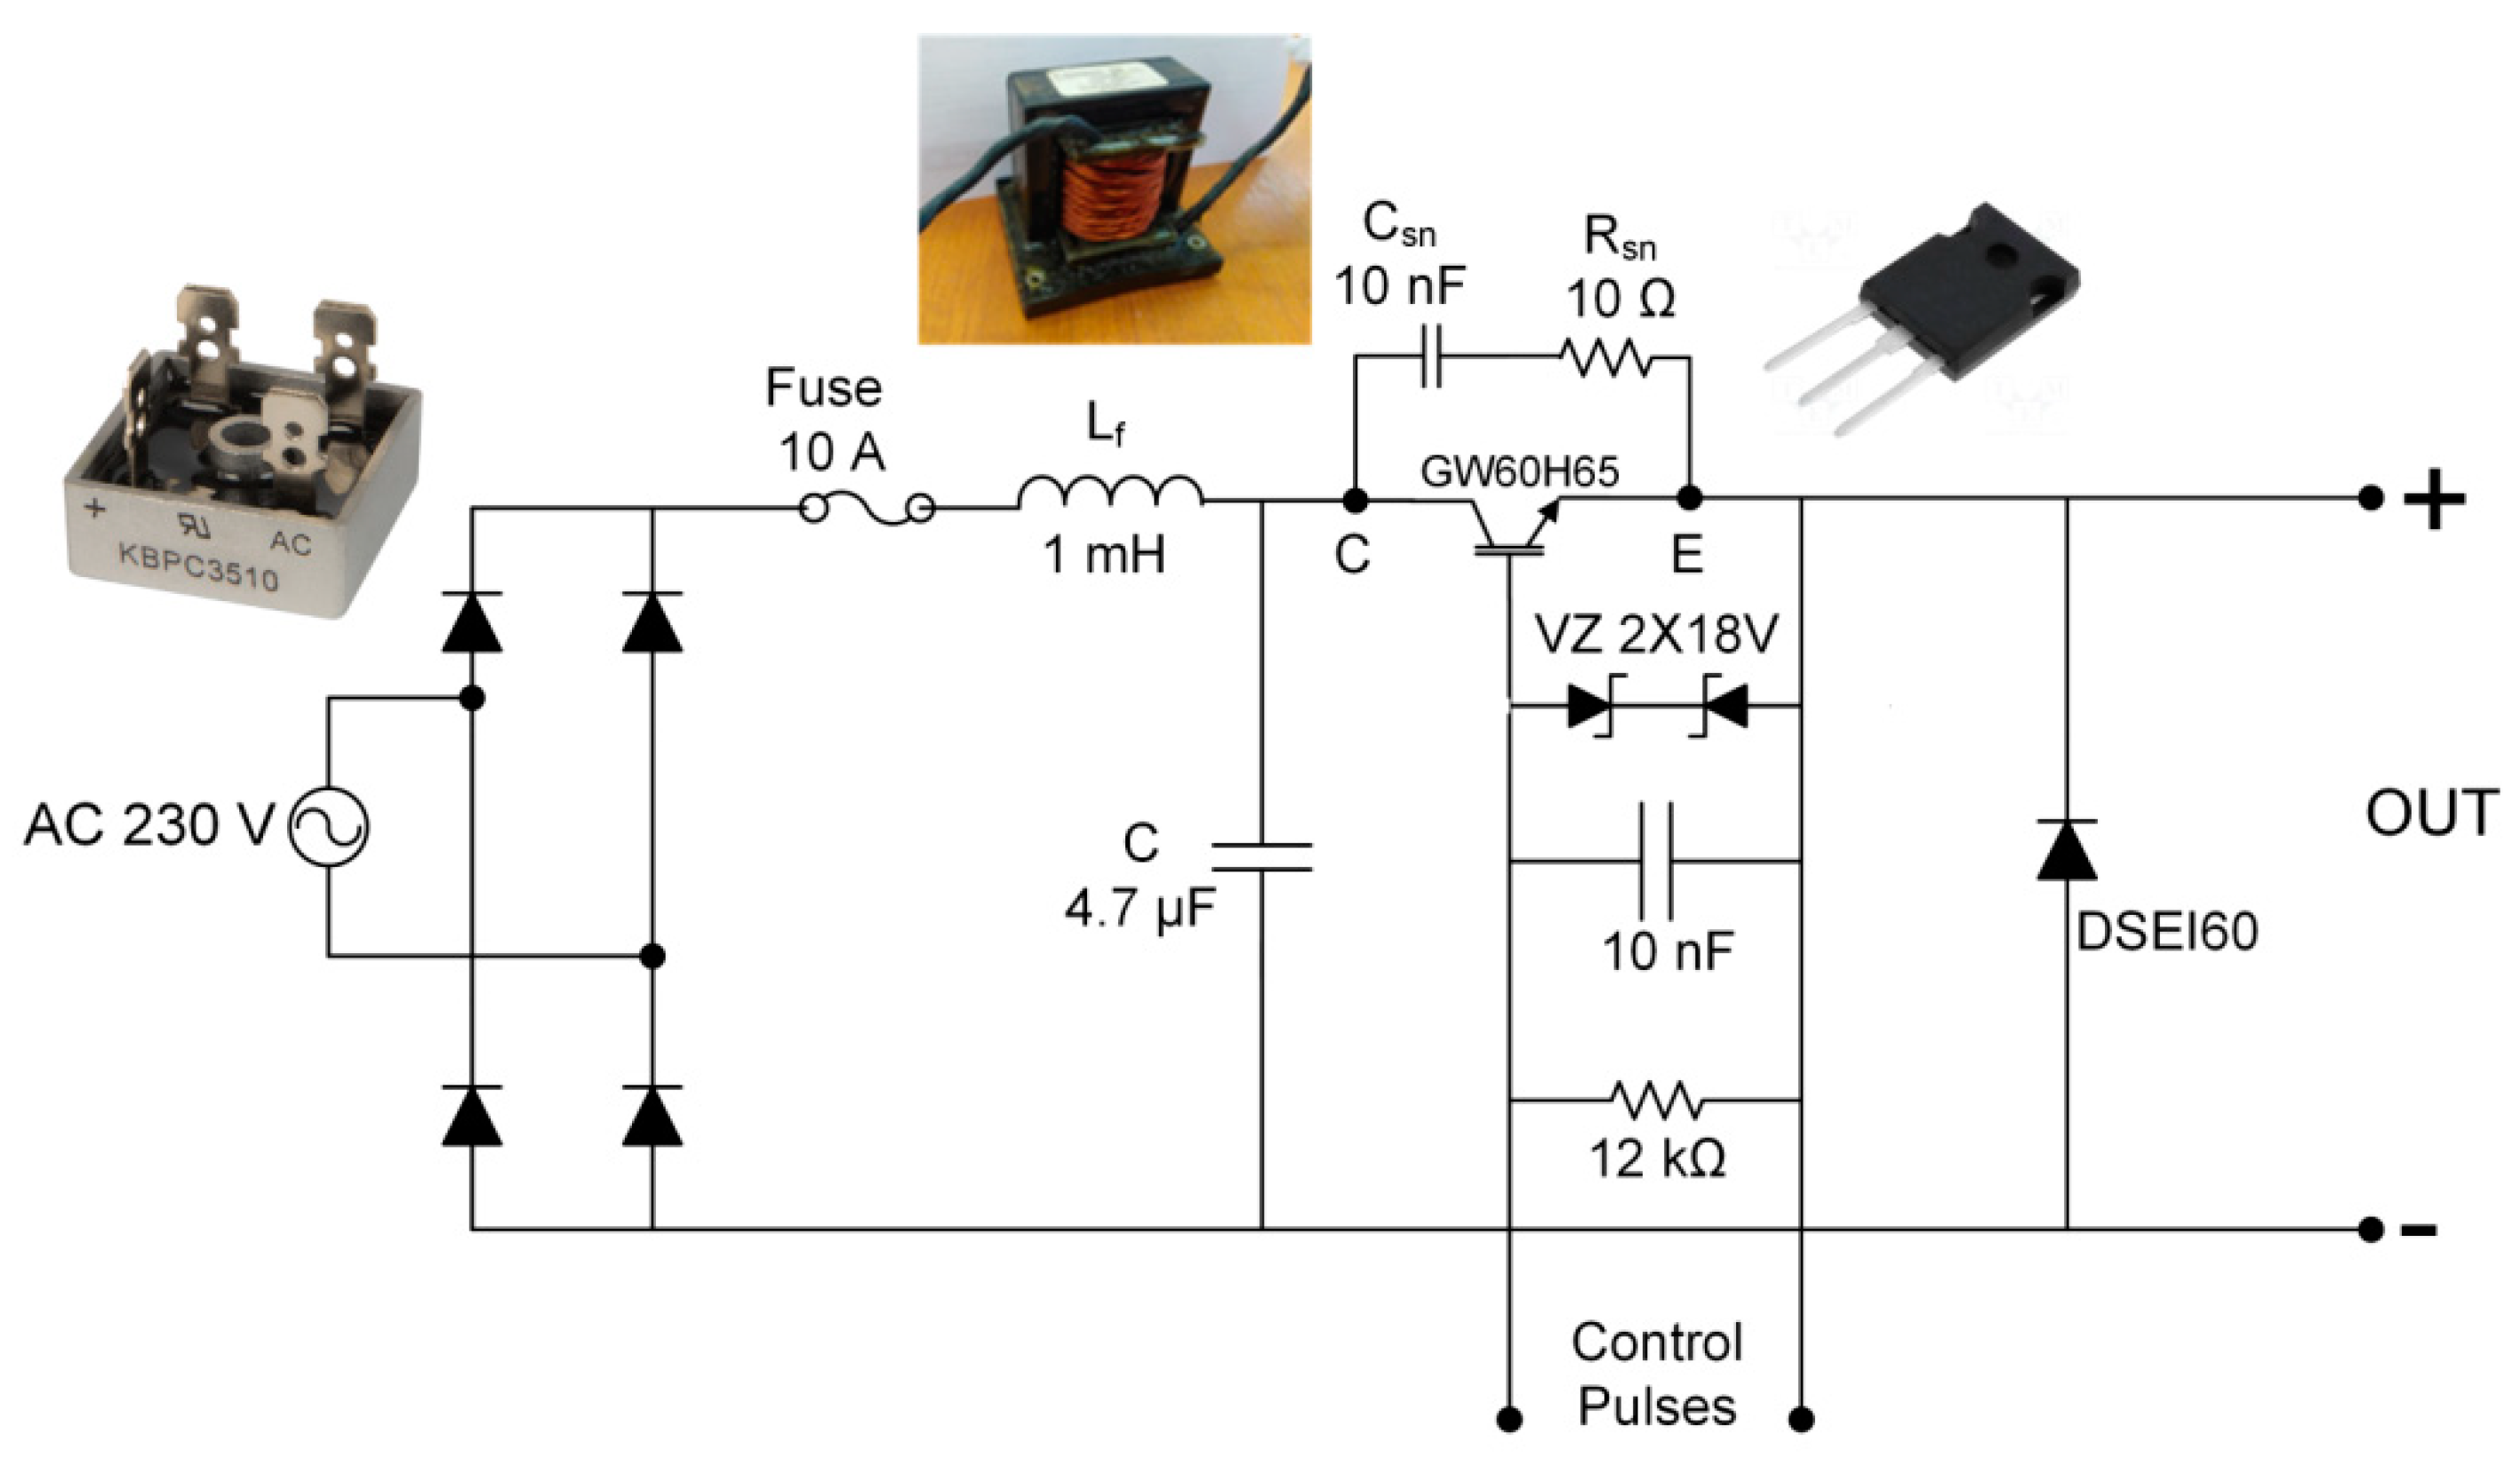
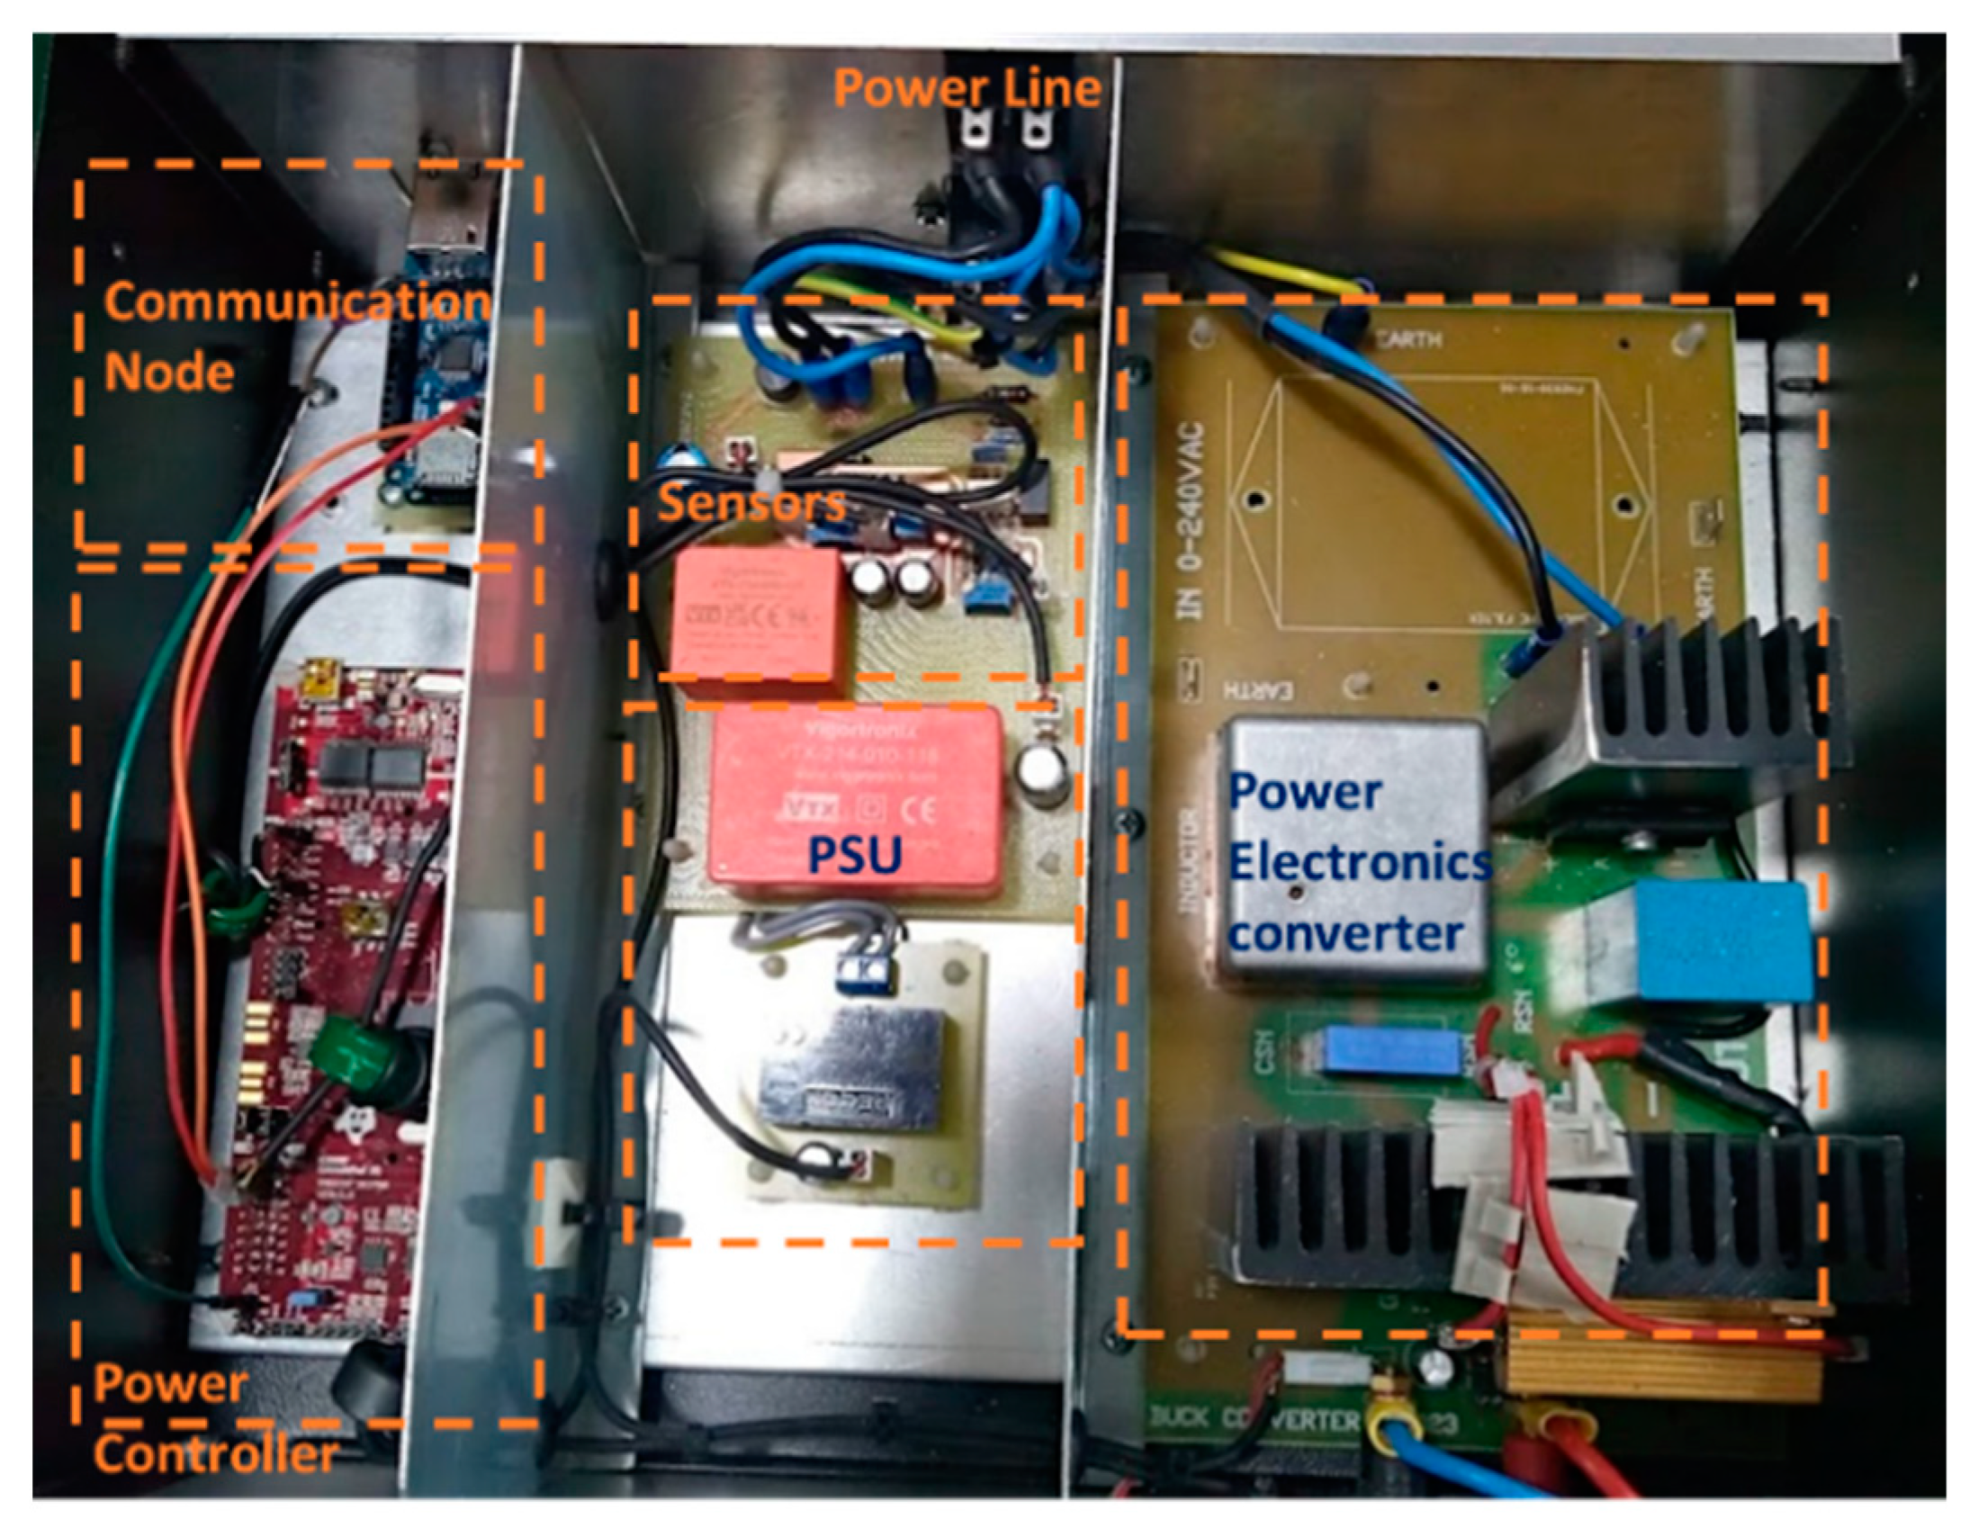
3.1. Hardware of the Smart Boiler Kit
3.2. Control Scheme
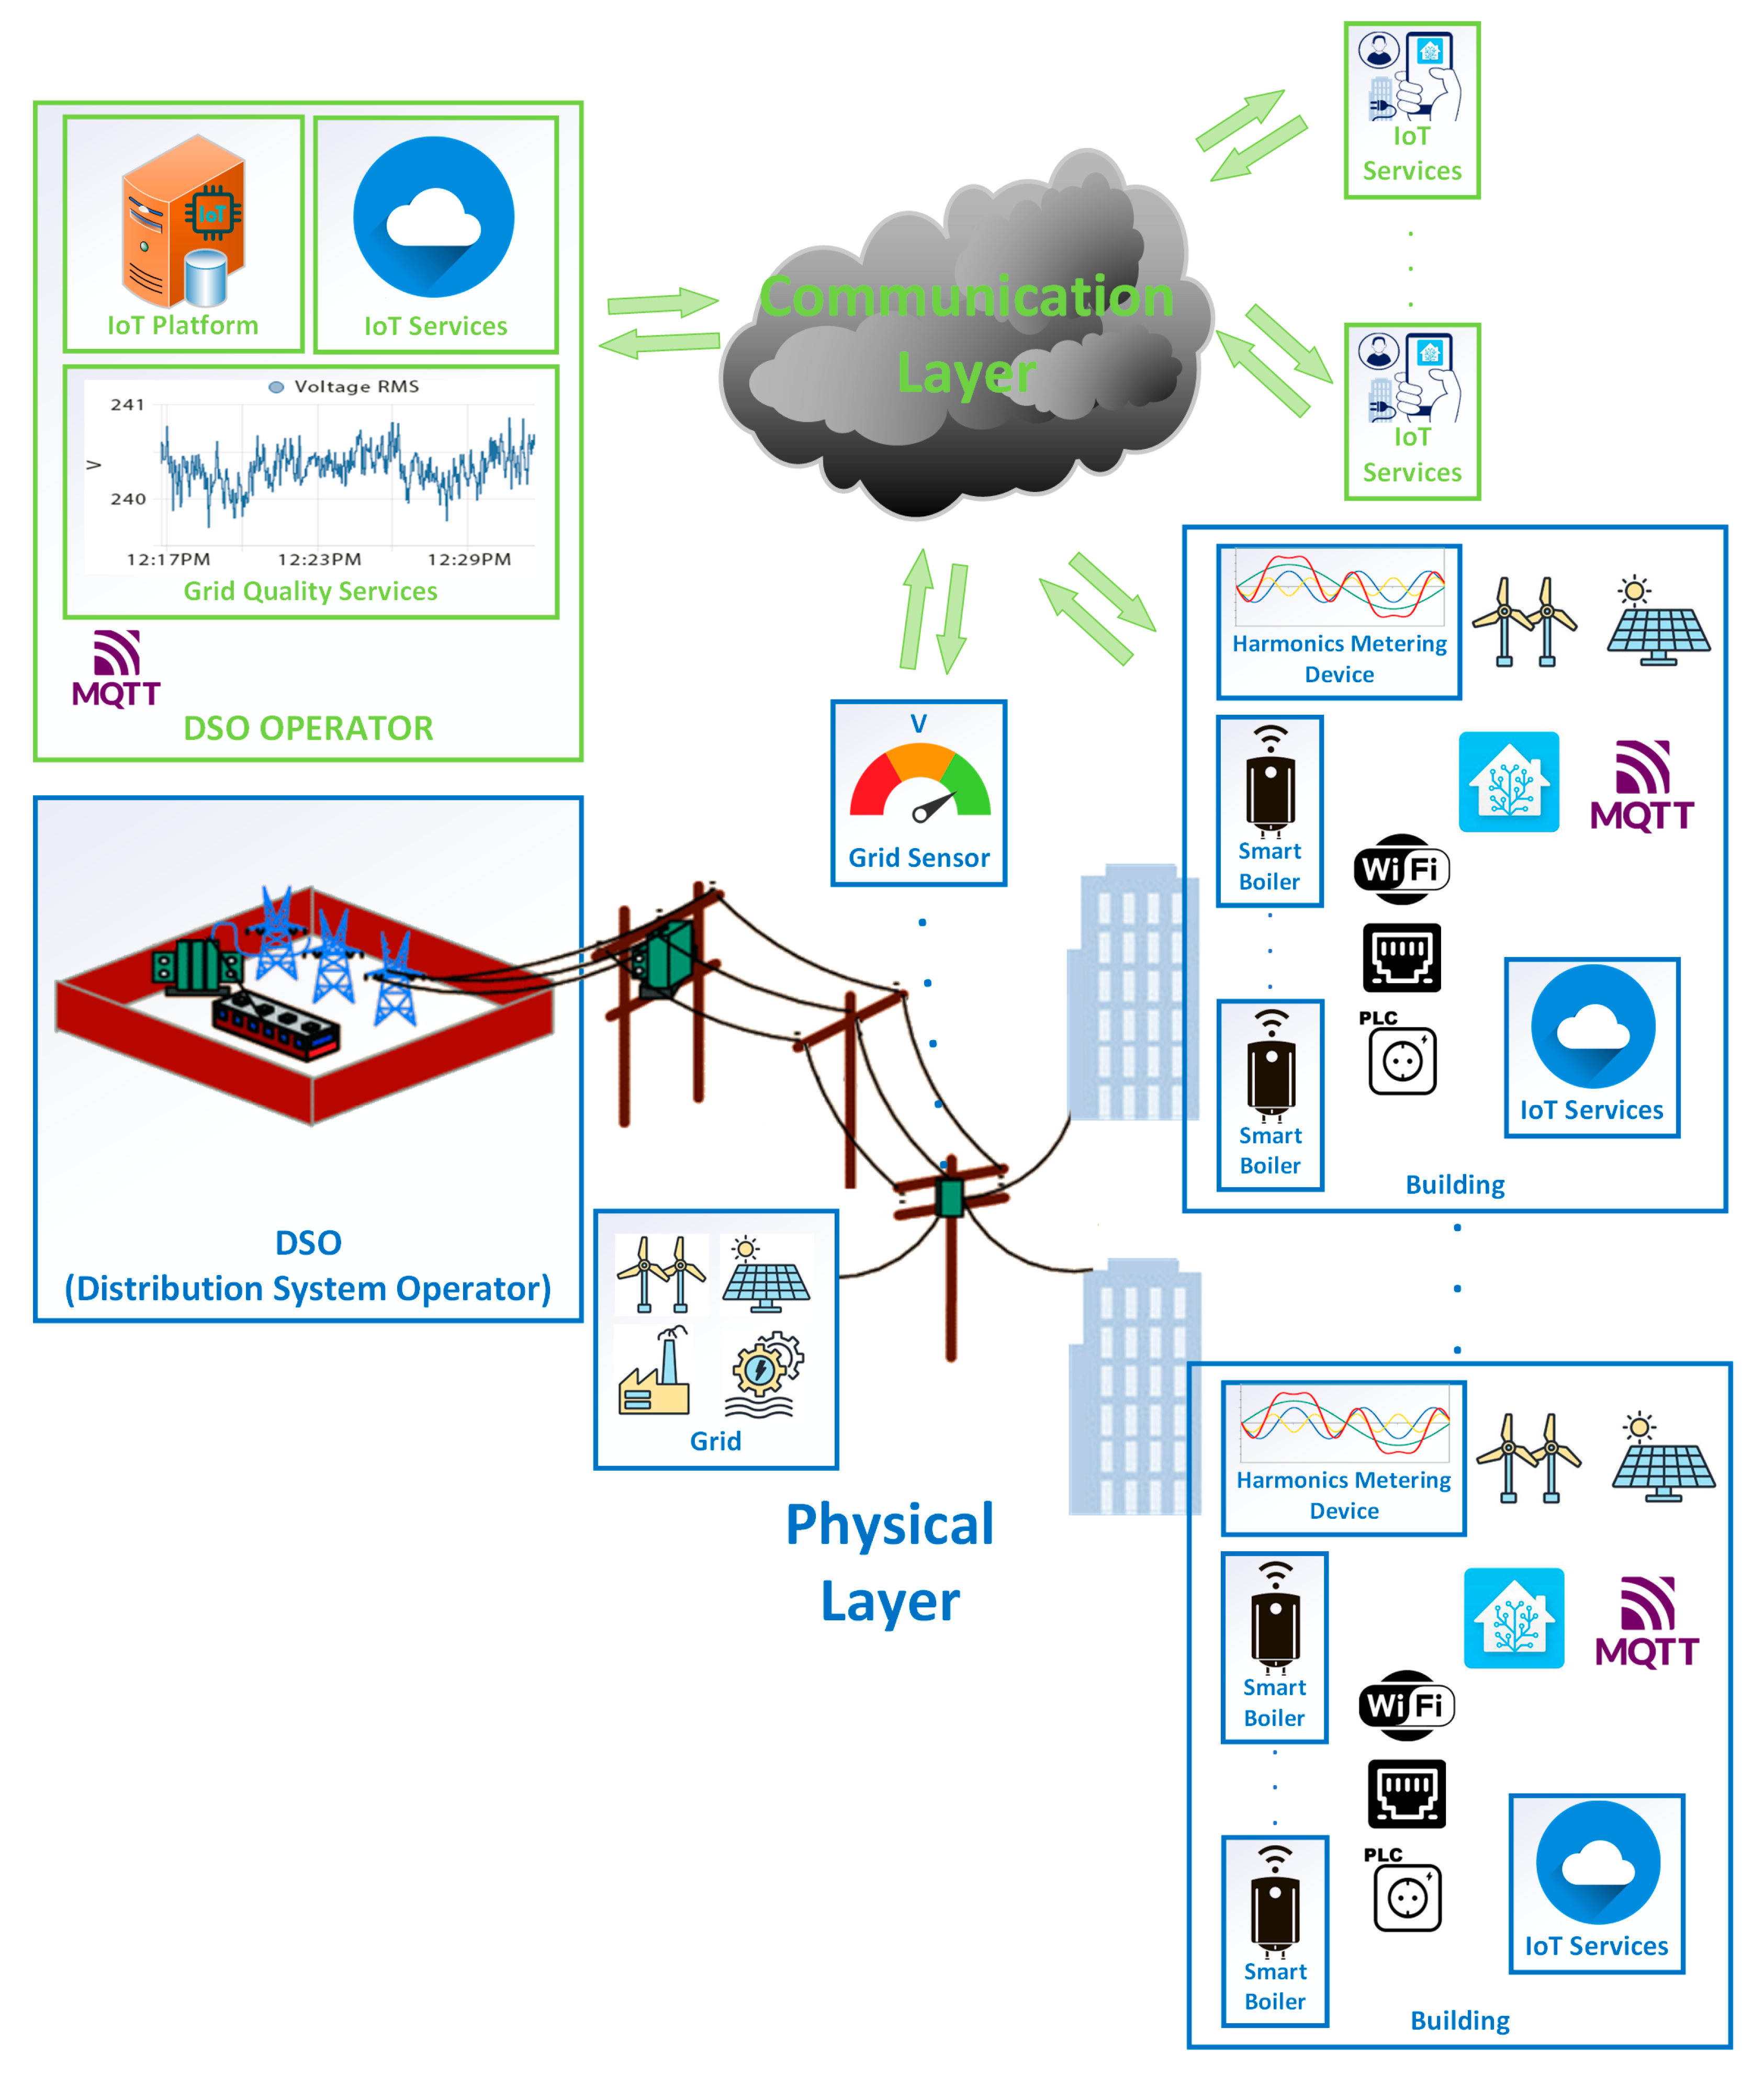
4. Telecommunication Aspects of the Widespread Application of Smart Boilers
5. Testbed for the Experimental Investigation
5.1. Overview
- A test network for the SBs, containing metering and supply equipment for the analysis of both their thermal and their electric response;
- A PV array of 1.36 kWp;
- Three power supplies (DC and AC) and miniature grid elements for the emulation of radial or meshed grids;
- Grid analyzer;
- Controllable converter for PV electricity generation with in-lab developed control software;
- Two SB kits, one coupled with an actual 150lt boiler system and the other one with an equivalent, air-cooled, laboratory resistive load.
5.2. Feeder
5.3. Point of Common Coupling
5.4. Load Groups
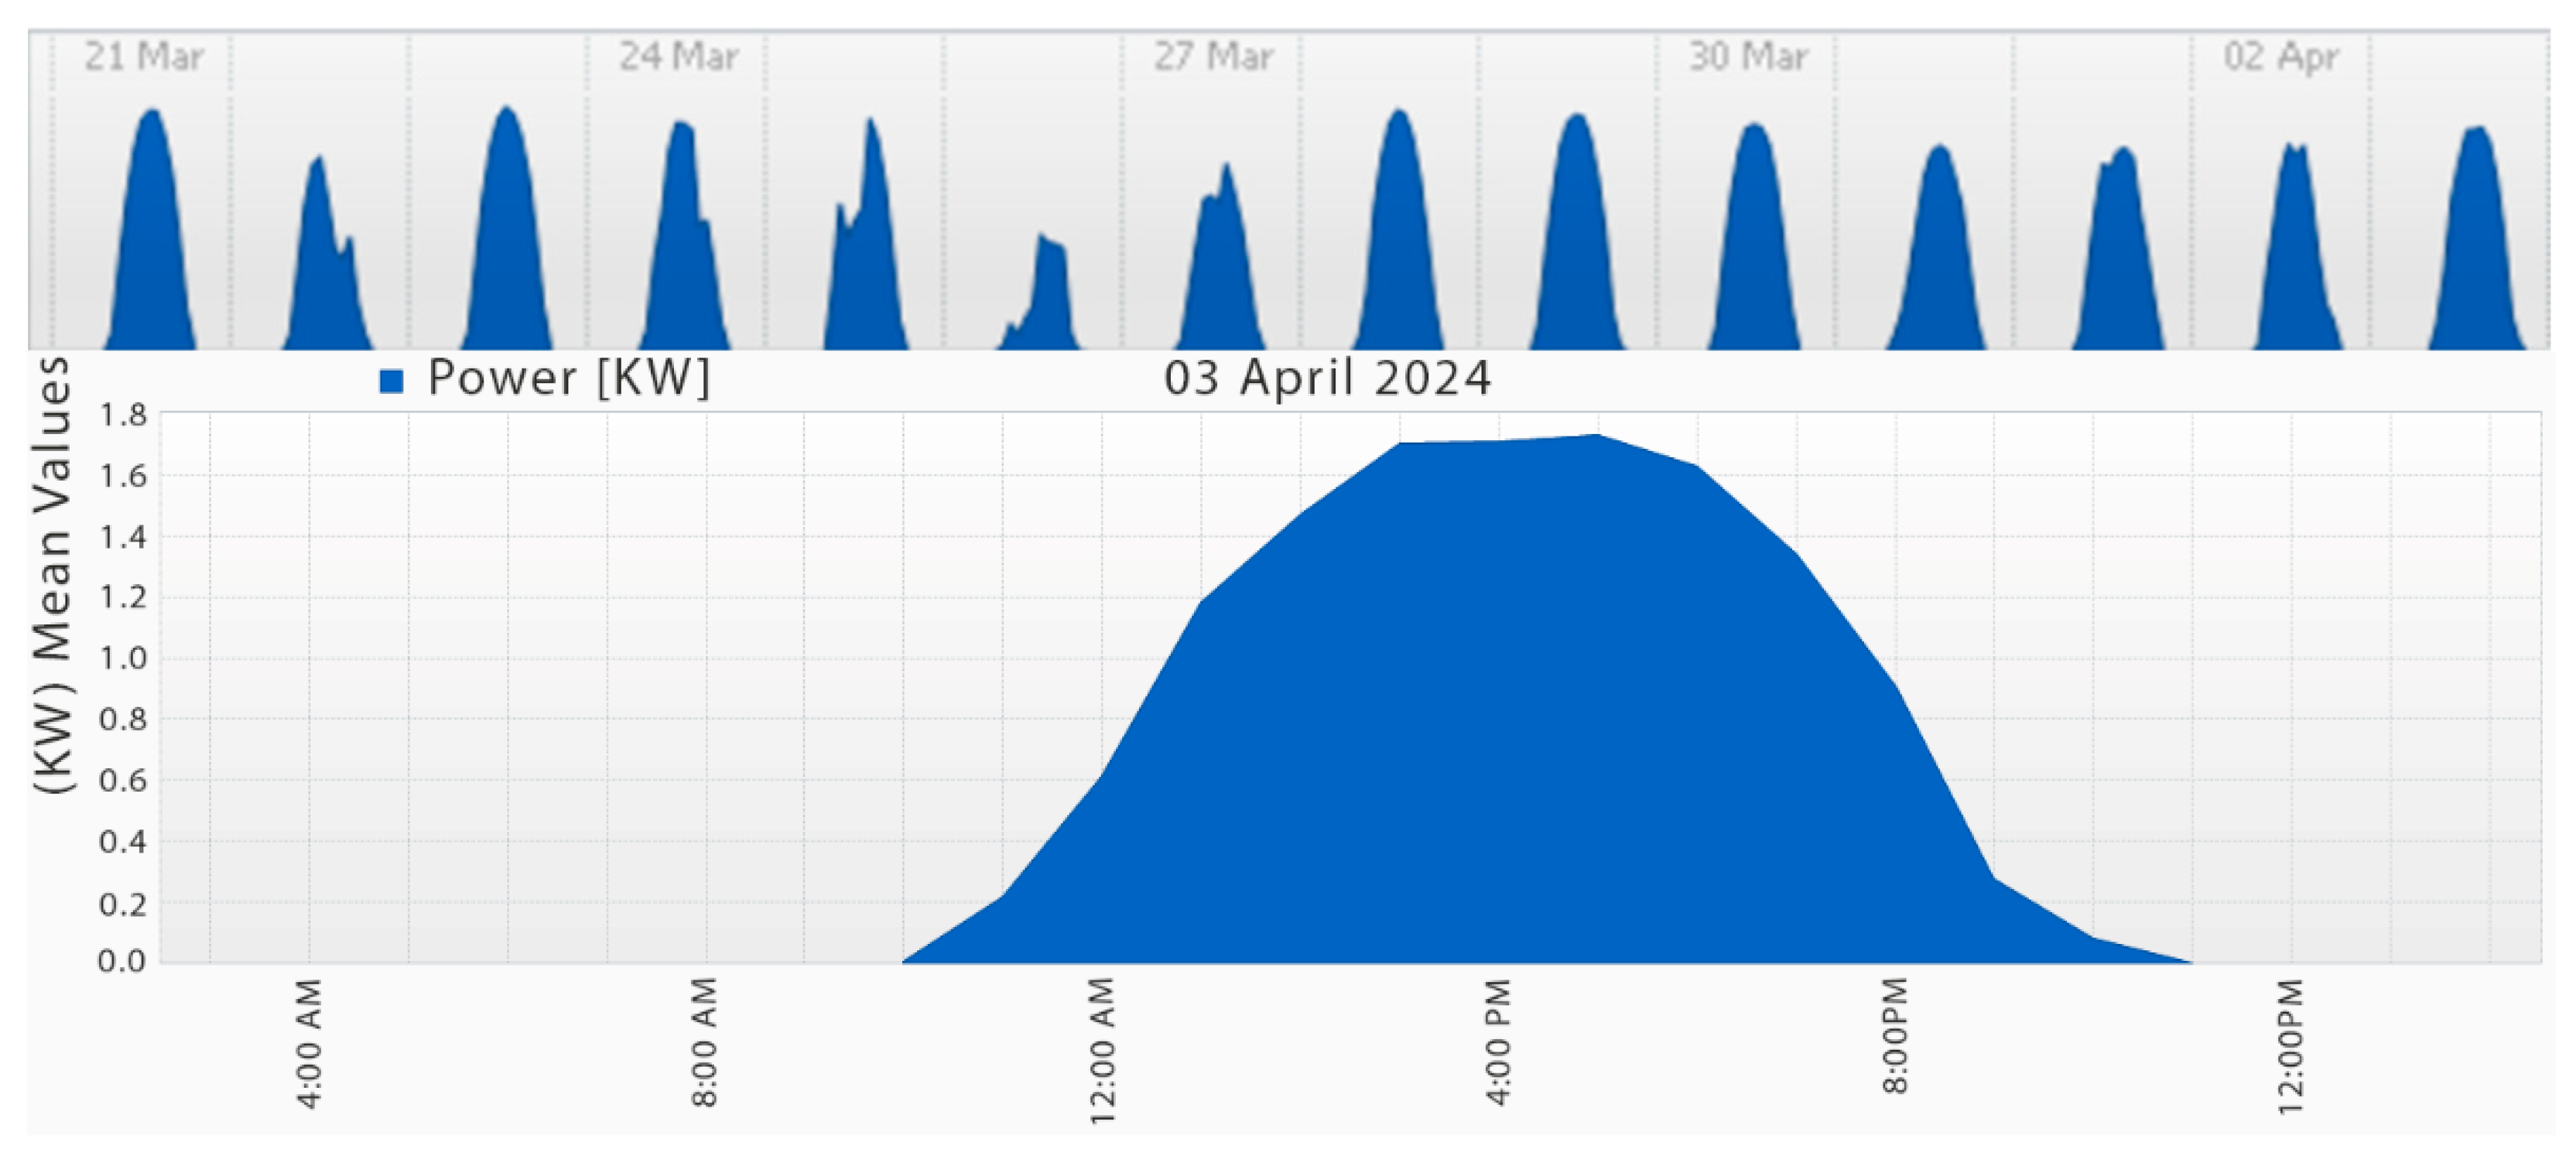
5.5. PV Array and Inverter
5.6. PV Monitoring System
5.7. Step Loads
5.8. Automation Box
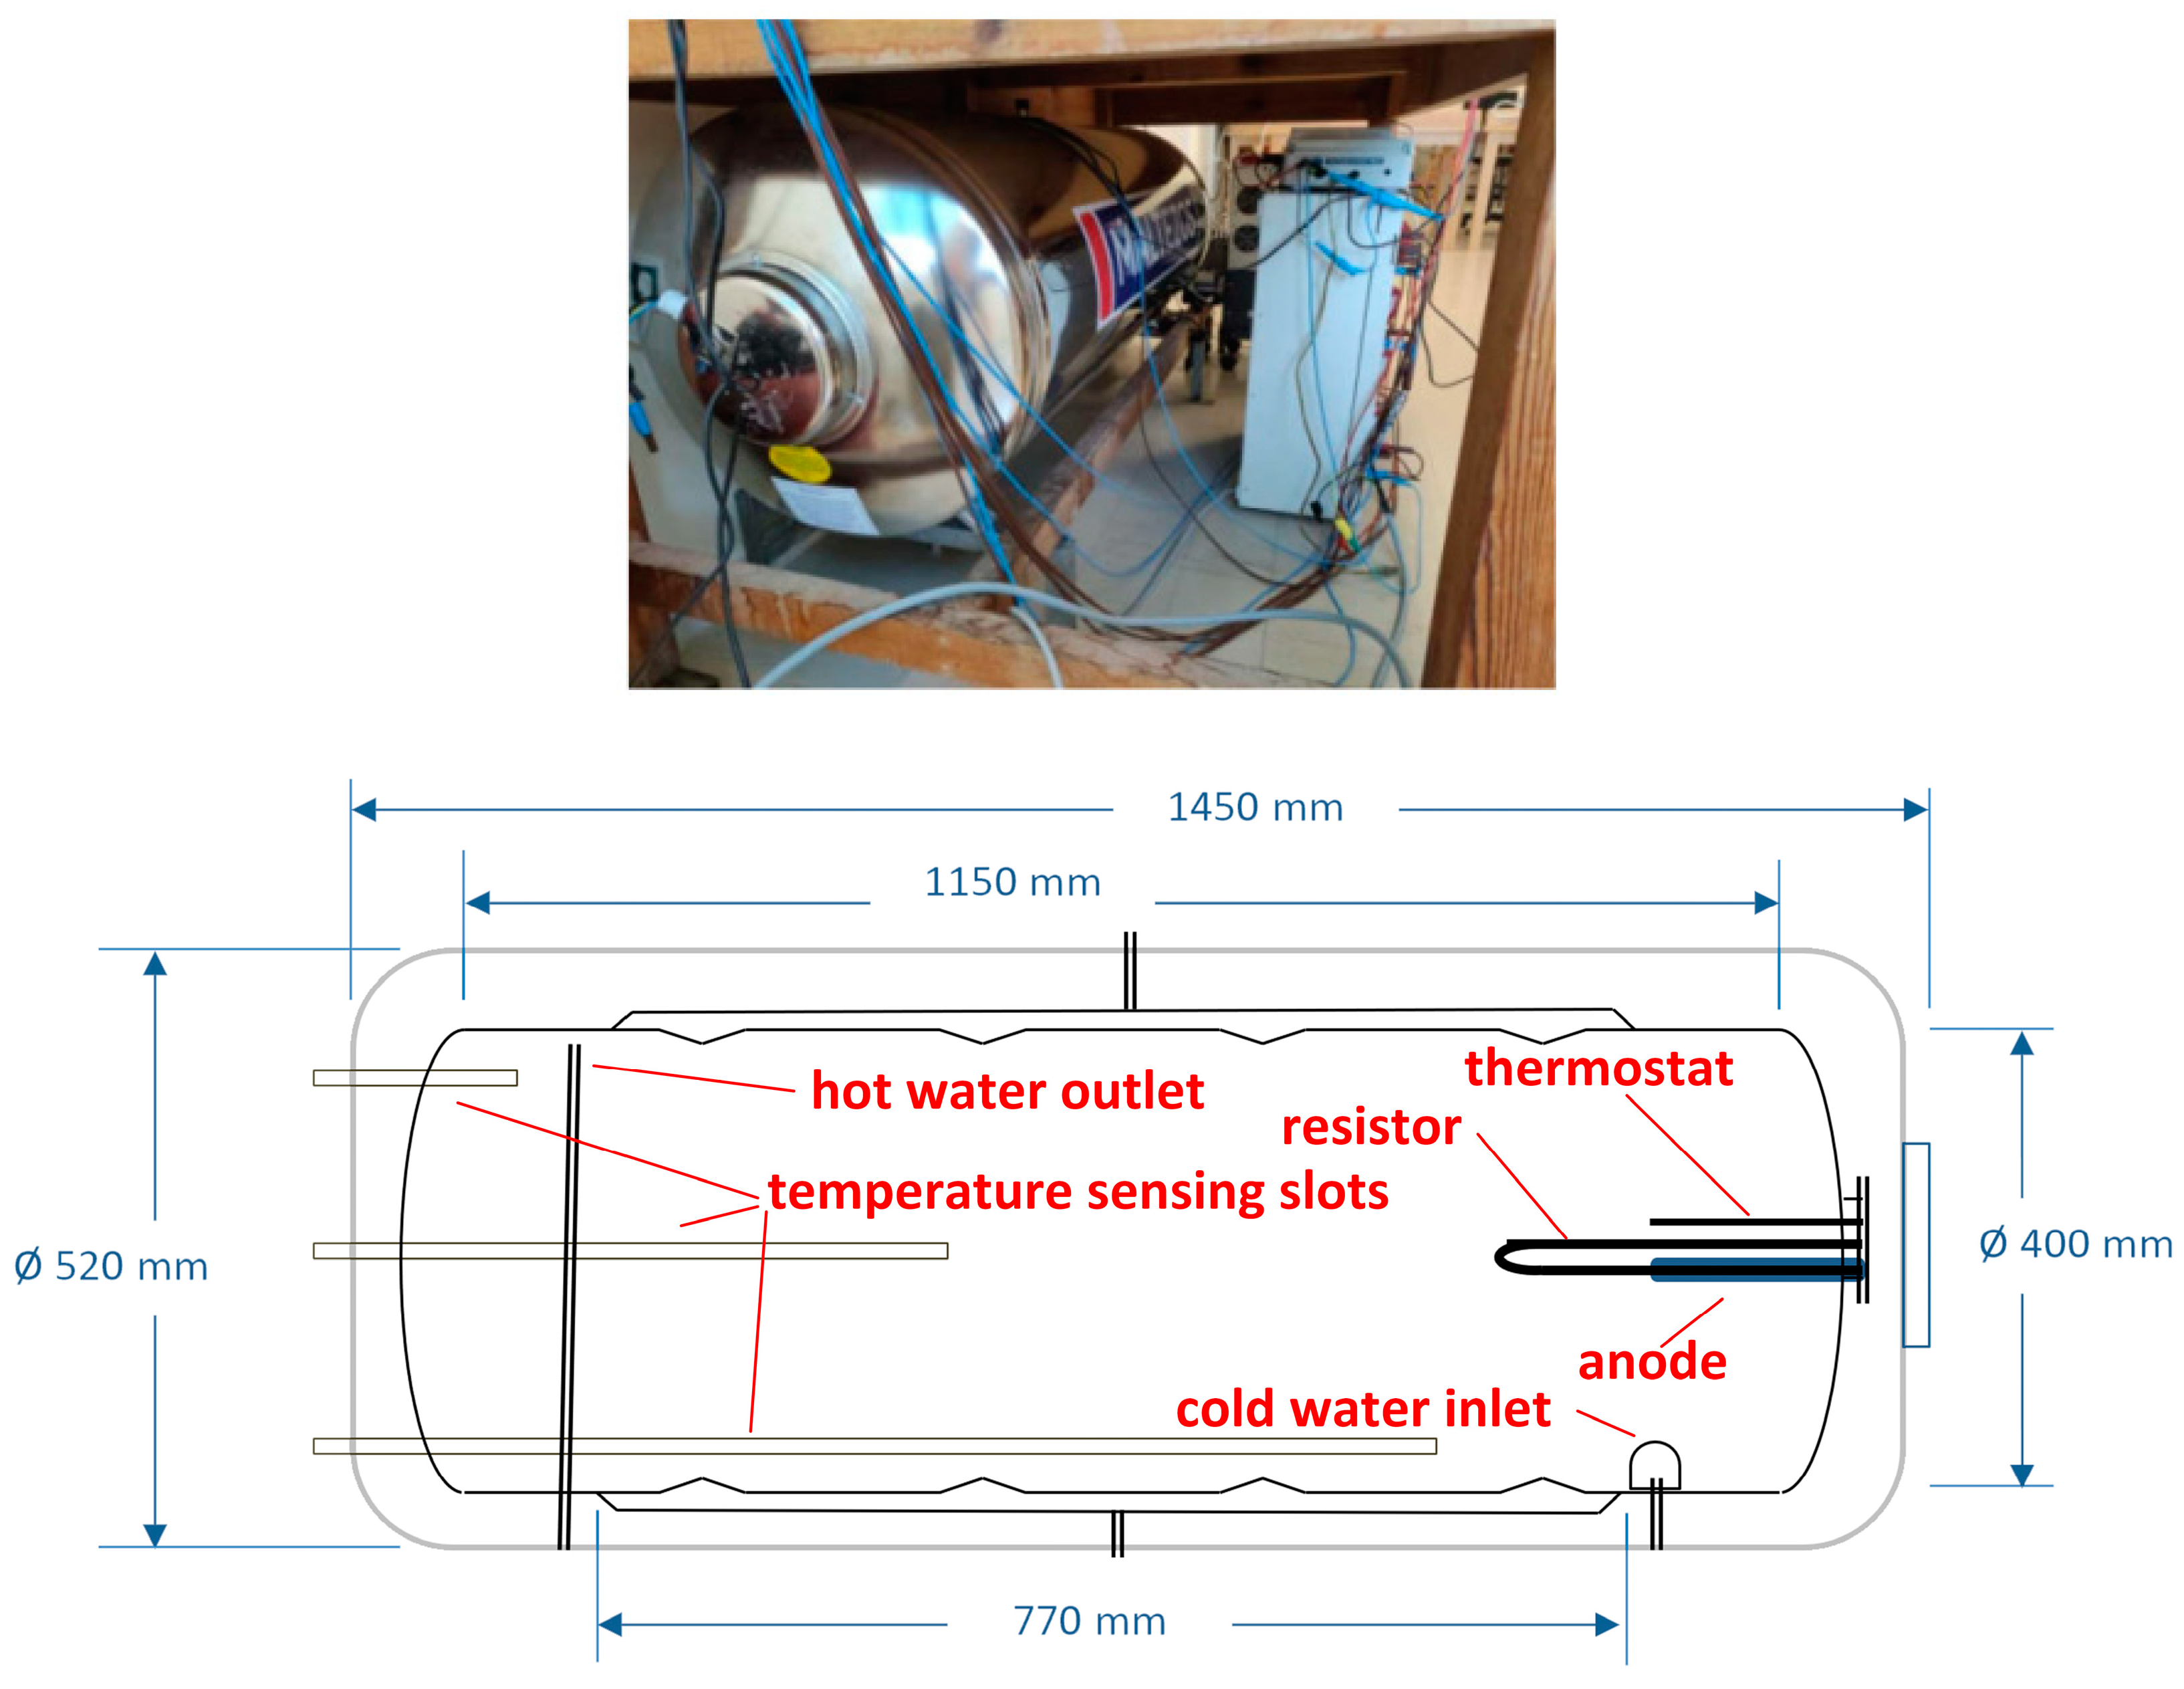
5.9. Boiler
5.10. Temperature Sensing
5.11. Data Acquisition System
6. Experimental Results
7. Conclusions
Author Contributions
Funding
Data Availability Statement
Acknowledgments
Conflicts of Interest
References
- Directive (EU) 2023/2413 of the European Parliament and of the Council. Official Journal of the European Union, L Series, Found in European Legislation Identifier. 2023. Available online: http://data.europa.eu/eli/dir/2023/2413/oj (accessed on 18 April 2024).
- Mountain, B.; Szuster, P. Solar, Solar Everywhere: Opportunities and Challenges for Australia’s Rooftop PV Systems. IEEE Power Energy Mag. 2015, 13, 53–60. [Google Scholar] [CrossRef]
- Giordano, F.; Ciocia, A.; Di Leo, P.; Mazza, A.; Spertino, F.; Tenconi, A.; Vaschetto, S. Vehicle-to-Home Usage Scenarios for Self-Consumption Improvement of a Residential Prosumer with Photovoltaic Roof. IEEE Trans. Ind. Appl. 2020, 56, 2945–2956. [Google Scholar] [CrossRef]
- Khouzam, K.Y. Technical and economic assessment of utility interactive PV systems for domestic applications in South East Queensland. IEEE Trans. Energy Convers. 1999, 14, 1544–1550. [Google Scholar] [CrossRef]
- Kroposki, B. Integrating high levels of variable renewable energy into electric power systems. J. Mod. Power Syst. Clean Energy 2017, 5, 831–837. [Google Scholar] [CrossRef]
- Chaudhari, K.; Kandasamy, N.K.; Krishnan, A.; Ukil, A.; Gooi, H.B. Agent-Based Aggregated Behavior Modeling for Electric Vehicle Charging Load. IEEE Trans. Ind. Inform. 2019, 15, 856–868. [Google Scholar] [CrossRef]
- Li, C.; Yu, X.; Yu, W.; Chen, G.; Wang, J. Efficient Computation for Sparse Load Shifting in Demand Side Management. IEEE Trans. Smart Grid 2017, 8, 250–261. [Google Scholar] [CrossRef]
- Tushar, M.H.K.; Zeineddine, A.W.; Assi, C. Demand-Side Management by Regulating Charging and Discharging of the EV, ESS, and Utilizing Renewable Energy. IEEE Trans. Ind. Inform. 2018, 14, 117–126. [Google Scholar] [CrossRef]
- Vovos, P.N.; Georgakas, K.G. Smart Boilers: Grid Support Services from Non-Critical Loads. J. Power Energy Eng. 2020, 8, 23–45. [Google Scholar] [CrossRef]
- Shen, J.; Jiang, C.; Li, B. Controllable Load Management Approaches in Smart Grids. Energies 2015, 8, 11187–11202. [Google Scholar] [CrossRef]
- Serban, I.; Ion, C.P. Supporting the Dynamic Frequency Response in Microgrids by Means of Active Loads. In Proceedings of the 42nd Annual Conference of the IEEE Industrial Electronics Society (IECON), Florence, Italy, 23–26 October 2016; pp. 3781–3786. [Google Scholar] [CrossRef]
- Klaassen, E.; Zhang, Y.; Lampropoulos, I.; Slootweg, H. Demand Side Management of Electric Boilers. In Proceedings of the 3rd IEEE PES Innovative Smart Grid Technologies Europe (ISGT Europe), Berlin, Germany, 14–17 October 2012; pp. 1–6. [Google Scholar] [CrossRef]
- IEC 62477-1; Safety requirements for power electronic converter systems and equipment—Part I: General. International Electrotechnical Comission: Geneva, Switzerland, 2022.
- IEC 61000-6; EMC—Part 6-2: Immunity Standard for Industrial Environments. International Electrotechnical Comission: Geneva, Switzerland, 2016.
- IEC 61000-6; EMC—Part 6-3: Emission Standard for Equipment in Residential Environments. International Electrotechnical Comission: Geneva, Switzerland, 2016.
- IEC 63000; Assessment of Electrical and Electronic Products with Respect to the Restriction of Hazardous Substances. International Electrotechnical Comission: Geneva, Switzerland, 2016.
- Mishra, B.; Kertesz, A. The Use of MQTT in M2M and IoT Systems: A Survey. IEEE Access 2020, 8, 201071–201086. [Google Scholar] [CrossRef]
- Minoli, D.; Sohraby, K.; Occhiogrosso, B. IoT Considerations, Requirements, and Architectures for Smart Buildings—Energy Optimization and Next-Generation Building Management Systems. IEEE Internet Things J. 2017, 4, 269–283. [Google Scholar] [CrossRef]
- Verma, A.; Prakash, S.; Srivastava, V.; Kumar, A.; Mukhopadhyay, S.C. Sensing, Controlling, and IoT Infrastructure in Smart Building: A Review. IEEE Sens. J. 2019, 19, 9036–9046. [Google Scholar] [CrossRef]
- Metallidou, C.K.; Psannis, K.E.; Egyptiadou, E.A. Energy Efficiency in Smart Buildings: IoT Approaches. IEEE Access 2020, 8, 63679–63699. [Google Scholar] [CrossRef]
- Koziolek, H.; Grüner, S.; Rückert, J. A Comparison of MQTT Brokers for Distributed IoT Edge Computing. In Software Architecture, Proceedings of the 14th European Conference, ECSA 2020, L’Aquila, Italy, 14–18 September 2020; Lecture Notes in Computer Science; Jansen, A., Malavolta, I., Muccini, H., Ozkaya, I., Zimmermann, O., Eds.; Springer: Cham, Switzerland, 2020; Volume 12292. [Google Scholar] [CrossRef]
- O’Mahony, D.; Doyle, D. Reaching 5 Million Messaging Connections: Our Journey with Kubernetes, December 2018. Available online: https://www.slideshare.net/ConnectedMarketing/reaching-5-million-messaging-connections-our-journey-with-kubernetes-126143229 (accessed on 5 February 2024).
- Sommer, P.; Schellroth, F.; Fischer, M.; Schlechtendahl, J. Message-oriented middleware for industrial production systems. In Proceedings of the International Conference on Automation Science and Engineering (CASE), Munich, Germany, 20–24 August 2018; pp. 1217–1223. [Google Scholar]
- Mishra, B.; Mishra, B.; Kertesz, A. Stress-Testing MQTT Brokers: A Comparative Analysis of Performance Measurements. Energies 2021, 14, 5817. [Google Scholar] [CrossRef]
- Setz, B.; Graef, S.; Ivanova, D.; Tiessen, A.; Aiello, M. A Comparison of Open-Source Home Automation Systems. IEEE Access 2021, 9, 167332–167352. [Google Scholar] [CrossRef]
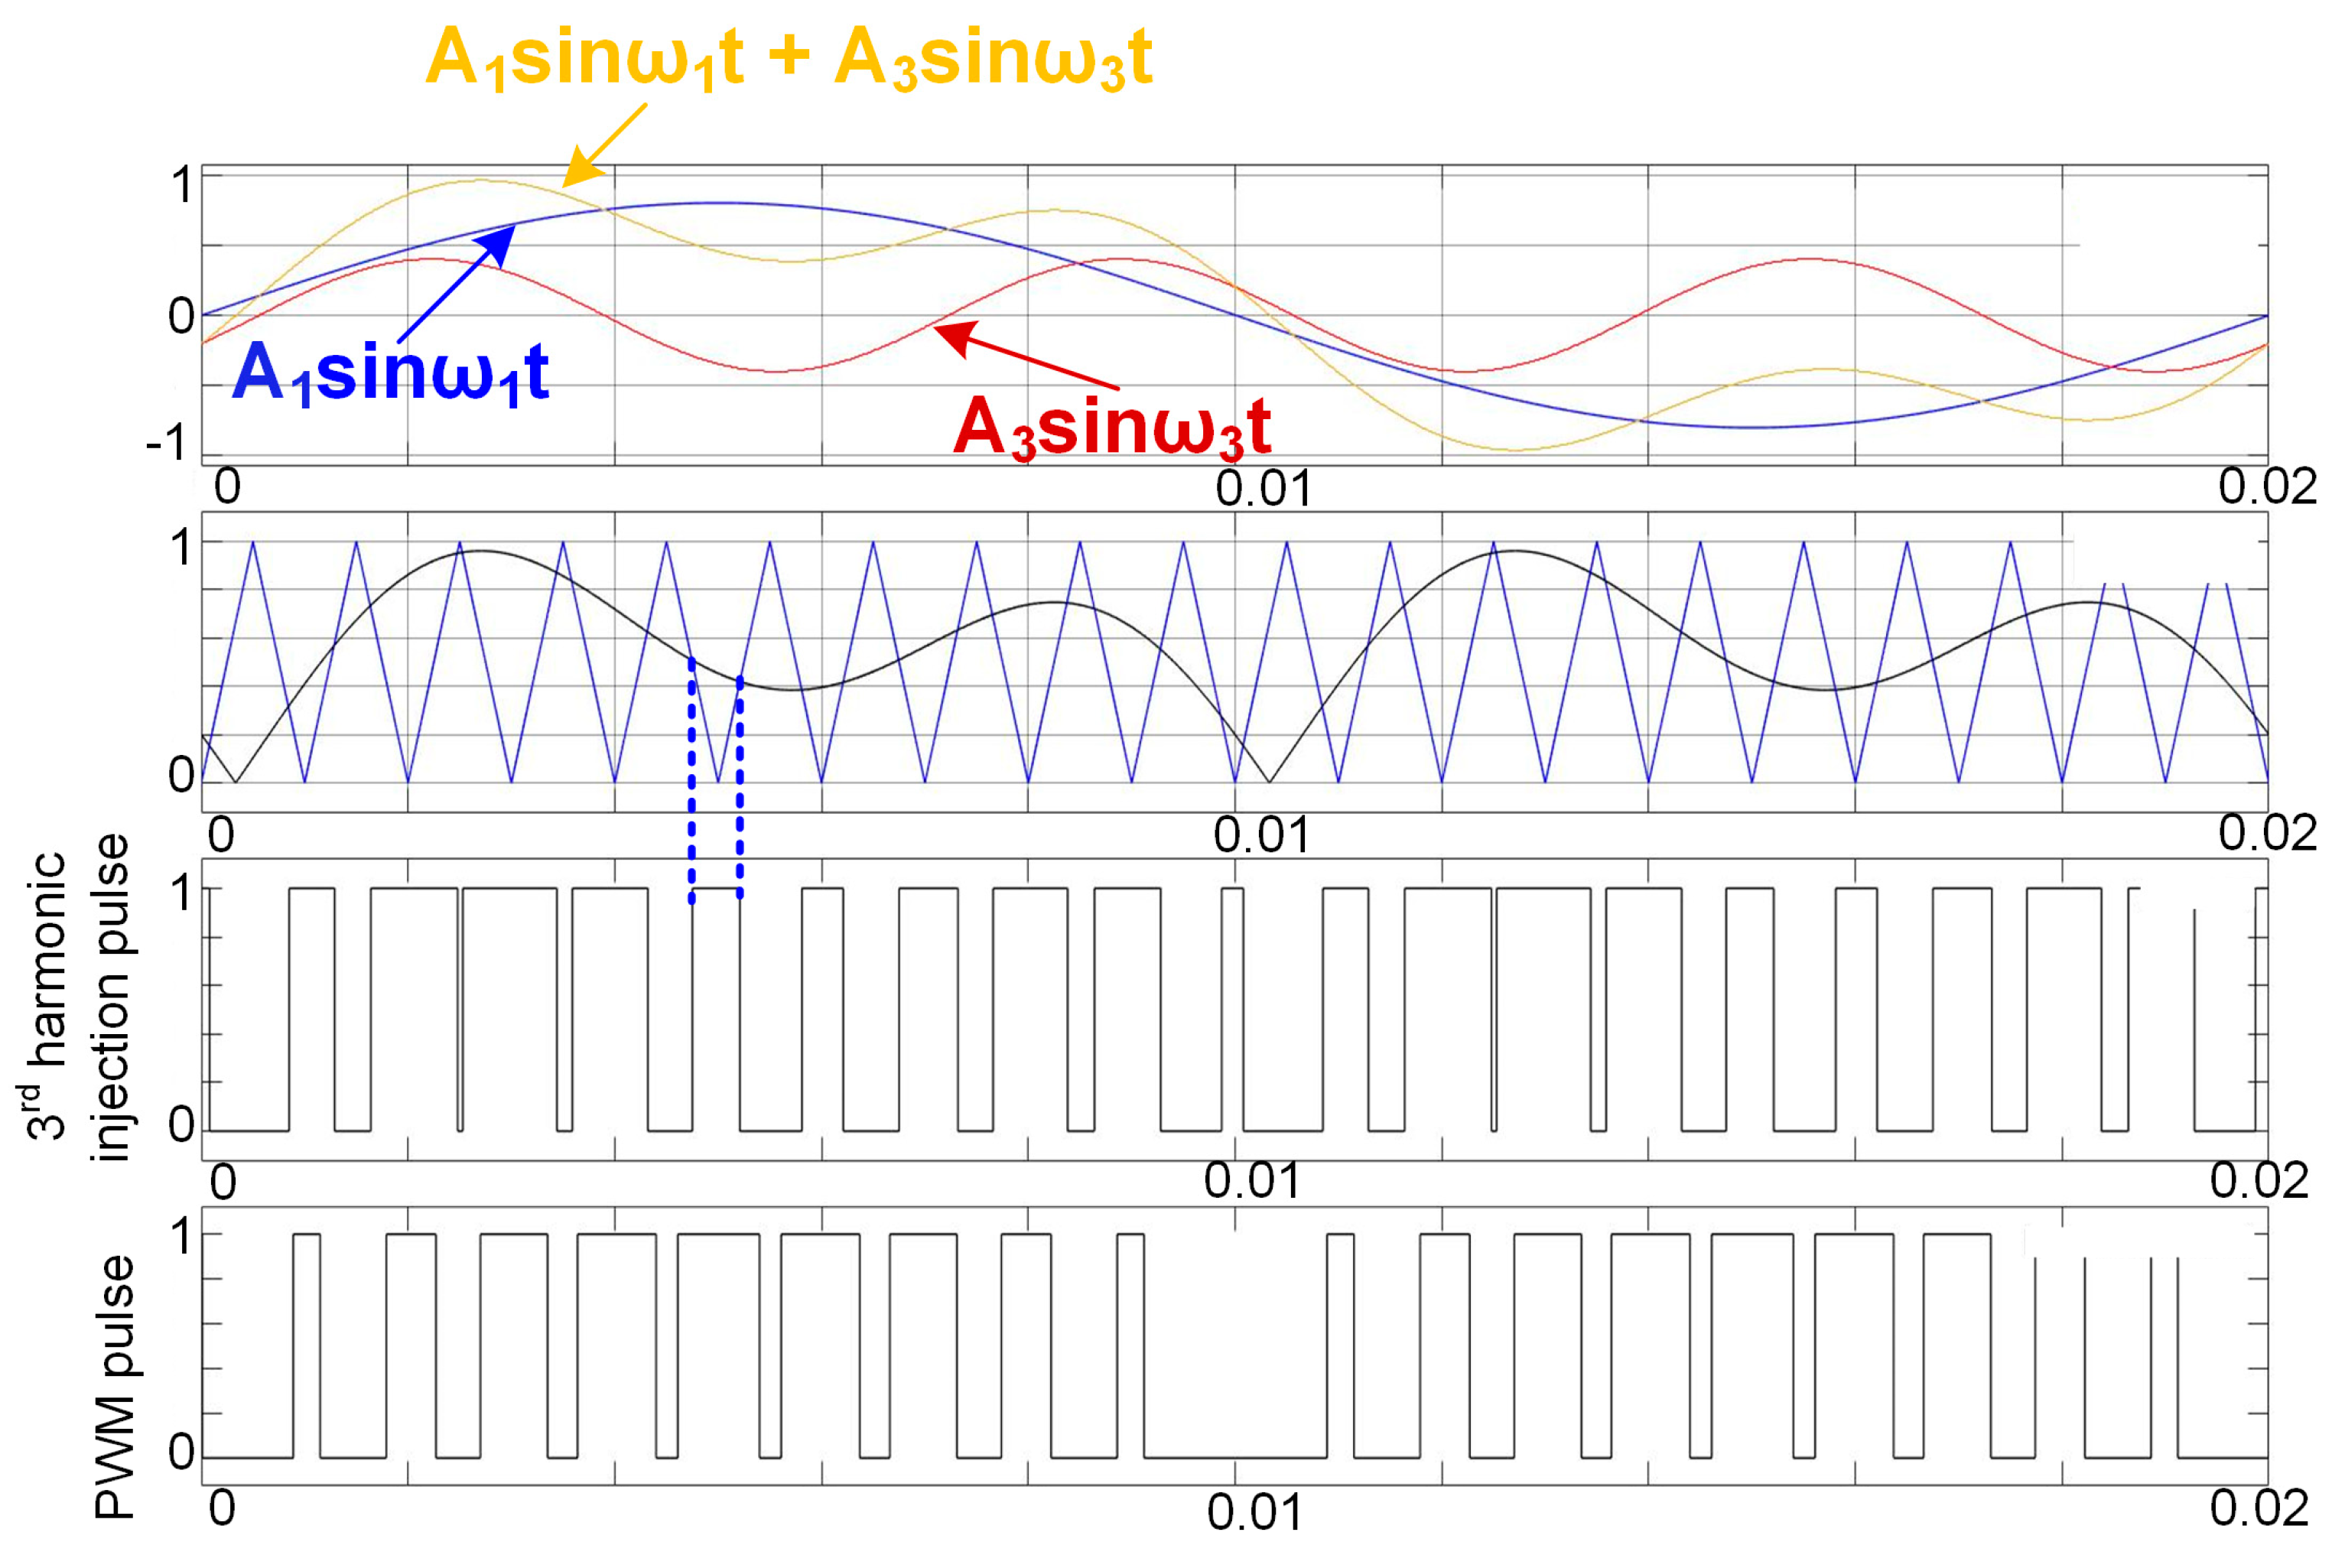
- Mpouloumpasis, I.; Vovos, P.; Georgakas, K. Voltage harmonic injection angle optimization for grid current harmonics using a PV converter. IET Power Electron. 2019, 12, 2382–2388. [Google Scholar] [CrossRef]
- Katsaprakakis, D.A.; Papadakis, N.; Giannopoulou, E.; Yiannakoudakis, Y.; Zidianakis, G.; Katzagiannakis, G.; Dakanali, E.; Stavrakakis, G.M.; Kartalidis, A. Rational Use of Energy in Sport Centers to Achieving Net Zero—The SAVE Project (Part B: Indoor Sports Hall). Energies 2023, 16, 7308. [Google Scholar] [CrossRef]
- Kong, J.; Dong, Y.; Poshnath, A.; Rismanchi, B.; Yap, P.-S. Application of Building Integrated Photovoltaic (BIPV) in Net-Zero Energy Buildings (NZEBs). Energies 2023, 16, 6401. [Google Scholar] [CrossRef]
- Yang, J.; Cai, B.; Cao, J.; Wang, Y.; Yang, H.; Zhu, P. Comprehensive Characterization of Energy Saving and Environmental Benefits of Campus Photovoltaic Buildings. Energies 2023, 16, 7152. [Google Scholar] [CrossRef]
- Dickert, J.; Domagk, M.; Schegner, P. Benchmark low voltage distribution networks based on cluster analysis of actual grid properties. In Proceedings of the 2013 IEEE Grenoble Conference, Grenoble, France, 16–20 June 2013; pp. 1–6. [Google Scholar] [CrossRef]
- Dimitrakakis, G.; Tatakis, E.; Nanakos, A. A simple calorimetric setup for the accurate measurement of losses in power electronic converters. In Proceedings of the 14th European Conference on Power Electronics and Applications, (EPE 2011), Birmingham, UK, 30 August–1 September 2011. No. 744. [Google Scholar]


| MQTT Broker Comparison Review [21] | MQTT Broker Requirements for Widespread Use of Smart Boilers | |
|---|---|---|
| Messages | 1000 to 50,000 | up to 11,000 (10,000 SBs and 1000 Meter Devices) |
| Transmission frequency in seconds | 1 | 0.8192 |
| Message payload size in Bytes | 150 | 16 |
| Messages without packet loss | up to 28,000 |
Disclaimer/Publisher’s Note: The statements, opinions and data contained in all publications are solely those of the individual author(s) and contributor(s) and not of MDPI and/or the editor(s). MDPI and/or the editor(s) disclaim responsibility for any injury to people or property resulting from any ideas, methods, instructions or products referred to in the content. |
© 2024 by the authors. Licensee MDPI, Basel, Switzerland. This article is an open access article distributed under the terms and conditions of the Creative Commons Attribution (CC BY) license (https://creativecommons.org/licenses/by/4.0/).
Share and Cite
Dimitrakakis, G.S.; Georgakas, K.G.; Topalis, E.S.; Vovos, P.N. Grid Quality Services from Smart Boilers: Experimental Verification on Realistic Scenarios for Micro-Grids with Demand-Side Management Oriented to Self-Consumption. Energies 2024, 17, 2096. https://0-doi-org.brum.beds.ac.uk/10.3390/en17092096
Dimitrakakis GS, Georgakas KG, Topalis ES, Vovos PN. Grid Quality Services from Smart Boilers: Experimental Verification on Realistic Scenarios for Micro-Grids with Demand-Side Management Oriented to Self-Consumption. Energies. 2024; 17(9):2096. https://0-doi-org.brum.beds.ac.uk/10.3390/en17092096
Chicago/Turabian StyleDimitrakakis, Georgios S., Konstantinos G. Georgakas, Evangelos S. Topalis, and Panagis N. Vovos. 2024. "Grid Quality Services from Smart Boilers: Experimental Verification on Realistic Scenarios for Micro-Grids with Demand-Side Management Oriented to Self-Consumption" Energies 17, no. 9: 2096. https://0-doi-org.brum.beds.ac.uk/10.3390/en17092096