Article

Assessment of CH4 Emissions in a Compressed Natural Gas-Adapted Engine in the Context of Changes in the Equivalence Ratio

Faculty of Mechanical Engineering and Aeronautics, Rzeszow University of Technology, 35-959 Rzeszów, Poland
*
Authors to whom correspondence should be addressed.
Submission received: 26 March 2024 / Revised: 25 April 2024 / Accepted: 26 April 2024 / Published: 27 April 2024
(This article belongs to the Special Issue Internal Combustion Engine: Research and Application—2nd Edition)

Abstract

:
The results of diagnostic tests under steady-state speed conditions of an unloaded engine do not fully reflect the emissivity of vehicles adapted to run on natural gas. Therefore, it is reasonable to pay attention to the emissions performance of these vehicles under dynamic conditions. In this regard, the tests were carried out on a chassis dynamometer with the engine fueled by gasoline and natural gas. Due to the area of operation of natural gas vehicles being usually limited to urban areas, the urban phases of the NEDC (New European Driving Cycle) and WLTC (Worldwide harmonized Light-duty vehicles Test Cycle) were adapted. While CO2 emissions are lower when fueled by natural gas, CH4 emissions can be high, which is related to momentary changes in the composition of the combustible mixture. Although CH4 emissions are higher when the engine runs on natural gas, the CO2eq value is, depending on the driving cycle, about 15–25% lower than when running on petrol. Additionally, studies have shown that in engines adapted to run on CNG (compressed natural gas), it is advisable to consider the use of catalytic converters optimized to run on natural gas, as is the case with vehicles which are factory–adapted to run on CNG.

1. Introduction

The problem of global warming is related to greenhouse gas emissions, which mainly include CO2, O3, N2O, CFCs (Chlorofluorocarbons) and CH4 [1]. In 2023, the EU (European Union) adopted a set of Commission proposals to make the EU’s climate, energy, transport and taxation policies fit for reducing net greenhouse gas emissions by at least 55% by 2030, compared to 1990 levels [2]. In an effort to reduce greenhouse gas emissions from road transport, a number of measures are being taken, including, among others, the replacement of the bus fleet with low-emission buses [3], the introduction of hybrid drives with lower emissions in the exhaust [4,5], electric drives [6] and the use of alternative fuels. Alternative fuels that are associated with lower greenhouse gas emissions from the internal combustion engine include the following: renewable fuels [7] (vegetable oils and their esters with additives to improve their performance [8], HVO (hydro-treated vegetable oil), and alcohols); gaseous fuels, of which LPG (liquefied petroleum gas) and natural gas (CNG and LNG (liquefied natural gas)) are the most widely used; and mixtures with the addition of hydrogen [9,10]. The main difference between CNG and LNG systems for fueling is the fuel storage system. CNG systems, in which fuel is stored in high-pressure tanks at a pressure of about 20 MPa, are more commonly used for natural gas as motor fuel. This is a more favorable form of fuel storage compared to LNG systems, in which fuel is stored in cryogenic tanks in the liquid phase at a temperature of about 112–135 K. In an LNG system, as in a CNG system, the fuel is delivered to the engine in the gaseous phase, after being vaporized in an evaporator-reducer.
Natural gas supply is a favorable solution due to its ability to reduce CO2 emissions; however, one problem associated with the use of natural gas to power the engine can be methane emissions. This problem is related to the different physicochemical properties compared to gasoline and the lower efficiency of the catalytic converter in the conversion of methane (Figure 1), especially during periods of lean air–fuel mixture [11]. Catalytic converters designed for gasoline engines are not optimal for natural gas fueling [12].
Natural gas-fueled engines tend to have higher hydrocarbon emissions relative to emissions when running on gasoline or diesel [13,14]. This is mainly due to methane emissions [15,16,17]. The values of CH4 emission (expressed per km or per kWh) in the exhaust of natural gas vehicles can vary widely. This is due to a number of factors, including the design of the catalytic converter [18] and the wear rate of the catalytic converter, which is heavily influenced by sulfur [19], the type of gaseous fuel supply system (LNG, CNG, spark-ignition (SI) engines with lean or stoichiometric air–fuel ratio, high-pressure direct Injection (HPDI) engines without throttle, dual-fuel compression-ignition (CI) engines with the injection of a dose of diesel fuel initiating the ignition of the natural gas–air mixture) [20], and the driving cycle carried out on a chassis dynamometer or under actual road conditions. An important factor that affects the energy demand is related to the resistance to motion [21]. These values determine fuel consumption and emissions of pollutants in the exhaust gas. In chassis dynamometer tests, emission results often have lower values than in on-road driving [22,23]. In studies of engines fueled by natural gas or mixtures of natural gas and diesel, it has been shown that higher methane emissions occur for lower engine loads [24,25]. This may be related to the lower exhaust gas temperature, which results in a lower catalytic converter temperature, which is connected with lower methane-conversion efficiency [12]. The problem of methane emissions is also related to methane slip. Methane slip refers to methane that does not burn during natural gas engine operation. There are several sources of methane slip during natural gas engine operation, including blow-by, valve overlap and incomplete combustion. Methane slip depends on the engine’s compression ratio, among other factors [12,26,27].
In the case of cars adapted from the factory to run on natural gas, methane emissions are often lower [28,29] than in vehicles manufactured to run on gasoline with an auxiliary natural gas system [30].
Advanced and expensive tests performed on chassis dynamometers are usually carried out for cars with higher emission classes (Euro 5 and Euro 6) and factory-equipped with CNG fueling systems. Test results presented in the literature by other authors for cars of a lower-emission class (Euro 3) fueled with CNG usually concern road tests. In the case of tests of Euro 3 emission-class cars conducted on a chassis dynamometer [30], the results presented often do not include a detailed analysis.
The tests presented in the article were conducted on a chassis dynamometer, according to driving cycles under fixed conditions in a climate chamber. This ensured repeatability and the same test cycle conditions when running on gasoline and natural gas. The work is a detailed evaluation of the emission of gaseous pollutants in the exhaust gas, with particular emphasis on methane emissions, in a car adapted to CNG fueling with emission-class Euro 3. The work adds to the knowledge of testing cars not adapted from the factory to run on natural gas.

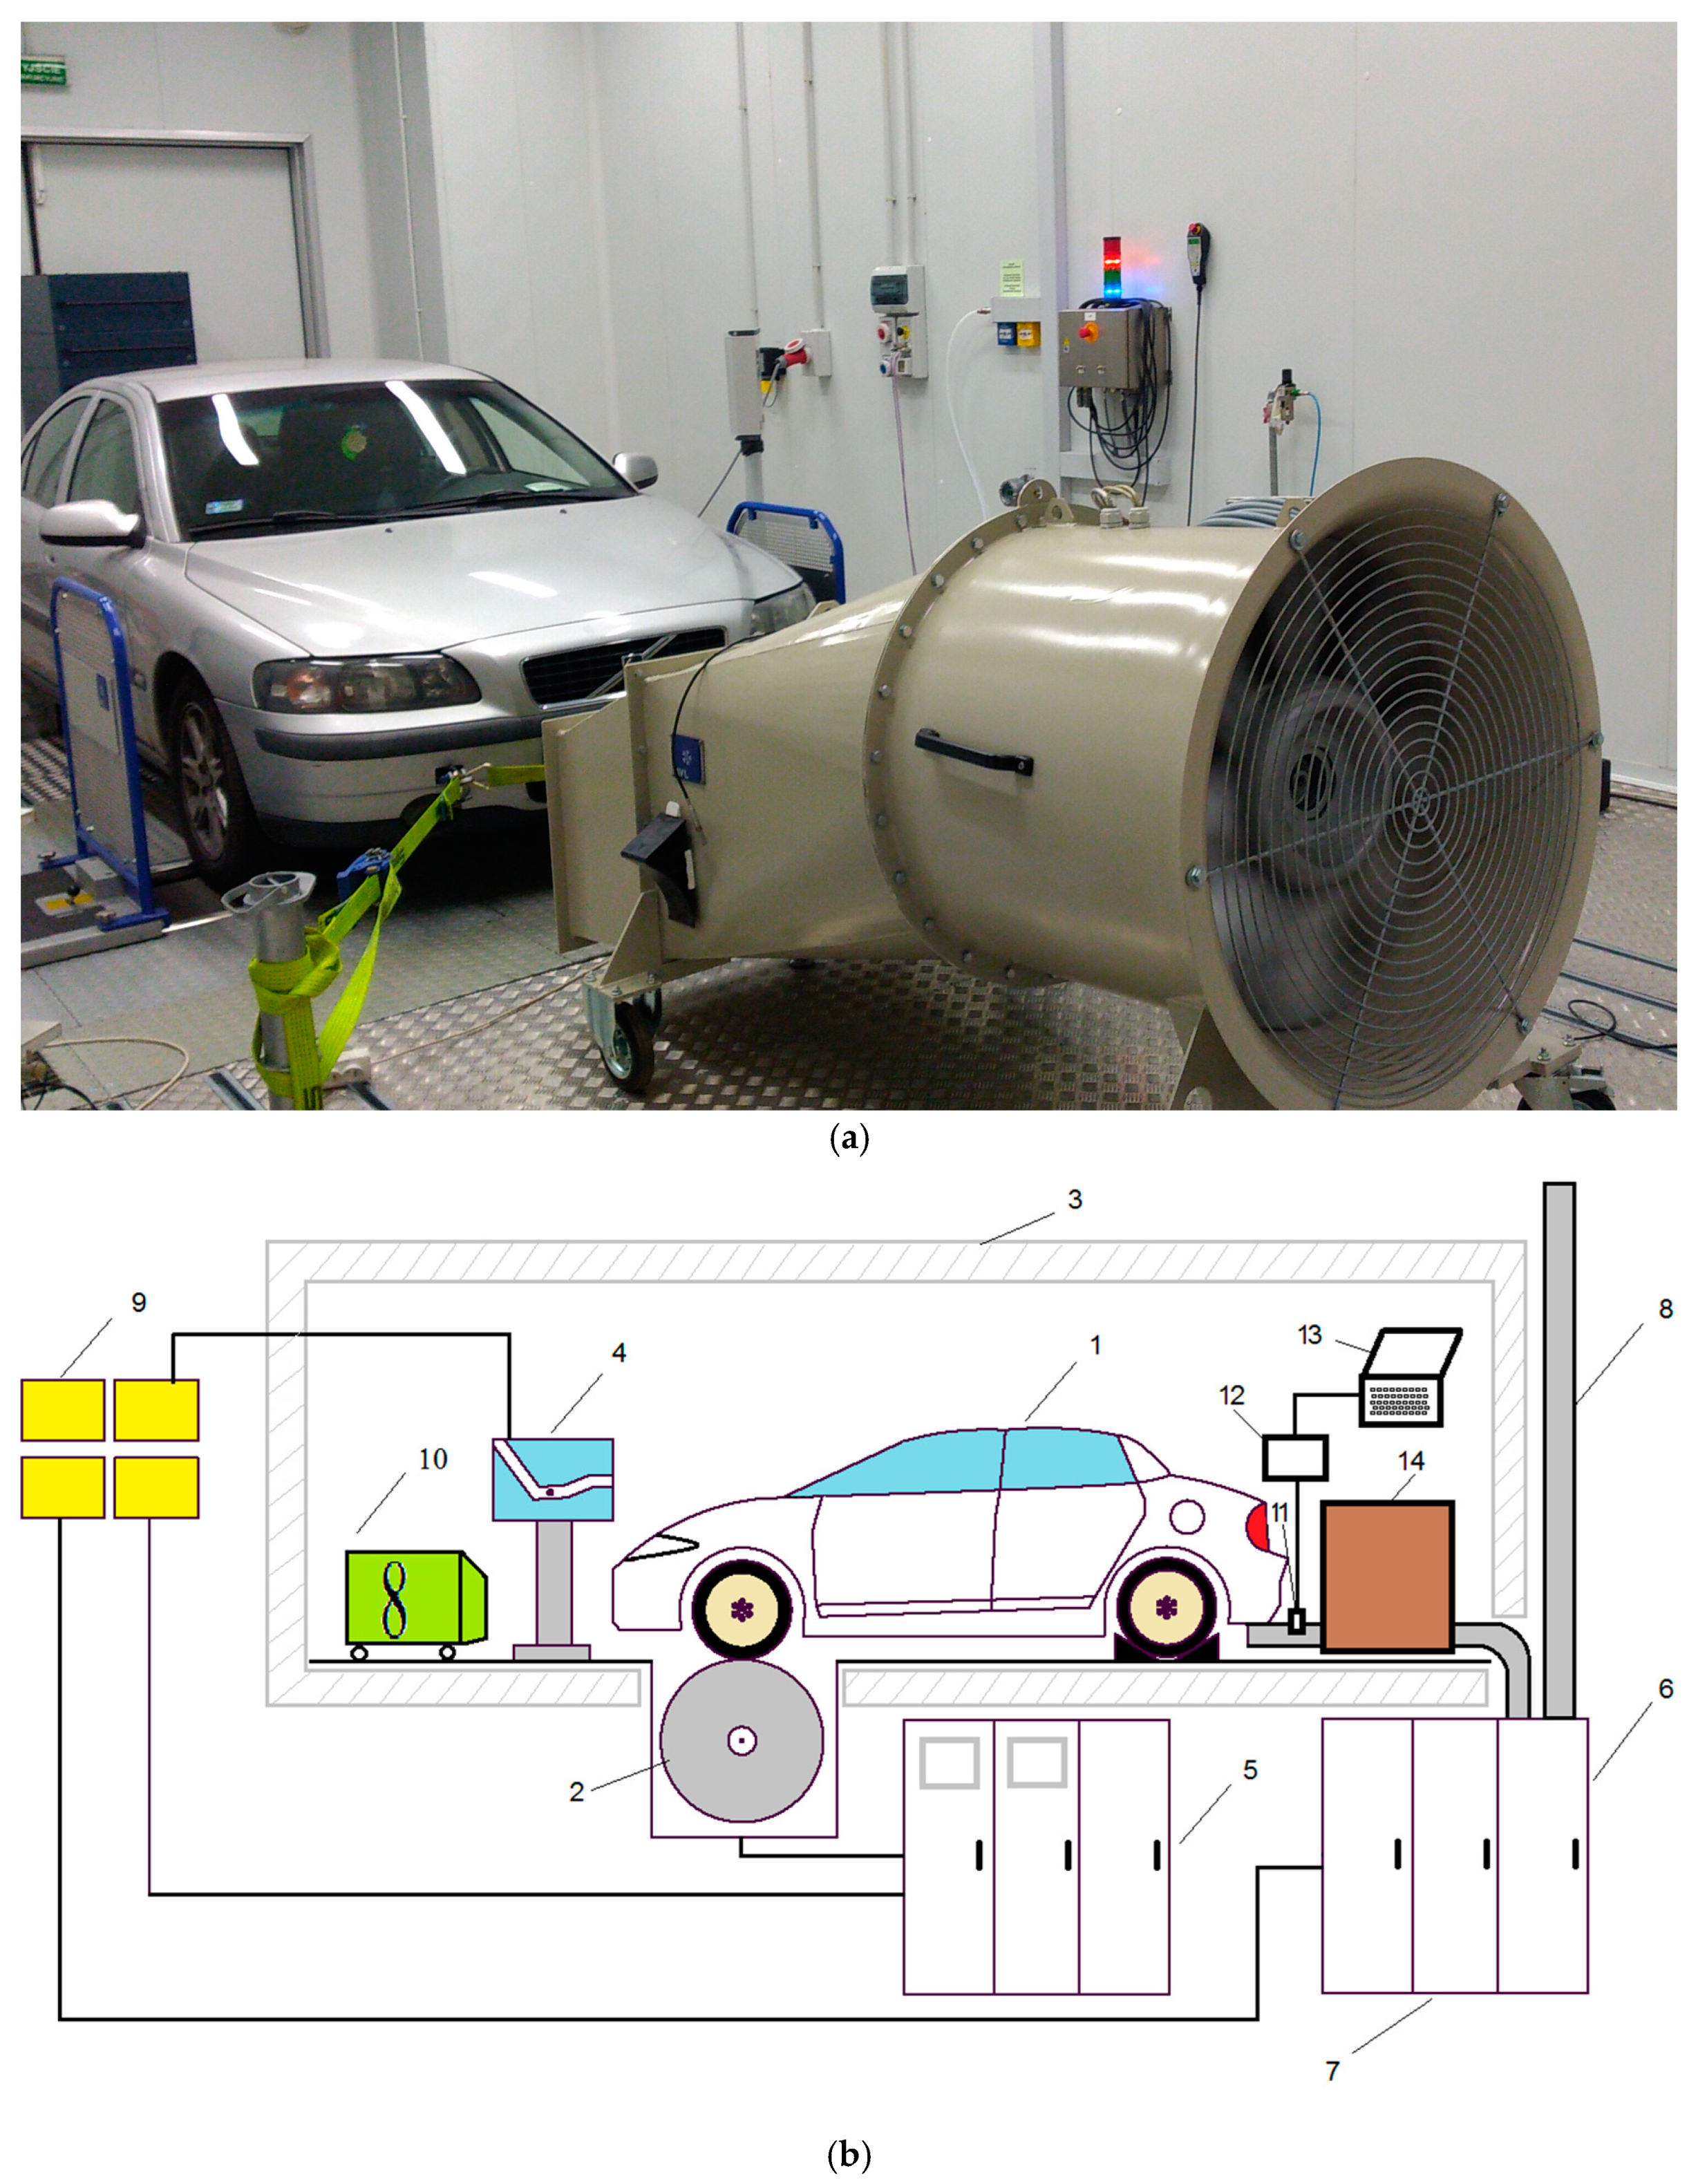
2. Materials and Methods

The research was carried out at the automotive ecology laboratory of the Rzeszow University of Technology. The object of the research was a passenger car adapted to run on CNG, the basic technical data of which are listed in Table 1. The research was carried out on a chassis dynamometer built in a climatic chamber (Figure 2). A list of test bed equipment is shown in Table 2. Measurements of gaseous pollutant emissions in the exhaust gas, i.e., CO2, CO, NOx, THC and CH4 were carried out using the AVL AMA i60 exhaust gas analysis system (Table 3). Measurements were performed for modal analysis of diluted exhaust gas using the AVL CVS (constant volume sampling) i60 system [31]. For a detailed description of the test bed, see [32].
The analysis of measurement uncertainty was based on the methodology in the paper [33]. The mass emissions of a pollutant egas (g/km), from the dilution tunnel for each phase, were calculated according to the following Equation (1):
e g a s = i = 1 n q m e w , i · ρ g a s · k h · c g a s , i 10 6 · d
where
  • q m e w , i is the measured instantaneous volumetric flow rate of diluted exhaust gas at time i (l/s);
  • ρ g a s is the density of the pollutant (constant) (g/L) under standard conditions (273.15 K (0 °C) and 101.325 kPa);
  • k h is the humidity correction factor applicable only to the mass emissions of NOx;
  • c g a s , i is the measured instantaneous concentration of the pollutant in the diluted exhaust at time i (ppm);
  • d is the distance of the phase (km).
For the estimation of the egas uncertainty (εegas) (in %), the error propagation rule for multiplication and division was used according to Equation (2):
ε e g a s = ε q m e w 2 + ε c g a s 2 + ε d 2
where
  • ε q m e w is the relative uncertainty of the CVS diluted exhaust flow rate (%);
  • ε c g a s is the relative uncertainty of the pollutant concentration (%);
  • ε d is the relative uncertainty of the distance (%).
In order to find the uncertainty of each component of the equation, the technical specifications and experimental data were taken into account. The uncertainty of the diluted CVS exhaust flow rate was ±2%, in accordance with Regulation (EU) 2017/1154 [34]. According to these regulations, the maximum internal accuracy of the analyzers was assumed to be ±2%. The uncertainty of the gas concentration that is used for calibrations was assumed to be ±2%. The uncertainty of the analyzers was determined by the analyzers’ accuracy, noise, linearity and span-drift data (according to Table 3). Uncertainty of measurement of pollutant concentration by the analyzer was calculated based on Equation (3):
ε c g a s = ε c , a c c 2 + ε c , d r i f t 2 + ε c , n o i s e 2 + ε c , l i n e a r 2 + ε c , g a s   a c c 2
where
  • ε c , a c c is the accuracy of the analyzer (%);
  • ε c , d r i f t is the span drift (%);
  • ε c , n o i s e is the analyzer noise (%);
  • ε c , l i n e a r is the analyzer linearity (%);
  • ε c ,   g a s   a c c is the gas accuracy (%).
The relative emission measurement uncertainty values calculated according to the adopted methodology did not exceed 5%, and are shown as error bars.
To enable potential reproduction of the tests, the parameters of the gasoline utilized to fuel the tested car engine are detailed in Table A1, and provided in the Appendix A. The OptiFuel—FTIR (Fourier-transform infrared) fuel analyzer, manufactured by PAC (Petroleum Analyzer Company, Houston, TX, USA), was employed to analyze the gasoline parameters. This analyzer utilizes FTIR technology, ensuring precise identification of chemical compounds within the fuel and their concentrations. Each gasoline sample underwent two measurements, from which the span (the absolute difference between the obtained results) was calculated. The table presents the average values derived from these two measurements for each parameter. The average values of the parameters of the natural gas with which the engine was fueled are shown in Table A2 (Appendix A).
The first part of the study involved comparing emissions in urban driving cycles when running on gasoline and CNG. The measurements were carried out for hot-start conditions of the engine, whose coolant temperature was 90 ± 2 °C. The ambient temperature during all tests was 23 ± 3 °C. Driving tests were carried out for the urban parts of NEDC (UDC) and WLTC Class 3 (Low and Medium) cycles. Tests for each cycle were conducted twice, with the engine running on both gasoline and natural gas. The resistance force of the dynamometer was determined for the values of the coefficients of the speed-dependent chassis-dynamometer resistance function (F0, F1 and F2), which are presented in Table 2. The parameters of the analyzed driving cycles are listed in Table 4.
The second part of the research involved evaluating the effect of the composition of the gas–air mixture on methane emissions, described by the equivalence ratio (λ). The equivalence ratio, λ, is defined as the actual air–fuel ratio to the stoichiometric air–fuel ratio for a given mixture expressed by the following formula:
λ = A F R ( A F R ) s t o i c h
where
  • A F R is the actual air–fuel ratio;
  • ( A F R ) s t o i c h is the stoichiometric air–fuel ratio.
The research was carried out under constant speed conditions corresponding to the average speed 35.1 km/h (excluding stops) for the urban part (Low + Medium) of the WLTC Class 3 cycle. The dynamometer’s load power on the car’s wheels was set at 30 ± 1 kW. During the test, the values of the excess air factor in the exhaust gas, downstream of the catalytic converter, were recorded using the EcuMASTER EMU Black system.

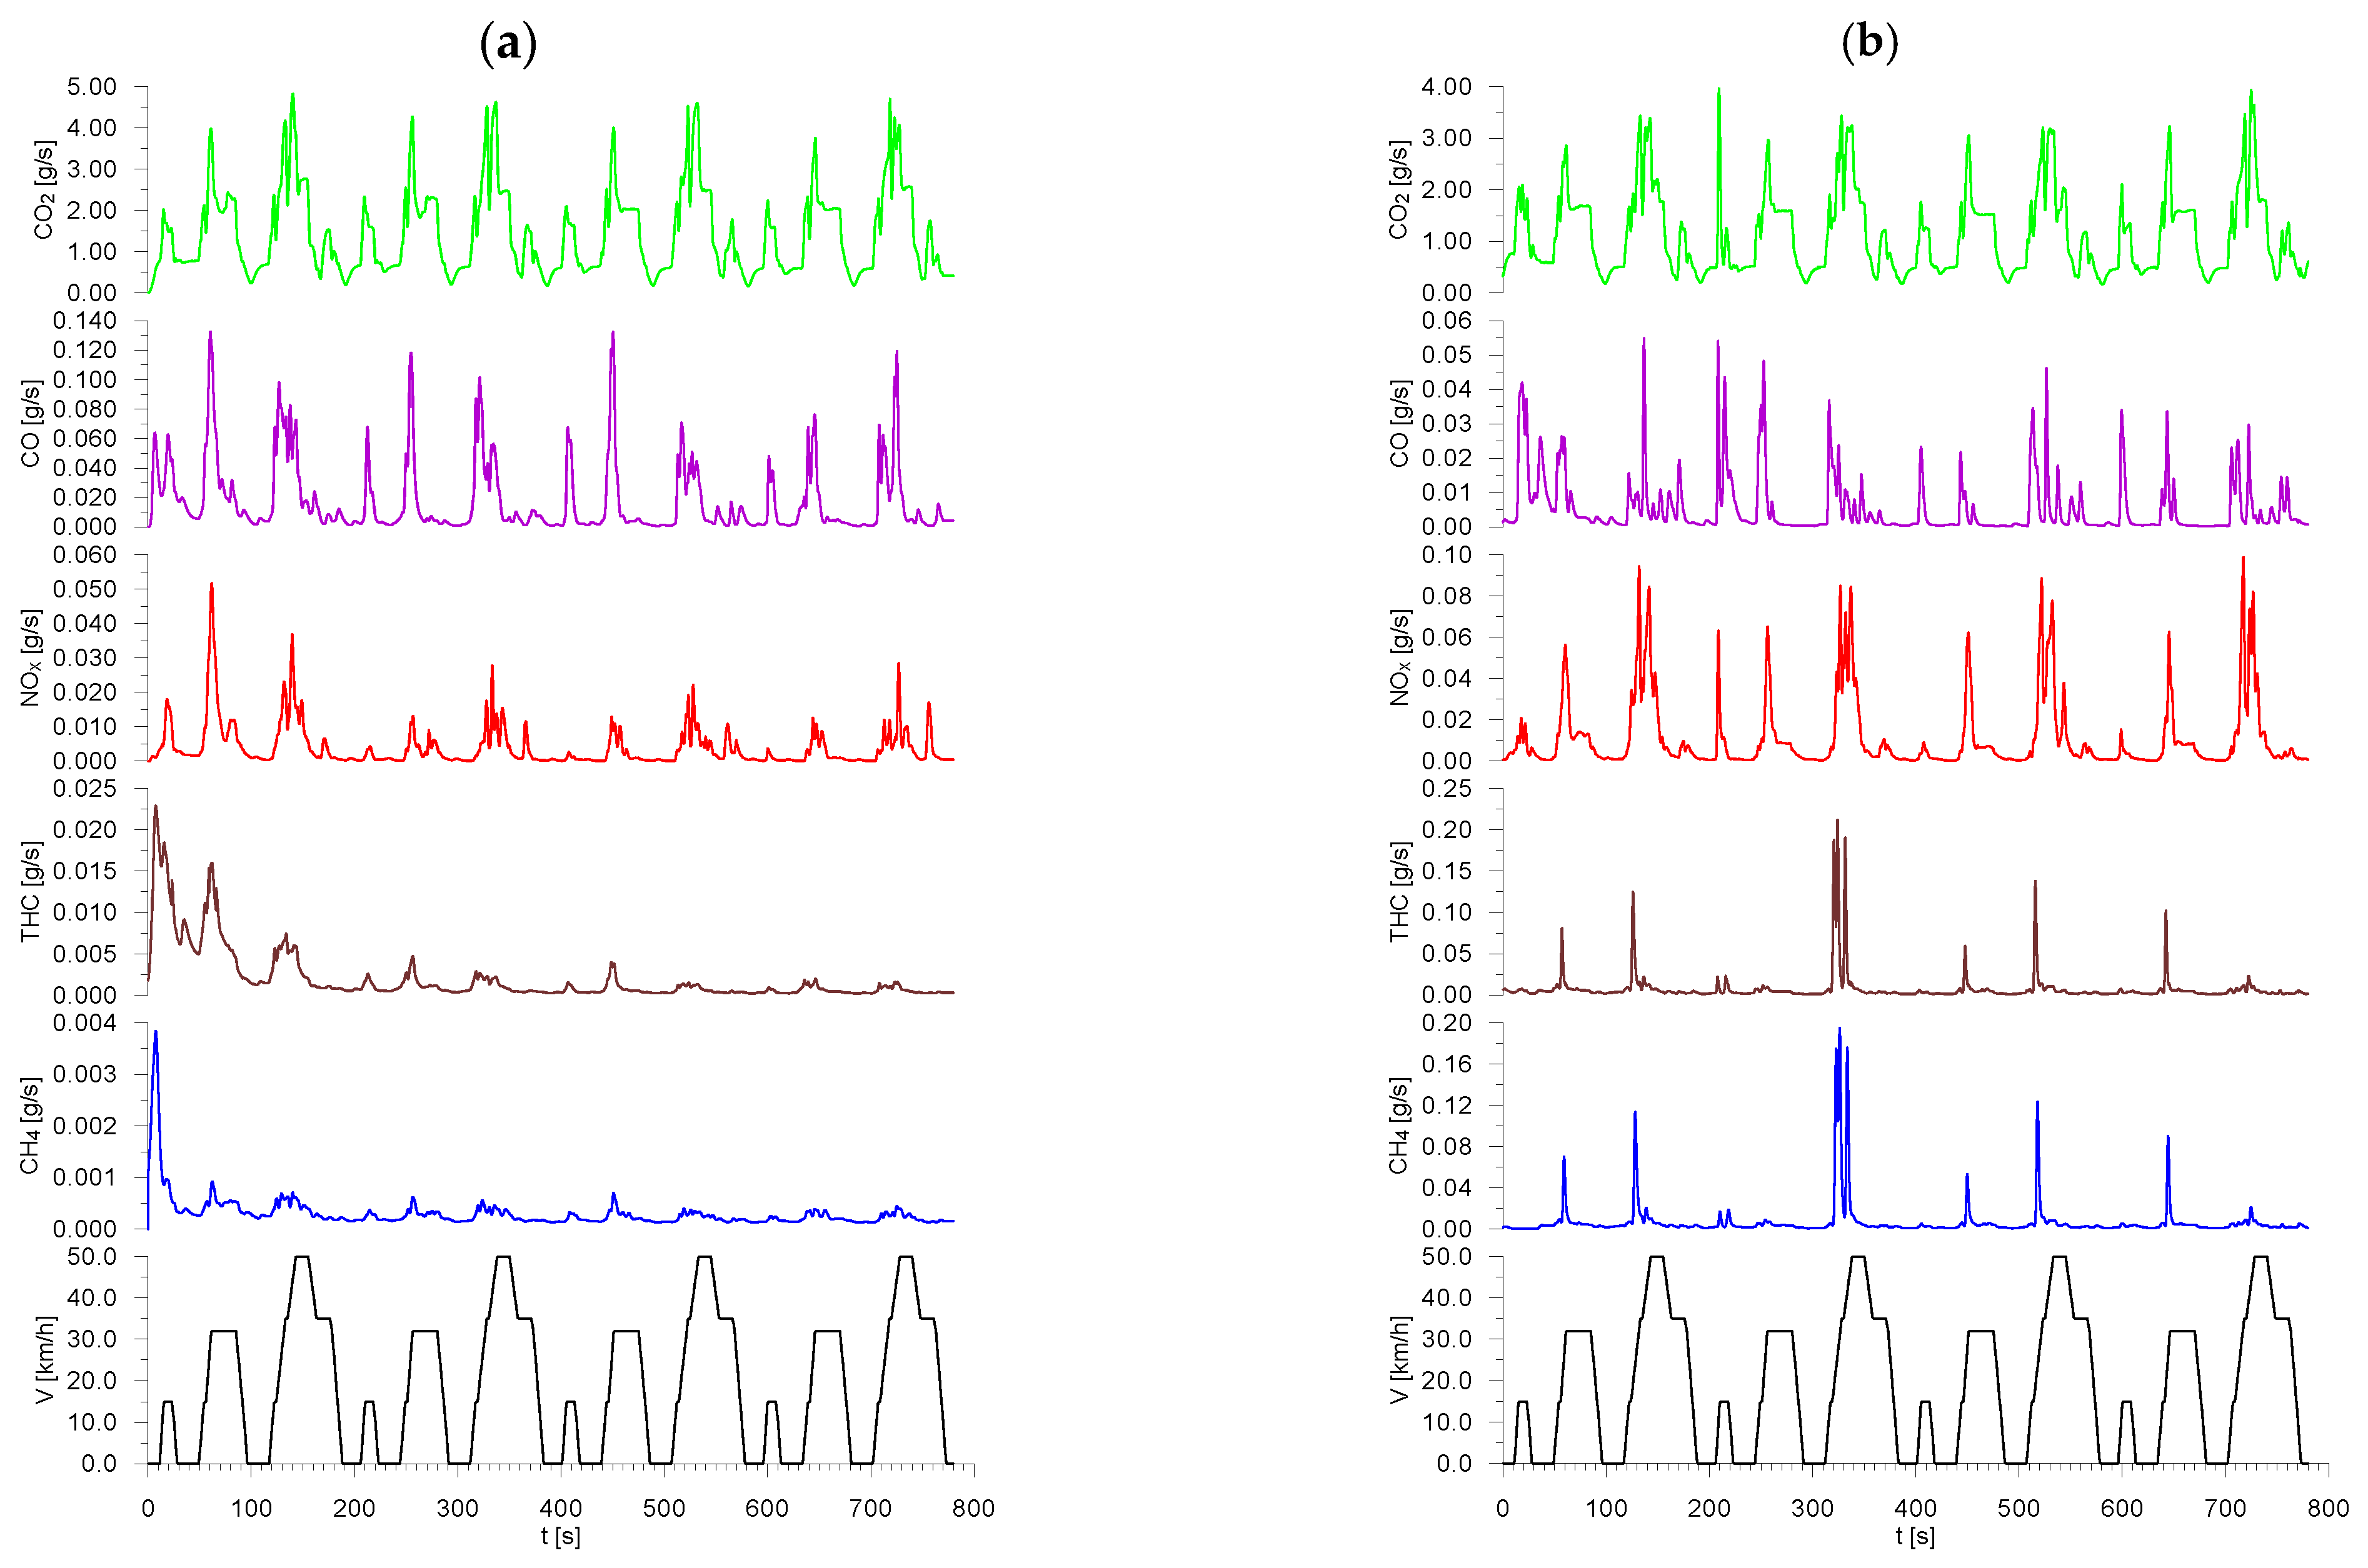
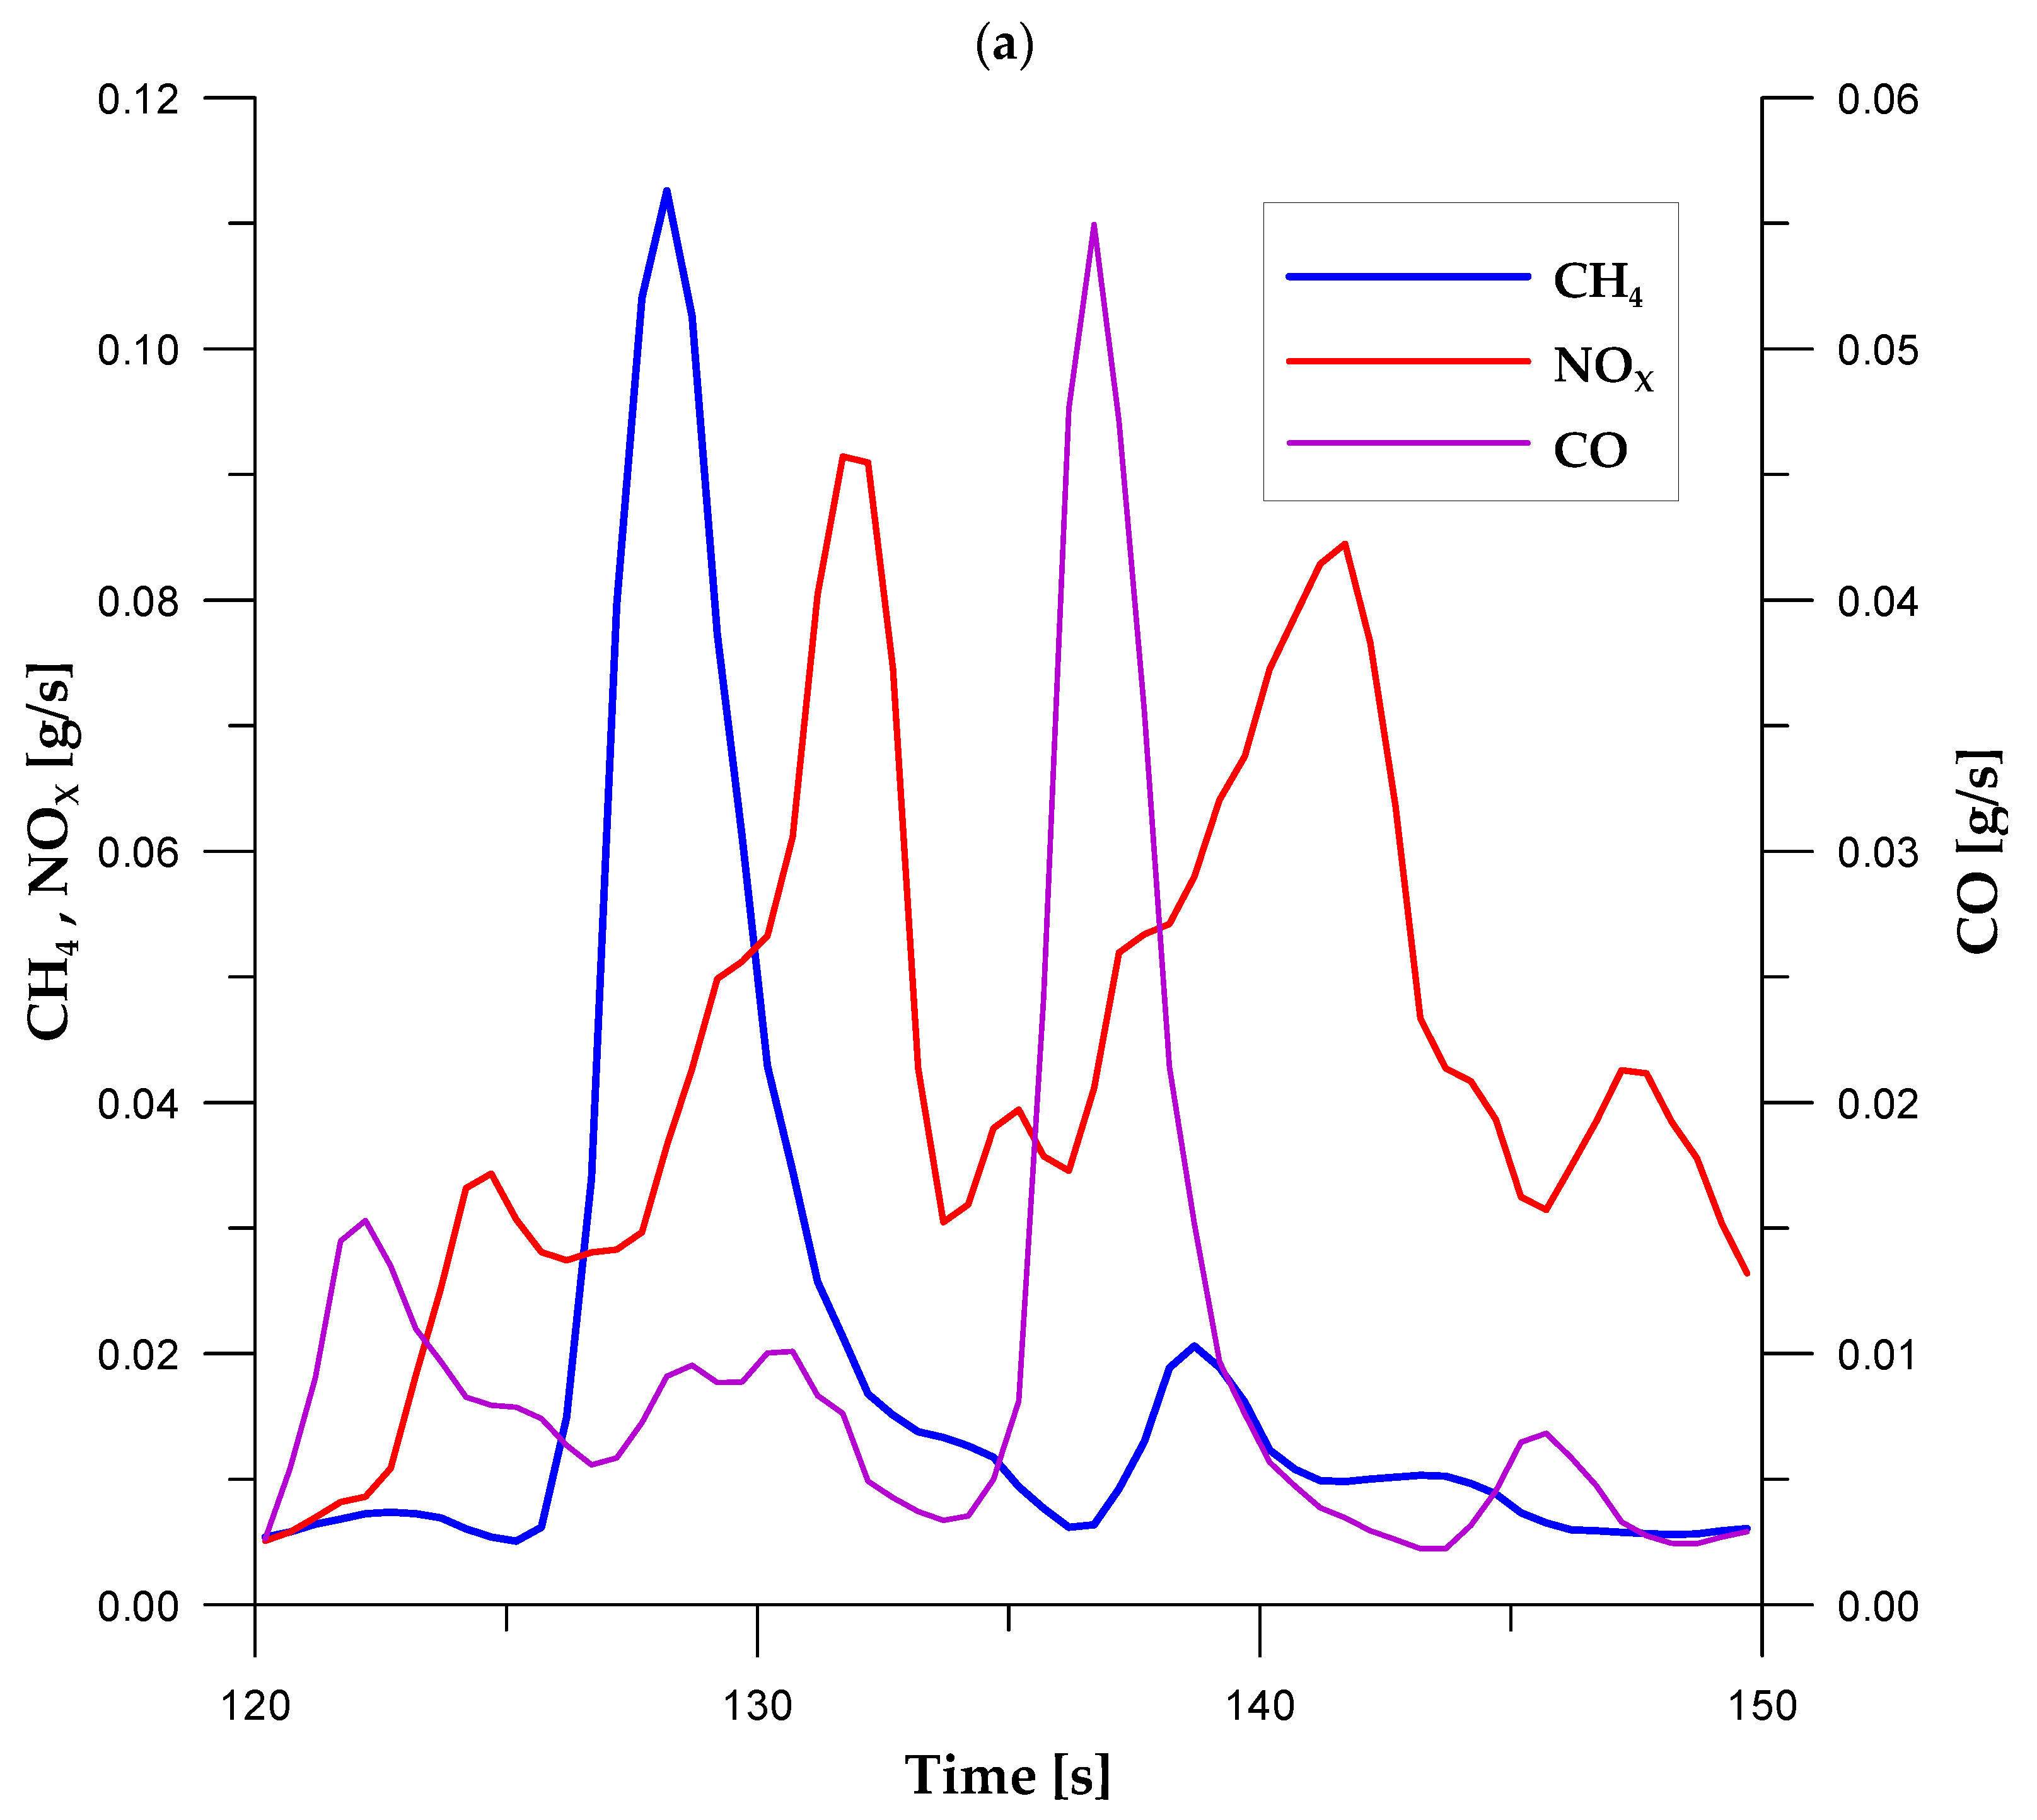
3. Results and Discussion

The results of emission tests when running the engine on gasoline and CNG are provided in Table 5 and Figure 3, Figure 4, Figure 5, Figure 6, Figure 7, Figure 8 and Figure 9.
Figure 3 and Figure 4 show the examples of instantaneous emission values when the engine was fueled with gasoline and CNG during the test cycles. They show changes in instantaneous emissions of CO2, CO, CH4, NOx and THC during the implemented urban driving-cycle phases (UDC, WLTC Class 3 Low, and WLTC Class 3 Medium). As can be seen from Figure 3 and Figure 4, the UDC driving cycle is characterized by repeatable phases of speed changes as a function of time, while for the WLTC Class 3 Low and Medium cycles, these changes are not repeatable. Significantly higher instantaneous emission values of THC, CH4 and NOx can be observed when the engine is powered by natural gas compared to the emission values when powered by gasoline. The presentation of the results, as shown in Figure 3 and Figure 4, further enables the identification of anomalies in the combustion process. In the UDC cycle, when the engine is fueled by natural gas, clear increases in CH4 emissions corresponding to the acceleration phases can be observed. On this basis, it was found, for example, that the high instantaneous values of CH4 (and THC) emissions observed at several points in the cycle during the CNG operation are the result of misfires. Analyzing the results in detail, when the engine is fueled with natural gas, the irregular large increases in methane emissions that occur during certain acceleration phases are caused by an increase in the equivalence ratio. For example, in Figure 5, the phases of increase of equivalence ratio, accompanied by the decrease in CO emissions and increase in NOx emissions, correspond to large growths in methane emissions. In contrast, phases of mixture enrichment, which in turn are accompanied by an increase in CO emissions and a decrease in NOx emissions, correspond to relatively lower methane emissions.
As can be seen from Figure 4, the instantaneous CH4 emission values were higher for the WLTC Class 3 Low phase than for the WLTC Class 3 Medium phase. The instantaneous CH4 emission values seen in the Low phase, which lasted for a very short time, were probably due to the instantaneous increase in the equivalence ratio, up to its flammability limits. This resulted in larger amounts of methane entering the exhaust system. The instantaneous emission data shown in Figure 3 and Figure 4 formed the basis for further analysis, including the average values of the emission (per km)of the tested exhaust components, which are shown in Figure 6, Figure 7, Figure 8, Figure 9 and Figure 10.
Figure 6 shows a comparison of the average CO2 emission for the car tested in UDC city cycles and WLTC Class 3 Low and Medium cycles. Description L + M is related to average emission (per km) for the Low and Medium phases. The emission rate when running on CNG is about 25% lower than when running on gasoline. This is the main advantage of natural gas over gasoline.
Figure 7 shows a comparison of methane emission rates. When running on natural gas, the CH4 emission values of the car tested were approx. 1.1 g/km for the UDC and approx. 1.4 g/km for the WLTC Class 3 Low phases. A slightly lower CH4 emission value of approx. 0.5 g/km was obtained for the WLTC Class 3 Medium phase.
When the engine is fueled with natural gas using a TWC catalytic converter, increased NOX emissions associated with the leanness of the fuel–air mixture can be a problem. The results shown in Figure 8 show approx. 3-times higher values of NOx emission when running on natural gas, relative to running on gasoline for the UDC cycle. For the Low and Medium phases of the WLTC Class 3 cycle, the differences are even greater. In the Low phase, the average NOx emission rate when running on natural gas was about 4-times higher, while in the Medium phase it was about 5-times higher relative to running on gasoline. This indicates that the increase in methane emissions when fueling with natural gas is particularly important in the case of temporary but large increases in the equivalence ratio, resulting in ignition failures. Such anomalies are not observed in vehicles with factory-installed CNG fueling, as confirmed, among others, by the works [35,36].
The values of CO average emission (per km) are significantly lower when fueled by natural gas (Figure 9). Compared to the rates when running on gasoline, the values of CO emission rates were about 4-times lower.
Figure 10 shows a comparison of THC average emission. Due to the high CH4 emissions, the THC emission-index values of the car tested are much higher when running on natural gas. The values of the THC emission when running on natural gas ranged from about 0.6 g/km for the WLTC Class 3 Medium-cycle phase to about 1.8 g/km for the WLTC Class 3 Low-cycle phase.
Relating the obtained emission results to the greenhouse effect, CO2eq values were calculated, assuming GWP [1] greenhouse potential values for methane equal to 28 (Table 6). GWP values for methane for a 100-year horizon were increased from 21 (for the Second Assessment Report) to 28 (for the Fifth Assessment report). This demonstrates the increasing importance of CH4 as a greenhouse gas. The comparative results of the CO2eq emission values are shown in Figure 11. Despite the high methane emissions when running on natural gas, CO2eq emissions are lower in relation to running on gasoline. The value of the average emission when running on natural gas in relation to running on gasoline is lower, being about 13% for the UDC cycle and the WLTC Class 3 Low phase. The difference between CO2eq emission for the WLTC Class 3 Medium phase was approx. 25% and approx. 20% for the urban part of the WLTC Class 3 (Low + Medium) cycle.
In order to assess the effect of the fuel–air-mixture composition when running on natural gas on the emission of gaseous pollutants in the exhaust gas, additional tests were carried out for constant-speed conditions. The speed value was set at 35.1 km/h, which is the average speed of the Low and Medium urban phases of the WLTC Class 3 cycle. The measurements were carried out for a constant load (the load power of the chassis dynamometer was 30 ± 1 kW), during which adjustments were made to the map controlling the dose of injected natural gas, resulting in a change in the value of the equivalence ratio, λ.
The results of the effect of the λ values on CH4, CO and NOX emissions are illustrated in Figure 12. The results confirm a significant increase in CH4 emissions within the range of an increase in the equivalence ratio. In the case of CH4, a sharp increase in emissions from about 0.0065 g/s to about 0.011 g/s was recorded in the λ range from about 1 to 1.05. Further increases in λ values in the range analyzed, at constant values of engine speed and load, resulted in an increase in CH4 emissions to about 0.0185 g/s at λ = 1.32. Therefore, it is important that the composition of the natural gas–air mixture be kept approximately within the stoichiometric range (λ ≈ 0.99–1.0), at most with a tendency to slight enrichment. The authors of Reference [37] came to similar conclusions. The effect of mixture enrichment is also an unfavorable increase in NOX emissions. An increase in the λ value to about 1.05 was associated with an increase in NOX emissions to 0.13 g/s, while for λ values from above 1.05 to about 1.2, NOX emissions were stabilized. For λ values above 1.23, NOX emissions decreased to a value of 0.1 g/s at λ = 1.32.

4. Conclusions

The following conclusions can be made on the basis of the research and an analysis of the results obtained:
  • The rapid increase in the equivalence ratio has a major impact on methane and nitrogen oxide emissions in an engine adapted to run on natural gas with a TWC catalytic converter.
  • The methane emission rate for the test car was at very similar levels for the urban part of the NEDC cycle (UDC phase) and the low-speed urban part of the WLTC Class 3 cycle (Low).
  • For the medium speed phase of the WLTC Class 3 cycle (Medium), the methane emission rate was lower than for the urban part of the UDC and for the Low.
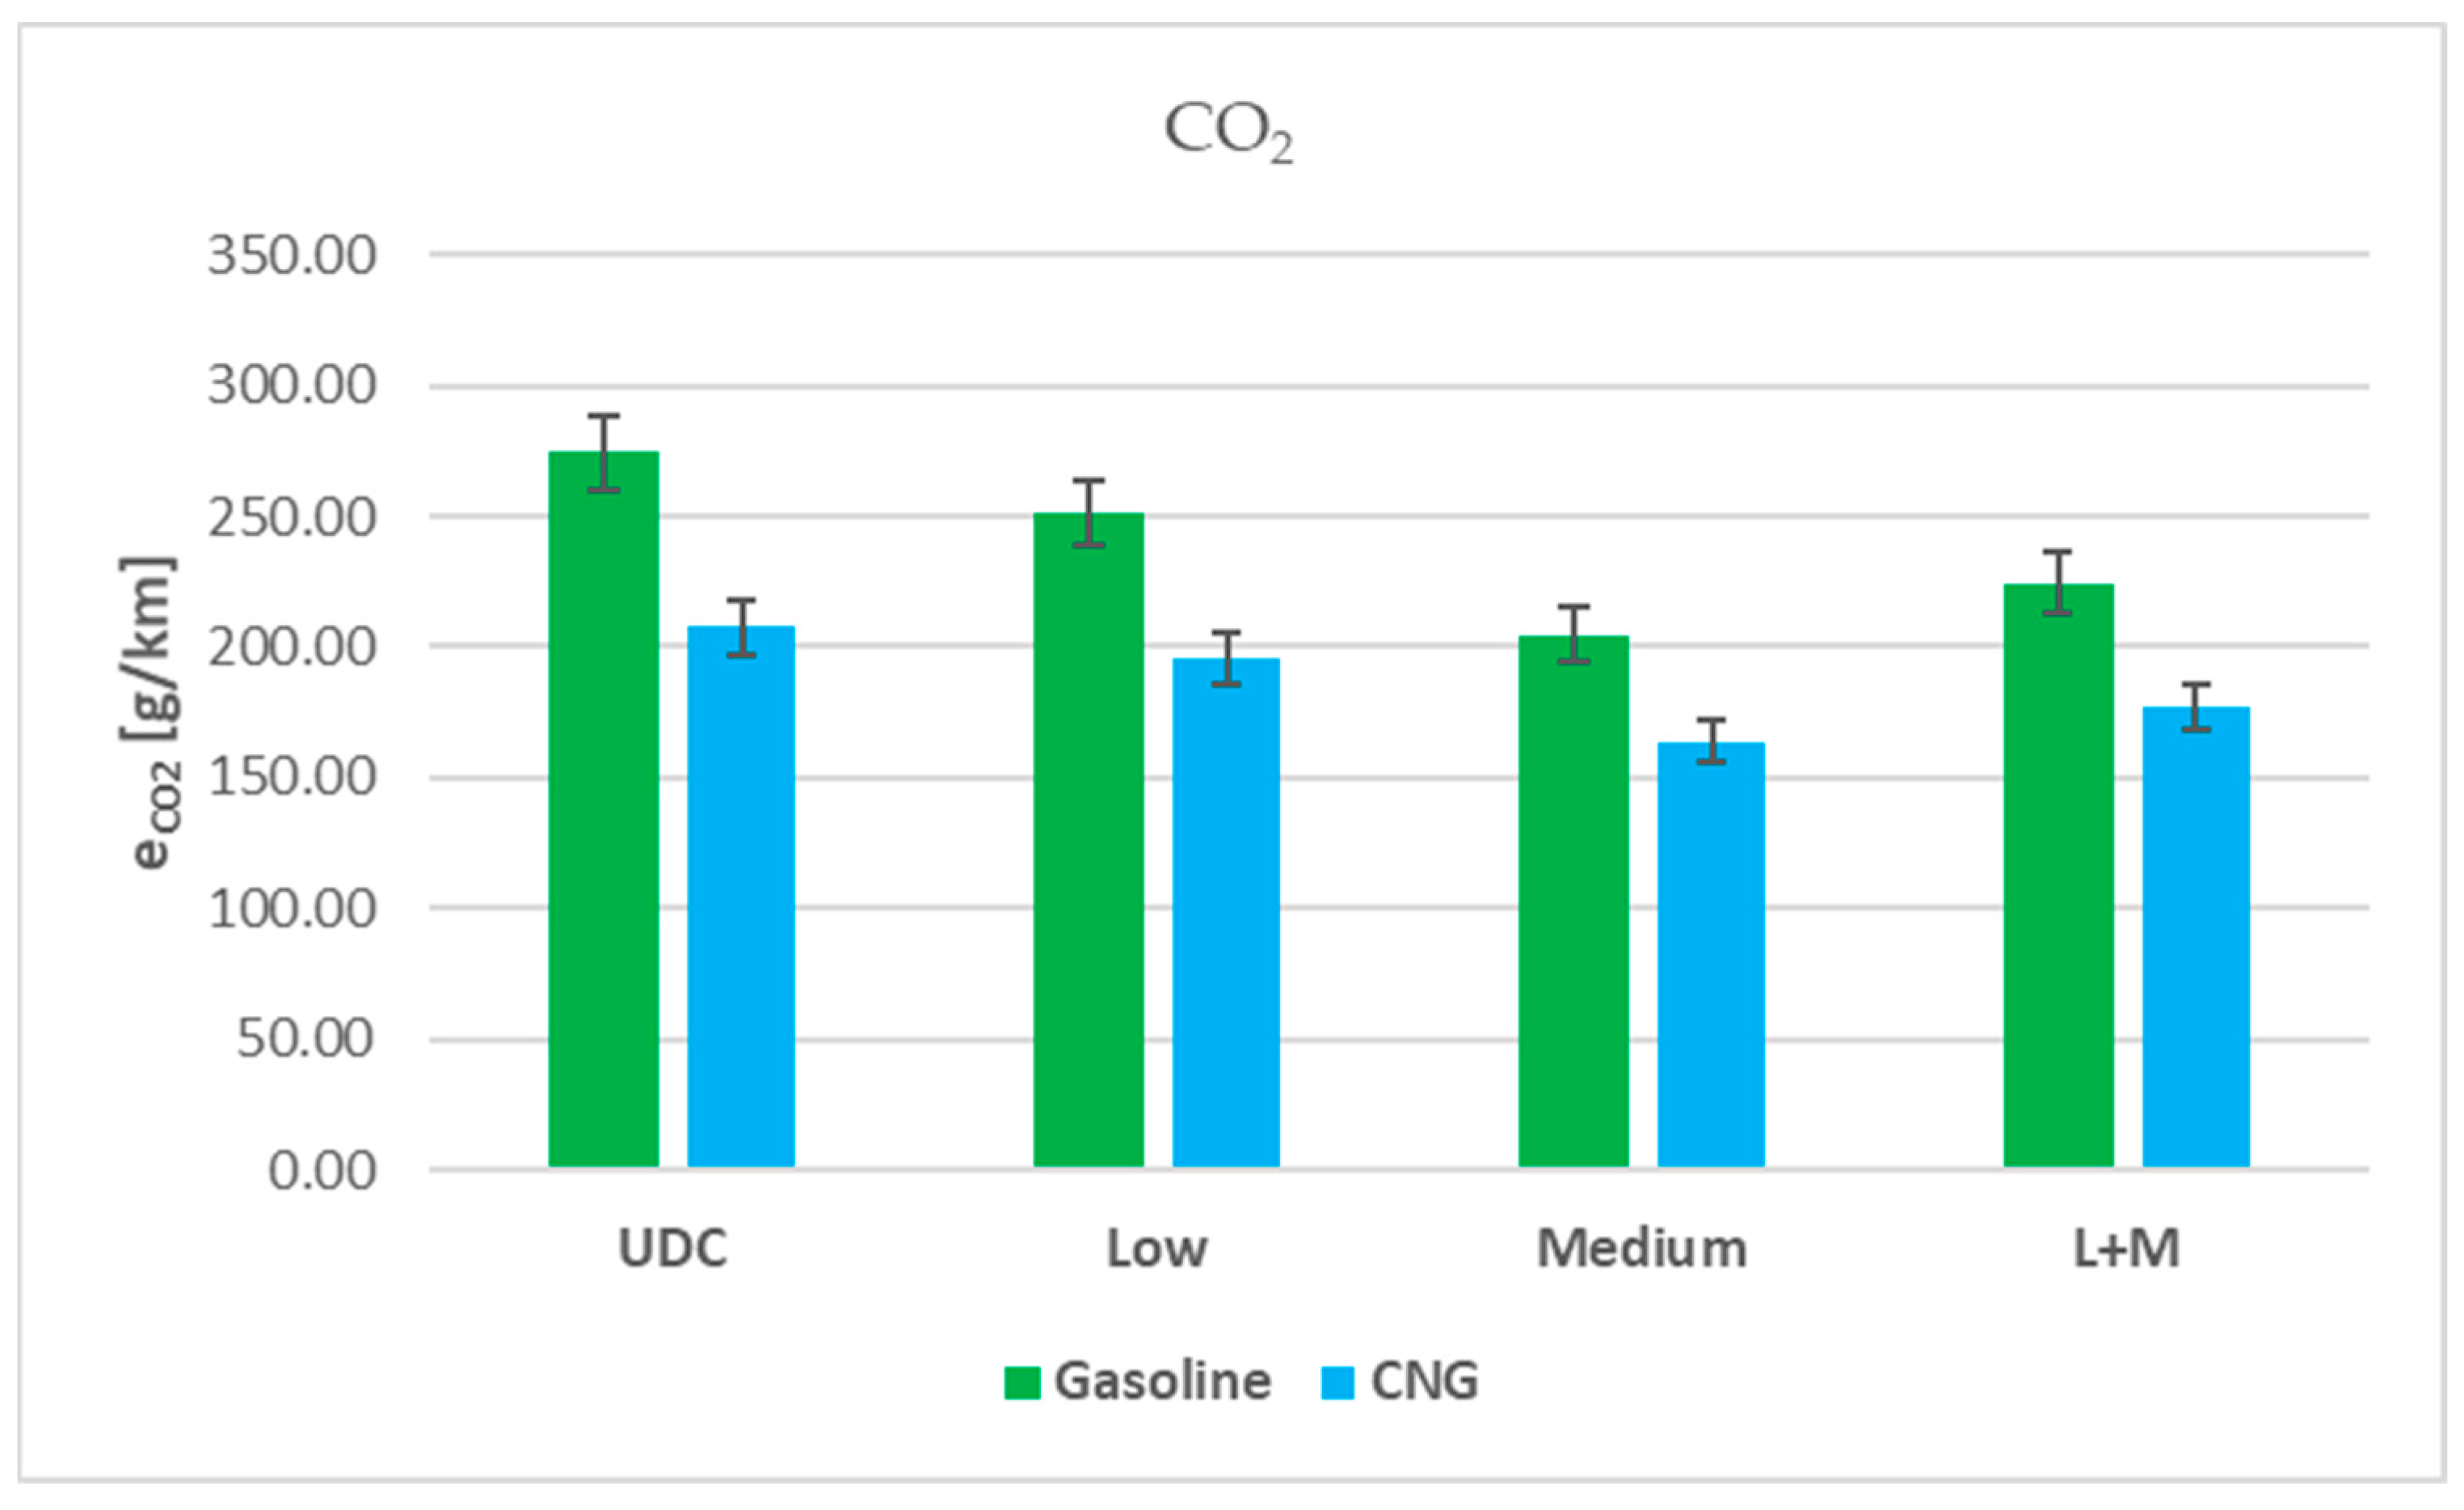
  • Despite higher CH4 emissions when the engine is powered by natural gas, the CO2eq equivalent emission value is, depending on the driving cycle, about 10–20% lower than when powered by gasoline.
The study carried out allows us to conclude that in IC engines adapted to CNG fueling it is advisable to modify the gas fueling systems, limiting the phenomenon of excessive increase in the equivalence ratio. The changes in a car adapted to run on natural gas should include both the fuel supply system and the exhaust after-treatment system. Regarding the fuel supply system, it would be advisable to use natural gas injectors that provide high operating speed. At the same time, the composition of the gas–air mixture should be close to the stoichiometric ratio. In addition, it would be advisable to consider the use of catalytic reactors optimized for natural gas-fueled operation, as in the case of factory-adapted CNG vehicles.
In the case of a car adapted to run on natural gas, in order to assess the correctness of the selection and adaptation of the system to the car’s engine, it would be beneficial to carry out verification according to the driving test and according to the urban part of the NEDC or WLTC cycles. Emission assessments carried out without an engine load under steady-state conditions (at idle speed, and for increased speed), which are used during diagnostic testing, may not fully reflect the emissions of pollutants in the exhaust gas.

Author Contributions

Conceptualization, A.J.; methodology, A.J.; validation, A.J., H.K. and K.B.; formal analysis, A.J. and H.K.; investigation, A.J., H.K., K.B. and M.J.; resources, A.J., H.K., K.B., P.W., K.L. and M.J.; data curation, A.J.; writing—original draft preparation, A.J., H.K., K.B., P.W., K.L. and M.J.; writing—review and editing, A.J., H.K., K.B., P.W., K.L. and M.J.; visualization, A.J., H.K. and K.B.; supervision, A.J. All authors have read and agreed to the published version of the manuscript.

Funding

This research received no external funding.

Institutional Review Board Statement

Not applicable.

Informed Consent Statement

Not applicable.

Data Availability Statement

Data are contained within the article.

Conflicts of Interest

The authors declare no conflicts of interest.

Abbreviations

AFRActual Air–Fuel Ratio
(AFR)stoichStoichiometric Air–Fuel Ratio
CFCChlorofluorocarbon
CH4Methane
CICompression Ignition
CLDChemiluminescense Detector
CNGCompressed Natural Gas
COCarbon Monoxide
CO2Carbon Dioxide
CVSConstant Volume Sampling
EUEuropean Union
FIDFlame Ionization Detector
FTIRFourier Transform Infrared
ICInternal Combustion
IRDInfrared Detector
HPDIHigh-Pressure Direct Injection
HVOHydrotreated Vegetable Oil
LPGLiquefied Petroleum Gas
LNGLiquefied Natural Gas
NEDCNew European Driving Cycle
NOxNitrogen Oxides
N2ONitrous Oxide
O3Ozone
PACPetroleum Analyzer Company
RDEReal Driving Emissions
SISpark Ignition
THCTotal Hydrocarbons
TWCThree-Way Catalyst
UDCUrban Driving Cycle
WLTCWorldwide harmonized Light-duty vehicles Test Cycle
λEquivalence ratio, defined as the actual air–fuel ratio to the stoichiometric air–fuel ratio

Appendix A

Table A1. Parameters of gasoline used in the study.
ParameterUnitAverage ValueSpan
Research Octane Number (RON)-96.000.00
Motor Octane Number (MON)-85.550.10
Anti-Knock Index (AKI)-90.750.10
Benzene% (v/v)0.440.01
Methyl tert-Butyl Ether (MTBE)% (v/v)0.520.01
Ethyl tert-Butyl Ether (ETBE)% (v/v)2.810.02
Methyl tert-Amyl Ether (TAME)% (v/v)0.000.00
Diisopropyl Ether (DIPE)% (v/v)0.000.00
Ethanol% (v/v)4.950.09
Methanol% (v/v)0.000.00
tert-Buthyl Alcohol (TBA)% (v/v)0.020.00
Olefins% (v/v)11.400.20
Total Aromatics% (v/v)29.250.30
C7 Aromatics% (v/v)8.900.20
C8 Aromatics% (v/v)10.700.20
Saturates% (v/v)51.250.30
Methylcyclopentadienyl Manganese Tricarbonyl (MMT)ppm (m/m)98.0016.00
Manganeseppm (m/m)25.004.00
Oxygen% (m/m)2.260.03
Density at 15 °Ckg/m3751.451.90
Volatility parameters
Initial Boiling Point (IBP)°C37.000.00
T10°C49.501.00
T50°C83.501.00
T90°C150.000.00
Final Boiling Point (FBP)°C192.000.00
E70% (v/v)40.300.40
E100% (v/v)57.650.30
E150% (v/v)89.400.20
E180% (v/v)97.250.10
E200% (v/v)58.650.30
E300% (v/v)88.950.10
Driveability Index-481.000.00
Vapor Lock Index-1008.5015.00
Dry Vapor Pressure Equivalent (DVPE)kPa72.701.80
Table A2. Parameters of natural gas * used in the study.
ParameterUnitAverage ValueSpan
Methane% (v/v)97.0590.880
Ethane% (v/v)1.4780.532
Propane% (v/v)0.4360.161
I-Butane% (v/v)0.0700.021
N-Butane% (v/v)0.0660.024
I-Pentane% (v/v)0.0160.004
N-Pentane% (v/v)0.0100.004
C6+% (v/v)0.0110.005
N2% (v/v)0.6280.078
CO2% (v/v)0.2270.092
O2% (v/v)0.0000.000
Heat of combustionkWh/m311.2130.074
Calorific valuekWh/m310.1120.069
Densitykg/m30.7420.008
Relative densitykg/m30.5740.006
Upper Wobbe numberkWh/m314.8010.036
Lower Wobbe numberkWh/m313.3480.034
Hydrogen sulfide contentmg/m30.0090.017
Total sulfur contentmg/m30.0450.050
Mercury contentµg/m30.0000.000
Mercaptan sulphurmg/m30.0180.030
Water dew-point temp.°C−9.5641.701
* Data provided by supplier.

References

  1. PCC Fifth Assessment Report. 2014. Global Warming Potential Values. Available online: https://ghgprotocol.org/sites/default/files/Global-Warming-Potential-Values%20%28Feb%2016%202016%29_0.pdf (accessed on 26 March 2024).
  2. Available online: https://climate.ec.europa.eu/eu-action/climate-strategies-targets/2030-climate-targets_en (accessed on 26 March 2024).
  3. Jaworski, A.; Mądziel, M.; Kuszewski, H. Sustainable Public Transport Strategies—Decomposition of the Bus Fleet and Its Influence on the Decrease in Greenhouse Gas Emissions. Energies 2022, 15, 2238. [Google Scholar] [CrossRef]
  4. Pielecha, J.; Skobiej, K.; Kubiak, P.; Wozniak, M.; Siczek, K. Exhaust Emissions from Plug-in and HEV Vehicles in Type-Approval Tests and Real Driving Cycles. Energies 2022, 15, 2423. [Google Scholar] [CrossRef]
  5. Bieniek, A.; Graba, M.; Mamala, J.; Prażnowski, K.; Hennek, K. Energy consumption of a passenger car with a hybrid powertrain in real traffic conditions. Combust. Engines 2022, 191, 15–22. [Google Scholar] [CrossRef]
  6. Sitnik, L.J. Emissions of e-mobility. Combust. Engines 2019, 178, 135–139. [Google Scholar] [CrossRef]
  7. Andrych-Zalewska, M.; Sitnik, L.; Sroka, Z.; Mihaylov, V. Fuel with a higher content of bio components in greenhouse effect aspects. Combust. Engines 2023, 192, 36–42. [Google Scholar] [CrossRef]
  8. Longwic, R.; Sander, P.; Zdziennicka, A.; Szymczyk, K.; Jańczuk, B. Combustion Process of Canola Oil and n-Hexane Mixtures in Dynamic Diesel Engine Operating Conditions. Appl. Sci. 2020, 10, 80. [Google Scholar] [CrossRef]
  9. Tutak, W.; Jamrozik, A.; Grab-Rogaliński, K. Co-Combustion of Hydrogen with Diesel and Biodiesel (RME) in a Dual-Fuel Compression-Ignition Engine. Energies 2023, 16, 4892. [Google Scholar] [CrossRef]
  10. Stelmasiak, Z.; Larisch, J.; Pietras, D. Selection of an algorithms controlling operation of supercharged compression ignition engine with additional fueling with CNG gas. Combust. Engines 2017, 170, 42–48. [Google Scholar] [CrossRef]
  11. Toema, M.A. Physics-Based Characterization of Lambda Sensor Output to Control Emissions from Natural Gas Fueled Engines. Ph.D. Thesis, Department of Mechanical and Nuclear Engineering, College of Engineering, Kansas State University, Manhattan, Kansas, 2010. Available online: https://core.ac.uk/download/pdf/5170501.pdf (accessed on 26 March 2024).
  12. Huonder, A.; Olsen, D. Methane Emission Reduction Technologies for Natural Gas Engines: A Review. Energies 2023, 16, 7054. [Google Scholar] [CrossRef]
  13. Bielaczyc, P.; Woodburn, J.; Szczotka, A. An assessment of regulated emissions and CO2 emissions from a European light-duty CNG-fueled vehicle in the context of Euro 6 emissions regulations. Appl. Energy 2014, 117, 134–141. [Google Scholar] [CrossRef]
  14. Posada, F. CNG Bus Emissions Roadmap: From Euro III to Euro VI. The International Council on Clean Transportation. 2009. Available online: http://theicct.org/sites/default/files/publications/CNGbuses_dec09.pdf (accessed on 26 March 2024).
  15. Abu Bakar, R.; Semin; Bakar, R.A. A Technical Review of Compressed Natural Gas as an Alternative Fuel for Internal Combustion Engines. Am. J. Eng. Appl. Sci. 2008, 1, 302–311. [Google Scholar]
  16. Merkisz, J.; Dobrzyński, M.; Kozak, M.; Lijewski, P.; Fuć, P. Environmental Aspects of the Use of CNG in Public Urban Transport; IntechOpen: Rijeka, Croatia, 2016. [Google Scholar] [CrossRef]
  17. Pan, D.; Tao, L.; Sun, K.; Golston, L.M.; Miller, D.J.; Zhu, T.; Qin, Y.; Zhang, Y.; Mauzerall, D.L.; Zondlo, M.A. Methane emissions from natural gas vehicles in China. Nat. Commun. 2020, 11, 4588. [Google Scholar] [CrossRef] [PubMed]
  18. Trivedi, S.; Prasad, R.; Mishra, A.; Kalam, A.; Yadav, P. Current scenario of CNG vehicular pollution and their possible abatement technologies: An overview. Environ. Sci. Pollut. Res. 2020, 27, 39977–40000. [Google Scholar] [CrossRef]
  19. Yang, W.; Kim, M.-Y.; Polo-Garzon, F.; Gong, J.; Jiang, X.; Huang, Z.; Chi, M.; Yu, X.; Wang, X.; Guo, Y.; et al. CH4 combustion over a commercial Pd/CeO2-ZrO2 three-way catalyst: Impact of thermal aging and sulfur exposure. Chem. Eng. J. 2023, 451, 138930. [Google Scholar] [CrossRef]
  20. Clark, N.N.; McKain, D.L.; Johnson, D.R.; Wayne, W.S.; Li, H.; Akkerman, V.; Sandoval, C.; Covington, A.N.; Mongold, R.A.; Hailer, J.T.; et al. Pump-to-Wheels Methane Emissions from the Heavy-Duty Transportation Sector. Environ. Sci. Technol. 2017, 51, 968–976. [Google Scholar] [CrossRef] [PubMed]
  21. Jaworski, A.; Lejda, K.; Bilski, M. Effect of driving resistances on energy demand and exhaust emission in motor vehicles. Combust. Engines 2022, 189, 60–67. [Google Scholar] [CrossRef]
  22. Grigoratos, T.; Fontaras, G.; Giechaskiel, B.; Martini, G. Assessment of the Heavy-Duty Natural Gas Technology; European Commission Joint Research Centre; Institute for Energy and Transport; Publications Office of the European Union: Luxembourg, 2015. [Google Scholar]
  23. Lejda, K.; Jaworski, A.; Mądziel, M.; Balawender, K.; Ustrzycki, A.; Savostin-Kosiak, D. Assessment of Petrol and Natural Gas Vehicle Carbon Oxides Emissions in the Laboratory and On-Road Tests. Energies 2021, 14, 1631. [Google Scholar] [CrossRef]
  24. Tripathi, G.; Sharma, P.; Dhar, A. Effect of methane augmentations on engine performance and emissions. Alex. Eng. J. 2020, 59, 429–439. [Google Scholar] [CrossRef]
  25. Karczewski, M.; Szamrej, G.; Chojnowski, J. Experimental Assessment of the Impact of Replacing Diesel Fuel with CNG on the Concentration of Harmful Substances in Exhaust Gases in a Dual Fuel Diesel Engine. Energies 2022, 15, 4563. [Google Scholar] [CrossRef]
  26. Zarrinkolah, M.T.; Hosseini, V. Methane slip reduction of conventional dual-fuel natural gas diesel engine using direct fuel injection management and alternative combustion modes. Fuel 2023, 331, 125775. [Google Scholar] [CrossRef]
  27. Schramm, J. (Ed.) IEA AMF Annex 51: Methane Emission Control. IEA Advanced Motor Fuels. 2019. Available online: https://orbit.dtu.dk/en/publications/iea-amf-annex-51-methane-emission-control (accessed on 26 March 2024).
  28. Rašić, D.; Oprešnik, S.R.; Seljak, T.; Vihar, R.; Baškovič, U.Ž.; Wechtersbach, T.; Katrašnik, T. RDE-based assessment of a factory bi-fuel CNG/gasoline light-duty vehicle. Atmos. Environ. 2017, 167, 523–541. [Google Scholar] [CrossRef]
  29. Bielaczyc, P.; Szczotka, A. The potential of current European light duty CNG-fuelled vehicles to meet Euro 6 requirements. Combust. Engines 2012, 151, 20–33. [Google Scholar] [CrossRef]
  30. Smigins, R. Ecological impact of CNG/gasoline bi-fuelled vehicles. Engineering for Rural Development. In Book Series: Engineering for Rural Development, Proceedings of the 16th International Scientific Conference: Engineering for Rural Development, Jelgava, Latvia, 24–26 May 2017; Faculty of Engineering and Information Technologies, Latvia University of Life Sciences and Technologies: Jelgava, Latvia, 2017. [Google Scholar] [CrossRef]
  31. AVL AMA i60, CVS i60 Exhaust Measurement System Specification; AVL List GmbH: Graz, Austria, 2013.
  32. Jaworski, A.; Kuszewski, H.; Ustrzycki, A.; Balawender, K.; Lejda, K.; Woś, P. Analysis of the repeatability of the exhaust pollutants emission research results for cold and hot starts under controlled driving cycle conditions. Environ. Sci. Pollut. Res. 2018, 25, 17862–17877. [Google Scholar] [CrossRef] [PubMed]
  33. Giechaskiel, B.; Clairotte, M.; Valverde-Morales, V.; Bonnel, P.; Kregar, Z.; Franco, V.; Dilara, P. Framework for the assessment of PEMS (Portable Emissions Measuremet Systems) uncertainty. Environ. Res. 2018, 166, 251–260. [Google Scholar] [CrossRef] [PubMed]
  34. European Commission. Commission Regulation (EU) 2017/1151 of 1 June 2017 supplementing Regulation (EC) No. 715/2007 of the European Parliament and of the Council on type-approval of motor vehicles with respect to emissions from light passenger and commercial vehicles (Euro 5 and Euro 6) and on access to vehicle repair and maintenance information, amending Directive 2007/46/EC of the European Parliament and of the Council, Commission Regulation (EC) No. 692/2008 and Commission Regulation (EU) No. 1230/2012 and repealing Commission Regulation (EC) No. 692/2008. Off. J. Eur. Union 2017, L175, 1–643. [Google Scholar]
  35. Giechaskiel, B.; Lähde, T.; Clairotte, M.; Suarez-Bertoa, R.; Valverde, V.; Melas, A.D.; Selleri, T.; Bonnel, P. Emissions of Euro 6 Mono- and Bi-Fuel Gas Vehicles. Catalysts 2022, 12, 651. [Google Scholar] [CrossRef]
  36. Lee, S.; Yi, U.H.; Jang, H.; Park, C.; Kim, C. Evaluation of emission characteristics of a stoichiometric natural gas engine fueled with compressed natural gas and biomethane. Energy 2021, 220, 119766. [Google Scholar] [CrossRef]
  37. Ferri, D.; Elsener, M.; Kröcher, O. Methane oxidation over a honeycomb Pd-only three-way catalyst under static and periodic operation. Appl. Catal. B Environ. 2018, 220, 67–77. [Google Scholar] [CrossRef]
Figure 1. Influence of air-to-fuel ratio on hydrocarbon conversion efficiency of TWC (three-way catalyst) converter.
Energies 17 02095 g001
Figure 2. Test stand: (a) photograph of a vehicle on the test bench, (b) test stand scheme: 1—tested vehicle, 2—chassis roller, 3—climate chamber, 4—driver’s assistance monitor, 5—chassis dynamometer control system, 6—AVL CVS i60 system, 7—AVL AMA i60 exhaust gas analysis system, 8—exhaust gas system, 9—control room, 10—cooling fan, 11—wideband λ sensor, 12—EcuMASTER EMU Black system, 13—laptop with recording software, 14—remote mixing unit.
Energies 17 02095 g002
Figure 3. Speed course and examples of instantaneous emission results for the UDC cycle when the engine was fueled with (a) gasoline and (b) CNG.
Energies 17 02095 g003
Figure 4. Speed course and examples of instantaneous emission results for the WLTC Class 3 Low and Medium phases when the engine was fueled with (a) gasoline and (b) CNG.
Energies 17 02095 g004
Figure 5. Example changes in instantaneous CO, CH4 and NOX emissions during the UDC cycle when fueled with natural gas: (a) UDC-cycle phase in the time range of 120 to 150 s, (b) UDC-cycle phase in the time range of 300 to 360 s.
Energies 17 02095 g005aEnergies 17 02095 g005b
Figure 6. Comparison of average CO2 emission (per km) when fueling the engine with gasoline and CNG for the analyzed urban cycles.
Energies 17 02095 g006
Figure 7. Comparison of average CH4 emission (per km) when fueling the engine with gasoline and CNG for the analyzed urban cycles.
Energies 17 02095 g007
Figure 8. Comparison of average NOX emission (per km) when fueling the engine with gasoline and CNG for the analyzed urban cycles.
Energies 17 02095 g008
Figure 9. Comparison of average CO emission (per km) when fueling the engine with gasoline and CNG for the analyzed urban cycles.
Energies 17 02095 g009
Figure 10. Comparison of average THC emission (per km) when fueling the engine with gasoline and CNG for the analyzed urban cycles.
Energies 17 02095 g010
Figure 11. Comparison of CO2eq average emission factors when the engine is powered by gasoline and CNG for the analyzed urban cycles (L + M—average emission factor for Low and Medium phases).
Energies 17 02095 g011
Figure 12. Effect of equivalence ratio (λ) on CH4, CO, and NOx emissions in the exhaust of a natural gas-fueled engine.
Energies 17 02095 g012
Table 1. Technical data of tested vehicle.
ParameterData
Year of production2001
Emission standardEuro 3
Engine displacement (cm3)2435
Compression ratio10:1
Engine working principlePositive ignition/4 stroke
Fuel typePetrol/CNG
Maximum net power (kW)/at (rpm)103/4500
Maximum engine torque (Nm)/at (rpm)220/3750
Odometer (km × 1000)275
Transmission type/number of gearsManual/5
Fuel system—petrolMulti-point indirect injection
Fuel system—CNGMulti-point gaseous-phase indirect injection
After-treatment systemTWC
Kerb weight (kg)1660
Table 2. Research apparatus list.
PurposeInstrument Data
Chassis dynamometerAVL-Zöllner, ROADSIM 48″, single roller;
rated power: 150 kW; maximum speed: 200 km/h
Dyno load force:
F0 = 7.9 N;
F1 = 0 N/(km/h);
F2 = 0.0536 N/(km/h)2
Maximum continuous tractive force: 5987 N
Maximum instantaneous tractive force: 10,096 N Tractive Force measurement error: ≤0.1%
Speed measurement error: ≤0.02 km/h
Distance measurement error: 0.001%/m
Automation systemiGem AVL
Constant volume sampling systemAVL CVS i60
Exhaust emission analyzerAVL AMA i60
Table 3. Specification of used AMA i60 analyzers.
Parameter/AnalyserFID i60 LCDIRD i60 CO2 LIRD i60 LCLD i60 LD
Measured componentsTHC and CH4CO2CONO and NOX
Noise≤0.5% of full-scale range≤1% of full-scale range≤1% of full-scale range≤1% of full-scale range
Drift≤1% of full-scale range/24 h≤1% of full-scale range/24 h≤1% of full-scale range/24 h≤1% of full-scale range/24 h
Reproducibility≤0.5% of full-scale range≤0.5% of full-scale range≤0.5% of full-scale range≤0.5% of full-scale range
Linearity≤2% of measured value (10–100% of full-scale range)
≤1% of full-scale range
whichever is smaller
≤2% of measured value (10–100% of full-scale range)
≤1% of full-scale range
whichever is smaller
≤2% of measured value (10–100% of full-scale range)
≤1% of full-scale range
whichever is smaller
≤2% of measured value (10–100% of full-scale range)
≤1% of full-scale range
whichever is smaller
Table 4. Parameters of driving cycles used in the study.
ParameterUnitUDCWLTC Class 3 LowWLTC Class 3 Medium
Distancekm3.9763.0954.756
Total times780589433
Idle (standing) times22815648
Average speed (incl. stops)km/h18.3518.939.5
Average driving speed (excl. stops)km/h25.9325.744.5
Maximum speedkm/h5056.576.6
Maximum accelerationm/s21.0421.471.57
Table 5. Emission results (g/km) for gasoline- and natural gas-fueled engine.
FuelTestComponentUDCWLTC Class 3 LowWLTC Class 3 Medium
Gasoline1CO2274.64252.65202.70
CO3.363.002.27
NOx0.760.720.69
THC0.380.130.04
CH40.0620.0260.061
2CO2273.77250.00206.35
CO1.573.422.33
NOx0.710.510.55
THC0.100.050.03
CH40.0110.0060.003
Natural gas1CO2206.49197.97162.59
CO1.0580.7160.392
NOx2.1392.2662.886
THC1.4231.1990.515
CH41.3090.9020.390
2CO2208.94192.96164.82
CO0.5560.8490.678
NOx1.7992.5052.737
THC1.1622.4880.635
CH40.8591.8730.482
Table 6. Global warming potential (GWP) values [1].
Greenhouse GasGWP Values for 100-Year Horizon
Second
Assessment Report
Fourth
Assessment
Report
Fifth
Assessment Report
CO2111
CH4212528
Disclaimer/Publisher’s Note: The statements, opinions and data contained in all publications are solely those of the individual author(s) and contributor(s) and not of MDPI and/or the editor(s). MDPI and/or the editor(s) disclaim responsibility for any injury to people or property resulting from any ideas, methods, instructions or products referred to in the content.

