Article

Geometrical Optimization of Segmented Thermoelectric Generators (TEGs) Based on Neural Network and Multi-Objective Genetic Algorithm

1
Hubei Key Laboratory of Theory and Application of Advanced Materials Mechanics, Wuhan University of Technology, Wuhan 430070, China
2
State Key Laboratory of Advanced Technology for Materials Synthesis and Processing, Wuhan University of Technology, Wuhan 430070, China
*
Author to whom correspondence should be addressed.
Submission received: 13 March 2024 / Revised: 25 April 2024 / Accepted: 26 April 2024 / Published: 27 April 2024

Abstract

:
In this study, a neural network and a multi-objective genetic algorithm were used to optimize the geometric parameters of segmented thermoelectric generators (TEGs) with trapezoidal legs, including the cold end width of thermoelectric (TE) legs (Wc), the ratios of cold-segmented length to the total lengths of the n- and p-legs (Sn,c and Sp,c), and the width ratios of the TE legs between the hot end and the cold end of the n- and p-legs (Kn and Kp). First, a neural network with high prediction accuracy was trained based on 5000 sets of parameters and the corresponding output power values of the TEGs obtained from finite element simulations. Then, based on the trained neural network, the multi-objective genetic algorithm was applied to optimize the geometric parameters of the segmented TEGs with the objectives of maximizing the output power (P) and minimizing the semiconductor volume (V). The optimal geometric parameters for different semiconductor volumes were obtained, and their variations were analyzed. The results indicated that the optimal Sn,c, Sp,c, Kn, and Kp remained almost unchanged when V increased from 52.8 to 216.2 mm3 for different semiconductor volumes. This work provides practical guidance for the design of segmented TEGs with trapezoidal legs.

1. Introduction

With the rapid development of the global economy, the consumption rates of traditional fossil fuels, such as coal, oil, and natural gas, have been continuously increasing, leading to a worsening energy crisis. Ensuring a sustainable and efficient energy supply requires the widespread adoption of clean and high-efficiency energy technologies. Thermoelectric generators (TEGs) are energy conversion devices that directly convert thermal energy into electrical energy by the Seebeck effect of thermoelectric (TE) materials [1]. Due to their compact structures and absence of moving parts [2], they have wide application prospects in areas such as body heat power generation and industrial waste heat recovery [3,4]. The conversion efficiencies of TEGs are closely related to the performances of the TE materials and the geometric dimensions of the devices [5,6,7]. Over the past thirty years, scientists have conducted extensive research on developing TE materials with high figures of merit (ZT), achieving significant results [8,9,10,11]. As the performances of TE materials have improved, the structural design and optimization of TEGs have also gained increasing attention.
Lavric [12] and Meng et al. [13] investigated the influences of the length and cross-sectional area of TE legs on the output performances of rectangular-cross-section TEGs using one-dimensional and three-dimensional numerical models. The research by Maduabuchi et al. [14] demonstrated that compared to rectangular TE legs with equal heights and volumes, trapezoidal legs had larger temperature gradients, resulting in higher conversion efficiencies. Fabian-Mijangos et al. [15] compared the performances of rectangular and trapezoidal TE legs through finite element simulations and experiments, and the results showed that the output power of the trapezoidal legs was approximately twice that of rectangular legs with the same volume. However, Sahin et al. [16] compared the output performances of TEGs with rectangular and trapezoidal legs, and the results showed that trapezoidal legs had higher conversion efficiencies but poorer output powers. Liu et al. [17] proposed a shape factor, m, to describe variable-cross-section TE legs, and the results indicated that the choice of boundary conditions determined whether the output performances of the trapezoidal legs were improved, while the shape factor m determined the extent of the performance enhancement or degradation. To further improve the conversion efficiency, the design concept of segmented TE legs has been proposed, which utilizes more suitable TE materials in different temperature ranges to enhance the output performances of TEGs [18,19]. Liu et al. [20] established a novel numerical model for a TEG, where the n-leg was a single-stage rectangular leg and the p-leg was a segmented trapezoidal leg. With the optimal segment length ratio (5:7) between the cold end and hot end materials, the output power of the segmented TEG was found to be 14.9% higher than that of the TEG using only the P1 material and 16.6% higher than that using only the P2 material.
In addition to the structural design of TE legs, the structural optimization of TEGs is also crucial. Ge et al. [21] combined the finite element method and the non-dominated sorting genetic algorithm (NSGA-II) to optimize the structure and load current of segmented TEGs, achieving the objectives of a minimum semiconductor volume and a maximum output power. However, the extensive numerical computations based on the finite element method are time-consuming. Zhu et al. [22] demonstrated the application of artificial neural networks and genetic algorithms in the geometric optimization of TEGs. The neural network achieved geometric optimization of TE legs within 40 s, which was more than 1000-times faster than the average optimization speed of finite element simulations. However, Zhu only performed geometric optimization for a single objective. The volume of semiconductor materials significantly impacts the power output of TEGs. TEGs with high power density may require the use of high-performance materials and advanced manufacturing processes, which could increase costs or technical challenges. A balanced analysis between output power and the volume of semiconductor materials is necessary to better meet practical requirements. Neural networks can learn complex nonlinear mapping relationships, aiding in understanding the intricate correlations between the internal structure and performance of TEGs, thus guiding the optimization design of TEG structures. Traditional optimization methods based on finite element models require extensive computation time and resources, while neural networks can learn from existing data, swiftly establish models, and make predictions, thereby expediting the process of structural optimization and saving time and costs. The use of the NSGA-II genetic algorithm enables simultaneous optimization of multiple objectives, rather than being limited to the optimization of a single performance indicator, thereby comprehensively exploring the design space and finding the optimal balanced solution. This is particularly useful for complex design spaces and large-scale parameter optimizations. Therefore, combining the neural network with the multi-objective genetic algorithm can help us design high-performance segmented TEGs with trapezoidal legs.
In this study, neural networks and multi-objective genetic algorithms were combined to optimize the cold end width of TE legs (Wc), the ratios of cold-segment lengths to the total lengths of n- and p-legs (Sn,c and Sp,c, respectively), and the width ratios of TE legs between the hot end and the cold end of n- and p-legs (Kn and Kp, respectively) of a segmented TEG with trapezoidal legs for the objectives of maximum output power (P) and minimum semiconductor volume (V). Based on the optimization results, the maximum output power and corresponding geometric parameters of segmented TEGs with different semiconductor volumes were obtained. This study investigated the variations in the optimized geometric parameters, providing practical guidance for industrial applications of segmented TEGs with trapezoidal legs.

2. Methods

2.1. Model and Boundary Conditions

A schematic diagram of the segmented TEG model with trapezoidal legs is shown in Figure 1. The device consisted of a pair of n- and p-type TE legs, copper electrodes, and ceramic plates. In this work, the thickness of the ceramic plate was 0.7 mm, the thickness of the copper electrodes was 0.3 mm, and the length of the TE legs (L) was 5 mm. The cross-sections of the n- and p-type TE legs were square, and the cross-sectional areas at the cold end were equal.
The TE materials selected for this study were n-type Bi2Te3 and n-type skutterudite for the n-type TE leg, and p-type Bi2Te3 and p-type skutterudite for the p-type TE leg. Bi2Te3 was used in the low-temperature region, while skutterudite was used in the intermediate-temperature region. The temperature-dependent properties and corresponding ZT values of these materials obtained from the literature are shown in Figure 2 [23].
The boundary conditions used in this study were as follows: the surface temperature of the ceramic plate at the hot end was 700 K, the ambient temperature of the surroundings at the cold end was 300.15 K, and the convective heat transfer coefficient on the surface of the ceramic plate at the cold end was 1200 W/(m2K) [24]. Except for the surfaces of the ceramic plates at the hot and cold ends, all other surfaces were insulated, and the contact thermal resistance and contact electrical resistance were neglected [25]. The segmented TEG with trapezoidal legs was connected to external resistance to form a circuit, where the cold end copper electrode of the n-type TE leg was coupled with the external resistance, and the cold end copper electrode of the p-type TE leg was grounded [24].

2.2. Governing Equations

To simulate the TE performance of the segmented TEG, a three-dimensional finite element model was established to solve the temperature field and electric field equations. The coupled equations for the TE potential and temperature of the segmented TEG were as follows:
· q = Q
· J = 0
where q, Q′ and J represent the heat flux vector, joule heat energy, and current density, respectively. Q′ and q can be rewritten as follows:
Q = J · E
q = k T + P J
E = V
In the above equations, P′ represents the Peltier coefficient, while E represents the electric field intensity, and V represents voltage. The Peltier coefficient P′ and current density J can be expressed as:
P = α T
J = σ ( E α T )
When there is a temperature difference ΔT across the two ends of the segmented TEG, according to the Seebeck effect, a stable open-circuit voltage V will be generated across the semiconductor. The voltage equation was:
V = α Δ T
When an external resistor RL is connected to the segmented TEG to form a circuit loop, under the influence of the temperature difference, the load current I in the circuit at this time can be represented as:
I = α Δ T R L + R I
The output power Pout of the segmented TEG can be represented as:
P out = ( α Δ T ) 2 ( R L + R I ) 2 R L
From Equation (10), it can be seen that the maximum output power occurs when the load resistance equals the internal resistance of the segmented TEG (RL = RI). At this point, the maximum power Pmax of the segmented TEG can be represented as:
P max = ( α Δ T ) 2 4 R L
Assuming the hot side area of the segmented TEG is Ah, when the heat input to the segmented TEG is a constant heat flux q, neglecting heat loss, the total heat absorbed by the hot side Qh can be expressed as:
Q h = q × A h
Then, the conversion efficiency η of the segmented TEG can be obtained as:
η = P out Q h

2.3. Neural Network Dataset Generation and Training

The dataset used in this study consisted of a parameter set and the corresponding output power of the segmented TEG with trapezoidal legs. For the parameter set, 5000 random values were uniformly generated within the range of each geometric parameter, and the ranges and resolutions of each geometric parameter are listed in Table 1. The 5000 sets of randomly obtained parameters were used for finite element simulations, with a refined mesh configuration selected for the numerical calculations to determine the maximum output power of the segmented TEG with trapezoidal legs. During the simulation of the finite element models, the external load was not fixed. The range of the external resistor varied from 0.0001 Ω to 1 Ω. For each parameter set, the electrical terminals were directly connected to the external resistor and swept from 0.0001 Ω to 1 Ω. The maximum output power was then extracted from a parabolic fit of the output power against the external resistor. The total computation time for three-dimensional finite element models was 167 h.
A radial basis function (RBF) neural network was employed in this study, and the structure of the network is shown in Figure 3. The network connected the input layer of the geometric parameters (Wc, Sn,c, Sp,c, Kn, Kp) with the output layer of the output power (P) through a hidden layer. The neural network contained one hidden layer with 4250 neurons. Prior to training the neural network, the dataset was divided into two sub-datasets for training (4250 samples) and testing (750 samples) of the neural network. The 4250 samples used for training were randomly selected from the dataset, and the remaining 750 samples of the dataset were used for the testing dataset of the neural network. The training dataset was fed into the neural network, and the neural network model was optimized by adjusting various network parameters. The prediction accuracy of the neural network model was evaluated using the testing dataset.

2.4. Multi-Objective Optimization with Constraint Condition

The two objective functions used in this study are defined as follows:
J 1 = V = W c 2 L 3 ( K n 2 + K p 2 + K n + K p + 2 )
J 2 = P
where P is predicted by the trained neural network model. In this study, the non-dominated sorting genetic algorithm (NSGA-II) was employed to optimize the above two objective functions. Smaller values of J2 and J1 corresponded to larger fitness values. During the evolution process, individuals were ranked based on their fitness values, with individuals having higher fitness values more likely to be selected and preserved. As the iterative process continued, the Pareto optimal solutions evolved gradually [21].
During the optimization process, infeasible situations may arise where the output power is negative (p < 0 W) and the semiconductor volume is negative (V < 0 mm3). Considering the practical situation, the constraints are set as positive output power and positive semiconductor volume. In this study, a penalty function was used to address this issue by increasing the objective function values of individuals that did not meet the constraint conditions to a large number, thereby eliminating them. After sufficient time, the Pareto front was obtained, and the optimization process ended. The entire optimization process is illustrated in Figure 4, with a population size of 150 and 200 evolution generations employed in this study. The crossover rate was 0.9, and the mutation probability was 0.1. The NSGA-II genetic algorithm optimization process took 12 min, indicating that the RBF neural network model can quickly predict the maximum output power of segmented TEGs with trapezoidal legs, thereby accelerating their structural optimization process.

3. Results and Discussion

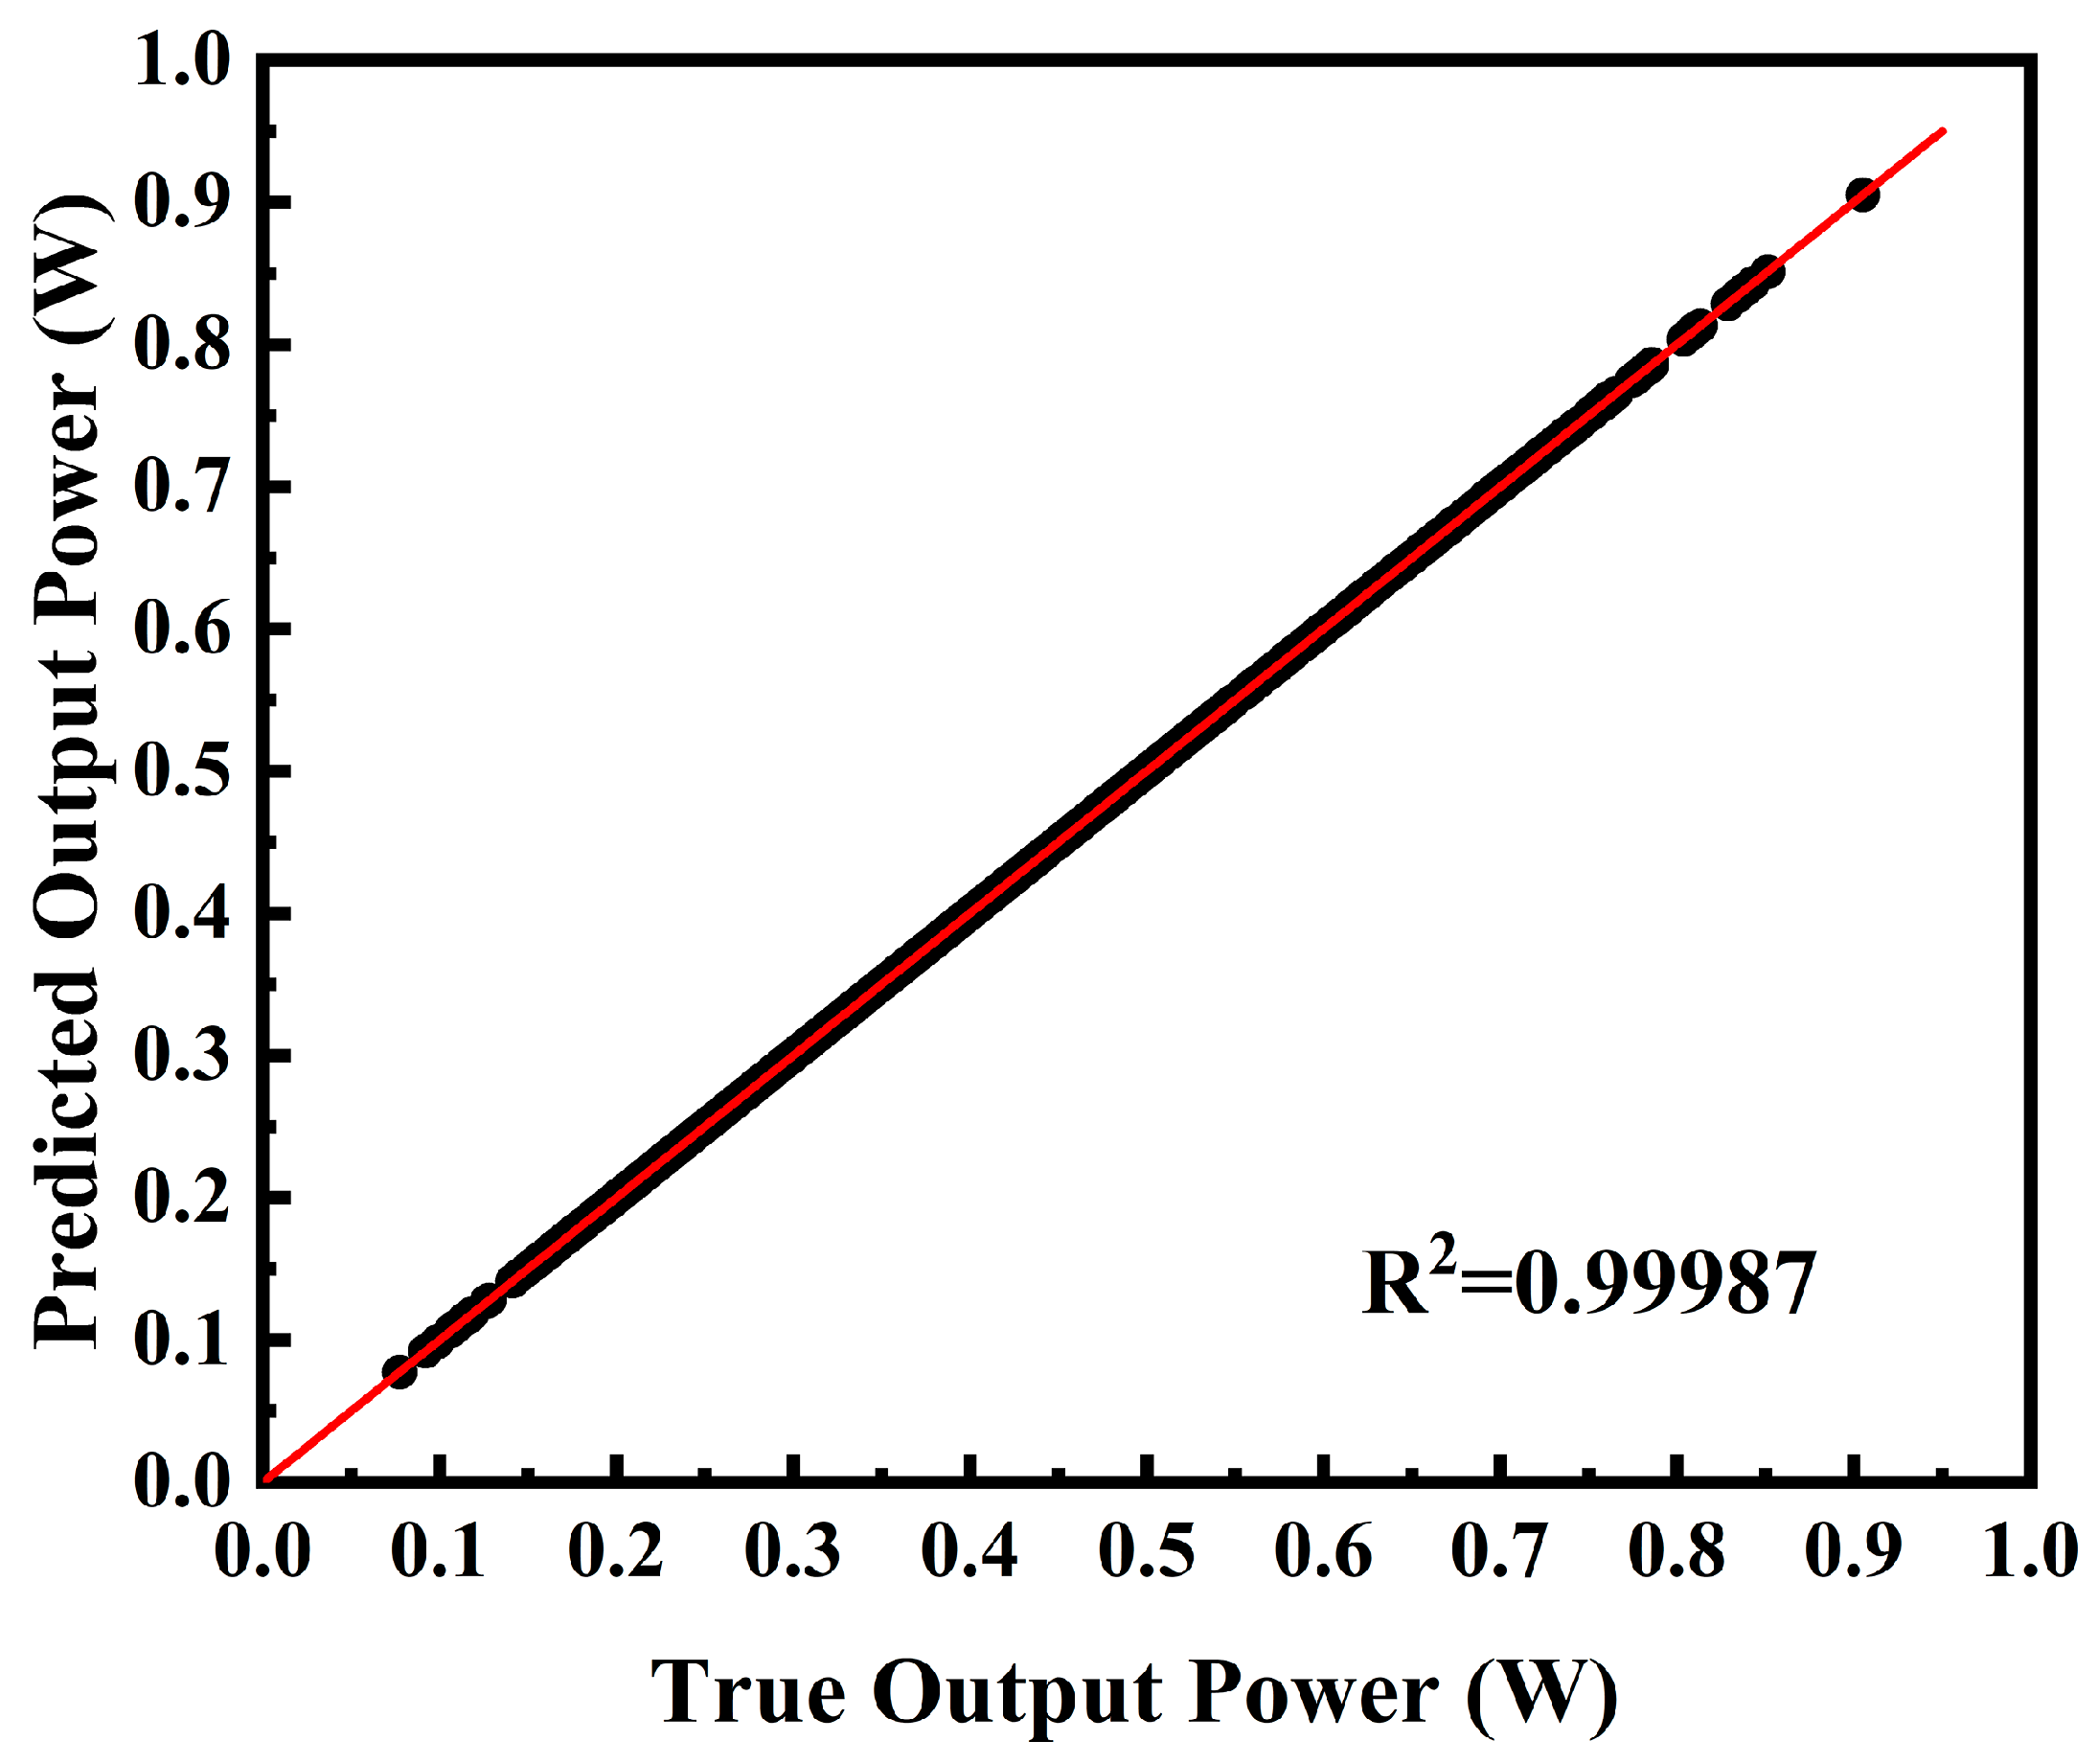
3.1. Neural Network Prediction

Figure 5 presents a comparison between the true values of P (obtained from finite element simulations) in the test dataset and the values predicted by the neural network. The R2, also known as the coefficient of determination, is a metric used to assess the predictive accuracy of regression models. If R2 approached 1, it indicated that the RBF neural network model could perfectly fit the data, resulting in high predictive accuracy. The results predicted by the neural network closely aligned with the true values in the test dataset, with a coefficient of determination (R2) for P exceeding 0.999. This high R2 value indicates that the trained neural network model exhibited a high level of prediction accuracy.

3.2. Optimization Results

The Pareto front obtained from the optimization is presented in Figure 6a, which shows the maximum P of the segmented TEGs with different V values. Clearly, as V increased, P also increased, indicating that all Pareto solutions were non-dominated, with no solution superior to the others across all objective functions. V varied from 33.9 to 349.4 mm3, and P varied from 0.060 to 0.934 W. Moreover, the absolute value of the ratio between J2 and J1 is the power density (PDmax) of the segmented TEG with trapezoidal legs. Figure 6b presents the maximum PDmax of segmented TEGs with different V values. When V was 52.8 mm3, the corresponding maximal value of PDmax was 3.47 W/cm3, and the corresponding geometric parameters and output performance are listed in Table 2. It should be noted that when V decreased from 216.2 to 52.8 mm3, PDmax increased by 4.4%, while P decreased by 74.5%. In industrial production, a higher power density of TEGs can improve the operating efficiency. However, pursuing high-power density at the expense of output power is not desirable. Thus, a trade-off analysis between volume and power is more aligned with actual industrial requirements.
The variations in the optimized geometric parameters along with the Pareto front are shown in Figure 7a,b, where V was calculated using Equation (1). It can be observed that when the range of V was from 52.8 to 216.2 mm3, the optimal Sn,c, Sp,c, Kn, and Kp values remained relatively constant as V increased. The optimal Wc increased with V, while Sn,c and Sp,c were 0.27, Kn was 0.5, and Kp was 0.55. When V was less than 52.8 mm3, the optimized Wc was always 3 mm. Increasing Wc for a fixed V of the TE legs resulted in a decrease in Kn (or Kp), thereby increasing the resistance of the segmented trapezoidal TEG and reducing its output power. When V was greater than 216.2 mm3, the optimized Wc was always 6 mm. Decreasing Wc for a fixed V of the TE legs led to an increase in Kn (or Kp), thereby reducing the temperature gradient of the segmented trapezoidal TEG and lowering its output power. The results demonstrate that when V ranged from 52.8 to 216.2 mm3, the optimal Sn,c, Sp,c, Kn, and Kp for different V values remained relatively constant. In this range, the geometric parameter Wc played a significant role in determining the output performance of the segmented TEG with trapezoidal legs. There are certain limitations to this study. The ranges of parameters for network training and finding the optimal geometry are the same. The whole procedure has full meaning if the optimal geometry is extracted for a different range of parameter values.

3.3. Comparison Results

According to Figure 6b, it can be observed that when the range of semiconductor volumes varies from 52.8 to 216.2 mm3, the power density of segmented TEGs with trapezoidal legs changes only slightly. Therefore, we compared the output power and conversion efficiency before and after optimization of segmented TEGs with trapezoidal legs within this volume range. We also performed numerical simulations in COMSOL Multiphysics software version 5.6 using the parametric sweep functionality to calculate the maximum output power and maximum conversion efficiency of segmented TEGs under different external loads. The range of variation for the resistance values of the external load was from 0.0001 Ω to 0.1 Ω. The output power or conversion efficiency generated in the circuit reaches its maximum value when the resistance value of the external load is equal to the internal resistance value of the segmented TEG. A comparison of the output power P and the conversion efficiency η of the segmented TEGs with different V values before and after optimization is shown in Figure 8a,b. As shown in Figure 8a, when V was 104, 156, and 206 mm3, the optimized P was increased by 14.2%, 26.6%, and 22%, respectively. As shown in Figure 8b, when V was 104, 156, and 206 mm3, the optimized η increased by 19.1%, 23.3%, and 24.7%, respectively. The geometric parameters of the segmented TEGs with trapezoidal legs before and after optimization are listed in Table 3, where the geometric parameters before optimization were randomly generated, and the geometric parameters after optimization were determined based on Figure 7a,b. The geometry before optimization was randomly generated, and another randomly selected non-optimized geometry (one for each volume) may yield either better or worse results.
The temperature distributions of segmented TEGs with trapezoidal legs before and after optimization are shown in Figure 9. Table 4 lists the temperature differences between the hot end and the cold end of segmented TEGs with different V values before and after optimization. Optimizing the geometric parameters can improve the thermal dissipation performance of segmented TEGs with trapezoidal legs, resulting in lower temperatures at the cold end ceramic plate of the TEG, thus increasing the temperature difference between the cold and hot end ceramic plates. The temperature difference between the hot end and the cold end of the segmented TEG after optimization was significantly higher than that before optimization, which was the main reason for the improved output performance.

4. Conclusions

This study demonstrated the application of a neural network and a multi-objective genetic algorithm in the geometric optimization of segmented TEGs with trapezoidal legs. Based on the optimized results, the following conclusions are drawn:
  • A trade-off analysis between V and P is more in line with practical industrial requirements. Only through comprehensive consideration can the most suitable design solution be found.
  • The computation time for 5000 sets of finite element models was 167 h, while the optimization process of the NSGA-II genetic algorithm took only 12 min. The RBF neural network model can rapidly predict the maximum output power of segmented TEGs with trapezoidal legs, thereby accelerating their structural optimization process.
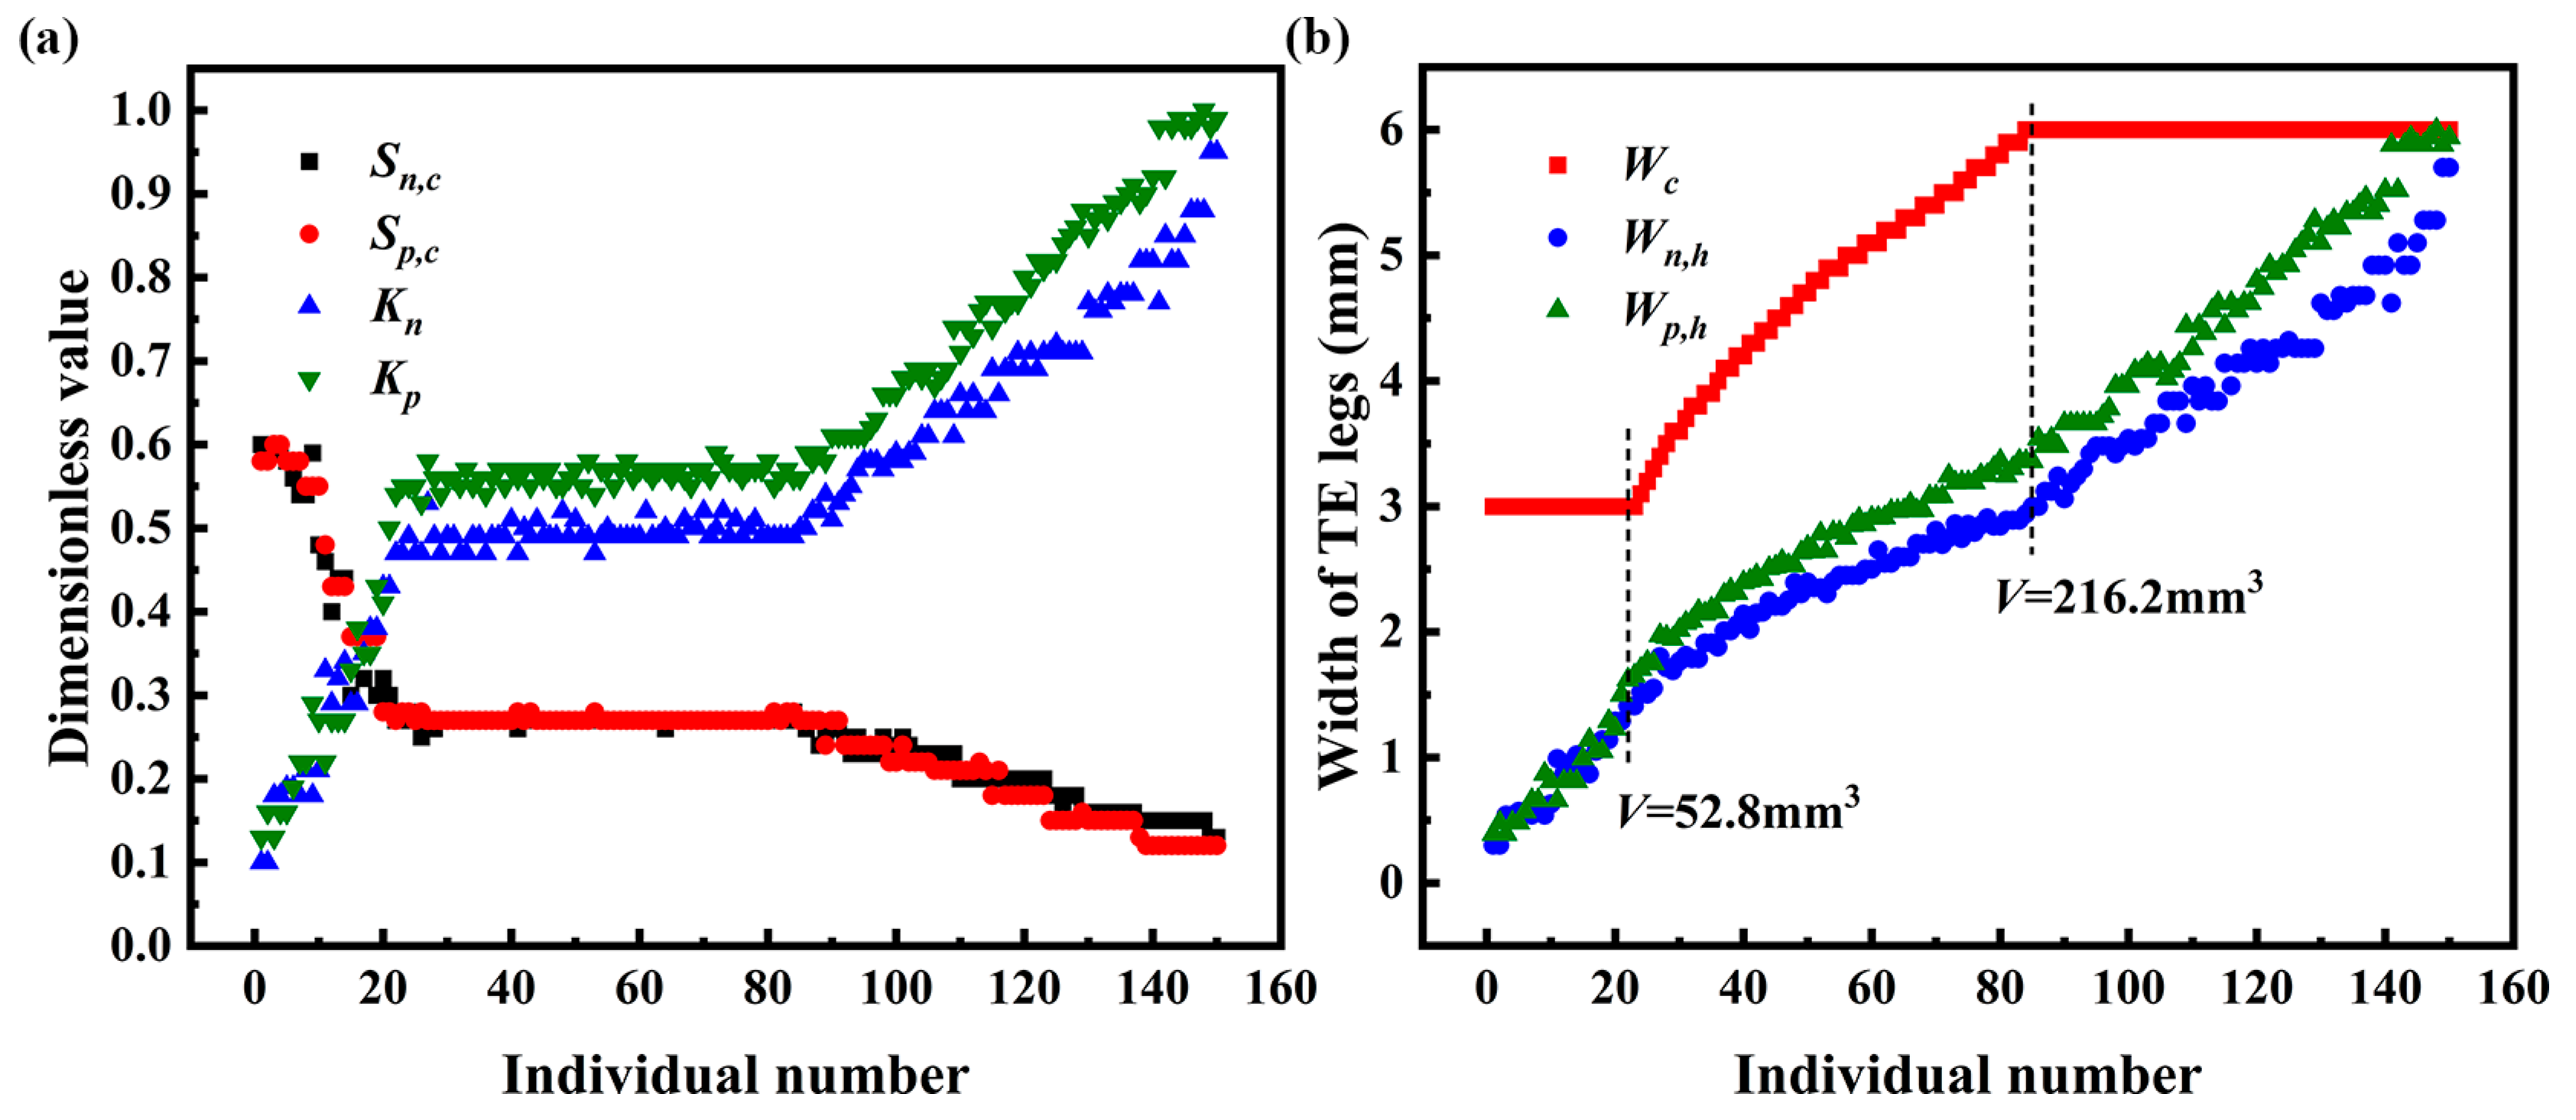
  • For the optimized segmented TEG with trapezoidal legs, when the range of V was from 52.8 to 216.2 mm3, as V increased, the optimal Sn,c, Sp,c, Kn, and Kp values remained basically unchanged. In this range, the geometric parameter Wc played an important role in the output performance of the segmented TEG with trapezoidal legs.
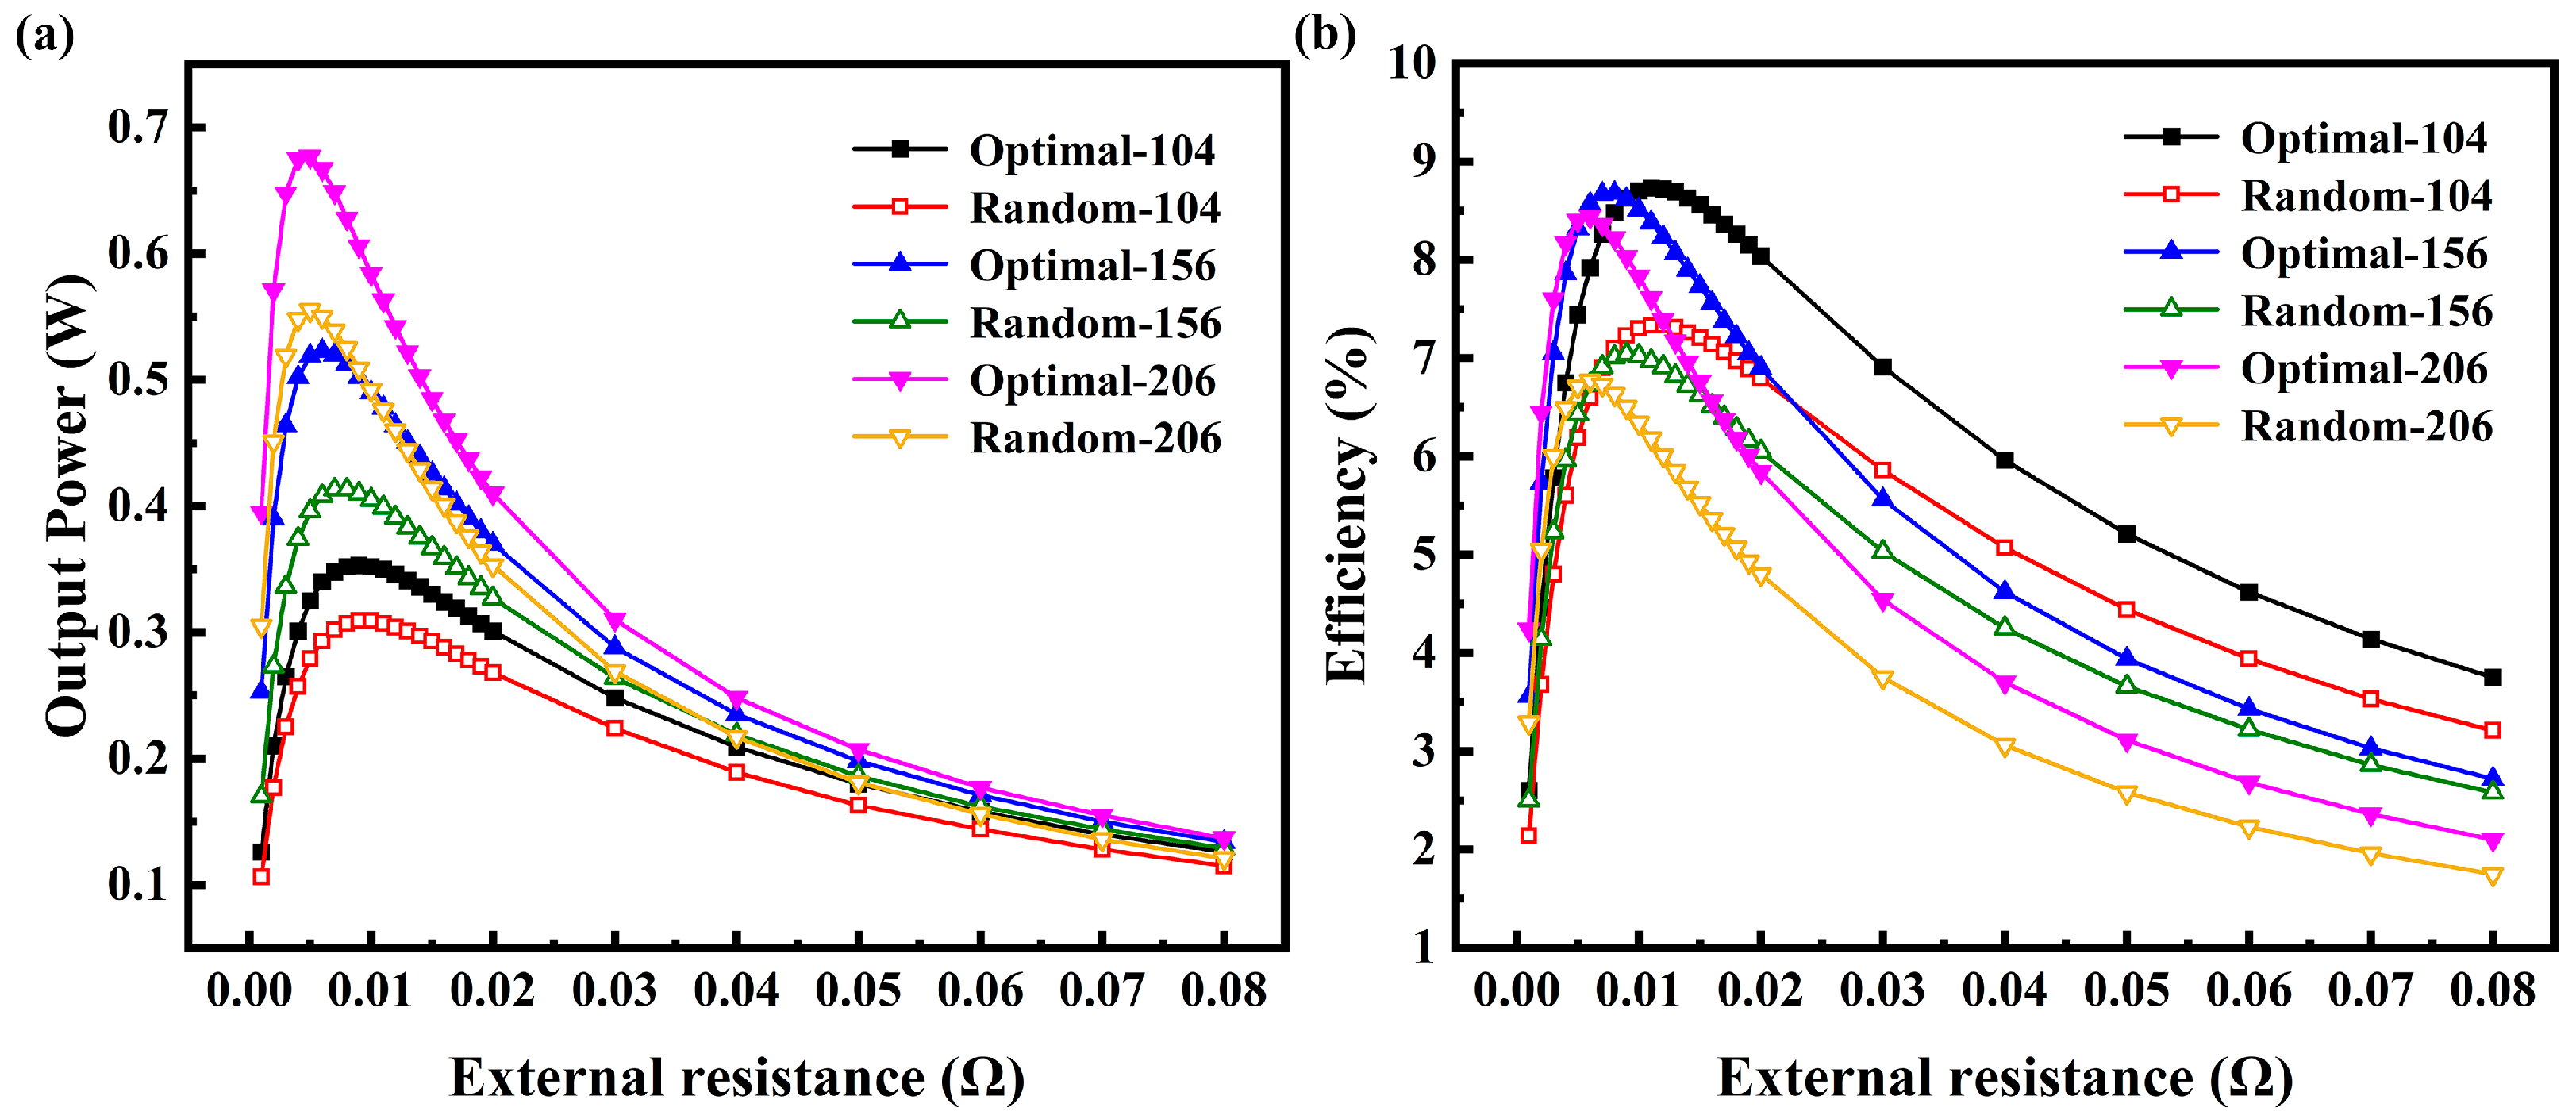
  • When V was 104, 156, and 206 mm3, the optimized output power was increased by 14.2%, 26.6%, and 22%, respectively. The optimized conversion efficiency was also improved by 19.1%, 23.3%, and 24.7% respectively. The geometry before optimization is randomly generated, and another randomly selected non-optimized geometry (one for each volume) may yield either better or worse results.

Author Contributions

Investigation, W.S.; methodology, W.S.; writing—original draft, W.S.; software, W.S.; data curation, W.S.; formal analysis, W.S. and S.Z.; writing—reviewing and editing, W.S.; supervision, P.W. and P.Z.; funding acquisition, P.W. and P.Z. All authors have read and agreed to the published version of the manuscript.

Funding

This research was supported by the National Natural Science Foundation of China (52171220, 92163119).

Data Availability Statement

Data are contained within the article.

Conflicts of Interest

The authors declare that they have no known competing financial interests or personal relationships that could have appeared to influence the work reported in this paper. The funder had no role in the design of the study or the manuscript or in the decision to publish the results.

References

  1. Aydin, G. Production modeling in the oil and natural gas industry: An application of trend analysis. Pet. Sci. Technol. 2014, 32, 555–564. [Google Scholar] [CrossRef]
  2. Champier, D. Thermoelectric generators: A review of applications. Energy Convers. Manag. 2017, 140, 167–181. [Google Scholar] [CrossRef]
  3. Wang, Y.; Shi, Y.; Mei, D.; Chen, Z. Wearable thermoelectric generator to harvest body heat for powering a miniaturized accelerometer. Appl. Energy 2018, 215, 690–698. [Google Scholar] [CrossRef]
  4. Demir, M.E.; Dincer, I. Performance assessment of a thermoelectric generator applied to exhaust waste heat recovery. Appl. Therm. Eng. 2017, 120, 694–707. [Google Scholar] [CrossRef]
  5. Shittu, S.; Li, G.; Zhao, X.; Ma, X. Review of thermoelectric geometry and structure optimization for performance enhancement. Appl. Energy 2020, 268, 115075. [Google Scholar] [CrossRef]
  6. Cai, L.; Li, P.; Luo, Q.; Zhai, P.; Zhang, Q. Geometry optimization of a segmented thermoelectric generator based on multi-parameter and nonlinear optimization method. J. Electron. Mater. 2017, 46, 1552–1566. [Google Scholar] [CrossRef]
  7. Kishore, R.A.; Sanghadasa, M.; Priya, S. Optimization of segmented thermoelectric generator using taguchi and anova techniques. Sci. Rep. 2017, 7, 16746. [Google Scholar] [CrossRef] [PubMed]
  8. Liu, Z.; Shuai, J.; Mao, J.; Wang, Y.; Wang, Z.; Cai, W.; Sui, J.; Ren, Z. Effects of antimony content in MgAg0.97Sbx on output power and energy conversion efficiency. Acta Mater. 2016, 102, 17–23. [Google Scholar] [CrossRef]
  9. Zhou, X.; Yan, Y.; Lu, X.; Zhu, H.; Han, X.; Chen, G.; Ren, Z. Routes for high performance thermoelectric materials. Mater. Today 2018, 21, 974–988. [Google Scholar] [CrossRef]
  10. Cai, B.; Hu, H.; Zhuang, H.L.; Li, J.-F. Promising materials for thermoelectric applications. J. Alloys Compd. 2019, 806, 471–486. [Google Scholar] [CrossRef]
  11. Yang, J.; Liu, G.; Shi, Z.; Lin, J.; Ma, X.; Xu, Z.; Qiao, G. An insight into β-Zn4Sb3 from its crystal structure, thermoelectric performance, thermal stability and graded material. Mater. Today Energy 2017, 3, 72–83. [Google Scholar] [CrossRef]
  12. Lavric, E.D. Sensitivity analysis of thermoelectric module performance with respect to geometry. Chem. Eng. Trans. 2010, 21, 133–138. [Google Scholar]
  13. Meng, J.H.; Zhang, X.X.; Wang, X.D. Characteristics analysis and parametric study of a thermoelectric generator by considering variable material properties and heat losses. Int. J. Heat Mass Transf. 2015, 80, 227–235. [Google Scholar] [CrossRef]
  14. Maduabuchi, C.; Fagehi, H.; Alatawi, I.; Alkhedher, M. Predicting the optimal performance of a concentrated solar segmented variable leg thermoelectric generator using neural networks. Energies 2022, 15, 6024. [Google Scholar] [CrossRef]
  15. Fabian-Mijangos, A.; Min, G.; Alvarez-Quintana, J. Enhanced performance thermoelectric module having asymmetrical legs. Energy Convers. Manag. 2017, 148, 1372–1381. [Google Scholar] [CrossRef]
  16. Sahin, A.Z.; Yilbas, B.S. The thermoelement as thermoelectric power generator: Effect of leg geometry on the efficiency and power generation. Energy Convers. Manag. 2013, 65, 26–32. [Google Scholar] [CrossRef]
  17. Liu, H.B.; Wang, S.L.; Yang, Y.R.; Chen, W.H.; Wang, X.D. Theoretical analysis of performance of variable cross-section thermoelectric generators: Effects of shape factor and thermal boundary conditions. Energy 2020, 201, 117660. [Google Scholar] [CrossRef]
  18. Zhang, G.; Jiao, K.; Niu, Z.; Diao, H.; Du, Q.; Tian, H.; Shu, G. Power and efficiency factors for comprehensive evaluation of thermoelectric generator materials. Int. J. Heat Mass Transf. 2016, 93, 1034–1037. [Google Scholar] [CrossRef]
  19. Shittu, S.; Li, G.; Zhao, X.; Ma, X.; Akhlaghi, Y.G.; Ayodele, E. High performance and thermal stress analysis of a segmented annular thermoelectric generator. Energy Convers. Manag. 2019, 184, 180–193. [Google Scholar] [CrossRef]
  20. Liu, H.B.; Meng, J.H.; Wang, X.D.; Chen, W.H. A new design of solar thermoelectric generator with combination of segmented materials and asymmetrical legs. Energy Convers. Manag. 2018, 175, 11–20. [Google Scholar] [CrossRef]
  21. Ge, Y.; Liu, Z.; Sun, H.; Liu, W. Optimal design of a segmented thermoelectric generator based on three dimensional numerical simulation and multi-objective genetic algorithm. Energy 2018, 147, 1060–1069. [Google Scholar] [CrossRef]
  22. Zhu, Y.; Newbrook, D.W.; Dai, P.; de Groot, C.H.K.; Huang, R. Artificial neural network enabled accurate geometrical design and optimisation of thermoelectric generator. Appl. Energy 2022, 305, 117800. [Google Scholar] [CrossRef]
  23. Shen, Z.G.; Liu, X.; Chen, S.; Wu, S.Y.; Xiao, L.; Chen, Z.X. Theoretical analysis on a segmented annular thermoelectric generator. Energy 2018, 157, 297–313. [Google Scholar] [CrossRef]
  24. Liu, J.P.; Sun, Y.J.; Chen, G.; Zhai, P.C. Performance Analysis of Variable Cross-Section TEGs under Constant Heat Flux Conditions. Energies 2023, 16, 4473. [Google Scholar] [CrossRef]
  25. Ferreira, T.S.; Pereira, A.M. Geometrical optimization of a thermoelectric device: Numerical simulations. Energy Convers. Manag. 2018, 169, 217–227. [Google Scholar] [CrossRef]
Figure 1. Schematic of the segmented thermoelectric generator (TEG) model with trapezoidal legs.
Energies 17 02094 g001
Figure 2. Temperature-dependent (a) thermal conductivity, (b) electrical conductivity, (c) Seebeck coefficient, and (d) figure of merit (ZT) of the n-type and p-type semiconductors used for the segmented TEG.
Energies 17 02094 g002
Figure 3. Architecture of the neural network for predicting the power output of the segmented TEG. The input layer contained geometric parameters (Wc, Sn,c, Sp,c, Kn, Kp). The output layer contained the power output (P).
Energies 17 02094 g003
Figure 4. Flowchart of the optimization process.
Energies 17 02094 g004
Figure 5. Scatter plot of the neural network predicted and true (simulated) values of P.
Energies 17 02094 g005
Figure 6. (a) Distribution of Pareto front. (b) Variation in PDmax.
Energies 17 02094 g006
Figure 7. Variation in optimized (a) dimensionless parameters and (b) widths of TE legs.
Energies 17 02094 g007
Figure 8. Performance comparisons of the optimal and random segmented TEGs: (a) output power and (b) efficiency.
Energies 17 02094 g008
Figure 9. Temperature distributions of the optimal and random segmented TEGs.
Energies 17 02094 g009
Table 1. Ranges and resolutions of the parameters used in this work.
Geometric ParameterValue RangeResolution
Width of cold end TE leg Wc3–6 mm0.1 mm
Ratio of cold-segment length to total length n-leg Sn,c (Sn,c = Ln,c/L)0.10–0.600.01
Ratio of cold-segment length to total length p-leg Sp,c (Sp,c = Lp,c/L)0.10–0.600.01
Width ratio between hot end and cold end n-leg Kn (Kn = Wn,h/Wc)0.10–10.01
Width ratio between hot end and cold end p-leg Kp (Kp = Wp,h/Wc)0.10–10.01
Width of hot end n-leg Wn,h0.3–6 mm
Width of hot end p-leg Wp,h0.3–6 mm
Table 2. Geometric parameters and performance corresponding to the maximum PDmax.
Geometric ParameterPerformance
Wc (mm)Sn,cSp,cKnKpV (mm3)P (W)
Value30.270.270.470.5452.80.183
Table 3. Geometric parameters of the optimal model and the random model.
ModelVolumeWc (mm)Sn,cSp,cKnKp
Optimal-1041044.10.260.270.520.57
Random-1041043.70.130.440.720.76
Optimal-15615650.280.270.540.57
Random-1561564.30.530.340.840.83
Optimal-2062065.60.270.270.520.55
Random-20620650.120.410.930.68
Table 4. Temperature difference of the optimal and random models.
ModelVolume (mm3)Temperature Difference (K)
Optimal-104104329
Random-104104310
Optimal-156156330
Random-156156307
Optimal-206206333
Random-206206309
Disclaimer/Publisher’s Note: The statements, opinions and data contained in all publications are solely those of the individual author(s) and contributor(s) and not of MDPI and/or the editor(s). MDPI and/or the editor(s) disclaim responsibility for any injury to people or property resulting from any ideas, methods, instructions or products referred to in the content.

