
Structural Investigation of Orthoborate-Based Electrolytic Materials for Fuel Cell Applications
Abstract
:1. Introduction
2. Materials and Methods
3. Results
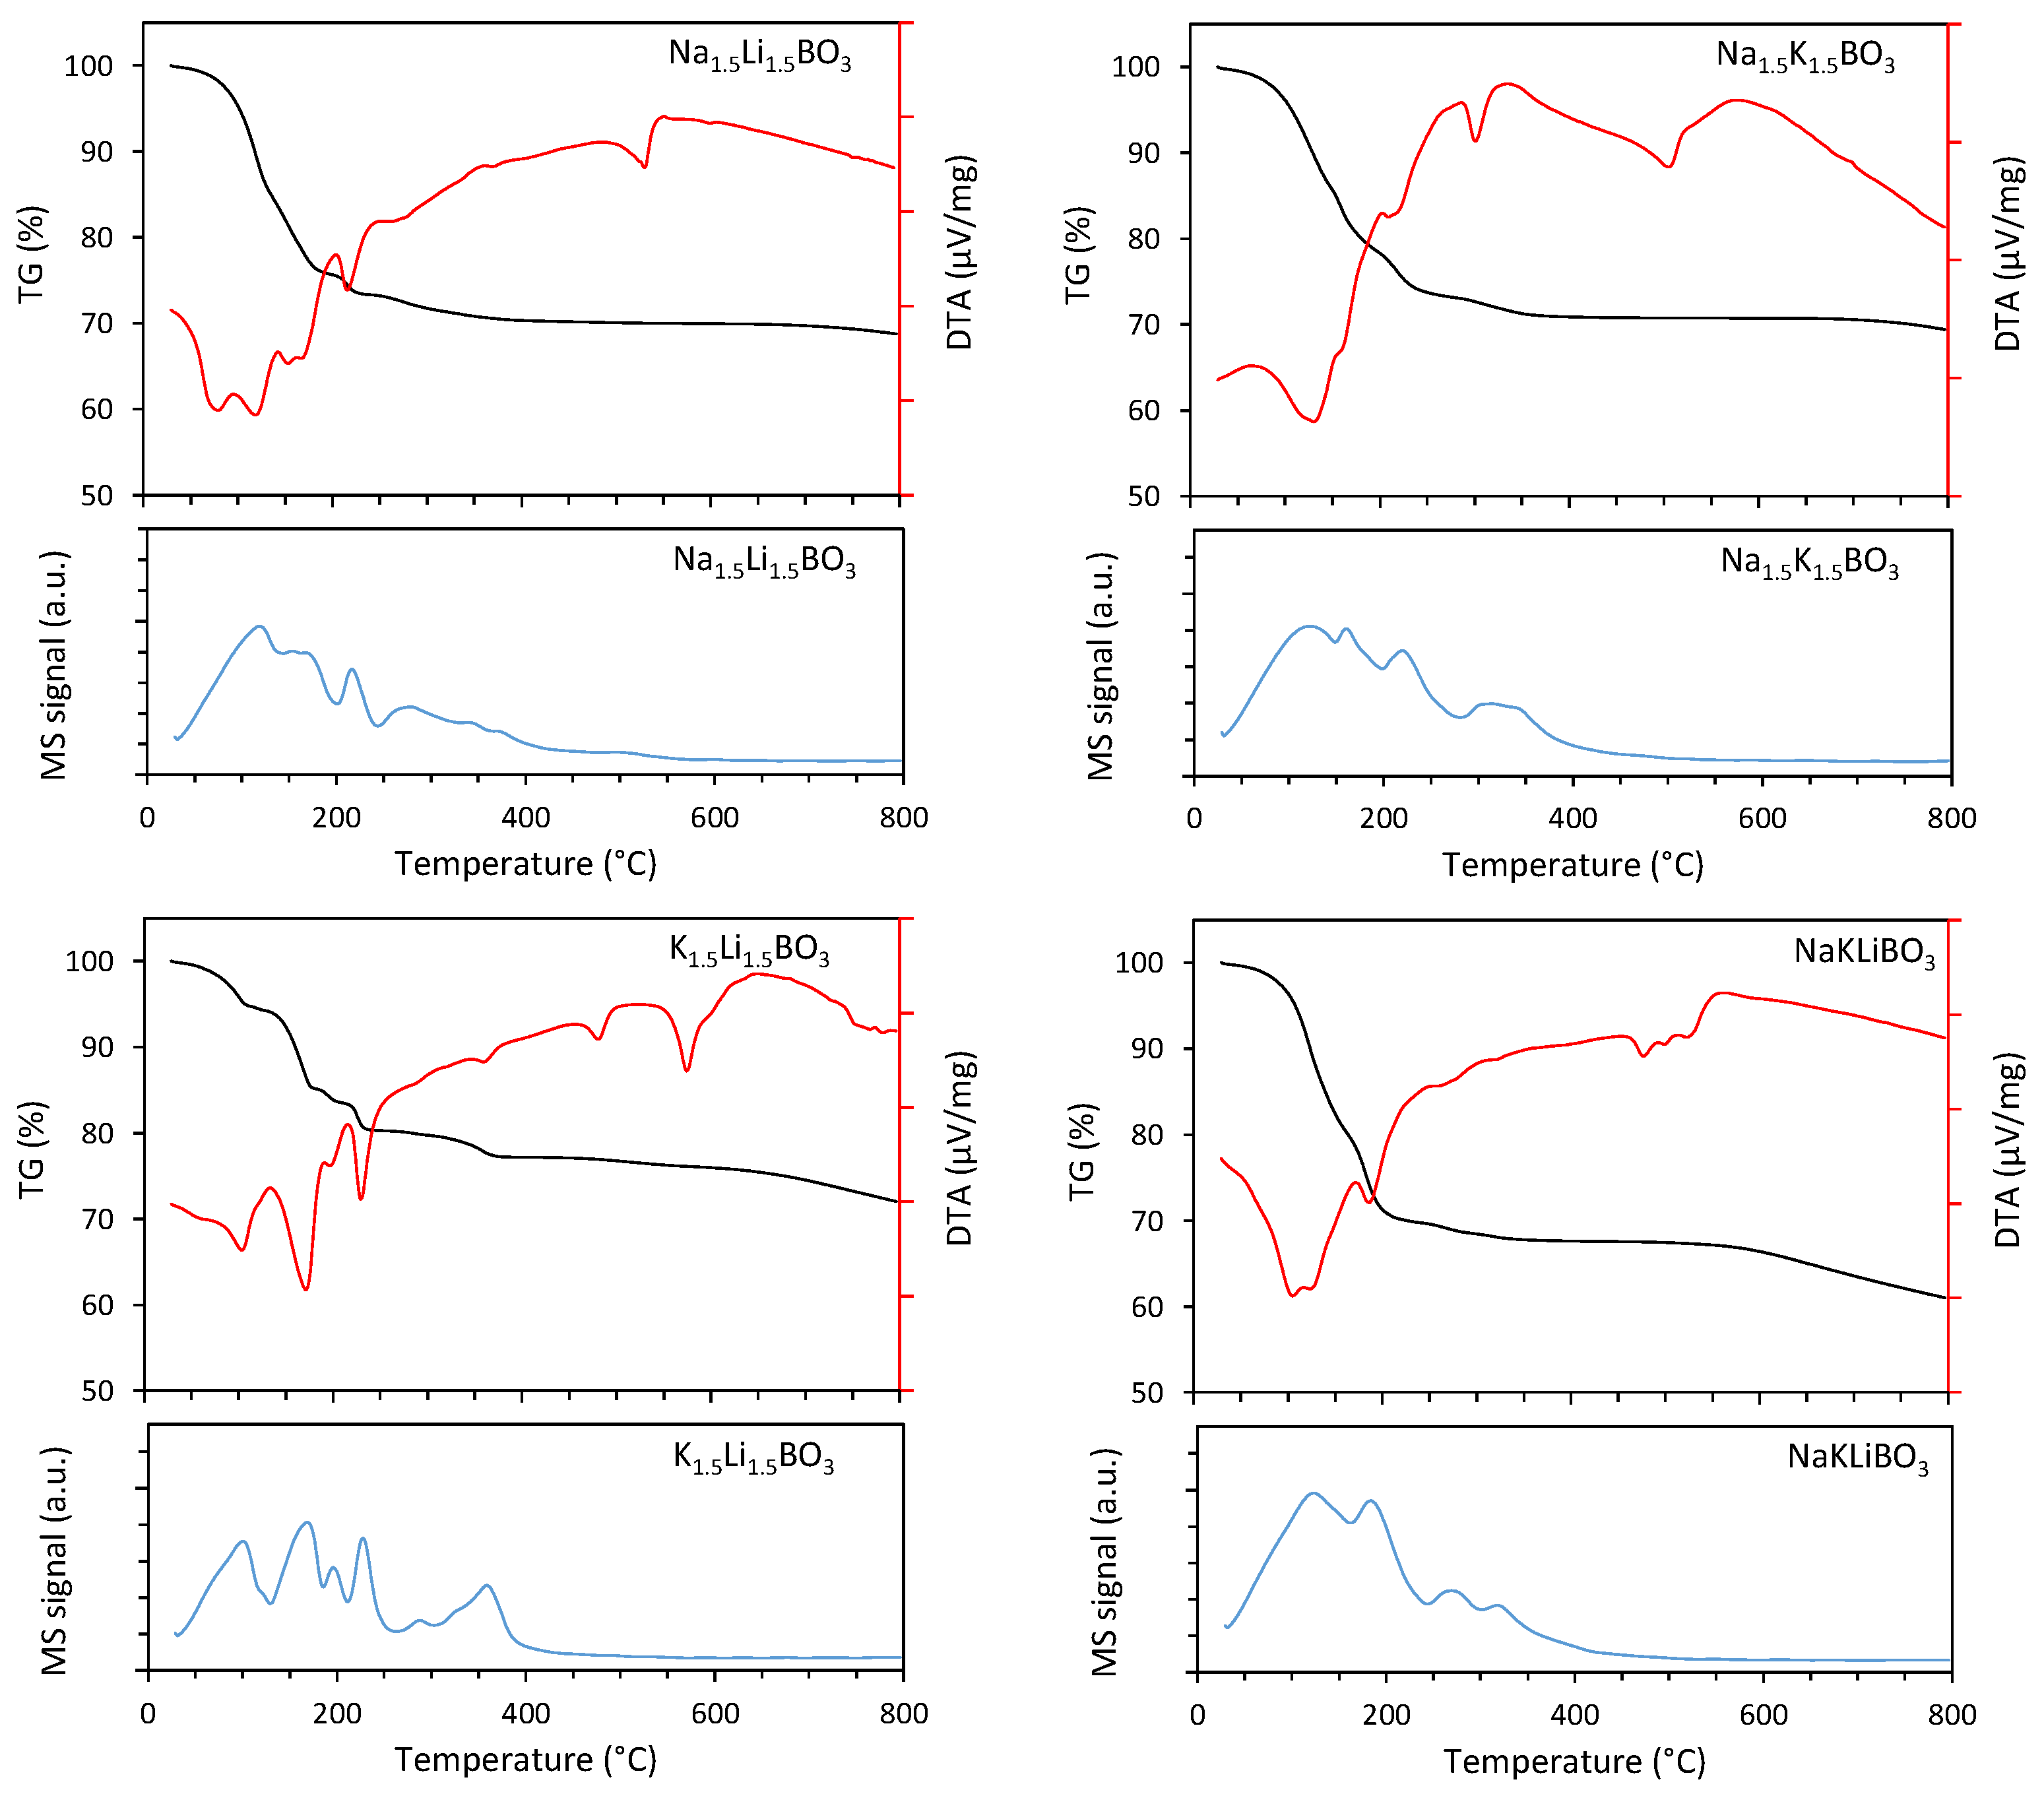
3.1. DTA Analysis
3.2. X-ray Diffraction
3.3. THz Spectroscopy
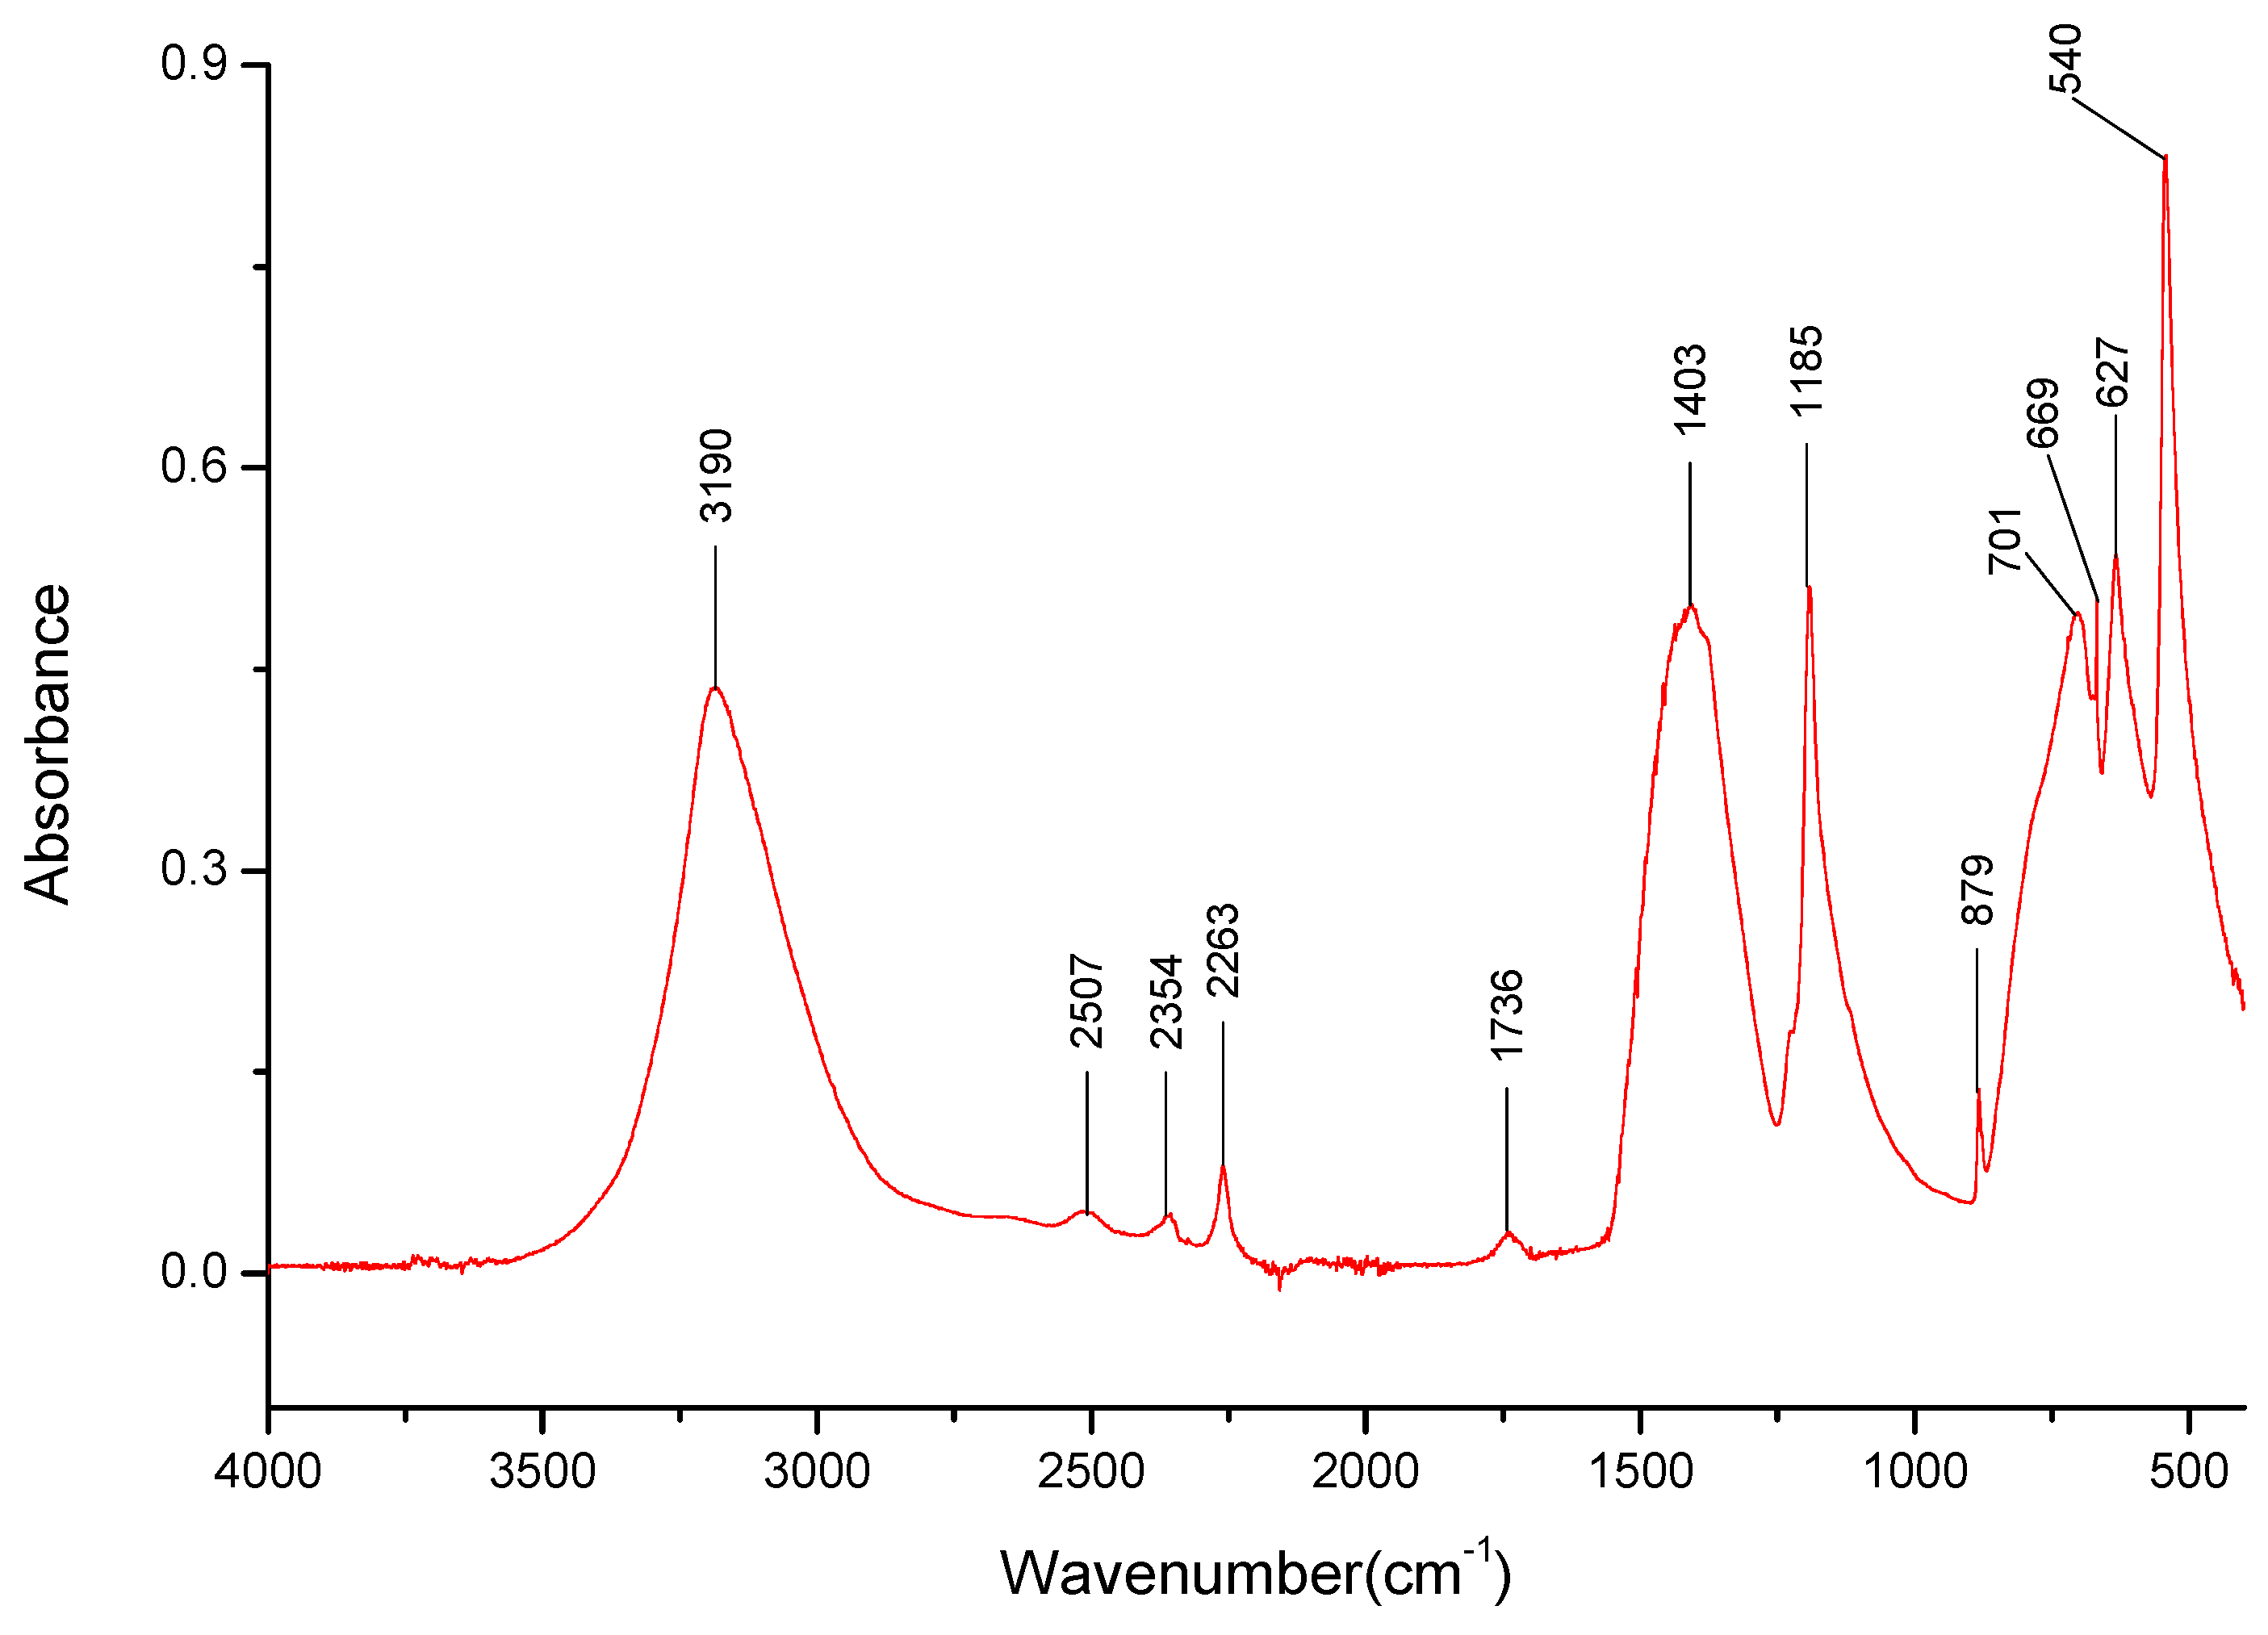
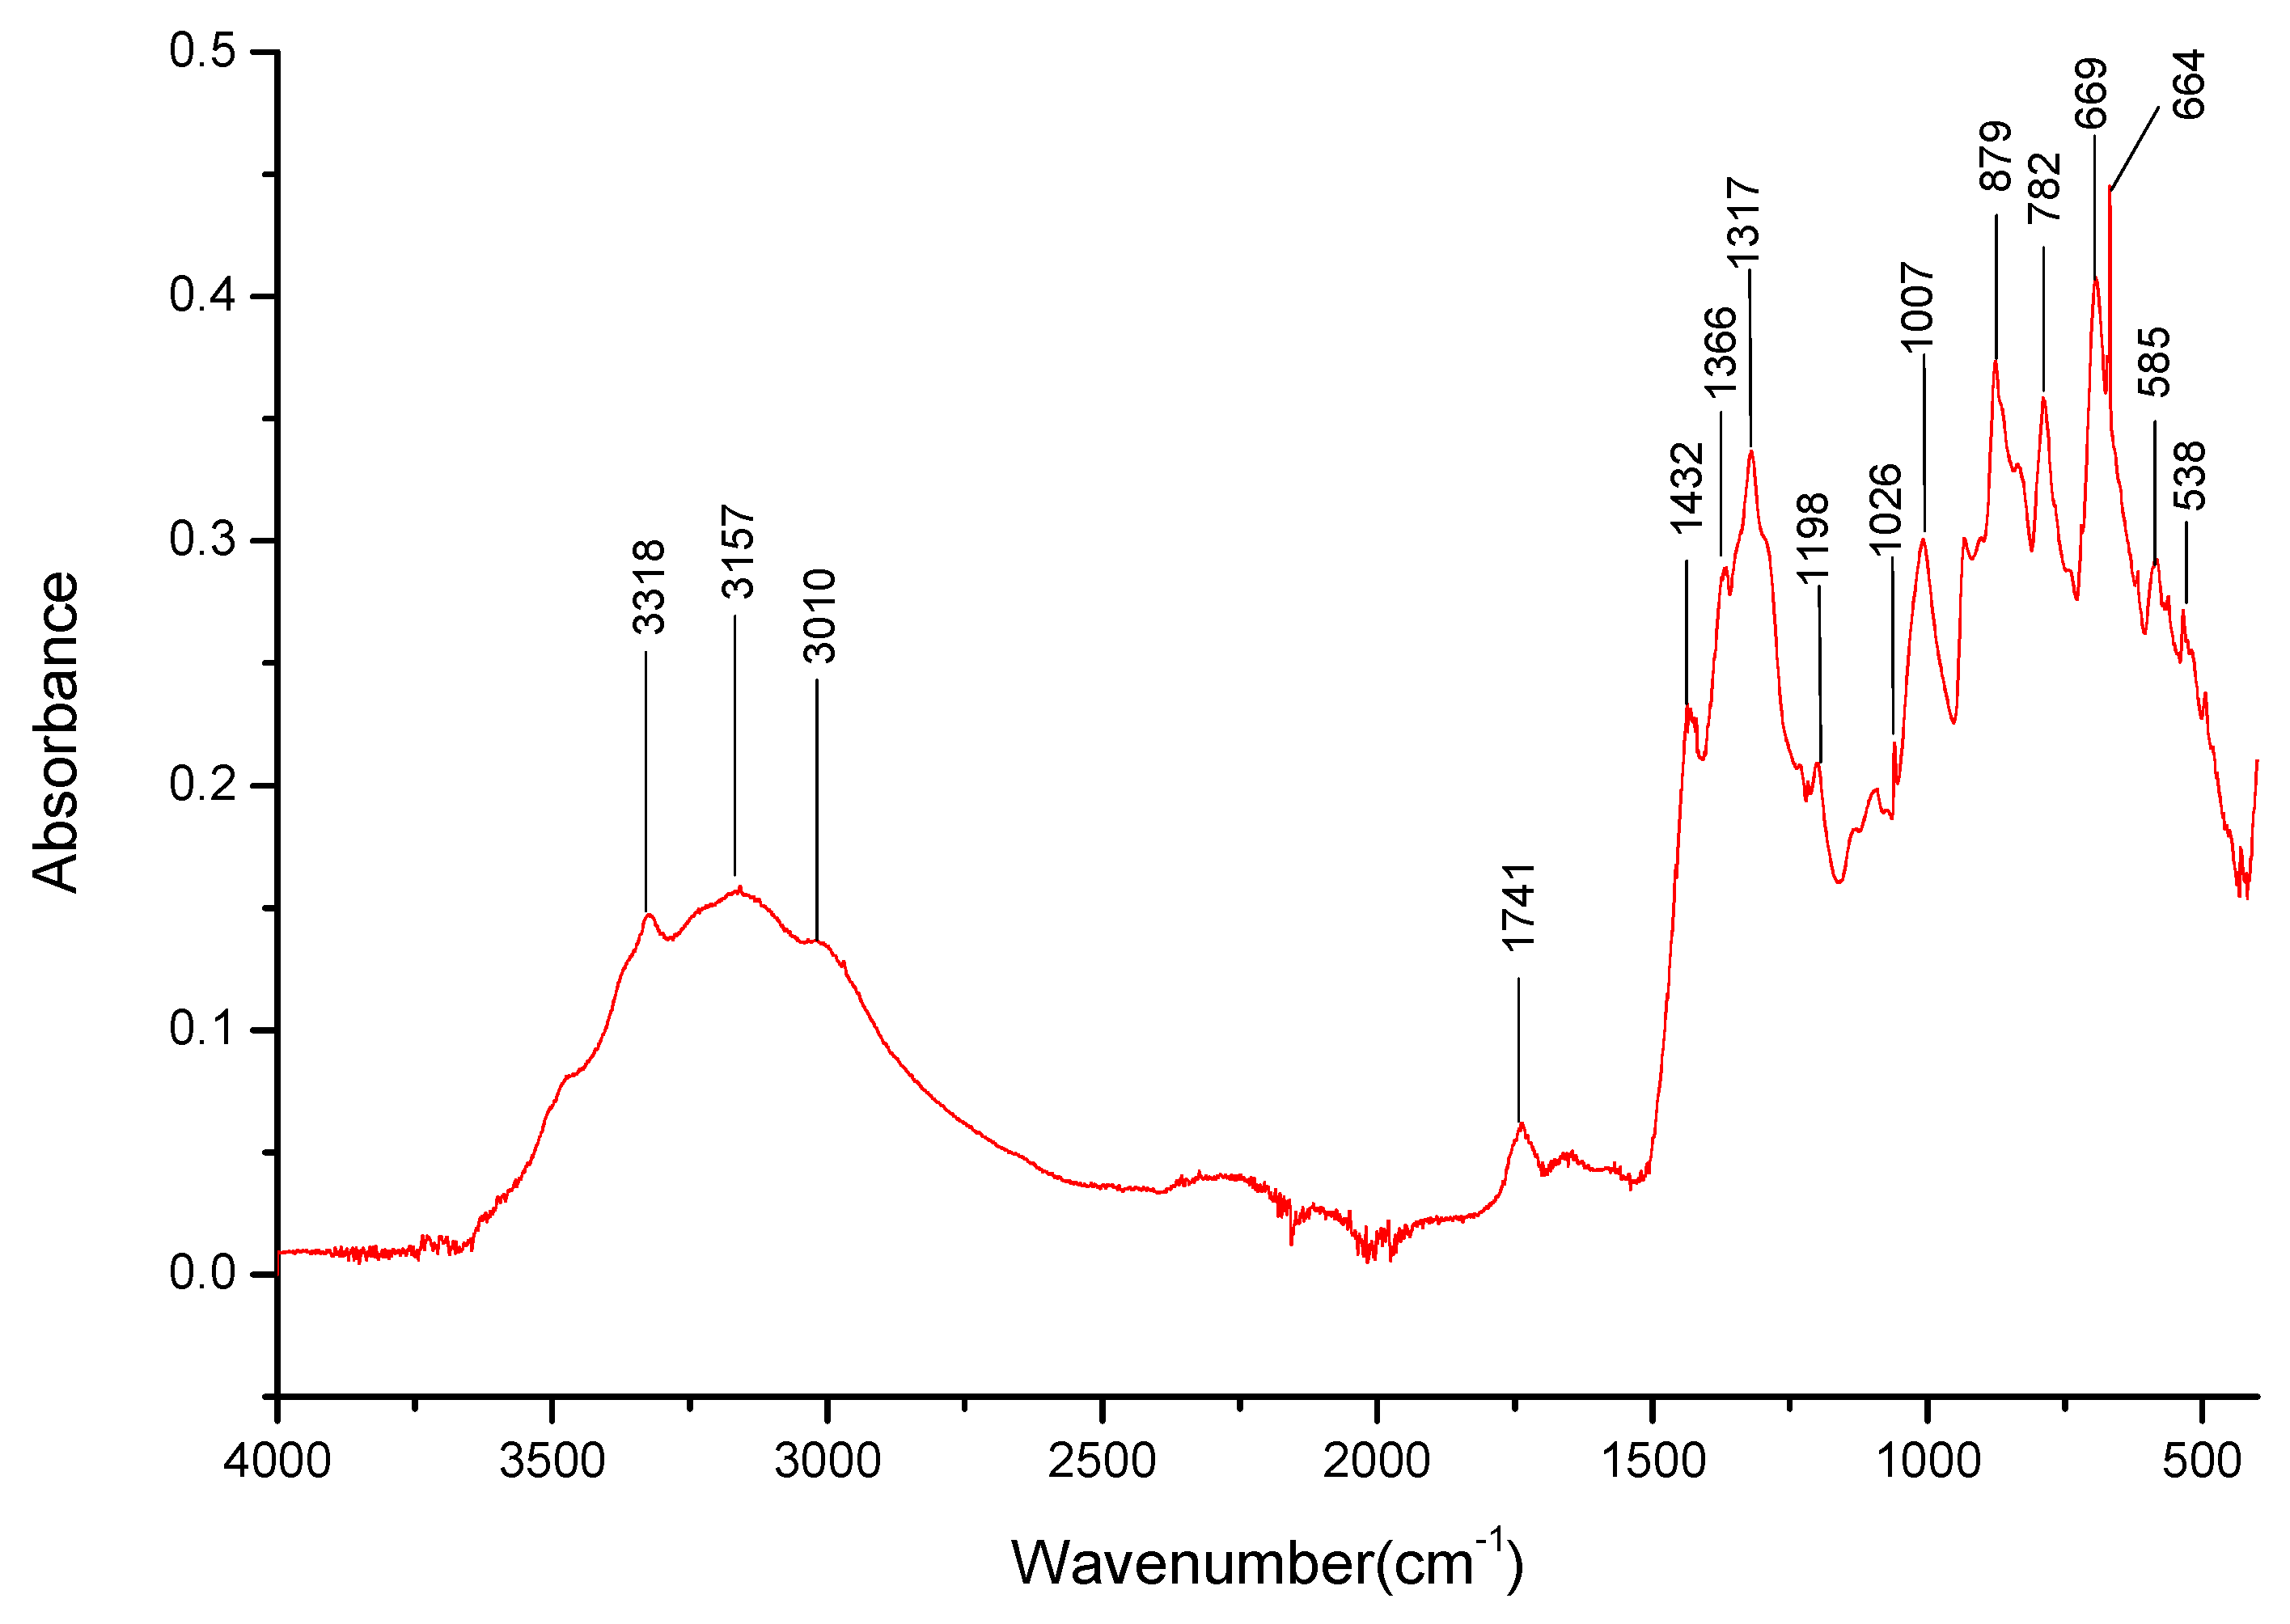
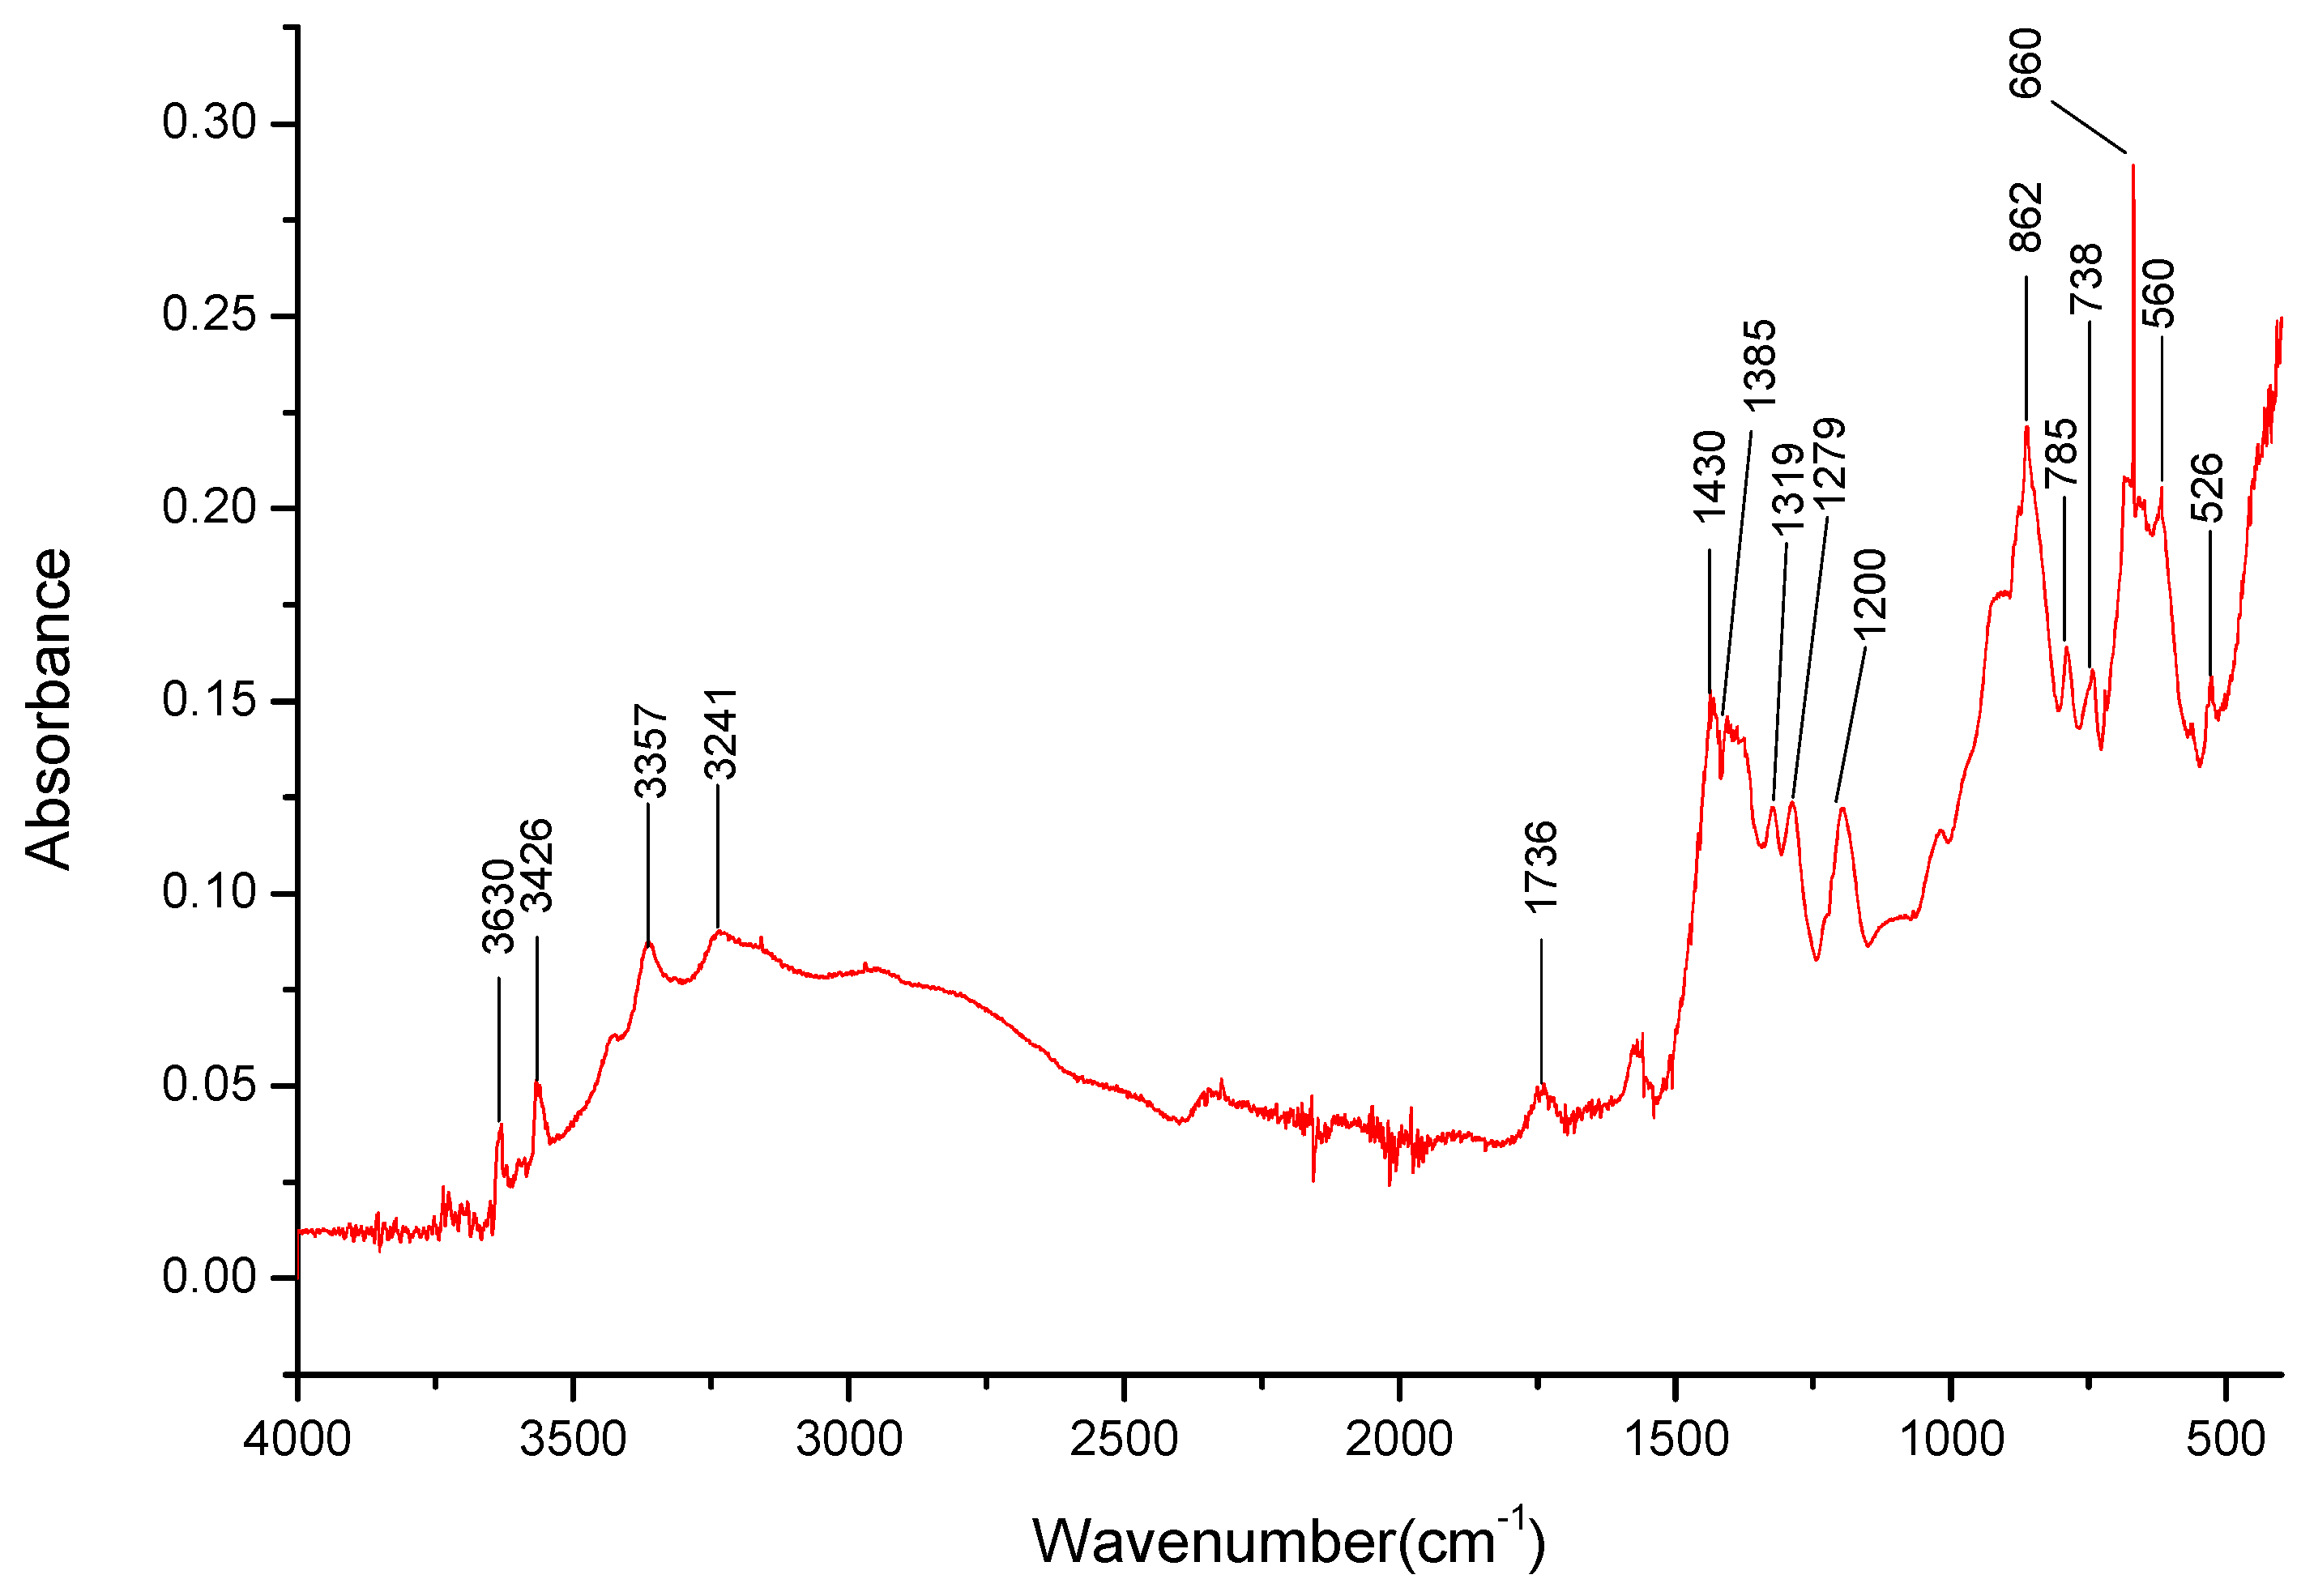
3.4. FT-IR Spectroscopy
4. Discussion
5. Conclusions
Author Contributions
Funding
Data Availability Statement
Conflicts of Interest
References
- Ali, D.M.; Salman, S.K. A comprehensive review of the fuel cells technology and hydrogen economy. In Proceedings of the 41st International Universities Power Engineering Conference, Newcastle upon Tyne, UK, 6–8 September 2006; Volume 1, pp. 98–102. [Google Scholar] [CrossRef]
- Kordesch, K.V.; Simader, G.R. Environmental Impact of Fuel Cell Technology. Chem. Rev. 1995, 95, 191–207. [Google Scholar] [CrossRef]
- Thomas, J.M.; Edwards, P.P.; Dobson, P.J.; Owen, G.P. Decarbonizing energy: The developing international activity in hydrogen technologies and fuel cells. J. Energy Chem. 2020, 51, 405–415. [Google Scholar] [CrossRef]
- Chen, Q.; Zhou, J.; Qiu, P.; Lu, Y.; Huang, X.; Ding, C.; Ni, X. Research on the Model of Hydrogen Oxygen Fuel Cell. In Proceedings of the 2019 IEEE 3rd Conference on Energy Internet and Energy System Integration (EI2), Changsha, China, 8–10 November 2019. [Google Scholar] [CrossRef]
- Penconi, M.; Rossi, F.; Ortica, F.; Elisei, F.; Gentili, P.L. Hydrogen Production from Water by Photolysis, Sonolysis and Sonophotolysis with Solid Solutions of Rare Earth, Gallium and Indium Oxides as Heterogeneous Catalysts. Sustainability 2015, 7, 9310–9325. [Google Scholar] [CrossRef]
- Rabaey, K.; Verstraete, W. Microbial fuel cells: Novel biotechnology for energy generation. Trends Biotechnol. 2005, 23, 291–298. [Google Scholar] [CrossRef]
- Smitha, B.; Sridhar, S.; Khan, A. Synthesis and characterization of proton conducting polymer membranes for fuel cells. J. Membr. Sci. 2003, 225, 63–76. [Google Scholar] [CrossRef]
- Oh, K.; Ju, H. Temperature dependence of CO poisoning in high-temperature proton exchange membrane fuel cells with phosphoric acid-doped polybenzimidazole membranes. Int. J. Hydrogen Energy 2015, 40, 7743–7753. [Google Scholar] [CrossRef]
- Becker, H.; Murawski, J.; Shinde, D.V.; Stephens, I.E.L.; Hinds, G.; Smith, G. Impact of impurities on water electrolysis: A review. Sustain. Energy Fuels 2023, 7, 1565–1603. [Google Scholar] [CrossRef]
- Bergmann, A.; Gerteisen, D.; Kurz, T. Modelling of CO Poisoning and its Dynamics in HTPEM Fuel Cells. Fuel Cells 2010, 10, 278–287. [Google Scholar] [CrossRef]
- Haider, R.; Wen, Y.; Ma, Z.-F.; Wilkinson, D.P.; Zhang, L.; Yuan, X.; Song, S.; Zhang, J. High temperature proton exchange membrane fuel cells: Progress in advanced materials and key technologies. Chem. Soc. Rev. 2021, 50, 1138–1187. [Google Scholar] [CrossRef]
- Chin, D.T.; Howard, P.D. Hydrogen Sulfide Poisoning of Platinum Anode in Phosphoric Acid Fuel Cell Electrolyte. J. Electrochem. Soc. 1986, 133, 2447–2450. [Google Scholar] [CrossRef]
- Blum, L.; Deja, R.; Peters, R.; Stolten, D. Comparison of efficiencies of low, mean and high temperature fuel cell Systems. Int. J. Hydrogen Energy 2011, 36, 11056–11067. [Google Scholar] [CrossRef]
- Vishnyakov, V.M. Proton exchange membrane fuel cells. Vacuum 2006, 80, 1053–1065. [Google Scholar] [CrossRef]
- Lakshminarayana, G.; Nogami, M. Synthesis, characterization and electrochemical properties of SiO2–P 2O5–TiO2–ZrO2 glass membranes as proton conducting electrolyte for low-temperature H2/O2 fuel cells. J. Phys. D Appl. Phys. 2009, 42, 215501. [Google Scholar] [CrossRef]
- Wijayanta, A.T.; Oda, T.; Purnomo, C.W.; Kashiwagi, T.; Azizb, M. Liquid hydrogen, methylcyclohexane, and ammonia as potential hydrogen storage: Comparison review. Int. J. Hydrogen Energy 2019, 44, 15026–15044. [Google Scholar] [CrossRef]
- Eblagon, K.M.; Tam, K.; Tsang, S.C.E. Comparison of Catalytic Performance of Supported Ruthenium and Rhodium for Hydrogenation of 9-Ethylcarbazole for Hydrogen Storage Applications. Energy Environ. Sci. 2012, 5, 8621–8630. [Google Scholar] [CrossRef]
- Brückner, N.; Obesser, K.; Bösmann, A.; Teichmann, D.; Arlt, W.; Dungs, J.; Wasserscheid, P. Evaluation of Industrially Applied Heat-Transfer Fluids as Liquid Organic Hydrogen Carrier Systems. ChemSusChem 2014, 7, 229–235. [Google Scholar] [CrossRef]
- Xing, P.; Robertson, G.P.; Guiver, M.D.; Mikhailenko, S.D.; Wang, K.; Kaliaguine, S. Synthesis and characterization of sulfonated poly (ether ketone) for proton exchange membranes. J. Membr. Sci. 2004, 229, 95–106. [Google Scholar] [CrossRef]
- Lufrano, F.; Squadrito, G.; Patti, A.; Passalacqua, E. Sulfonated polysulfone as promising membranes for polymer electrolyte fuel cells. J. Appl. Polym. Sci. 2000, 77, 1250–1256. [Google Scholar] [CrossRef]
- Cha, M.S.; Lee, J.Y.; Kim, T.-H.; Jeong, H.Y.; Shin, H.Y.; Oh, S.-G.; Hong, Y.T. Preparation and characterization of crosslinked anion exchange membrane (AEM) materials with poly (phenylene ether)-based short hydrophilic block for use in electrochemical applications. J. Membr. Sci. 2017, 530, 73–83. [Google Scholar] [CrossRef]
- Adamski, M.; Peressin, N.; Holdcroft, S. On the evolution of sulfonated polyphenylenes as proton exchange membranes for fuel cells. Mater. Adv. 2021, 2, 4966–5005. [Google Scholar] [CrossRef]
- Ran, J.; Wu, L.; Ru, Y.; Hu, M.; Din, L.; Xu, T. Anion exchange membranes (AEMs) based on poly (2,6-dimethyl-1,4-phenylene oxide) (PPO) and its derivatives. Polym. Chem. 2015, 6, 5809–5826. [Google Scholar] [CrossRef]
- Itoh, T.; Hirai, K.; Tamura, M.; Uno, T.; Kubo, M.; Aihara, Y. Anhydrous proton-conducting electrolyte membranes based on hyperbranched polymer with phosphonic acid groups for high-temperature fuel cells. J. Power Sources 2008, 178, 627–633. [Google Scholar] [CrossRef]
- Hwang, K.; Kim, J.H.; Kim, S.Y.; Byun, H. Preparation of polybenzimidazole-based membranes and their potential applications in the fuel cell system. Energies 2014, 7, 1721–1732. [Google Scholar] [CrossRef]
- Asensio, J.A.; Sánchez, E.M.; Gómez-Romero, P. Proton-conducting membranes based on benzimidazole polymers for high-temperature PEM fuel cells. A chemical quest. Chem. Soc. Rev. 2010, 39, 3210. [Google Scholar] [CrossRef] [PubMed]
- Takamuku, S.; Jannasch, P. Multiblock copolymers with highly sulfonated blocks containing di- and tetrasulfonated arylene sulfone segments for proton exchange membrane fuel cell applications. Adv. Energy Mater. 2012, 2, 129–140. [Google Scholar] [CrossRef]
- He, Y.; Wang, J.; Zhang, H.; Zhang, T.; Zhang, B.; Cao, S.; Liu, J. Polydopamine-modified graphene oxide nanocomposite membrane for proton exchange membrane fuel cell under anhydrous conditions. J. Mater. Chem. A 2014, 2, 9548–9558. [Google Scholar] [CrossRef]
- Cao, L.; Sun, Q.; Gao, Y.; Liu, L.; Shi, H. Novel acid-base hybrid membrane based on amine-functionalized reduced graphene oxide and sulfonated polyimide for vanadium redox flow battery. Electrochim. Acta 2015, 158, 24–34. [Google Scholar] [CrossRef]
- Kim, S.; Hong, I. Effects of humidity and temperature on a proton exchange membrane fuel cell (PEMFC) stack. J. Ind. Eng. Chem. 2008, 14, 357–364. [Google Scholar] [CrossRef]
- Yang, C.; Srinivasan, S.; Aricò, A.S.; Cretì, P.; Baglio, V.; Antonucci, V. Composite Nafion/zirconium phosphate membranes for direct methanol fuel cell operation at high temperature. Electrochem. Solid-State Lett. 2001, 4, A31. [Google Scholar] [CrossRef]
- Adjemian, K.T.; Lee, S.J.; Srinivasan, S.; Benziger, J.; Bocarsly, A.B. Silicon Oxide Nafion Composite Membranes for Proton-Exchange Membrane Fuel Cell Operation at 80-140°C. J. Electrochem. Soc. 2002, 149, A256. [Google Scholar] [CrossRef]
- Krishnan, N.N.; Lee, S.; Ghorpade, R.V.; Konovalova, A.; Jang, J.H.; Kim, H.-J.; Han, J.; Henkensmeier, D.; Han, H. Polybenzimidazole (PBI-OO) based composite membranes using sulfophenylated TiO2 as both filler and crosslinker, and their use in the HT-PEM fuel cell. J. Membr. Sci. 2018, 560, 11–20. [Google Scholar] [CrossRef]
- Eguizábal, A.; Lemus, J.; Urbiztondo, M.; Garrido, O.; Soler, J.; Blazquez, J.A.; Pina, M.P. Novel hybrid membranes based on polybenzimidazole and ETS-10 titanosilicate type material for high temperature proton exchange membrane fuel cells: A comprehensive study on dense and porous systems. J. Power Sources 2011, 196, 8994–9007. [Google Scholar] [CrossRef]
- Kim, D.J.; Choi, D.H.; Park, C.H.; Nam, S.Y. Characterization of the sulfonated PEEK/sulfonated nanoparticles composite membrane for the fuel cell application. Int. J. Hydrogen Energy 2016, 41, 5793–5802. [Google Scholar] [CrossRef]
- Mossayebi, Z.; Saririchi, T.; Rowshanzamir, S.; Parnian, M.J. Investigation and optimization of physicochemical properties of sulfated zirconia/sulfonated poly (ether ketone) nanocomposite membranes for medium temperature proton exchange membrane fuel cells. Int. J. Hydrogen Energy 2016, 41, 12293–12306. [Google Scholar] [CrossRef]
- Devrim, Y.; Erkan, S.; Baç, N.; Eroǧlu, I. Preparation and characterization of sulfonated polysulfone/titanium dioxide composite membranes for proton exchange membrane fuel cells. Int. J. Hydrogen Energy 2009, 34, 3467–3475. [Google Scholar] [CrossRef]
- Wu, Y.; Wu, C.; Varcoe, J.R.; Poynton, S.D.; Xu, T.; Fu, Y. Novel silica/poly(2,6-dimethyl-1,4-phenylene oxide) hybrid anion-exchange membranes for alkaline fuel cells: Effect of silica content and the single cell performance. J. Power Sources 2010, 195, 3069–3076. [Google Scholar] [CrossRef]
- Inoue, T.; Uma, T.; Nogami, M. Performance of H2/O2 fuel cell using membrane electrolyte of phosphotungstic acid-modified 3-glycidoxypropyl-trimethoxysilanes. J. Membr. Sci. 2008, 323, 148–152. [Google Scholar] [CrossRef]
- Amirinejad, M.; Madaeni, S.S.; Rafiee, E.; Amirinejad, S. Cesium hydrogen salt of heteropolyacids/Nafion nanocomposite membranes for proton exchange membrane fuel cells. J. Membr. Sci. 2011, 377, 89–98. [Google Scholar] [CrossRef]
- Akbari, S.; Mosavian, M.T.H.; Moosavi, F.; Ahmadpour, A. Does the addition of a heteropoly acid change the water percolation threshold of PFSA membranes? Phys. Chem. Chem. Phys. 2019, 21, 25080–25089. [Google Scholar] [CrossRef] [PubMed]
- Motz, A.R.; Kuo, M.-C.; Horan, J.L.; Yadav, R.; Seifert, S.; Pandey, T.P.; Galioto, S.; Yang, Y.; Dale, N.V.; Hamrock, S.J.; et al. Heteropoly acid functionalized fluoroelastomer with outstanding chemical durability and performance for vehicular fuel cells. Energy Environ. Sci. 2018, 11, 1499–1509. [Google Scholar] [CrossRef]
- Lin, C.; Haolin, T.; Mu, P. Periodic Nafion-silica-heteropolyacids electrolyte t for PEM fuel cell operated near 200 °C. Int. J. Hydrogen Energy 2012, 37, 4694–4698. [Google Scholar] [CrossRef]
- Schmidt, C.; Glück, T.; Schmidt-Naake, G. Modification of Nafion Membranes by Impregnation with Ionic Liquids. Chem. Eng. Technol. 2008, 31, 13–22. [Google Scholar] [CrossRef]
- Rogalsky, S.; Bardeau, J.-F.; Makhno, S.; Tarasyuk, O.; Babkina, N.; Cherniavska, T.; Filonenko, M.; Fatyeyeva, K. New polymer electrolyte membrane for medium-temperature fuel cell applications based on cross-linked polyimide Matrimid and hydrophobic protic ionic liquid. Mater. Today Chem. 2021, 20, 100453. [Google Scholar] [CrossRef]
- Zanchet, L.; Trindade, L.G.; Bariviera, W.; Nobre Borba, K.M.; Santos, R.D.M.; Paganin, V.A.; Oliveira, C.P.; Ticianelli, E.A.; Martini, E.M.A.; de Souza, M.O. 3-Triethylammonium propane sulfonate ionic liquids for Nafion-based composite membranes for PEM fuel cells. J. Mater. Sci. 2020, 55, 6928–6941. [Google Scholar] [CrossRef]
- Kim, D.J.; Jo, M.J.; Nam, S.Y. A review of polymer–nanocomposite electrolyte membranes for fuel cell application. J. Ind. Eng. Chem. 2015, 21, 36–52. [Google Scholar] [CrossRef]
- Perry, M.L.; Fuller, T.F. A Historical Perspective of Fuel Cell Technology in the 20th Century. J. Electrochem. Soc. 2002, 149, S59–S67. [Google Scholar] [CrossRef]
- Sammes, N.; Bove, R.; Stahl, K. Phosphoric acid fuel cells: Fundamentals and applications. Curr. Opin. Solid State Mater. Sci. 2004, 8, 372–378. [Google Scholar] [CrossRef]
- Platonov, V.A. Properties of polyphosphoric acid. Fibre Chem. 2000, 32, 325–329. [Google Scholar] [CrossRef]
- Koo, J. Studies in Polyphosphoric Acid Cyclizations. J. Am. Chem. Soc. 1953, 75, 1891–1895. [Google Scholar] [CrossRef]
- Paschos, O.; Kunze, J.; Stimming, U.; Maglia, F. A review on phosphate based, solid state, protonic conductors for intermediate temperature fuel cells. J. Phys. Condens. Matter 2011, 23, 234110. [Google Scholar] [CrossRef] [PubMed]
- Joseph, L.; Tumuluri, A.; Klein, L.C. Progress in proton conducting sol-gel glasses. J. Sol-Gel Sci. Technol. 2022, 102, 482–492. [Google Scholar] [CrossRef]
- Hatada, N.; Toyoura, K.; Onishi, T.; Adachi, Y.; Uda, T. Fast and Anisotropic Proton Conduction in a Crystalline Polyphosphate. J. Phys. Chem. C 2014, 118, 29629–29635. [Google Scholar] [CrossRef]
- Herradon, C.; Le, L.; Meisel, C.; Huang, J.; Chmura, C.; Kim, Y.D.; Cadigan, C.; O’Hayre, R.; Sullivan, N.P. Proton-conducting ceramics for water electrolysis and hydrogen production at elevated pressure. Front. Energy Res. 2022, 10, 1020960. [Google Scholar] [CrossRef]
- Meng, Y.; Gao, J.; Zhao, Z.; Amoroso, J.; Tong, J.; Brinkman, K.S. Review: Recent progress in low-temperature proton-conducting ceramics. J. Mater. Sci. 2019, 54, 9291–9312. [Google Scholar] [CrossRef]
- Barelli, L.; Bidini, G.; Cinti, G.; Milewski, J. High temperature electrolysis using molten carbonate electrolyzer. Int. J. Hydrogen Energy 2021, 46, 14922–14931. [Google Scholar] [CrossRef]
- Milewski, J.; Szczęśniak, A.; Szablowski, L. A discussion on mathematical models of proton conducting solid oxide fuel cells. Int. J. Hydrogen Energy 2019, 44, 10925–10932. [Google Scholar] [CrossRef]
- Yuan, J.; Li, Z.; Yuan, B.; Xiao, G.; Li, T.; Wang, J.-Q. Optimization of High-Temperature Electrolysis System for Hydrogen Production Considering High-Temperature Degradation. Energies 2023, 16, 2616. [Google Scholar] [CrossRef]
- Wendt, H.; Imarisio, G. Nine years of research and development on advanced water electrolysis. A review of the research programme of the Commission of the European Communities. J. Appl. Electrochem. 1988, 18, 1–14. [Google Scholar] [CrossRef]
- Schober, T. Applications of oxidic high-temperature proton conductors. Solid State Ion. 2003, 162–163, 277–281. [Google Scholar] [CrossRef]
- Jiang, S.P. Functionalized mesoporous structured inorganic materials as high temperature proton exchange membranes for fuel cells. J. Mater. Chem. A 2014, 2, 7637–7655. [Google Scholar] [CrossRef]
- Aparicio, M.; Jitianu, A.; Klein, L.C. Sol-Gel Processing for Conventional and Alternative Energy; Springer US: Boston, MA, USA, 2012. [Google Scholar] [CrossRef]
- Kojima, S. Mixed-Alkali Effect in Borate Glasses: Thermal, Elastic, and Vibrational Properties. Solids 2020, 1, 16–30. [Google Scholar] [CrossRef]
- Kamistos, E.; Karakassides, M.A. Structural studies of binary and pseudo binary sodium borate glasses of high sodium content. Phys. Chem. Glas. 1989, 30, 19–26. [Google Scholar]
- Morey, G.W.; Merwin, H.E. Phase Equilibrium Relationships in the Binary System, Sodium Oxide-Boric Oxide, with Some Measurements of the Optical Properties of the Glasses. J. Am. Chem. Soc. 1936, 58, 2248–2254. [Google Scholar] [CrossRef]
- Zheng, L.; Sun, X.; Mao, R.; Chen, H.; Zhang, Z.; Zhao, J. Luminescence properties of Ce3+-doped lithium borophosphate glasses and their correlations with the optical basicity. J. Non-Cryst. Solids 2014, 403, 1–4. [Google Scholar] [CrossRef]
- Gerstenberger, D.C.; Trautmann, T.M.; Bowers, M.S. Noncritically phase-matched second-harmonic generation in cesium lithium borate. Opt. Lett. 2003, 28, 1242–1244. [Google Scholar] [CrossRef]
- Tran, B.H.; Wan, S.; Tieu, A.K.; Zhu, H. Tribological Performance of Inorganic Borate at Elevated Temperatures. Tribol. Trans. 2020, 63, 796–805. [Google Scholar] [CrossRef]
- Chryssikos, G.D.; Kamitsos, E.I.; Patsis, A.P.; Karakassides, M.A. On the structure of alkali borate glasses approaching the orthoborate composition. Mater. Sci. Eng. B 1990, 7, 1–4. [Google Scholar] [CrossRef]
- Polack, W.G. The anodic behavior of alkaline borate and perborate solutions. Trans. Faraday Soc. 1915, 10, 177–196. [Google Scholar] [CrossRef]
- Calabretta, D.L.; Davis, B.R. Investigation of the anhydrous molten Na–B–O–H system and the concept: Electrolytic hydriding of sodium boron oxide species. J. Power Sources 2007, 164, 782–791. [Google Scholar] [CrossRef]
- Halliday, C. Molten Alkali Metal Borates for High Temperature Carbon Capture. Ph.D. Thesis, Massachusetts Institute of Technology, Cambridge, MA, USA, 2022. [Google Scholar]
- Martsinchyk, A.; Milewski, J.; Dybiński, O.; Szczęśniak, A.; Siekierski, M.; Świrski, K. Experimental investigation of novel molten borate fuel cell supported by an artificial neural network for electrolyte composition selection. Energy 2023, 279, 127921. [Google Scholar] [CrossRef]
- Milewski, J.; Szczęśniak, A.; Szabłowski, Ł.; Martsinchyk, A.; Siekierski, M.; Dybiński, O.; Świrski, K. Molten Borates Fuel Cells—Mathematical modeling and identification of performances. Renew. Sustain. Energy Rev. 2024, 190B, 113949. [Google Scholar] [CrossRef]
- Kamitsos, E.I.; Chryssikos, G.D. Borate glass structure by Raman and infrared spectroscopies. J. Mol. Struct. 1991, 247, 1–16. [Google Scholar] [CrossRef]
- Tran, B.H.; Tieu, K.; Wan, S.; Zhu, H.; Cuia, S.; Wang, L. Understanding the tribological impacts of alkali element on lubrication of binary borate melt. RSC Adv. 2018, 8, 28847–28860. [Google Scholar] [CrossRef]
- Saravanan, S.; Rajesh, S.; Palani, R. Thermal and Structural Properties of Mixed Alkali and Transition Metal Ions in Sodium Borate Glass. Int. J. Recent Res. Rev. 2015, 8, 1–9. [Google Scholar] [CrossRef]
- Youngman, R.E.; Zwanziger, J.W. On the Formation of Tetracoordinate Boron in Rubidium Borate Glasses. J. Am. Chem. Soc. 1995, 117, 1387–1402. [Google Scholar] [CrossRef]
- Vegiri, A.; Varsamis, C.-P.E.; Kamitsos, E.I. Composition and temperature dependence of cesium-borate glasses by molecular dynamics. J. Chem. Phys. 2005, 123, 014508. [Google Scholar] [CrossRef]
- Osipov, A.A.; Osipova, L.M. Structural studies of Na2O–B2O3 glasses and melts using high-temperature Raman spectroscopy. Phys. B Condens. Matter 2010, 405, 4718–4732. [Google Scholar] [CrossRef]
- Kononova, N.G.; Kokh, A.E.; Bekker, T.B.; Furmanova, N.G.; Maksimov, B.A.; Molchanov, V.N.; Fedorov, P.P. Growth and structure of barium sodium orthoborate NaBaBO3 crystals. Crystallogr. Rep. 2003, 48, 1044–1046. [Google Scholar] [CrossRef]
- Gałecki, J. Preparatyka Nieorganiczna—Czyste Związki Chemiczne; WNT: Warszawa, Poland, 1964. [Google Scholar]
- Supniewski, J. Preparatyka Nieorganiczna; PWN: Warszawa, Poland, 1958. [Google Scholar]
- Karki, A.; Feller, S.; Lim, H.P.; Stark, J.; Sanchez, C.; Shibata, M. The density of sodium-borate glasses related to atomic arrangements. J. Non-Cryst. Solids 1987, 92, 11–19. [Google Scholar] [CrossRef]
- Sennova, N.; Bubnova, R.S.; Cordier, G.; Albert, B.; Filatov, S.K.; Isaenko, L. Temperature-dependent Changes of the Crystal Structure of Li2B4O7. Z. Anorg. Allg. Chemie. 2008, 634, 2601–2607. [Google Scholar] [CrossRef]
- Marezio, M.; Remeika, J.P. Polymorphism of LiMO2 Compounds and High-Pressure Single-Crystal Synthesis of LiBO2. J. Chem. Phys. 1966, 44, 3348. [Google Scholar] [CrossRef]
- Levy, H.A.; Lisensky, G.C. Crystal structures of sodium sulfate decahydrate (Glauber’s salt) and sodium tetraborate decahydrate (borax). Redetermination by neutron diffraction. Acta Crystallogr. Sect. B 1978, 34, 3502–3510. [Google Scholar] [CrossRef]
- Fang, S.-M. The Crystal Structure of Sodium Metaborate Na3(B3O6). Z. Für Krist. Cryst. Mater. 1938, 99, 1–8. [Google Scholar] [CrossRef]
- Şahin, Ö.; Cennetkusu, E.S.; Dolaş, H.; Özdemir, M. Thermal decomposition of potassium tetraborate tetrahydrate to anhydrous potassium tetraborate in a fluidized bed. Thermochim. Acta 2006, 440, 7–12. [Google Scholar] [CrossRef]
- Zachariasen, W.H. The Crystal Structure of Potassium Metaborate, K3(B3O6). J. Chem. Phys. 1938, 5, 919. [Google Scholar] [CrossRef]
- Liu, X.; Liu, G.; Zhao, H.; Zhang, Z.; Wei, Y.; Liu, M.; Wen, W.; Zhou, X. The quantitative monitoring of mechanochemical reaction between solid l-tartaric acid and sodium carbonate monohydrate by terahertz spectroscopy. J. Phys. Chem. Solids 2011, 72, 1245–1250. [Google Scholar] [CrossRef]
- Sakai, S.; Yang, D.; Yasuda, T.; Akiyama, K.; Kuga, T.; Kano, A.; Shiraishi, F.; Amekawa, S.; Ohtsuka, S.; Nakaguchi, K.; et al. Pulsed Terahertz Radiation for Sensitive Quantification of Carbonate Minerals. ACS Omega 2019, 4, 2702–2707. [Google Scholar] [CrossRef]
- Parsons, J.L. Vibrational Spectra of Orthorhombic Metaboric Acid. J. Chem. Phys. 1960, 33, 1860–1866. [Google Scholar] [CrossRef]
- Amaravel, R. The Structural, Optical and Mechanical Properties of Sodium Borate Glasses. Int. J. Res. Appl. Sci. Eng. Technol. 2021, 9, 305–314. [Google Scholar] [CrossRef]
- Goubeau, J.; Hummel, D. Die Schwingungsspektren verschiedener Borsauerstoffverbindungen. Z. Phys. Chem. 1959, 20, 15–33. [Google Scholar] [CrossRef]
- Miller, A.; Wilkins, C.H. Infrared Spectra and Characteristic Frequencies of Inorganic Ions. Anal. Chem. 1952, 24, 1253–1294. [Google Scholar] [CrossRef]


| X= | X3BO3 | X2B4O7 | XBO2 |
|---|---|---|---|
| Li | 660 | 917 [86] | 849 [87] |
| Na | 570 | 743 [88] | 966 [89] |
| K | 790 | 815 [90] | 950 [91] |
| Bond | Wavenumber |
|---|---|
| Overtone | (sb) 3190 cm−1 |
| Overtone | (w) 2507 cm−1 |
| Overtone | (w) 2354 cm−1 |
| Overtone | (w) 2263 cm−1 |
| Overtone | (s) 1736 cm−1 |
| B-O stretch | (sb) 1403 cm−1 |
| B-O-H deform. (in plane) | (s) 1185 cm−1 |
| B-O- deform. (out of plane) | (w) 879 cm−1 |
| Undetermined | (s) 701 cm−1 |
| B-O-deform. | (w) 669 cm−1 |
| B-O-deform. | (w) 627 cm−1 |
| B-O-H deform. (in plane) | (s) 540 cm−1 |
| Li3BO3 | Na3BO3 | K3BO3 |
|---|---|---|
| (m) 3493 cm−1 | ||
| (s) 3409 cm−1 | ||
| (s) 3239 cm−1 | ||
| (s) 3631 cm−1 | ||
| (m) 3431 cm−1 | ||
| (m) 3367 cm−1 | ||
| (m) 3241 cm−1 | ||
| (m) 3318 cm−1 | ||
| (m) 3157 cm−1 | ||
| (m) 3010 cm−1 | ||
| (w) 1736 cm−1 | (w) 1741 cm−1 | |
| (w) 1417 cm−1 | (s) 1427 cm−1 | (m) 1432 cm−1 |
| (s) 1366 cm−1 | ||
| (m) 1331 cm−1 | ||
| (s) 1317 cm−1 | ||
| (s) 1203 cm−1 | (w) 1247 cm−1 | (w) 1198 cm−1 |
| (m) 1176 cm−1 | ||
| (m) 1081 cm−1 | ||
| (s) 927 cm−1 | ||
| (w) 1026 cm−1 | ||
| (m) 1007 cm−1 | ||
| (s) 889 cm−1 | (s) 874 cm−1 | (s) 879 cm−1 |
| (w) 744 cm−1 | ||
| (m) 782 cm−1 | ||
| (m) 669 cm−1 | ||
| (s) 671 cm−1 | (s) 667 cm−1 | (s) 664 cm−1 |
| (s) 588 cm−1 | ||
| (w) 585 cm−1 | ||
| (s) 548 cm−1 | (s) 526 cm−1 | (w) 538 cm−1 |
| (s) 488 cm−1 | ||
| (s) 446 cm−1 | ||
| (m) 422 cm−1 |
| Li3BO3 | Na3BO3 | Li1.5Na1.5BO3 |
|---|---|---|
| (m) 3493 cm−1 | ||
| (s) 3637 cm−1 | (w) 3630 cm−1 | |
| (s) 3409 cm−1 | (w) 3426 cm−1 | |
| (m) 3431 cm−1 | ||
| (m) 3367 cm−1 | (w) 3357 cm−1 | |
| (s) 3234 cm−1 | (w) 3241 cm−1 | |
| (m) 3241 cm−1 | ||
| (w) 1736 cm−1 | (w) 1736 cm−1 | |
| (w) 1417 cm−1 | (s) 1427 cm−1 | (sb) 1430 cm−1 |
| (sb) 1385 cm−1 | ||
| (s) 1331 cm−1 | ||
| (w) 1319 cm−1 | ||
| (s) 1203 cm−1 | (w) 1247 cm−1 | (w) 1279 cm−1 |
| (m) 1176 cm−1 | (m) 1200 cm−1 | |
| (m) 1081 cm−1 | ||
| (s) 927 cm−1 | ||
| (s) 889 cm−1 | (s) 874 cm−1 | (s) 862 cm−1 |
| (w) 785 cm−1 | ||
| (w) 744 cm−1 | (w) 738 cm−1 | |
| (s) 671 cm−1 | (s) 667 cm−1 | (m) 660 cm−1 |
| (s) 588 cm−1 | ||
| (s) 548 cm−1 | (s) 526 cm−1 | (w) 526 cm−1 |
| (s) 488 cm−1 | (bs) 490–400 cm−1 | |
| (s) 446 cm−1 | ||
| (m) 422 cm−1 |
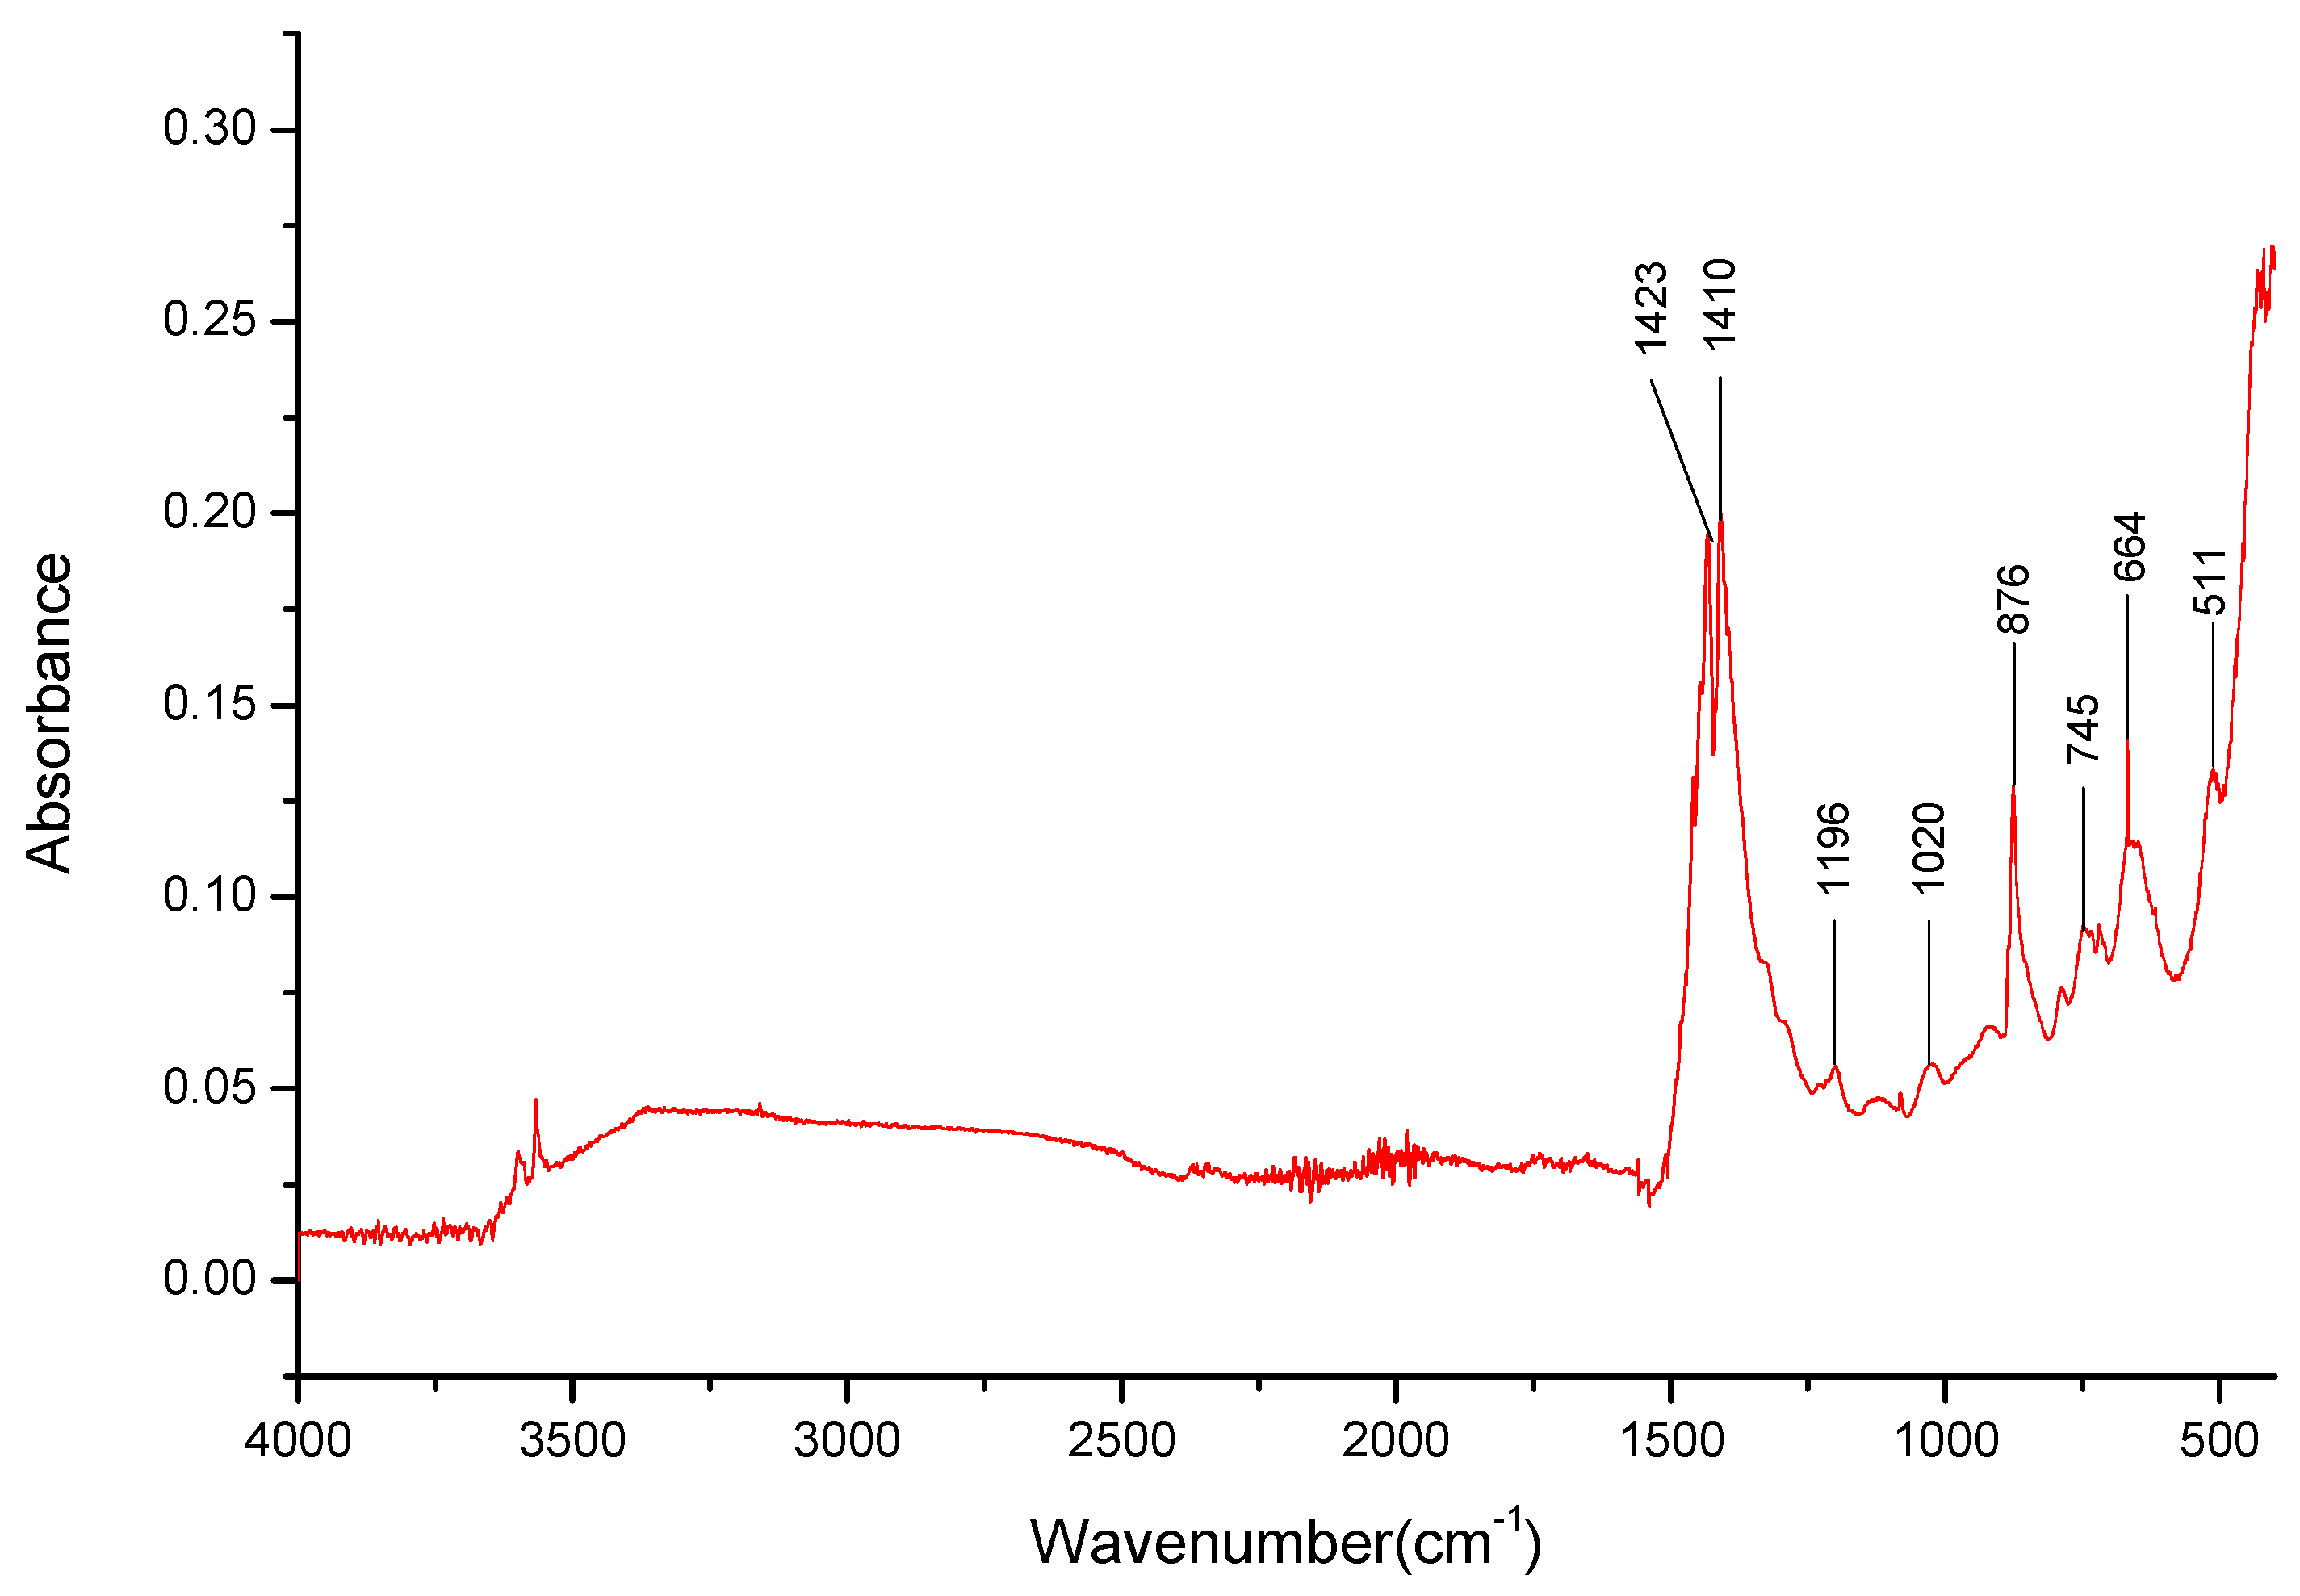
| Li3BO3 | K3BO3 | Li1.5K1.5BO3 |
|---|---|---|
| (m) 3493 cm−1 | (wb) 2490–3367 cm−1 | |
| (s) 3409 cm−1 | ||
| (s) 3239 cm−1 | ||
| (m) 3473 cm−1 | ||
| (m) 3318 cm−1 | ||
| (m) 3157 cm−1 | ||
| (m) 3010 cm−1 | ||
| (w) 1741 cm−1 | ||
| (w) 1417 cm−1 | (m) 1432 cm−1 | (s) 1432 cm−1 |
| (s) 1366 cm−1 | (s) 1410 cm−1 | |
| (m) 1331 cm−1 | ||
| (s) 1317 cm−1 | ||
| (s) 1203 cm−1 | (w) 1198 cm−1 | (w) 1196 cm−1 |
| (w) 1026 cm−1 | (w) 1020 cm−1 | |
| (m) 1007 cm−1 | ||
| (s) 889 cm−1 | (s) 879 cm−1 | (s) 876 cm−1 |
| (w) 782 cm−1 | (w) 745 cm−1 | |
| (w) 669 cm−1 | ||
| (s) 671 cm−1 | (s) 664 cm−1 | (m) 664 cm−1 |
| (s) 588 cm−1 | ||
| (w) 585 cm−1 | ||
| (s) 548 cm−1 | (w) 538 cm−1 | (m) 511 cm−1 |
| (s) 488 cm−1 | 480–400 cm−1 | |
| (s) 446 cm−1 | ||
| (m) 422 cm−1 |
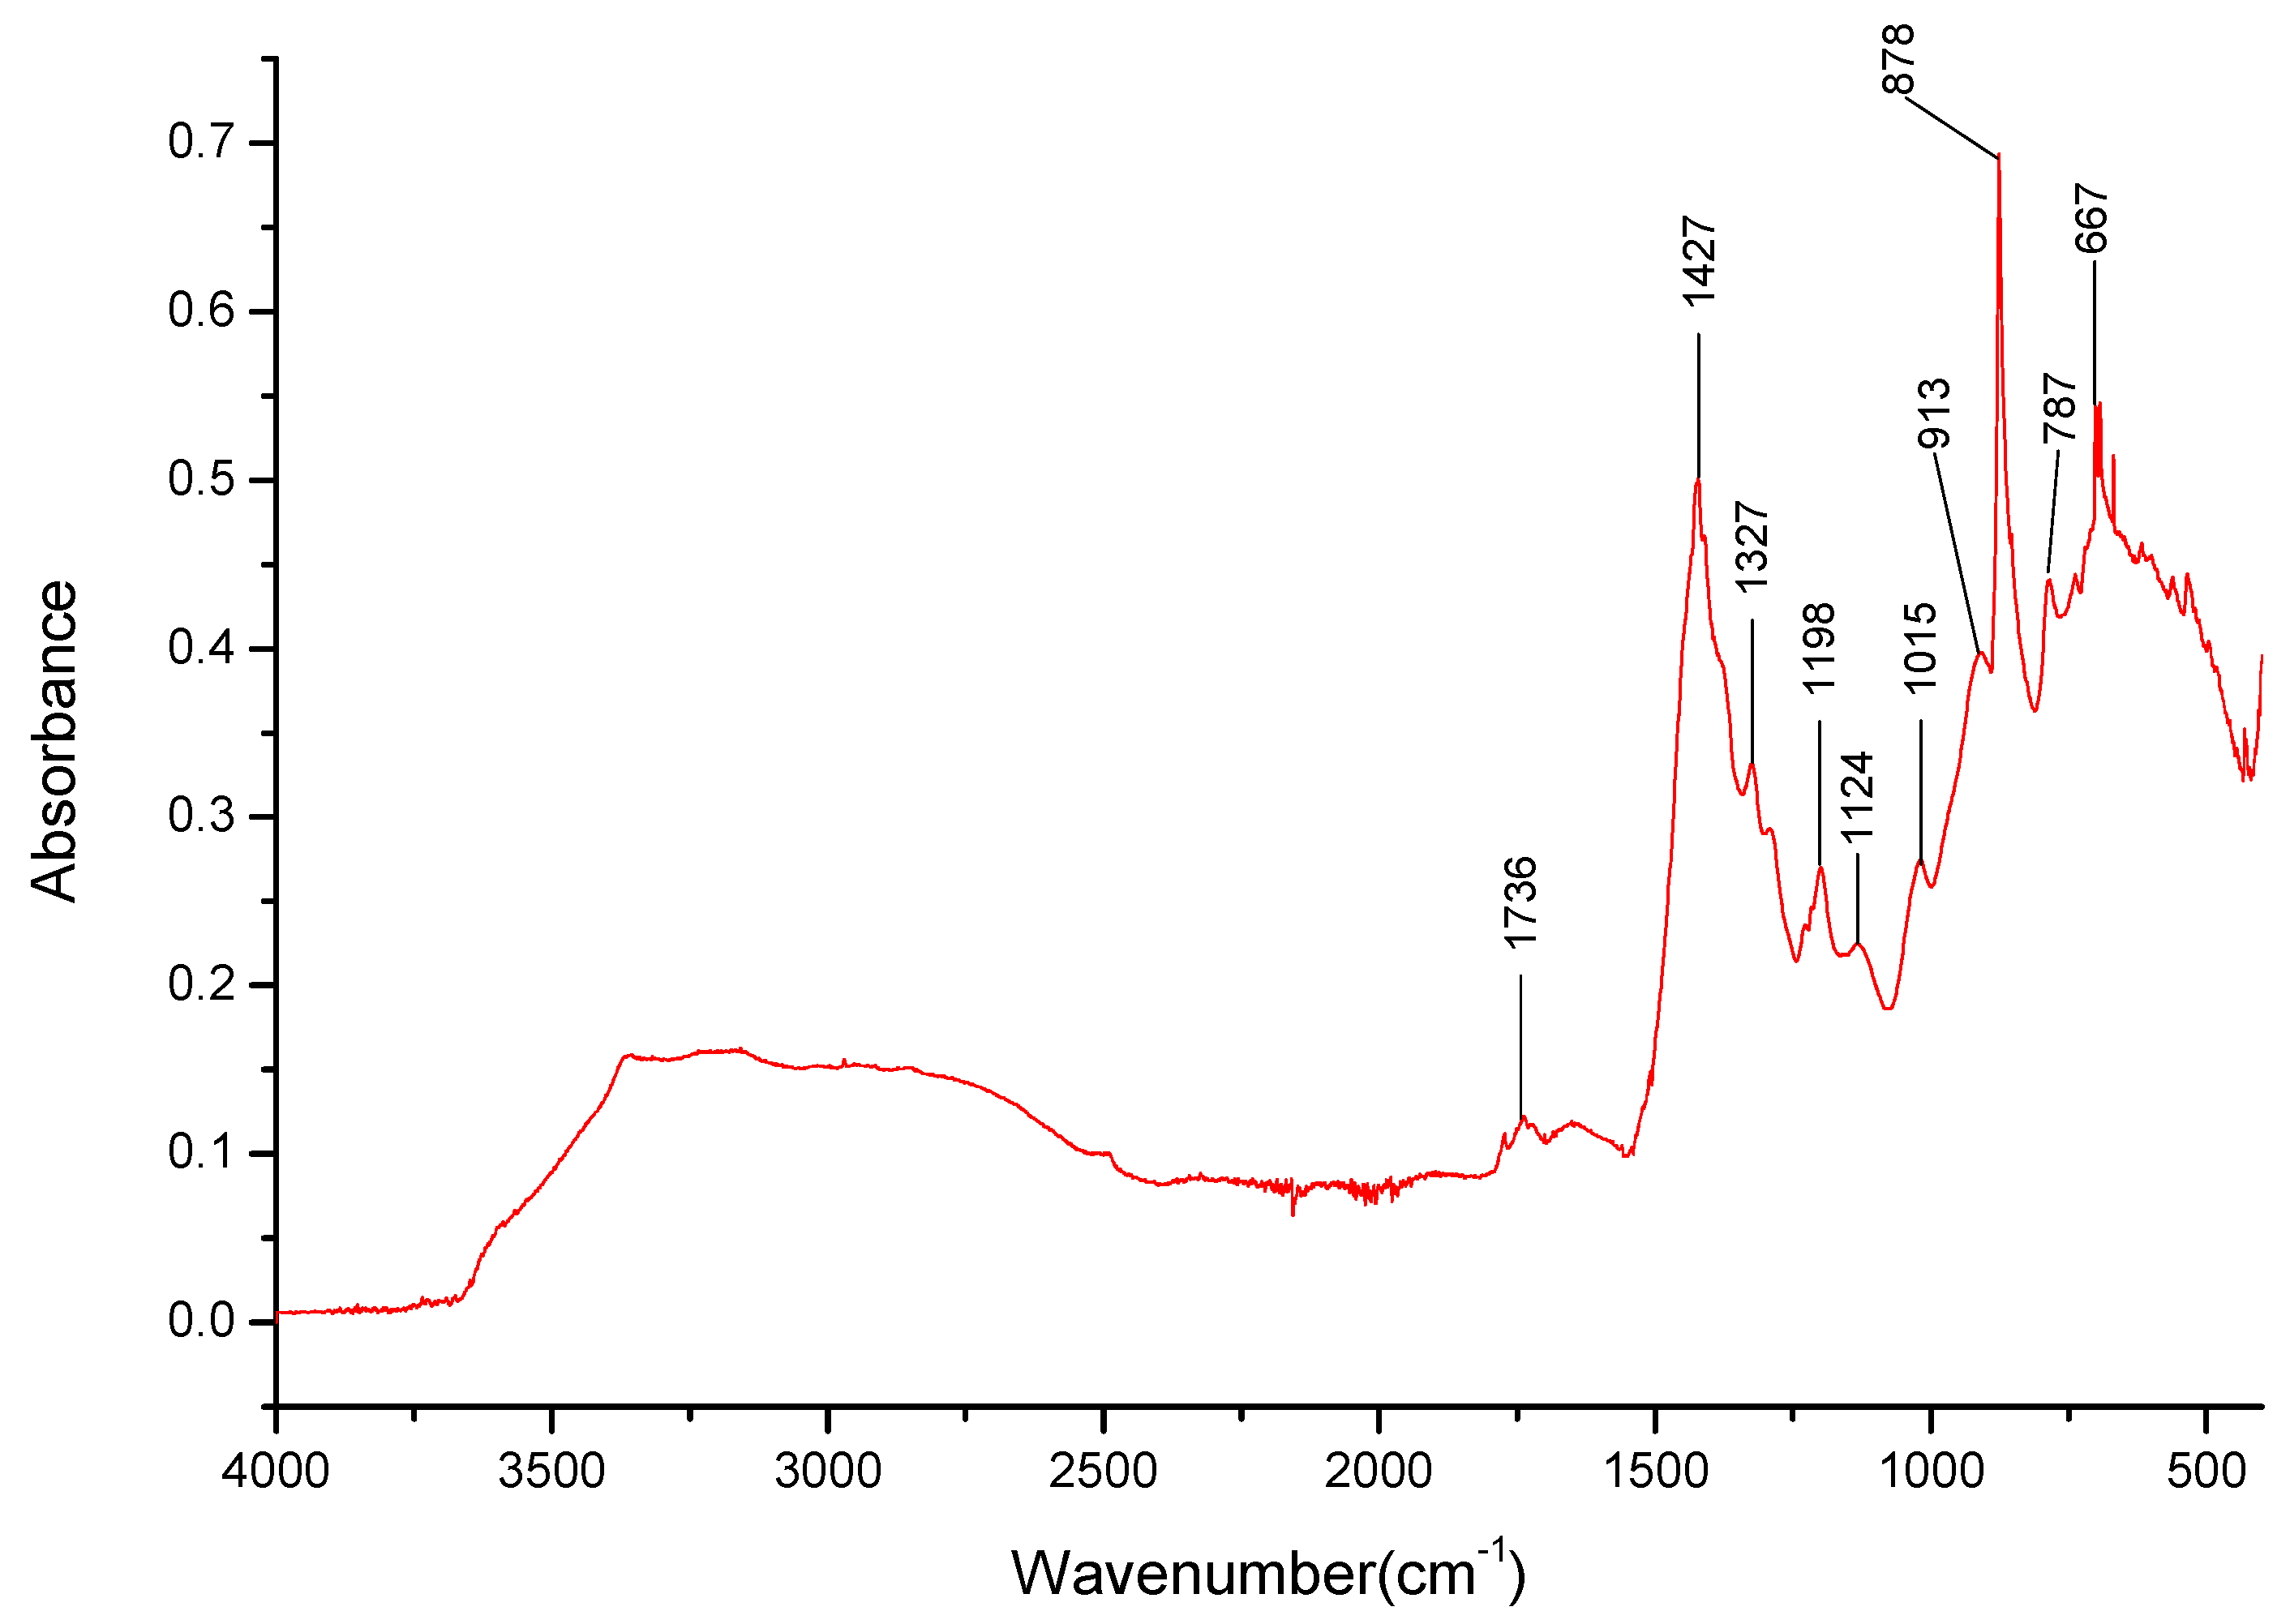
| Na3BO3 | K3BO3 | Na1.5K1.5BO3 |
|---|---|---|
| (s) 3631 cm−1 | (b) 2490–3367 cm−1 | |
| (m) 3431 cm−1 | ||
| (m) 3367 cm−1 | ||
| (m) 3241 cm−1 | ||
| (m) 3473 cm−1 | ||
| (m) 3318 cm−1 | ||
| (m) 3157 cm−1 | ||
| (m) 3010 cm−1 | ||
| (w) 1736 cm−1 | (w) 1741 cm−1 | (w) 1736 cm−1 |
| (s) 1427 cm−1 | (m) 1432 cm−1 | (s) 1427 cm−1 |
| (s) 1366 cm−1 | ||
| (s) 1317 cm−1 | (w) 1327 cm−1 | |
| (w) 1247 cm−1 | (w) 1198 cm−1 | (w) 1198 cm−1 |
| (m) 1176 cm−1 | (w) 1124 cm−1 | |
| (m) 1081 cm−1 | ||
| (w) 1026 cm−1 | (w) 1015 cm−1 | |
| (m) 1007 cm−1 | ||
| (s) 927 cm−1 | (w) 913 cm−1 | |
| (s) 874 cm−1 | (s) 879 cm−1 | (s) 878 cm−1 |
| (w) 744 cm−1 | ||
| (w) 782 cm−1 | (w) 787 cm−1 | |
| (w) 669 cm−1 | ||
| (s) 667 cm−1 | (s) 664 cm−1 | (w) 667 cm−1 |
| (w) 585 cm−1 | ||
| (s) 526 cm−1 | (w) 538 cm−1 |
| Li3BO3 | Na3BO3 | K3BO3 | LiNaKBO3 |
|---|---|---|---|
| (m) 3493 cm−1 | |||
| (s) 3409 cm−1 | |||
| (s) 3239 cm−1 | |||
| (s) 3631 cm−1 | (s) 3637 cm−1 | ||
| (m) 3431 cm−1 | (m) 3431 cm−1 | ||
| (w) 3520 cm−1 | |||
| (m) 3367 cm−1 | (m) 3360 cm−1 | ||
| (m) 3241 cm−1 | (m) 3234 cm−1 | ||
| (m) 3473 cm−1 | |||
| (m) 3318 cm−1 | |||
| (m) 3157 cm−1 | |||
| (m) 3010 cm−1 | |||
| (w) 1736 cm−1 | (w) 1741 cm−1 | ||
| (w) 1568 cm−1 | |||
| (w) 1417 cm−1 | (s) 1427 cm−1 | (m) 1432 cm−1 | (w) 1425 cm−1 |
| (s) 1366 cm−1 | |||
| (m) 1331 cm−1 | |||
| (s) 1317 cm−1 | |||
| (s) 1203 cm−1 | (w) 1247 cm−1 | (w) 1198 cm−1 | (m) 1251 cm−1 |
| (m) 1176 cm−1 | (m) 1176 cm−1 | ||
| (m) 1081 cm−1 | (m) 1074 cm−1 | ||
| (s) 927 cm−1 | (s) 921 cm−1 | ||
| (w) 1026 cm−1 | |||
| (m) 1007 cm−1 | |||
| (s) 889 cm−1 | (s) 874 cm−1 | (s) 879 cm−1 | (s) 874 cm−1 |
| (w) 744 cm−1 | (m) 736 cm−1 | ||
| (w) 782 cm−1 | |||
| (w) 669 cm−1 | |||
| (s) 671 cm−1 | (s) 667 cm−1 | (s) 664 cm−1 | (s) 664 cm−1 |
| (s) 588 cm−1 | (m) 619 cm−1 | ||
| (w) 585 cm−1 | (w) 560 cm−1 | ||
| (s) 548 cm−1 | (s) 526 cm−1 | (w) 538 cm−1 | (s) 528 cm−1 |
| (s) 488 cm−1 | (sb) 480–400 cm−1 | ||
| (s) 446 cm−1 | |||
| (m) 422 cm−1 |
Disclaimer/Publisher’s Note: The statements, opinions and data contained in all publications are solely those of the individual author(s) and contributor(s) and not of MDPI and/or the editor(s). MDPI and/or the editor(s) disclaim responsibility for any injury to people or property resulting from any ideas, methods, instructions or products referred to in the content. |
© 2024 by the authors. Licensee MDPI, Basel, Switzerland. This article is an open access article distributed under the terms and conditions of the Creative Commons Attribution (CC BY) license (https://creativecommons.org/licenses/by/4.0/).
Share and Cite
Milewski, J.; Ryś, P.; Krztoń-Maziopa, A.; Żukowska, G.; Majewska, K.; Zybert, M.; Kowalczyk, J.; Siekierski, M. Structural Investigation of Orthoborate-Based Electrolytic Materials for Fuel Cell Applications. Energies 2024, 17, 2097. https://0-doi-org.brum.beds.ac.uk/10.3390/en17092097
Milewski J, Ryś P, Krztoń-Maziopa A, Żukowska G, Majewska K, Zybert M, Kowalczyk J, Siekierski M. Structural Investigation of Orthoborate-Based Electrolytic Materials for Fuel Cell Applications. Energies. 2024; 17(9):2097. https://0-doi-org.brum.beds.ac.uk/10.3390/en17092097
Chicago/Turabian StyleMilewski, Jarosław, Piotr Ryś, Anna Krztoń-Maziopa, Grażyna Żukowska, Karolina Majewska, Magdalena Zybert, Jacek Kowalczyk, and Maciej Siekierski. 2024. "Structural Investigation of Orthoborate-Based Electrolytic Materials for Fuel Cell Applications" Energies 17, no. 9: 2097. https://0-doi-org.brum.beds.ac.uk/10.3390/en17092097