
Optimising Ion Conductivity in NdBaInO4-Based Phases
by
 , ,
, ,
Manyu Chen
1,*,
Cheng Li
2,
Kai Zhu
1,
Jieyu Wang
1,
Sida Liu
1,
Weina Kong
1,
Zifa Ban
1 and
Chao Shen
1 1
Avic Composite Corporation Ltd., Beijing 101300, China
2
Neutron Scattering Division, Oak Ridge National Lab, Oak Ridge, TN 37831, USA
*
Author to whom correspondence should be addressed.
Energies 2024, 17(9), 2029; https://0-doi-org.brum.beds.ac.uk/10.3390/en17092029
Submission received: 11 February 2024
/
Revised: 18 April 2024
/
Accepted: 22 April 2024
/
Published: 25 April 2024
(This article belongs to the Section D1: Advanced Energy Materials)
Abstract
:Based on the previous work conducted by Fujii et al., NdBaInO4 compounds present modest oxide-ion conductivities. Therefore, it has been an attractive system of significant interest. In this study, we attempted to partially substitute Ca for Nd and the total electrical conductivity was successfully improved due to the generation of oxygen vacancies. The synthesis, crystal structure, density, surface topography, and electrical properties of NdBaInO4 and Ca-doped NdBaInO4 have been studied, respectively. NdBaInO4 and 10% and 20% molar fractions of Ca-doped NdBaInO4 were synthesized through solid-state reactions. The crystal structure of them was obtained from Le Bail refinement of the XRD pattern, giving the result of the monoclinic structure, which belongs to P21/c space group. The highest total electrical conductivity of 4.91 × 10⁻³ S cm−1 was obtained in the Nd0.9Ca0.1BaInO3.95 sample at a temperature of 760 °C in the dry atmosphere and the activation energy was reduced from 0.68 eV to 0.58 eV when the temperature was above 464 °C (737 K) after doping the NdBaInO4 with a 0.1 molar fraction of Ca2+. Moreover, the total conductivity of Nd0.9Ca0.1BaInO3.95 in the wet atmosphere at moderate temperature was relatively higher than that in the dry atmosphere, which suggests that potential proton conduction may exist in wet atmospheres. In addition, the oxygen diffusion coefficients of Nd0.9Ca0.1BaInO3.95 (D* = 1.82 × 10⁻⁸ cm2/s, 850 °C) was about two times higher than that of Nd0.8Ca0.2BaInO3.90 (D* = 7.95 × 10⁻⁹ cm2/s, 850 °C) and was increased significantly by two orders of magnitude when compared with the oxygen diffusion coefficient of the undoped NdBaInO4 (D* = 8.25 × 10⁻¹¹ cm2/s, 850 °C).
1. Introduction
Solid oxide materials with high oxide-ion conductivity and proton conductivity have been widely applied to many technological applications such as oxygen separation membranes, PCECs, and solid oxide fuel cells (SOFCs) [1,2,3,4,5,6,7,8,9,10], thus they have attracted a great deal of interest. The most investigated oxygen-ion and proton conductors are complex oxides with perovskite structures. A perovskite-related structure family with monoclinic P21/c phase and AA’BO4 composition, which is based on NdBaInO4, has been reported by Fujii et al. [11]. It is an oxide-ion conductor, but the ionic conductivity is relatively modest. Therefore, many investigations have been carried out on this structure.
The transport properties in ceramic oxides are dominated by type, concentration, and mobility of charge carriers in the materials. Therefore, not only the crystal structure but also the defects, point defects in particular, have dramatic effects on the oxide-ion conductivity of the material. There are two types of defects in solid oxides, one is intrinsic defects and another is extrinsic defects. Extrinsic defects are mainly influenced by some external factors such as temperature, oxygen partial pressure, and doping elements. Doping effects have the benefit of promoting the charge carriers’ concentration, which improves electrical conductivity. Therefore, it is practicable to chemically modify the composition of NdBaInO4 to enhance oxide-ion conductivity, which can be realized by introducing oxygen vacancies into NdBaInO4 through doping with aliovalent cations.
Fujii et al. [12] successfully doped Sr at the Nd site and the electrical conductivity was significantly improved due to the increase in the concentration of oxygen vacancies, which act as carriers for oxide-ion conduction. In addition, the activation energy was reduced through doping with Sr. It was also found by Ishihara et al. [13] that the substitution of In with Ti in NdBaInO4 is effective for increasing oxide-ion conductivity.
In this work, we attempted to partially substitute a small amount of Ca element for Nd, which has the potential to improve the total electrical conductivity and decrease the activation energy by introducing oxygen vacancies. The crystal structure and lattice parameters of Ca-doped NaBaInO4 were characterized via X-ray diffraction and Le Bail refinement. The electrical conductivity of Ca-doped NaBaInO4 was measured through AC impedance spectroscopy. The properties of NaBaInO4 were also analysed for comparison. Furthermore, the effects of Ca2+ doping on the electrical properties and the mechanism of the ion diffusion were studied and are discussed in this work.
The rest of this paper is organized as follows. In Section 2, we present the details of the synthesis procedure and general analytical methods. Then, the crystal structure, density, surface topography, and electrical properties of NdBaInO4 and Ca-doped NdBaInO4 have been studied, respectively, and the results are presented in Section 3. Finally, we conclude the paper in Section 4.
2. Materials and Methods
2.1. Synthesis
The precursors of NaBaInO4 and Ca-doped NaBaInO4 compounds were synthesized via solid-state reactions. For the NaBaInO4, the constituent component oxides, Nd2O3 (Alfa Aesar, 99.9% purity), In2O3 (Alfa Aesar, 99.9% purity), and BaCO3 (Aldrich, 99+% purity) were accurately weighed in 1:1:1 cation molar ratios. As for Nd1−xCaxBaInO4−x/2(x = 0.1, 0.2), Nd2O3, CaCO3 (AnalaR, 99.9% purity), BaCO3, and In2O3 were exactly weighed in 1 − x:x:1:1 cation molar ratios. Then, the starting materials were mixed and finely ground using a ball mill for 3 h. Then, a controlled amount of dried mixed powder (about 1 g) was loaded into a polished cylindrical die cavity 13 mm in diameter and uniaxially prepressed into compacts through a rigid punch at 1.6 tonnes of weight for 2 min. In order to further enhance the density of the green compacts, a Stansted Fluid Power Isostatic Press (Model FPG2560A) was used to press them to 300 MPa pressure for 2 min.
The green pellets were first calcined at 1000 °C for 14 h. Then, undoped green pellets were sintered at 1440 °C; while green pellets, which were doped with 0.1 and 0.2 molar fractions of Ca2+, were sintered at 1430 °C and 1420 °C, respectively. The dwelling time for the sintering process was 20 h. The heating rate was 10 °C min−1 for calcinations, while it was 20 °C min−1 for the sintering progress. The cooling rate was 10 °C min−1.
2.2. Characterization of the Chemical Composition
The ceramic pellets were analysed via X-ray diffraction at room temperature to confirm the crystallographic data of the pellets. The incident X-rays scan the crystalline sample over a range of 2θ angles as the same with the detector, which records the diffracted X-ray signals and counts signals. X-ray diffraction patterns were collected on an instrument called a Bruker D2 Phaser Diffractometer, which uses Cu-Kα radiation (λ = 1.5418 Å). Scans were continuous from 10° to 80° (2θ) with an increment of 0.032° (2θ) and step time of 0.9 s over a period of about 35 min. The analysis of crystallographic data was further performed with the Le Bail refinement by using the Fullprof refinement program and WinPLOTR software 2006 was used to plot the diffraction patterns.
2.3. Scanning Electron Microscopy and Energy Dispersive Spectrometry
In order to determine the optimum ball milling time, the morphologies of the starting ceramic powders, which were ball-milled for different lengths of time, were studied using an JEOL JSM-6010 LA analytical scanning electron microscope(JEOL, Tokyo, Japan) (using 20 kV with the working distance of 15 mm and 19 mm). The sample was coated with gold via plasma sputtering at a sputtering current of 20 mA for 2 min. The instrument used for sputtering was a K550 Gold Target.
In addition, in order to analyse the porosity of pellets, the morphologies of the pellets’ surface were characterized via scanning electron microscopy. Before characterization, these pellets were gradually ground using silicon carbide paper from 800-grit size to 4000-grit size. Then, all ceramic pellets were coated with gold using a sputter coater at a sputtering current of 20 mA for 2 min. The accelerating voltage used was 20 kV.
Furthermore, the cationic ratio of NaBaInO4 and Ca-doped NaBaInO4 compounds were confirmed via energy dispersive spectrometry (EDS).
2.4. Electrical Conductivity Measurements
The electrical conductivities of NaBaInO4 and Ca-doped NaBaInO4 were first measured in the dry air, using a pellet sample via the standard 2-probe AC impedance spectroscopy method. A Solartron 1260 frequency response analyser (FRA) was employed, which used platinum mesh to form a contact. The tasks for the impedance measurements were set up using SMaRT (Version 3.2.1) software and the measurements ran automatically once the projects were created.
These sintered pellets were coated with electrode paste made of platinum and then cured at 800 °C for 1 h. The pellets were then annealed at 823 °C for 5 h before the impedance measurements, which were performed in the process of lowering the temperature from 760 °C to 270 °C at 50 °C intervals and the frequency range from 107 Hz to 1 Hz. The compressed air, which was dried using 98% sulfuric acid, was passed through the pipe to create a dry atmosphere.
Moreover, in order to investigate the effects of the humidified atmosphere on oxygen transport, the electrical conductivity measurements were also conducted in the wet atmosphere for NaBaInO4 and Nd0.9Ca0.1BaInO3.95 pellets separately using AC impedance spectroscopy. The pellets were also annealed at 823 °C for 5 h and measured in the same temperature range and frequency range as before. The wet atmosphere was created by making the compressed air flowing through a water bubbler at room temperature, and the humidity was estimated to be 2% (vol).
2.5. Oxygen Isotope Exchange
Two samples composed of Nd0.9Ca0.1BaInO3.95 and Nd0.8Ca0.2BaInO3.90, which have a relative density 97% of the calculated density, were chosen for the isotope exchange. Because the rough surface had diffusion entering from other directions, which affects the diffusion profile significantly, the samples were gradually ground using silicon carbide paper from 800-grit size to 4000-grit size and then polished down to 1 micron using polishing discs. Then, these well-polished surfaces were coated with a very thin layer of diluted platinum paste and curing was carried out at 800 °C for one hour in order to assist the isotope exchange.
After that, both samples were put into a tube and located next to a thermocouple. Before annealing, the tube was evacuated to a pressure of 4 × 10⁻⁷ mbar. Then, 16O2 with high purity (99.999%) was pumped into the tube to a pressure of 200 mbar and the two samples were both pre-annealed at 850 °C in a furnace under this atmosphere for 40 h, which is 10 times longer than that of 18O2 isotope exchange [14]. This pre-annealing process aims to remove the surface damage caused by polishing [15]. After these two samples were cooled down to room temperature, evacuation was performed again, as before, and 51.4% 18O2 was pumped into the tube to the same pressure. Then, the isotope exchange was performed at 850 °C for 4 h. At the end of the experiment, the 18O2 was recycled by liquid nitrogen due to the high cost of 18O2.
2.6. Secondary Ion Mass Spectrometry
Both samples were then cut perpendicular to the polished surface using the diamond saw and the cross sections of the samples were polished down to 1 micron with the same steps as before. After preparation, the cross sections of both samples were analysed via SIMS with line scanning mode. The instrument was equipped with a Bi primary ion beam as well as a Cs secondary ion. The surface of the samples was cleaned by sputtering with 1 keV Cs until the yield of the contamination species had dropped to its minimum and the yield for 16O stopped changing. Then, the elements were detected using TOF mass spectroscopy.
3. Results and Discussion
3.1. Ball Milling Time Determination
The secondary electron images of these ball-milled powders with different time intervals are shown in Figure 1. From the SEM micrographs, it is observed that the particle size becomes smaller and has more uniform distribution when the ball-milling time is increased to 3 h. The morphologies varied from irregular-shaped (1 h), to long and thick needle-shaped (2 h), and to short and thin needle-shaped (3 h) particles. When the ball-milling time increases to 4 h, the size of the needle-shaped particles become larger again. With further increases in the ball-milling time, the particles started to agglomerate, which has bad effects on the following sintering process; for instance, the porosity of the pellets will be increased. Finally, the size of a part of the particles becomes very large. As a result, 3 h milled powders are the optimum choice for the next sintering stage.
3.2. Crystal Structure of NaBaInO4 and Ca-Doped NaBaInO4 via Le Bail Refinement
The X-ray diffraction patterns of NaBaInO4 and Ca-doped NaBaInO4 compounds are shown in Figure 2. For NaBaInO4 compound, the experimental pattern shows no difference from the pattern that was reported by Fujii et al. [11]. Therefore, the sample can be confirmed to be NdBaInO4 compounds and no secondary phase was detected. In addition, the space group can be identified as P21/c and the structure system was confirmed to be monoclinic. Based on the X-ray diffraction data, which were detected using a Bruker D2 Phaser Diffractometer, Le Bail refinement was carried out for NdBaInO4, Nd0.9Ca0.1BaInO3.95, and Nd0.8Ca0.2BaInO3.90 so as to explore the structure and crystal lattice parameters’ changes in NdBaInO4 via 10 mol% and 20 mol% Ca doping. The final Le Bail patterns are shown in Figure 2 and the final refined crystallographic parameters are shown in Table 1.
As for Ca-doped NaBaInO4 compounds, their experimental patterns (peak positions and peak shapes) are in great agreement with Le Bail refinement patterns. Therefore, the refined lattice parameters can be determined accurately and the results are also shown in Table 1. In addition, there is no other peak appearing when compared with the experimental patterns of NaBaInO4 compounds. As a result, Nd0.9Ca0.1BaInO3.95 and Nd0.8Ca0.2BaInO3.90 can also be identified as being of the monoclinic P21/c NaBaInO4 phase.
3.3. Fractional Change in Crystallographic Data
The variations in crystal lattice parameters between NdBaInO4 and 10 mol% and 20 mol% Ca-doped NdBaInO4 were investigated in this work. The fractional changes in lattice parameters (a-, b- and c-axes; β-angle; and unit-cell volume V) compared with NdBaInO4 are shown in Figure 3. It is observed that apart from c-axes, which are slightly increased, and the β-angle, which is stable, other unit-cell parameters and the unit-cell volume drop significantly when the molar fraction of Ca-doping is raised to 0.2. The inconsistent trend for c-axes values compared with others can be attributed to the big step size set during the X-ray diffraction analysis. A big step size gives rise to a short data collection time and, thus, insufficient data, which influence the accuracy of Le Bail refinement.
This phenomenon can be interpreted in terms of the effective ionic radii of the Ca2+ dopant and in other respects such as defects. The effective ionic radius of Nd3+ (CN=9) is 1.163 Å, which is a little smaller than that of Ca2+ (CN=9) which is 1.18 Å. The ionic radii presented in this work are all taken from Shannon [16]. Therefore, it should have experience expansion of the unit-cell after doping. However, some defects such as oxygen vacancies will be introduced after doping, which indicates that the distances between the ions will be altered and, thus, deformation may occur. So, there must be some balance between the increase in ionic radii and introduction of oxygen vacancies. In this system, it is very likely that Ca2+ with a bigger radius has interaction with oxygen vacancies and finally results in the reduction of the lattice parameters as well as the unit-cell volume. But, the specific interactions have not been studied and investigated in this paper and the further work need to be conducted to explain this phenomenon.
3.4. Microscope Structure of NaBaInO4 and Ca-Doped NaBaInO4
The surface topography of an NdBaInO4 pellet with a relative density of 93.7% of theoretical density was observed via SEM and the images are shown in Figure 4. The pictures with low magnification show that there are a lot of obvious pores; the majority of them are closed pores and a few pores are connected to each other, which demonstrates it is a pellet with high density. From the images taken in high magnification (×2500), the size of some small pores is estimated to be 1–2 microns, while the size of some large pores are 5 microns or bigger.
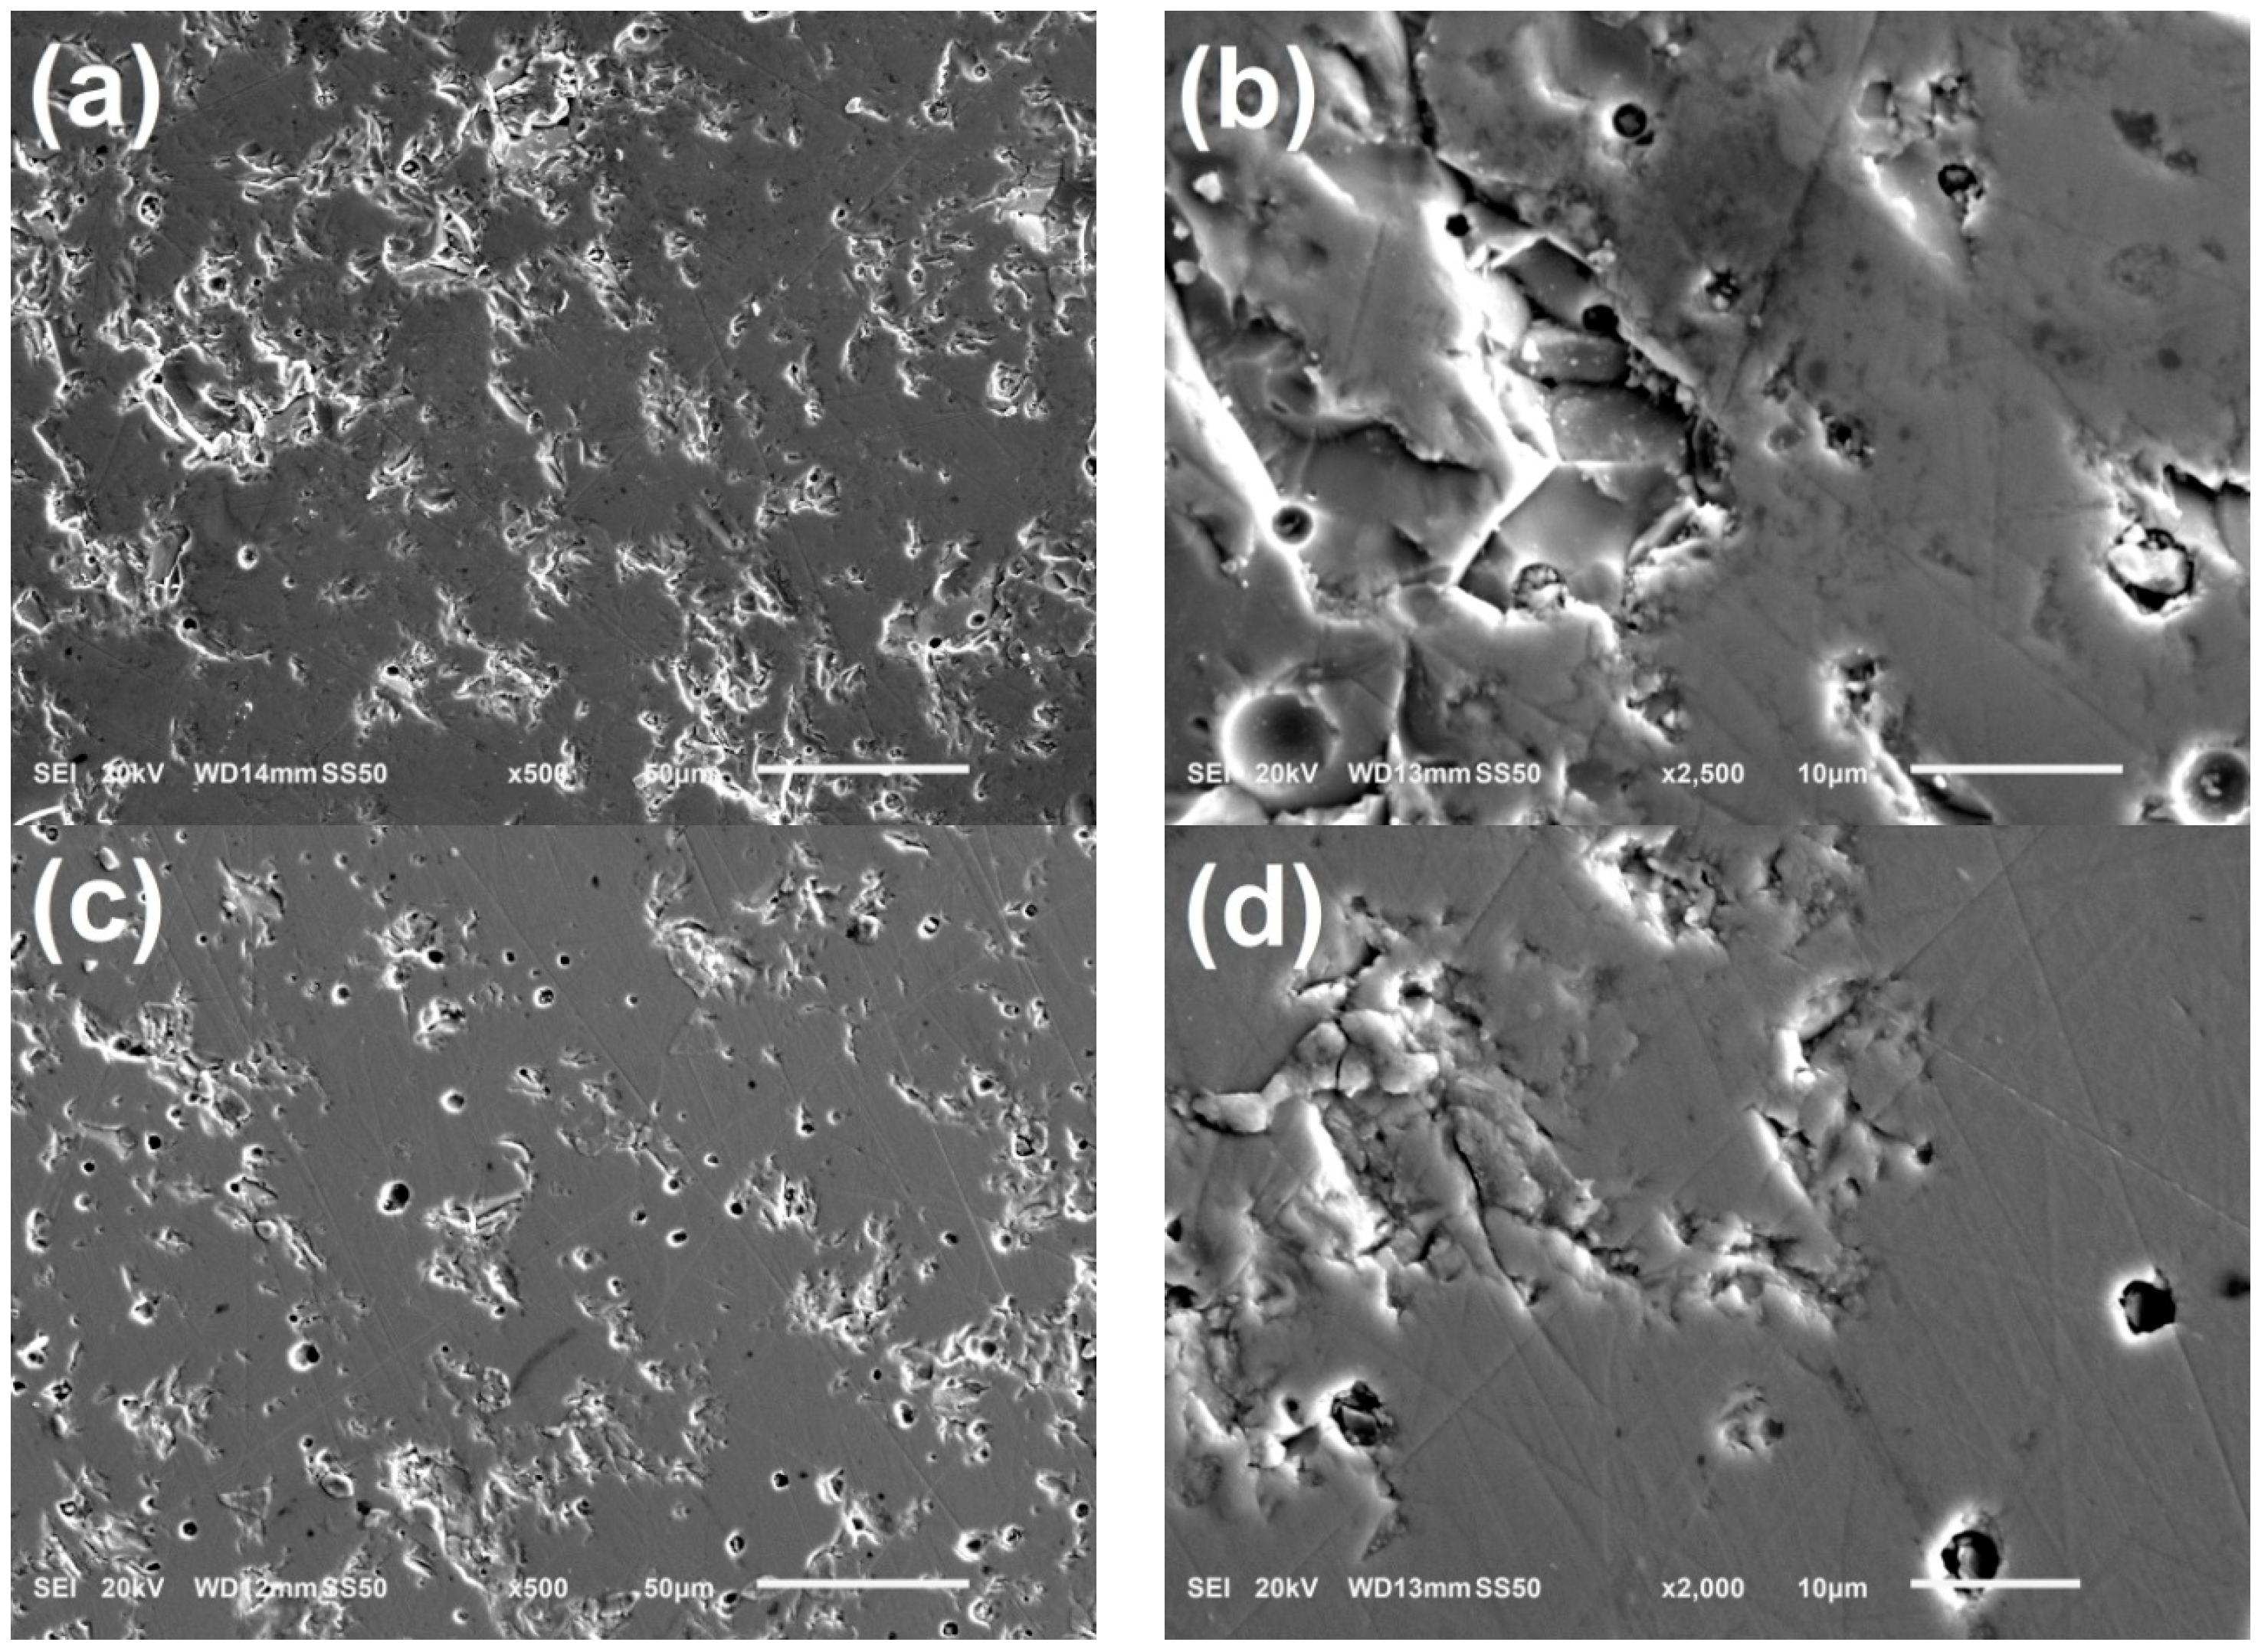
The surface topography of the pellets composed of Nd0.9Ca0.1BaInO3.95 and Nd0.8Ca0.2BaInO3.90 with the relative density of 96.6% and 97.3% of calculated density, respectively, was also observed via SEM and the images are shown in Figure 5. There are some scratches on the surface due to rough polishing with the silicon carbide papers. Apart from some obvious pores, which are in black colour and round in shape, some craters with some particles attached on the surface can be seen from the first two images in particular. This unexpected surface topography may result from the incomplete and rough polishing and contaminants produced during polishing.
3.5. Energy Dispersive Spectrometry
In order to deduce the stoichiometric ratio of synthesized materials quantitatively, energy-dispersive spectrometry analysis was applied in different surface areas of polished samples. The EDS spectra and quantitative stoichiometric values are shown in Figure 6 and Table 2, respectively. It is observed that, apart from Nd, Ba, In, Ca, and O signals, Au and C signals were also detected, which can be attributed to the Au thin film that was sputter coated on the surface before detection and some organic contaminants produced during sample preparation. It is noticeable that the cationic ratio of Nd, Ba, and In is quite close to 1:1:1 for NaBaInO4. Due to inherent difficulties in the accurate detection of light elements such as oxygen via EDS, the values of O can be overlooked. In addition, it is important to bear in mind the errors associated with using default remote standards pre-loaded into the analysis software—the results can be described as semi-quantitative at best. Therefore, the key result of EDS analysis is that no unexplainable elements were detected, which supports the XRD results.
3.6. Temperature Programme Modification
In this work, the temperature programme of heat treatment was improved and modified in order to achieve higher densities of pellets. The theoretical density reported by Fujii et al. is 6.92 Mg m−3 and relative densities obtained in this work are based on it. When the sintering time was reduced from 24 h to 22 h at 1400 °C sintering temperature, the density was enhanced. In this work, 1450 °C sintering temperature was first tried for NdBaInO4 and the sintering time was reduced to 20 h. But, the pellets were found to be molten and evaporated away at the end of heat treatment. Therefore, the sintering temperature for NdBaInO4 was increased from 1410 °C to 1440 °C. By increasing the temperature, the relative density was improved from about 92% to more than 96%.
Generally, doping the materials with other elements will reduce the melting point. As a result, sintering temperatures for Nd0.9Ca0.1BaInO3.95 and Nd0.8Ca0.2BaInO3.90 were set to be 1430 °C and 1420 °C, respectively. Because there is no theoretical density that can be referenced for Ca-doped NdBaInO4, the density calculated with refined lattice parameters was used as the theoretical density. The results show that the relative density could even achieve 97% after modifications.
3.7. Electrical Conductivity of NdBaInO4 and Ca-Doped NdBaInO4 in Dry Air
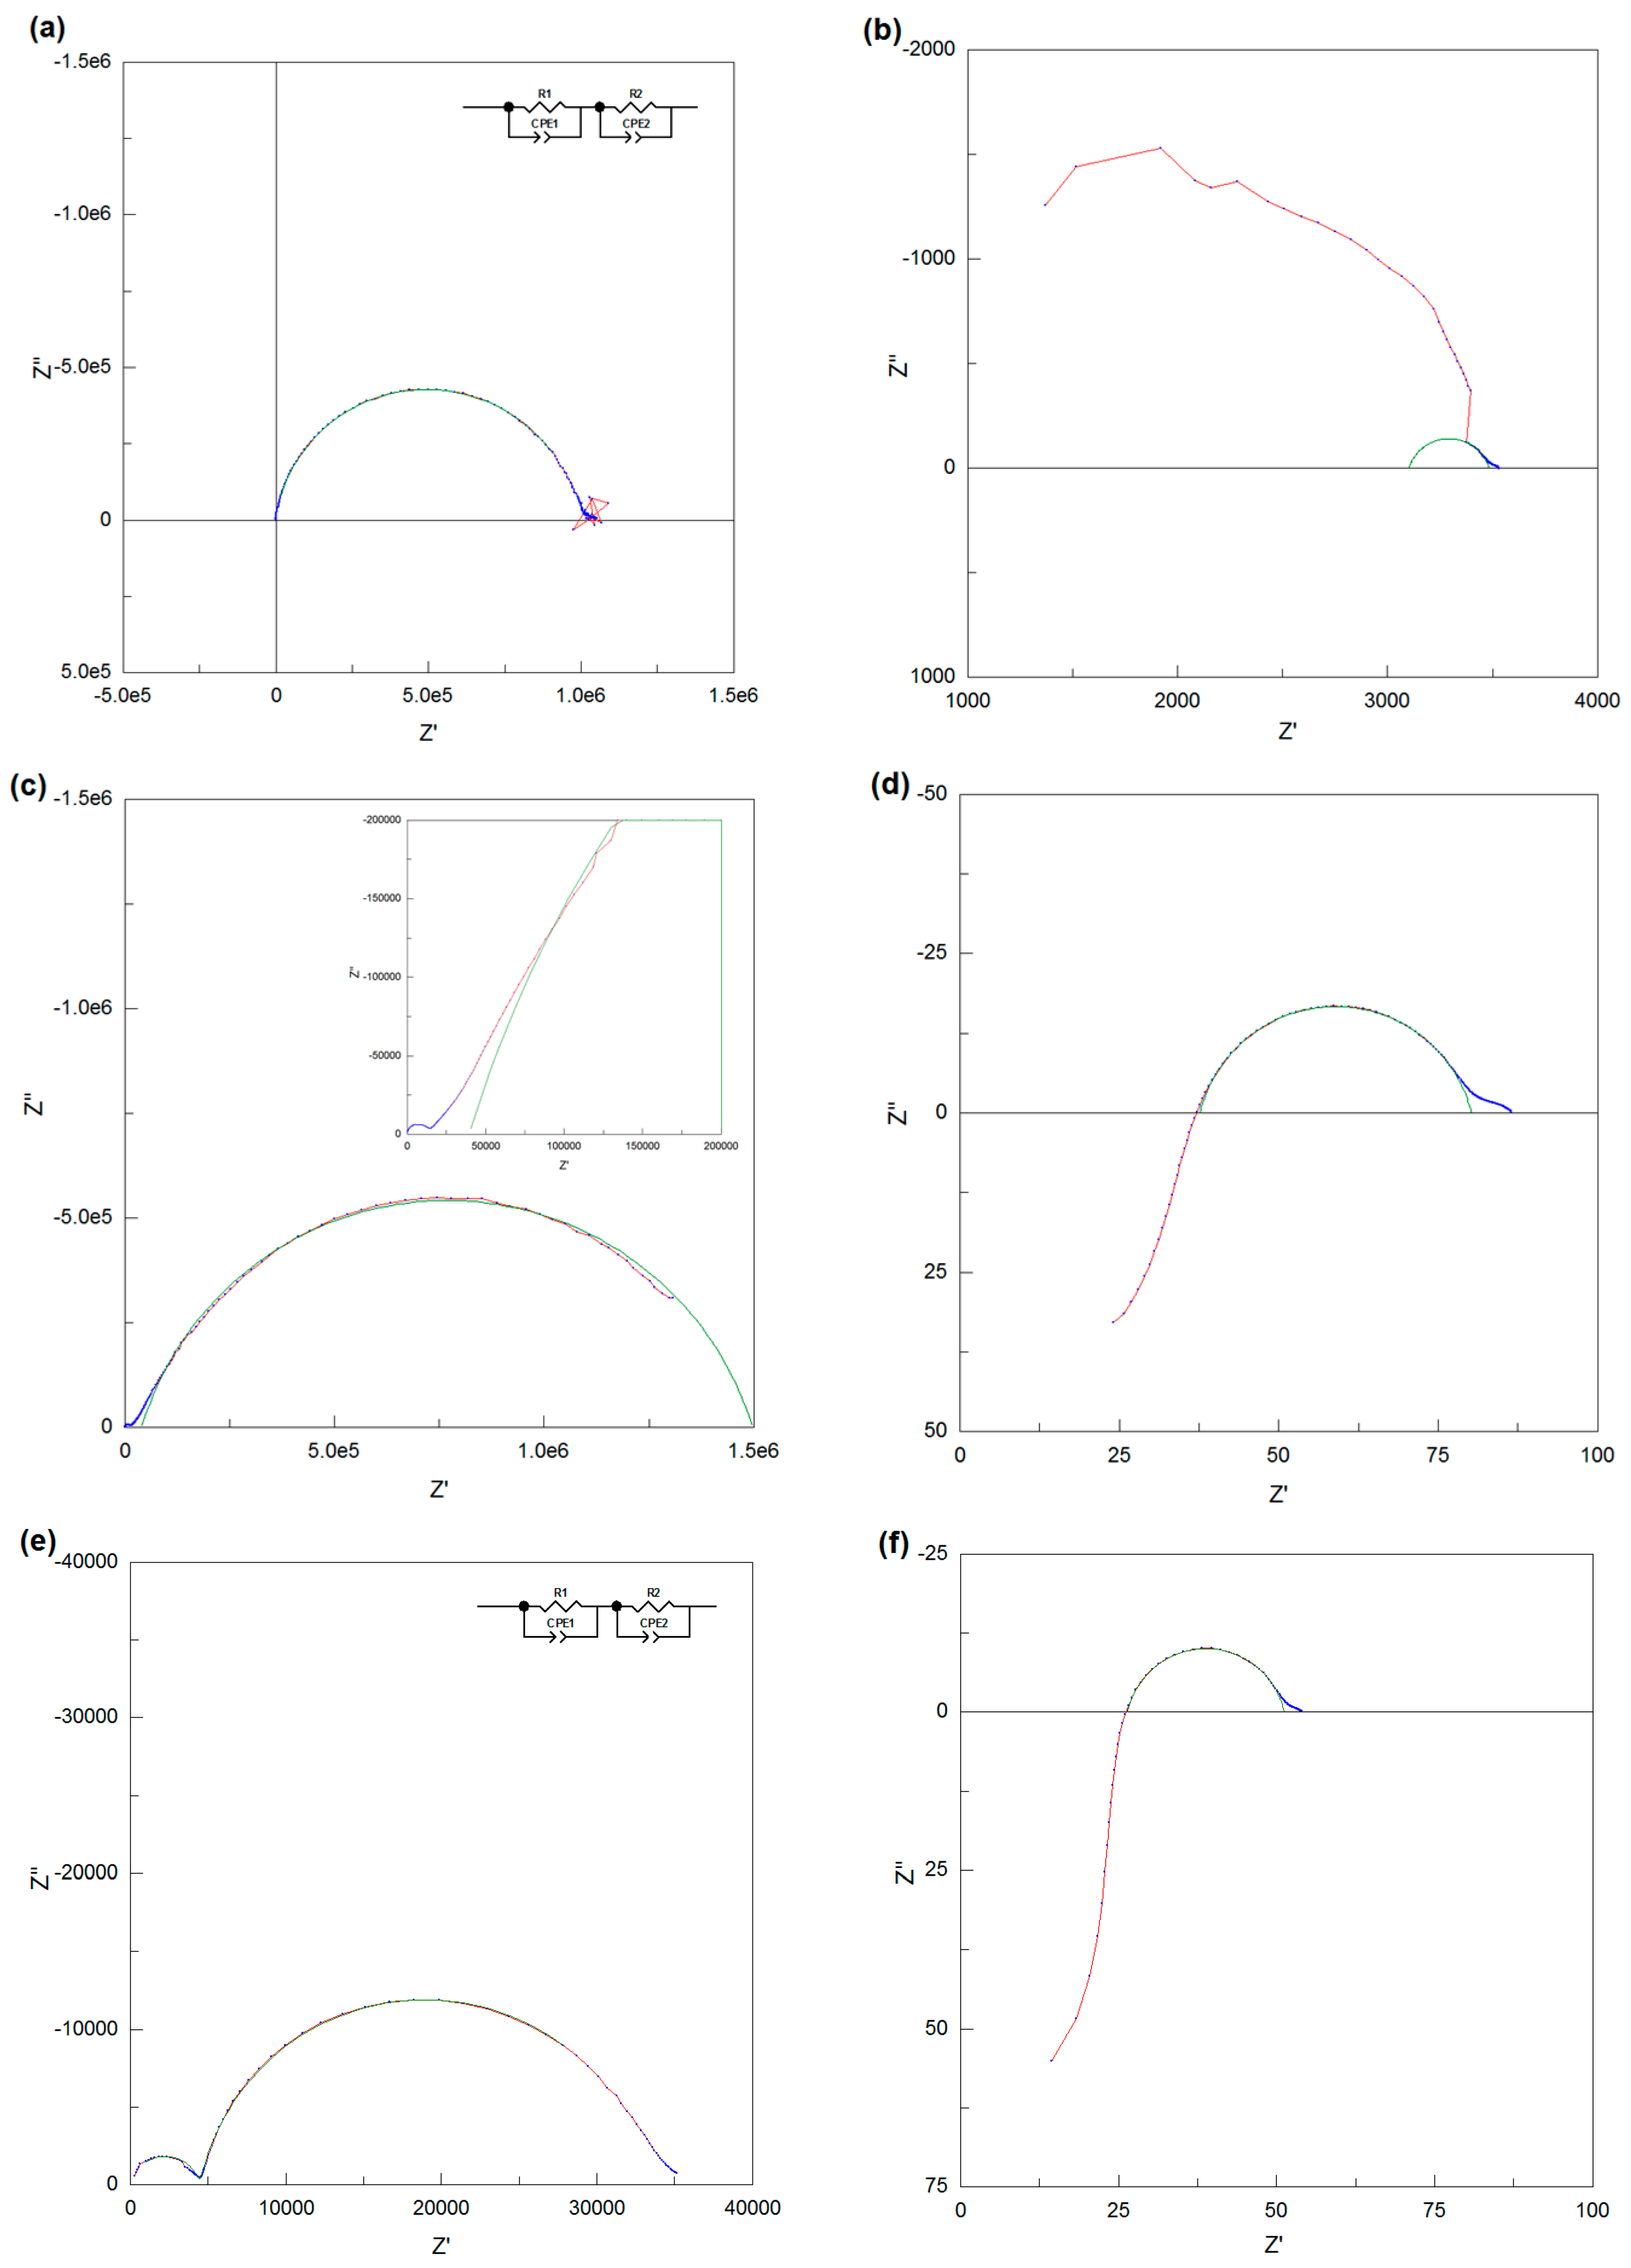
The electrical conductivities of NdBaInO4 were measured in dry air and the Nyquist plots of its impedance data at low temperature (280 °C) and high temperature (720 °C) are shown in Figure 7a,b. The AC impedance data of NdBaInO4 at low temperature were perfectly fitted with two equivalent circuits, which are both composed of R-CPE elements. However, there is only one semicircle, which is observable in Figure 7a; this means the semicircle that corresponds to the bulk component overlaps with the semicircle that corresponds to the grain boundary component. Therefore, the total resistance of NdBaInO4 at 280 °C can be calculated as the sum of the resistance of the bulk and grain boundary or can be obtained from the right intercept of the semicircle and the resulting value is 9.9 × 10⁵ Ω. However, the resistance of the rig (about 4 Ω) also exists in the system, so it is necessary to remove the contribution of the rig resistance to obtain the actual resistance of the sample. It is so small when compared with the total resistance at low temperature, but it has a significant contribution to the total resistance when the temperature goes higher.
At high temperature, the bulk response is absent due to the instrumental detection limit, so it is difficult to fit the whole impedance data. For the high frequency response, the shape of the semicircle is no longer observed; hence, only the low frequency response was fitted and the capacitance was estimated to be 4.4 × 10⁻¹⁰ F. In order to assign the corresponding semicircles to the different regions of the sample, it is multiplied by l/A = 0.149 cm−1 of the pellet, giving the result of 6.56 × 10⁻¹¹ F. Therefore, this low frequency response corresponds to the grain boundary component and the total resistance of the sample can be obtained from the right intercepts of the semicircle. The resulting resistance is 3480 Ω, after being reduced by 4 Ω of the rig resistance.
The electrical conductivities of Nd0.9Ca0.1BaInO3.95 and Nd0.8Ca0.2BaInO3.90 in the dry air were also measured and the Nyquist plots of their impedance data at low temperatures and high temperatures are shown in Figure 7c–f. As for Nd0.9Ca0.1BaInO3.95 at low temperature (270 °C), from Figure 7c and the enlarged view in it, it is obviously observed that there are three frequency responses and the grain boundary region, which corresponds to the middle frequency response, is significantly overlapped with the sample–electrode interface region. But, it is difficult to use the R-CPE elements to fit them; hence, only the sample–electrode interface region was fitted manually and the total resistance of the sample at low temperature can be estimated to be the left intercept of the sample–electrode interface semicircle on the Z′ axis, giving the result of 39,585 Ω. Compared with the impedance spectra at low temperature, it can be deduced that the semicircle in the middle of the high temperature impedance spectra corresponds to the sample–electrode interface component. As can be seen from the Figure 7d, a part of the sample–electrode interface semicircle is in the positive imaginary impedance area; as a consequence, the intersection of this semicircle and Z′ axis can be directly regarded as the total resistance of the pellet at high temperature. Then, after being reduced by 4 Ω of the rig resistance, the resulting value of Nd0.9Ca0.1BaInO3.95 was calculated to be 33.4 Ω for the dry atmosphere.
As for Nd0.8Ca0.2BaInO3.90 at low temperature (390 °C) in Figure 7e, it can be obviously seen that there are two complete semicircles, which correspond two frequency responses. After being multiplied by l/A = 0.196 cm−1, the capacitance of the low frequency response was estimated to be 3.45 × 10⁻⁹ F, which can be assigned to the grain boundary component. Then, these two semicircles were perfectly fitted with two equivalent circuits, which are both composed of R-CPE elements, and the corresponding resistances for the bulk and grain boundary were fitted to be 4469 Ω and 28,981 Ω, respectively. Therefore, the total electrical resistance of Nd0.8Ca0.2BaInO3.90 at low temperature was calculated to be 33,450 Ω. At high temperature (760 °C), the high frequency response is in the positive imaginary impedance area and the total resistance can be directly calculated to be the right intercept of the grain boundary semicircle (low frequency) on the Z′ axis, giving the result of 47.2 Ω. The same methodology was used to fit all of the data set.
The total resistance, which was determined via impedance spectroscopy data, can be transformed into the total conductivity using Equation (1):
where σ is the total conductivity (S m−1), l is the thickness of the pellet (m), A is the surface area of the pellet (cm2), and R is the total resistance (Ω).
The total conductivity is expressed by the Arrhenius equation [17] (Equation (2)):
where Ea is the activation energy (J mol−1), R is the gas constant (J K−1 mol−1), T is the temperature (K), and σ0 is a pre-exponential factor.
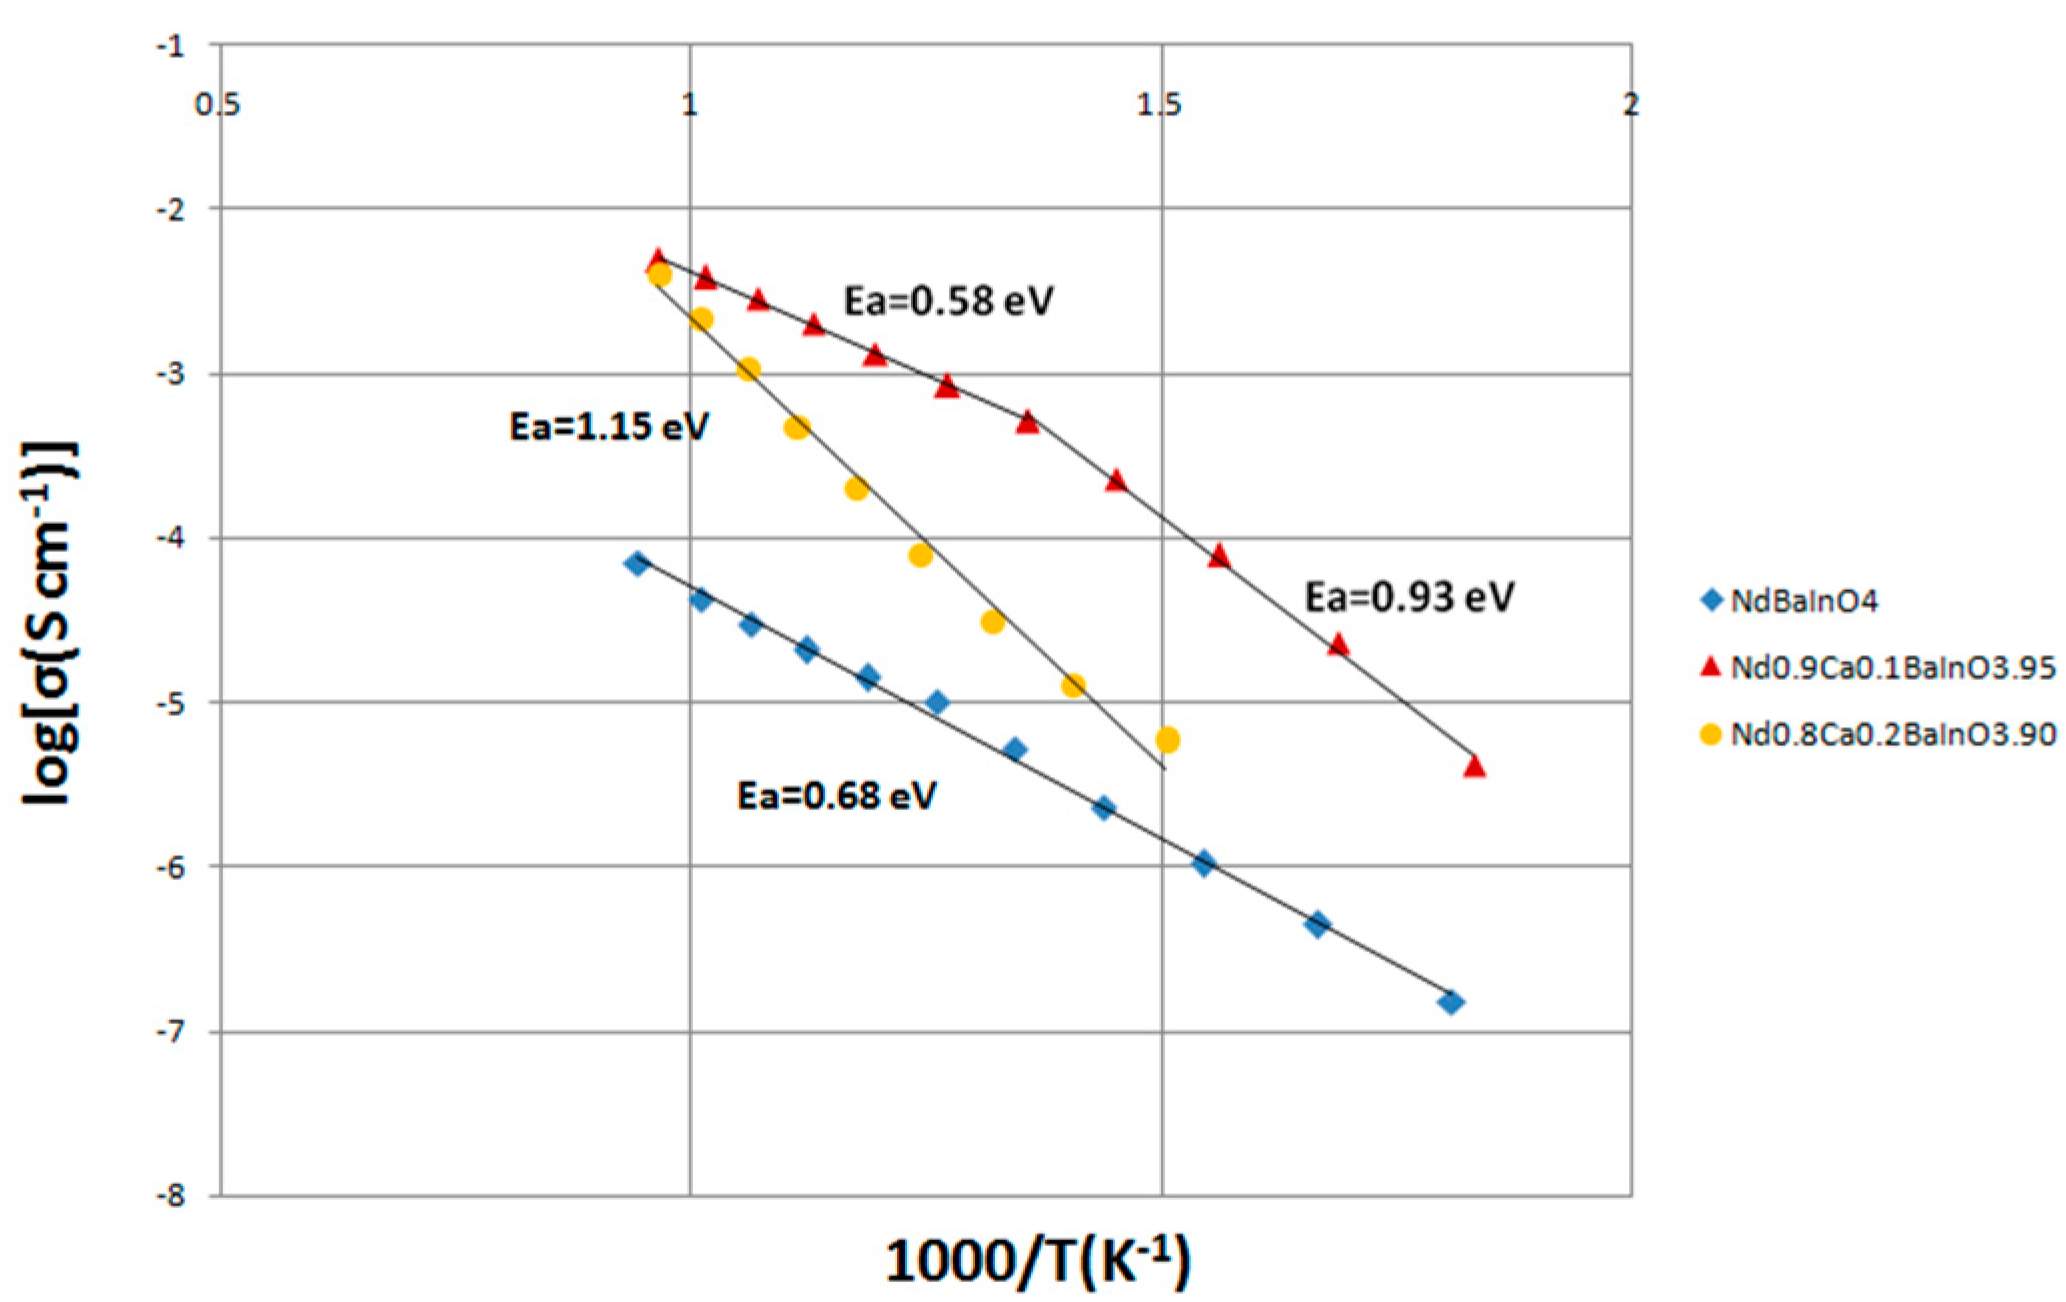
Therefore, the logarithm of conductivity against the reciprocal of temperature is commonly plotted to obtain a linear relationship. The results of NdBaInO4 and Ca-doped NdBaInO4, which were measured in dry air, are shown in Figure 8 and Table 3.
From the Arrhenius equation, it is obvious that low activation energy has the benefit of promoting total electrical conductivity. Therefore, it is important to determine the activation energy; in order to obtain its value, the Arrhenius equation can be rearranged to Equation (3) by taking the natural logarithm:
Then, a plot of the ln(σT) against the reciprocal of temperature gives a straight line and the activation energy (Ea) can be calculated from the gradient of the line by multiplying the gas constant R, which is 8.314 J K−1 mol−1, giving the results of 0.68 eV for NdBaInO4. It can be seen from Figure 8 that the total electrical conductivity of NdBaInO4 at 760 °C in the dry atmosphere is about 6.36 × 10⁻⁵ S cm−1. In addition, the activation energy Ea of Nd0.9Ca0.1BaInO3.95 (0.93 eV) is relatively higher than that of NdBaInO4 (0.68 eV) when the temperature is below 464 °C. The possible explanation for this phenomenon is that at low temperatures the dopant aliovalent cations can be seen as the nucleation centres where oxygen vacancies and dopant cations bind together into defect clusters with low mobility. When the temperature is above 464 °C (737 K), those bound vacancies are dissolved and become mobile, which reduces the activation energy Ea to 0.58 eV, which is lower than that of NdBaInO4, indicating better mobility of the oxygen species in Nd0.9Ca0.1BaInO3.95. Moreover, after doping the NdBaInO4 with a 10% molar fraction of Ca2+, it can be seen from the Figure 8 that the total electrical conductivity of the sample at 760 °C has been significantly increased by two orders of magnitude (4.91 × 10⁻³ S cm−1) due to the generation of oxygen vacancies.
When the Ca dopant concentration was increased to a 20% molar fraction, the activation energy was raised to 1.15 eV, which is even bigger than that of the NdBaInO4, but the total electrical conductivity was improved to a certain extent when compared with the undoped material. Above all, Nd0.9Ca0.1BaInO3.95 exhibited the highest total electrical conductivity and the lowest activation energy among Nd1−xCaxBaInO4−x/2 (x = 0, 0.1 and 0.2).
3.8. The Effects of the Humidified Atmosphere on the Conductivity of NdBaInO4 and Nd0.9Ca0.1BaInO3.95
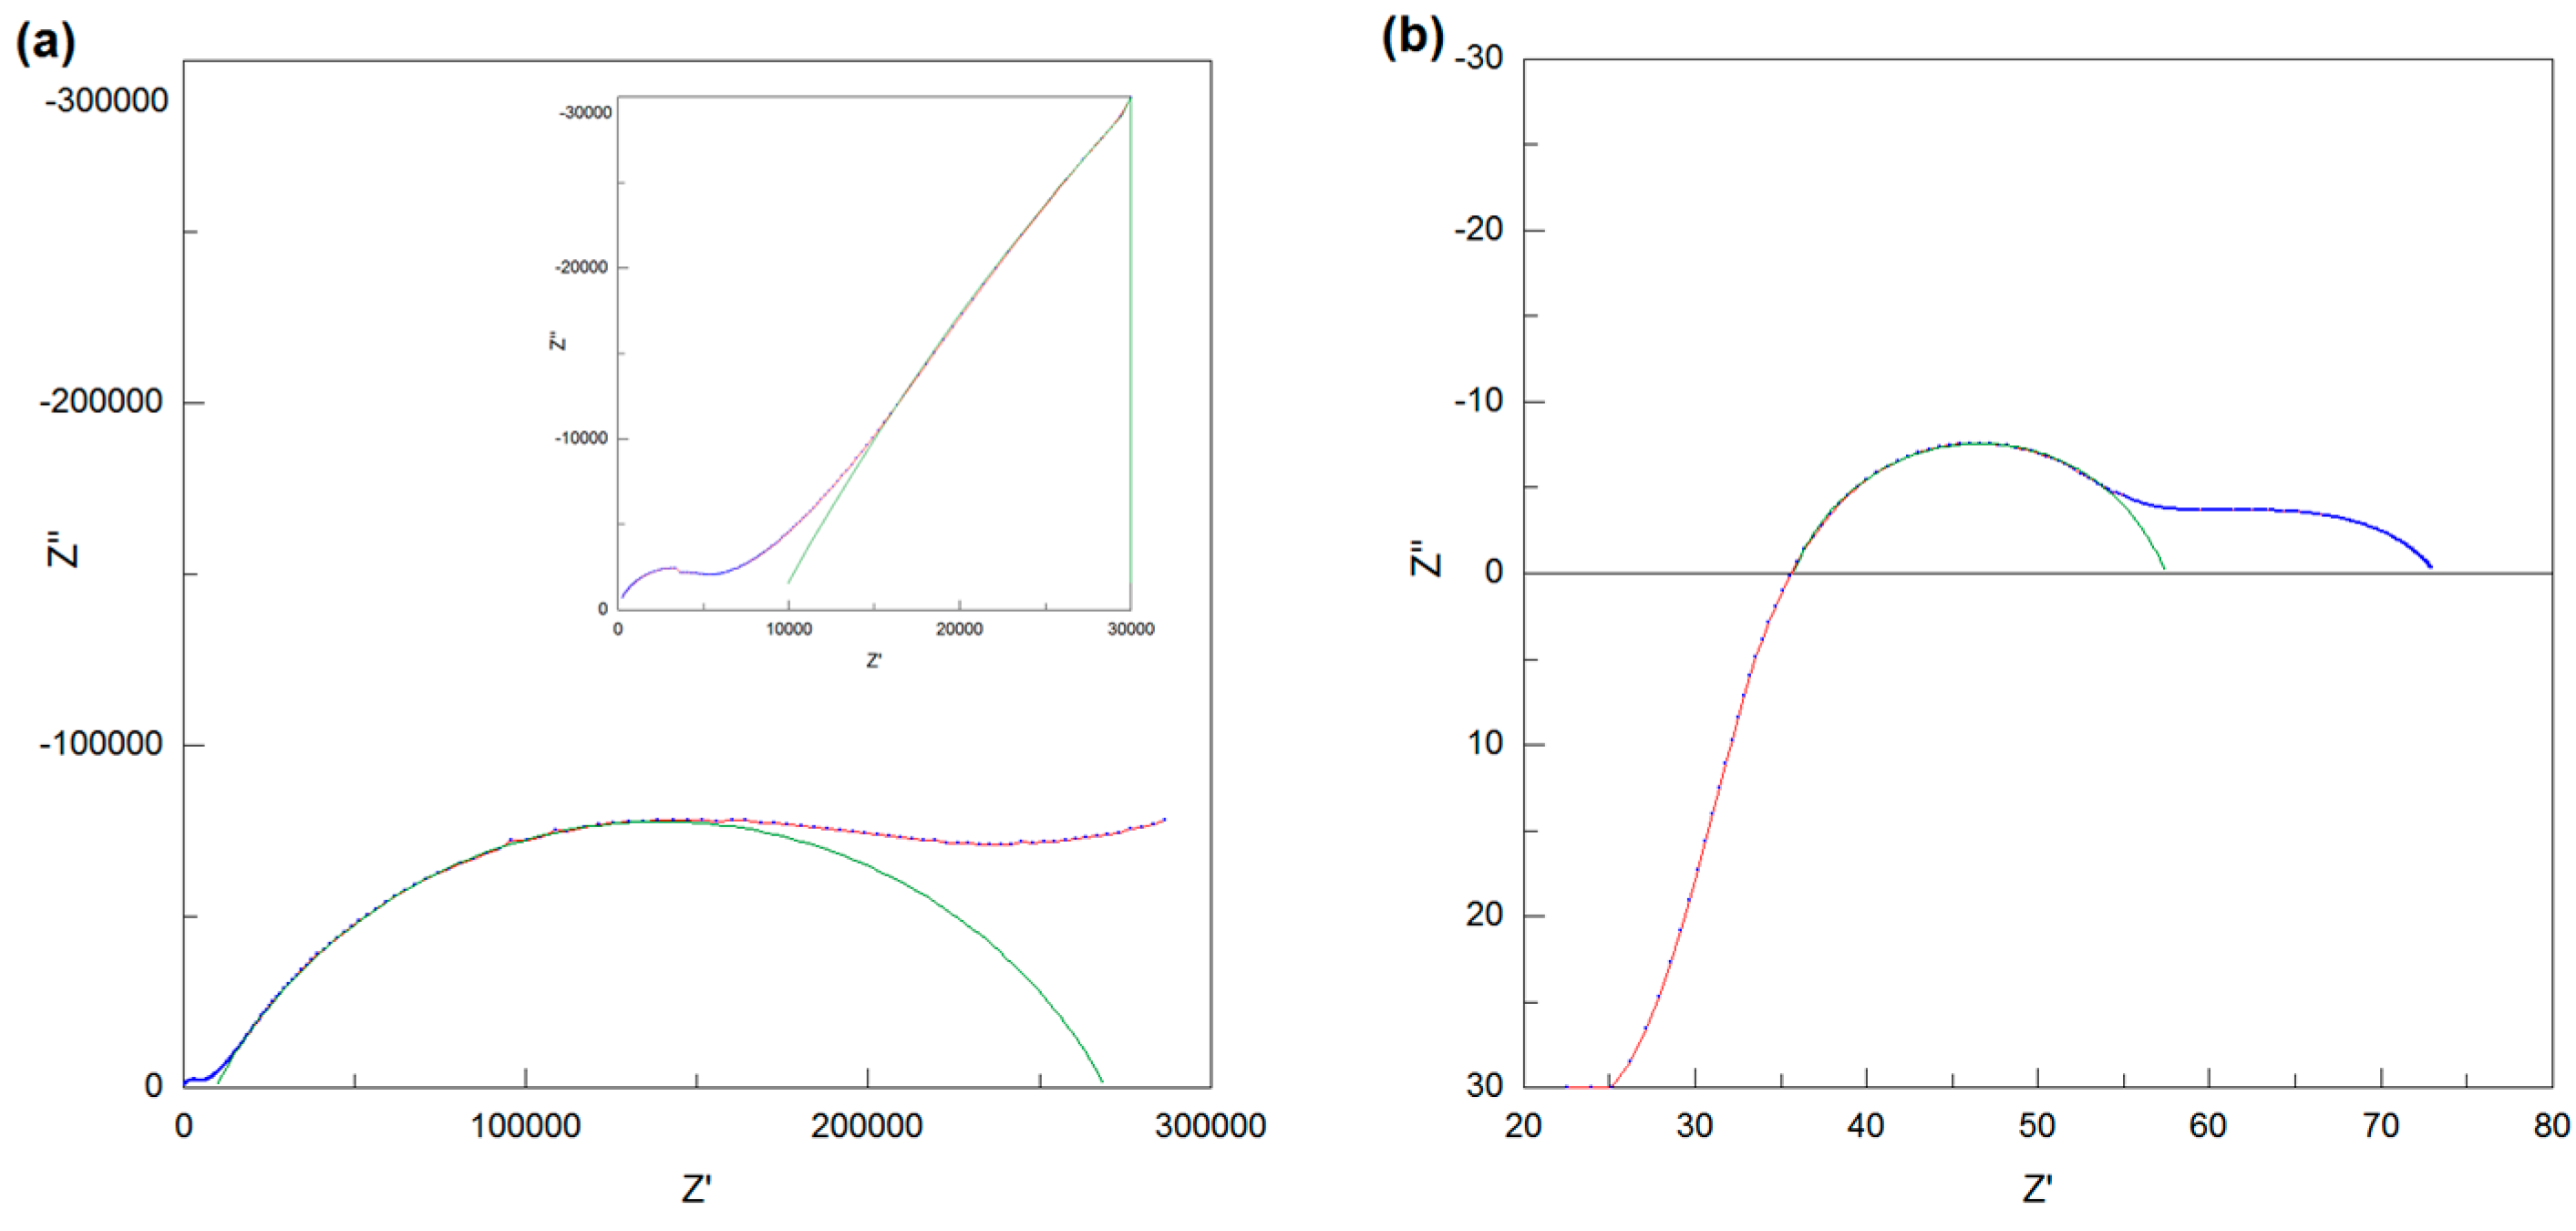
The electrical conductivity measurements were also conducted in the wet atmosphere for NdBaInO4 and Nd0.9Ca0.1BaInO3.95 pellets separately using AC impedance spectroscopy; the Nyquist plots of the impedance data for Nd0.9Ca0.1BaInO3.95 at low temperature (270 °C) and high temperature (760 °C) in the wet atmosphere are shown in Figure 9. As with the Nyquist plots of the dry atmosphere, the sample–electrode interface region was fitted manually and the total resistance of the sample at low temperature can be estimated to be the left intercept of the sample–electrode interface semicircle on the Z′ axis, giving the result of 9089.4 Ω. At high temperature, the intersection of the semicircle and Z′ axis can be directly regarded as the total resistance of the pellet. Then, after being reduced by 4 Ω of the rig resistance, the resulting value of Nd0.9Ca0.1BaInO3.95 was calculated to be 31.7 Ω for the wet atmosphere.
As before, the logarithm of the total conductivity against the inverse temperature of undoped and 10% Ca-doped material were also plotted to obtain linear relationships and the resulting graph is displayed in Figure 10. It can be observed that the total conductivity of Nd0.9Ca0.1BaInO3.95 measured in the wet atmosphere at moderate temperature is relatively higher than that in the dry atmosphere. On the contrary, the total conductivity of the undoped pellet that was performed in the dry atmosphere is lightly higher than that in the wet atmosphere. So, this slight deviation at low temperature requires further investigation. Therefore, the excess conductivity of Nd0.9Ca0.1BaInO3.95 in the wet atmosphere suggests that potential proton conduction may exist because oxygen vacancies generally make contributions to proton conduction. Moreover, the proton conductivity of the doped material reaches the maximum and the total conductivity tends to be uniform at a certain high temperature (800 °C), which might result from the depleted proton charge carrier at elevated temperatures. Similar behaviour has been observed in other proton-conducting systems such as BaCeZr3−d and Ca-doped LaNbO4 [18].
3.9. IEDP of Ca-Doped NdBaInO4
The diffusion profile was obtained via TOF-SIMS and one of the profiles for 20%-doped sample are shown in Figure 11. These experimental data were fitted appropriately using a MatLab R2013a script that utilized the least square fitting to obtain and D* parameters. The results of the diffusion coefficients and surface exchange coefficients are listed in Table 4 and the fitting error, which was introduced by the measurement, should be around 10% percent. The oxygen diffusion coefficients of Nd0.9Ca0.1BaInO3.95 (D* = 1.82 × 10⁻⁸ cm2/s, 850 °C) is about two times higher than that of Nd0.8Ca0.2BaInO3.90 (D* = 7.95 × 10⁻⁹ cm2/s, 850 °C). When compared with the oxygen diffusion coefficient of the undoped NdBaInO4 (D* = 8.25 × 10⁻¹¹ cm2/s, 850 °C), the diffusion coefficients of Nd0.9Ca0.1BaInO3.95 was increased significantly by two orders of magnitude. In addition, it is worth noting that Nd0.9Ca0.1BaInO3.95 shows the highest diffusion coefficient and D* decreases with the increase in the molar fraction of the Ca element, since when the doping concentration exceeds certain value the ordered-vacancy phase will be formed, which leads to a dramatic drop in conductivity. As the surface of both samples was coated with a thin layer of Pt, the surface of them cannot be characterized by the obtained surface exchange coefficient.
4. Conclusions
The synthesis method used in this work is the solid-state reaction and three-hour ball-milling has been determined to be the optimum choice for the next sintering stage. In addition, the temperature programme of heat treatment has been improved and modified in order to achieve higher densities. The sintering temperatures for NdBaInO4, Nd0.9Ca0.1BaInO3.95, and Nd0.8Ca0.2BaInO3.90 have been increased from 1400 °C to 1440 °C and 1430 °C and 1420 °C, respectively, and the sintering time has been reduced from 24 h to 20 h. By increasing sintering temperatures and reducing the time, the relative densities were improved dramatically from about 92% to more than 96%.
The results of X-ray diffraction analysis indicate that NdBaInO4 compounds with a single phase of monoclinic P21/c were successfully synthesized and it remains as this single-phase structure after doping 0.1 and 0.2 molar fractions of Ca2+ into the Nd site. Then, the lattice parameters were determined via Le Bail refinement of the XRD data. The results show that apart from c-axes, which are slightly increased, and β-angle, which is stable, other unit-cell parameters and the unit-cell volume drop significantly when the molar fraction of Ca-doping is raised to 0.2. Moreover, the stoichiometric ratios of these synthesized materials were further confirmed by energy dispersive spectrometry. The cationic ratio of Nd, Ba, and In is quite close to 1:1:1 for NdBaInO4 and the detected Ca concentration is quite reasonable for Ca-doped NdBaInO4.
The total electrical conductivity of NdBaInO4 at 760 °C in the dry atmosphere is about 6.36 × 10⁻⁵ S cm−1. However, after doping the NdBaInO4 with 0.1 molar fraction of Ca2+, the total electrical conductivity at 760 °C significantly increased by two orders of magnitude (4.91 × 10⁻³ S cm−1) and the activation energy reduced from 0.68 eV to 0.58 eV when the temperature was above 464 °C (737 K). Moreover, after doping 0.1 molar fraction of Ca2+, the activation energy was raised to 0.93 eV when the temperature was below 464 °C (737 K), which is possible due to the formation of the defect clusters with low mobility. Although the activation energy of Nd0.8Ca0.2BaInO3.90 (1.15 eV) is even larger than that of undoped material, the total conductivity was also improved. Above all, Nd0.9Ca0.1BaInO3.95 exhibited the highest total electrical conductivity and the lowest activation energy among Nd1−xCaxBaInO4−x/2 (x = 0, 0.1 and 0.2).
In addition, the total conductivity of Nd0.9Ca0.1BaInO3.95 in the wet atmosphere at moderate temperature is relatively higher than that in the dry atmosphere. Therefore, the excess conductivity suggests that potential proton conduction may exist in wet atmospheres. In addition, the proton conductivity reaches the maximum and the total conductivity tends to be uniform at a certain high temperature.
The oxygen diffusion coefficient of Nd0.9Ca0.1BaInO3.95 (D* = 1.82 × 10⁻⁸ cm2/s, 850 °C) is about two times higher than that of Nd0.8Ca0.2BaInO3.90 (D* = 7.95 × 10⁻⁹ cm2/s, 850 °C) and was increased significantly by two orders of magnitude when compared with the oxygen diffusion coefficient of the undoped NdBaInO4 (D* = 8.25 × 10⁻¹¹ cm2/s, 850 °C).
Author Contributions
Software, M.C.; validation, M.C. and C.L.; formal analysis, M.C. and C.L.; investigation, J.W. and S.L.; data curation, W.K. and Z.B.; writing—original draft preparation, M.C.; writing—review and editing, C.L.; supervision, K.Z. and C.S. All authors have read and agreed to the published version of the manuscript.
Funding
This research received no external funding.
Data Availability Statement
The original contributions presented in the study are included in the article; further inquiries can be directed to the corresponding authors.
Acknowledgments
First of all, We would like to express our appreciation to Stephen J Skinner, for his helpful advice, scientific discussions, and patient guidance. His experience in the solid oxide fuel cell field is invaluable. Next, we would like to thank some research staff at the Imperial College, Richard Sweeney, Mahmoud G Ardakani, Florent Tonus, Zonghao Shen and Duke, for their wonderful collaboration and patient support which is important to our work.
Conflicts of Interest
Authors Manyu Chen, Kai Zhu, Jieyu Wang, Sida Liu, Weina Kong, Zifa Ban and Chao Shen were employed by the company Avic Composite Corporation Ltd. The remaining authors declare that the research was conducted in the absence of any commercial or financial relationships that could be construed as a potential conflict of interest.
References
- Goodenough, J.B.; Ruiz-Diaz, J.E.; Zhen, Y.S. Oxide-ion conduction in Ba2In2O5 and Ba3In2MO8 (M = Ce, Hf, or Zr). Solid State Ion. 1990, 44, 21–31. [Google Scholar] [CrossRef]
- Ishihara, T.; Matsuda, H.; Takita, Y. Doped LaGaO3 perovskite type oxide as a new oxide ionic conductor. J. Am. Chem. Soc. 1994, 116, 3801–3803. [Google Scholar] [CrossRef]
- Goodenough, J.B. Oxide-ion conductors by design. Nature 2000, 404, 821–823. [Google Scholar] [CrossRef]
- León-Reina, L.; Losilla, E.R.; Martínez-Lara, M.; Martín-Sedeño, M.C.; Bruque, S.; Núñez, P.; Sheptyakov, D.V.; Aranda, M.A.G. High oxide ion conductivity in Al-doped germanium oxyapatite. Chem. Mater. 2005, 17, 596–600. [Google Scholar] [CrossRef]
- Li, M.; Pietrowski, M.J.; De Souza, R.A.; Zhang, H.; Reaney, I.M.; Cook, S.N.; Kilner, J.A.; Sinclair, D.C. A family of oxide ion conductors based on the ferroelectric perovskite Na0.5Bi0.5TiO3. Nat. Mater. 2014, 13, 31–35. [Google Scholar] [CrossRef] [PubMed]
- Kim, J.; Sengodan, S.; Kim, S.; Kwon, O.; Bud, Y.; Kim, G. Proton conducting oxides: A review of materials and applications for renewable energy conversion and storage. Renew. Sustain. Energy Rev. 2019, 109, 606–618. [Google Scholar] [CrossRef]
- Zhang, W.; Fujii, K.; Niwa, E.; Hagihala, M.; Kamiyama, T.; Yashima, M. Oxide-ion conduction in the Dion−Jacobson phase CsBi2Ti2NbO10-δ. Nat. Commun. 2020, 11, 1224. [Google Scholar] [CrossRef]
- Zvonareva, I.; Fu, X.-Z.; Medvedev, D.; Shao, Z. Electrochemistry and energy conversion features of protonic ceramic cells with mixed ionic-electronic electrolytes. Energy Environ. Sci. 2021, 15, 439–465. [Google Scholar] [CrossRef]
- Gao, Y.; Zhang, M.; Fu, M.; Hu, W.; Tong, H.; Tao, Z. A comprehensive review of recent progresses in cathode materials for Proton-conducting SOFCs. Energy Rev. 2023, 2, 100038. [Google Scholar] [CrossRef]
- Yuki, N. Proton-Conducting Polymers: Key to Next-Generation Fuel Cells, Electrolyzers, Batteries, Actuators, and Sensors. ChemElectroChem 2024, 2024, e202300846. [Google Scholar]
- Fujii, K.; Esaki, Y.; Omoto, K.; Yashima, M.; Hoshikawa, A.; Ishigaki, T.; Hester, J.R. New Perovskite-Related Structure Family of Oxide-Ion Conducting Materials NdBaInO4. Chem. Mater. 2014, 26, 2488–2491. [Google Scholar] [CrossRef]
- Fujii, K.; Shiraiwa, M.; Esaki, Y.; Yashima, M.; Kim, S.J.; Lee, S. Improved oxide-ion conductivity of NdBaInO4 by Sr doping. J. Mater. Chem. A 2015, 3, 11985–11990. [Google Scholar] [CrossRef]
- Ishihara, T.; Yan, Y.; Sakai, T.; Ida, S. Oxide ion conductivity in doped NdBaInO4. Solid State Ion. 2016, 288, 262–265. [Google Scholar] [CrossRef]
- Souza, D.; Chater, R. Oxygen exchange and diffusion measurements: The importance of extracting the correct initial and boundary conditions. Solid State Ion. 2005, 176, 1915–1920. [Google Scholar]
- Kilner; Steele, B.; Ilkov, L. Oxygen self-diffusion studies using negative-ion secondary ion mass spectrometry (SIMS). Solid State Ion. 1984, 12, 89–97. [Google Scholar] [CrossRef]
- Shannon, R.T. Revised effective ionic radii and systematic studies of interatomic distances in halides and chalcogenides. Acta Crystallogr. Sect. A Cryst. Phys. Diffr. Theor. Gen. Crystallogr. 1976, 32, 751–767. [Google Scholar] [CrossRef]
- Logan, S.R. The origin and status of the Arrhenius equation. J. Chem. Educ. 1982, 59, 279. [Google Scholar] [CrossRef]
- Haugsrud, R.; Norby, T. Proton conduction in rare-earth ortho-niobates and ortho-tantalates. Nat. Mater. 2006, 5, 193–196. [Google Scholar] [CrossRef]
Figure 1.
SEM micrographs of mixed powder (Nd2O3, BaCO3 and In2O3), which were ball-milled for (a) 1 h; (b) 2 h; (c) 3 h; (d) 4 h; (e) 5 h; and (f) 6 h.
Figure 1.
SEM micrographs of mixed powder (Nd2O3, BaCO3 and In2O3), which were ball-milled for (a) 1 h; (b) 2 h; (c) 3 h; (d) 4 h; (e) 5 h; and (f) 6 h.

Figure 2.
Le Bail refinement for the X-ray diffraction pattern collected at room temperature of (a) NaBaInO4; (b) Nd0.9Ca0.1BaInO3.95; and (c) Nd0.8Ca0.2BaInO3.90. The experimental data are in black dots, the refined pattern is the red solid line, and the difference between the experimental and calculated data is the blue solid line.

Figure 3.
Fractional changes in lattice parameters (a-, b-, and c-axes; β-angle; and unit-cell volume V) of 10 mol% and 20 mol% Ca-doped NdBaInO4 compared with undoped NdBaInO4.
Figure 3.
Fractional changes in lattice parameters (a-, b-, and c-axes; β-angle; and unit-cell volume V) of 10 mol% and 20 mol% Ca-doped NdBaInO4 compared with undoped NdBaInO4.

Figure 4.
Secondary electron images of the polished surface of a NaBaInO4 pellet with 93% density: (a) 500 magnification; (b) 2500 magnification.
Figure 4.
Secondary electron images of the polished surface of a NaBaInO4 pellet with 93% density: (a) 500 magnification; (b) 2500 magnification.

Figure 5.
Secondary electron images of the polished surface of a Nd0.9Ca0.1BaInO3.95 pellet with 96.6% relative density with (a) 500 magnification and (b) 2500 magnification and a Nd0.8Ca0.2BaInO3.90 pellet with 97.3% relative density with (c) 500 magnification and (d) 2000 magnification.
Figure 5.
Secondary electron images of the polished surface of a Nd0.9Ca0.1BaInO3.95 pellet with 96.6% relative density with (a) 500 magnification and (b) 2500 magnification and a Nd0.8Ca0.2BaInO3.90 pellet with 97.3% relative density with (c) 500 magnification and (d) 2000 magnification.

Figure 6.
Energy dispersive spectra detected from a polished surface of (a) NaBaInO4; (b) Nd0.9Ca0.1BaInO3.95; and (c) Nd0.8Ca0.2BaInO3.90.
Figure 6.
Energy dispersive spectra detected from a polished surface of (a) NaBaInO4; (b) Nd0.9Ca0.1BaInO3.95; and (c) Nd0.8Ca0.2BaInO3.90.

Figure 7.
Impedance spectra measured in the dry air at (a) 280 °C and (b) 720 °C for NdBaInO4; (c) 270 °C and (d) 760 °C for Nd0.9Ca0.1BaInO3.95; and (e) 390 °C and (f) 760 °C for Nd0.8Ca0.2BaInO3.90. The experimental data are in red solid lines with blue dots; the fitting curves are in green solid lines. The equivalent circuits used in (a,e) to model each physical feature are inserted in the spectra.

Figure 8.
The Arrhenius plot of the total conductivity of NdBaInO4 and Ca-doped NdBaInO4 measured in dry air.
Figure 8.
The Arrhenius plot of the total conductivity of NdBaInO4 and Ca-doped NdBaInO4 measured in dry air.

Figure 9.
Impedance spectra of Nd0.9Ca0.1BaInO3.95 measured in the wet atmosphere at (a) low temperature (270 °C) and (b) high temperature (760 °C). The experimental data are in red solid lines with blue dots; the fitting curves are in green solid lines.
Figure 9.
Impedance spectra of Nd0.9Ca0.1BaInO3.95 measured in the wet atmosphere at (a) low temperature (270 °C) and (b) high temperature (760 °C). The experimental data are in red solid lines with blue dots; the fitting curves are in green solid lines.

Figure 10.
The Arrhenius plot of the total conductivities of NdBaInO4 and Nd0.9Ca0.1BaInO3.95 measured in the dry atmosphere and wet atmosphere.
Figure 10.
The Arrhenius plot of the total conductivities of NdBaInO4 and Nd0.9Ca0.1BaInO3.95 measured in the dry atmosphere and wet atmosphere.

Figure 11.
The fitting of the 18O line scanning diffusion profile for Nd0.8Ca0.2BaInO3.90. Experimental data are in blue dots and the fitting result is the red solid line.
Figure 11.
The fitting of the 18O line scanning diffusion profile for Nd0.8Ca0.2BaInO3.90. Experimental data are in blue dots and the fitting result is the red solid line.


Table 1.
Crystallographic data of NdBaInO4 compared with data in the literature, and crystallographic data of Nd0.9Ca0.1BaInO3.95 and Nd0.8Ca0.2BaInO3.90 compared with data of NdBaInO4 resulting from experiment.
Table 1.
Crystallographic data of NdBaInO4 compared with data in the literature, and crystallographic data of Nd0.9Ca0.1BaInO3.95 and Nd0.8Ca0.2BaInO3.90 compared with data of NdBaInO4 resulting from experiment.
| Chemical Formula | NdBaInO4 Ref [11] | NdBaInO4 Exp. | Nd0.9Ca0.1BaInO3.95 | Nd0.8Ca0.2BaInO3.90 |
|---|---|---|---|---|
| Formula weight | 460.39 | 460.39 | 449.17 | 437.96 |
| Crystal system | Monoclinic | Monoclinic | Monoclinic | Monoclinic |
| Space group | P21/c | P21/c | P21/c | P21/c |
| a/Å | 9.09538(3) | 9.1079(16) | 9.0926(10) | 9.0822(17) |
| b/Å | 6.04934(2) | 6.0522(11) | 6.0322(9) | 6.0195(12) |
| c/Å | 8.25620(2) | 8.2815(14) | 8.2636(10) | 8.2613(14) |
| β/° | 103.4041(3) | 103.486(13) | 103.392 (9) | 103.337(19) |
| Unit-cell volume/Å3 | 441.89(2) | 443.92(14) | 440.92(10) | 439.47(15) |
| Calculated density/Mg m−3 | 6.92 | 6.78 | 6.63 | |
| Measured density/Mg m−3 | 6.68 | 6.55 | 6.45 | |
| Relative density | 96.53% | 96.61% | 97.29% |
Table 2.
The atomic ratio of NaBaInO4 and Ca-doped NaBaInO4 compounds, which were detected via energy dispersive spectrometry (EDS).
Table 2.
The atomic ratio of NaBaInO4 and Ca-doped NaBaInO4 compounds, which were detected via energy dispersive spectrometry (EDS).
| NaBaInO4 | Nd0.9Ca0.1BaInO3.95 | Nd0.8Ca0.2BaInO3.90 | |
|---|---|---|---|
| Elements | |||
| In, atom% | 14.21 | 15.81 | 14.68 |
| Ba, atom% | 12.53 | 16.28 | 15.34 |
| Nd, atom% | 15.20 | 14.93 | 12.91 |
| Ca, atom% | 1.54 | 2.29 |
Table 3.
Electrical conductivity of NdBaInO4 and Ca-doped NdBaInO4 in dry air.
| NdBaInO4 | Nd0.9Ca0.1BaInO3.95 | Nd0.8Ca0.2BaInO3.90 | |
|---|---|---|---|
| R at low temperature (Ω) | 9.9 × 10⁵ (at 280 °C) | 39,585 (at 270 °C) | 33,450 (at 390 °C) |
| R at high temperature (Ω) | 3480 (at 720 °C) | 33.4 (at 760 °C) | 47.2 (at 760 °C) |
| σ (S cm−1) | 6.36 × 10⁻⁵ (at 760 °C) | 4.91 × 10⁻³ (at 760 °C) | 4.14 × 10⁻³ (at 760 °C) |
| Ea (eV) | 0.68 | 0.93 (below 464 °C) 0.58 (above 464 °C) | 1.15 |
Table 4.
Calculated oxygen diffusion coefficients and surface exchange coefficients of the samples doped with 10% and 20% molar fraction of Ca2+.
Table 4.
Calculated oxygen diffusion coefficients and surface exchange coefficients of the samples doped with 10% and 20% molar fraction of Ca2+.
| Nd0.9Ca0.1BaInO3.95 | Nd0.8Ca0.2BaInO3.90 | |
|---|---|---|
| D* (cm2/s) | 1.82 × 10⁻⁸ | 9.30 × 10⁻⁹ |
| 1.80 × 10⁻⁸ | 6.60 × 10⁻⁹ | |
| Average D* (cm2/s) | 1.81 × 10⁻⁸ | 7.95 × 10⁻⁹ |
| cm.s−1 | 6.60 × 10⁻⁷ | 7.00 × 10⁻⁷ |
Disclaimer/Publisher’s Note: The statements, opinions and data contained in all publications are solely those of the individual author(s) and contributor(s) and not of MDPI and/or the editor(s). MDPI and/or the editor(s) disclaim responsibility for any injury to people or property resulting from any ideas, methods, instructions or products referred to in the content. |
© 2024 by the authors. Licensee MDPI, Basel, Switzerland. This article is an open access article distributed under the terms and conditions of the Creative Commons Attribution (CC BY) license (https://creativecommons.org/licenses/by/4.0/).
Share and Cite
MDPI and ACS Style
Chen, M.; Li, C.; Zhu, K.; Wang, J.; Liu, S.; Kong, W.; Ban, Z.; Shen, C. Optimising Ion Conductivity in NdBaInO4-Based Phases. Energies 2024, 17, 2029. https://0-doi-org.brum.beds.ac.uk/10.3390/en17092029
AMA Style
Chen M, Li C, Zhu K, Wang J, Liu S, Kong W, Ban Z, Shen C. Optimising Ion Conductivity in NdBaInO4-Based Phases. Energies. 2024; 17(9):2029. https://0-doi-org.brum.beds.ac.uk/10.3390/en17092029
Chicago/Turabian StyleChen, Manyu, Cheng Li, Kai Zhu, Jieyu Wang, Sida Liu, Weina Kong, Zifa Ban, and Chao Shen. 2024. "Optimising Ion Conductivity in NdBaInO4-Based Phases" Energies 17, no. 9: 2029. https://0-doi-org.brum.beds.ac.uk/10.3390/en17092029
Note that from the first issue of 2016, this journal uses article numbers instead of page numbers. See further details here.