Article

Analysis of Deterioration Characteristics of Service-Aged XLPE Cables According to Installation Location of Combined Heat and Power Plant

Department of Electronic Engineering, Hanyang University ERICA, Ansan-si 15588, Republic of Korea
*
Author to whom correspondence should be addressed.
Submission received: 13 March 2024 / Revised: 19 April 2024 / Accepted: 23 April 2024 / Published: 25 April 2024
(This article belongs to the Section F1: Electrical Power System)

Abstract

:
The number of XLPE cables being used near or beyond their design life is increasing. The importance of timely cable replacement is necessary. Therefore, research is actively being conducted using VLF Tan δ diagnostic technology to assess the insulation condition of cables. Present studies lack in measuring and analyzing the VLF Tan δ of service-aged XLPE cables. Additionally, there is a research gap considering the operating environment. Therefore, it is needed to diagnose and analyze the insulation condition of the same service-aged cable when it is operated in a different environment. This paper assesses and analyzes the insulation condition of cables installed in the BFP, cooling tower, and deaerator booster pump of a combined heat and power plant. Each cable was evaluated by measuring the VLF Tan δ, the dielectric breakdown test of the cable, and the tensile strength, elongation at break, crystallinity, and dielectric strength of the XLPE specimens. Additionally, the correlation between the VLF Tan δ and other characteristics was also analyzed. It was found that degradation progressed in the order of the BFP, the cooling tower, and the deaerator booster pump. Therefore, it was confirmed that even for the same cable, deterioration varies depending on the installation location.

1. Introduction

XLPE cables have been widely used in power transmission and distribution systems for a long time due to their excellent electrical performance and high allowable temperature. Even superior cables suffer from degradation over long-term operation. This leads to the degradation of the physical, chemical, and electrical properties of XLPE, resulting in a decrease in insulation performance [1,2,3]. Once insulation performance deteriorates, it is difficult to restore it to its original state, and the probability of a dielectric breakdown accident increases. Therefore, a diagnostic system that accurately evaluates the insulation condition of XLPE cables, designed with a lifetime of more than 30 years, is crucial [4,5,6]. Replacing at the appropriate time using a diagnostic system can maintain the reliability of the power system.
Among the various techniques for evaluating the insulation condition of XLPE cables, the measurement of the loss angle Tan δ is one of the useful methods. However, it has been found that measuring the Tan δ at very low frequency (VLF) rather than at the commercial frequency (50 Hz or 60 Hz) offers superior insights into the insulation condition of the cable [7,8,9]. Therefore, VLF Tan δ diagnostic technology is defined in IEEE Std. 400 [10] as a useful nondestructive method for evaluating the insulation condition of cables. Through this, it has been established that the VLF Tan δ is the most commonly used diagnostic system for cables, with extensive research being conducted [11,12,13].
Previous studies using VLF Tan δ measurements have analyzed XLPE cables due to accelerated aging [14]. Field-aged XLPE cables were manufactured as slice samples and the VLF tan δ, chemical, and electrical properties were measured and analyzed [15,16]. Tan δ, differential scanning calorimetry (DSC), tensile tests, and AC breakdown voltage tests were performed on XLPE cables field-aged for 1 to 8 years [17]. Additional thermal aging was applied for approximately 20-year service-aged XLPE cables, and the dielectric behavior was investigated by measuring the Tan δ across a frequency range [18]. After operating under the same stress and similar load conditions for a long period of time, the VLF Tan δ and breakdown voltage of field-aged XLPE cables were measured, and their correlation was analyzed [19]. Previous research primarily focused on evaluating the insulation condition by measuring the VLF Tan δ and other deterioration factors through accelerated aging of cables or on XLPE specimens. In addition, the VLF tan δ was measured with cables under the same environmental or load conditions, even if the cables had been serviced for a long period of time. Therefore, there is a lack of research on the differences in insulation performance according to the environment in which XLPE cables are installed. In particular, studies on the evaluation of insulation conditions caused by the environment in which identical cables nearing their designed lifespan are installed have not been conducted. Therefore, in order to properly replace and maintain cables, research is needed to analyze the VLF Tan δ and other deterioration factors of XLPE depending on the installation environment.
In this paper, XLPE cables manufactured in 1991 and operated in a combined heat and power plant were studied for changes in their insulation condition depending on the installation location. The installation locations of the XLPE cables are the boiler feedwater pump (BFP), deaerator booster pump, and cooling tower. The VLF Tan δ of XLPE cables exposed to various environments was measured, and the differences in their insulation condition were evaluated. Subsequently, a dielectric breakdown test on the cables was performed. Specimens were prepared and their tensile strength, crystallinity, and breakdown voltage were measured and their results’ correlation with the VLF Tan δ was estimated. It is determined that for reliable insulation diagnosis, it is necessary to consider the operating environment for cables that have approached or exceeded their design life.

2. Cable and Specimen Preparation

An approximately 110 m long and 6.6 kV XLPE cable, manufactured by Taihan in 1991, that was commissioned for a power plant (that also provided boiler heating), was secured. The XLPE cable had been in service for about 31 years, and the installation locations were the BFP, the deaerator booster pump, and the cooling tower. Table 1 shows the sample names of the cables.
The combined heat and power plant is shown in Figure 1. The BFP is one of the important auxiliary devices because it supplies feedwater to the boiler [20]. Fundamentally, it transports hot water from the BFP to the boiler, creating steam that then powers the turbine. Consequently, it is exposed to environments of high temperature, high pressure, and steam. The deaerator booster pump ensures the quality of feedwater by removing oxygen and other noncondensable gases before supplying it to the boiler [21]. If the supplied feedwater contains oxygen or other gases, it can cause corrosion of the metals in the boiler and turbine. The cooling tower cools the steam used to rotate the steam turbines, condensing it back into water, and then recirculates it to the boiler. During the process of condensing high-temperature steam into water, a significant amount of water vapor is released, exposing the cooling tower to a continuous steam environment [22].
For all cables listed in Table 1, after measuring the VLF Tan δ and conducting dielectric breakdown evaluations of the XLPE cables, specimens were processed into ribbon-shaped tape samples from the XLPE insulation layer for the measurement of mechanical, chemical, and electrical evaluations, as illustrated in Figure 2. The size of the specimen is 100 mm × 100 mm, and the thickness is 80 ± 10 [μm].

3. Experiment Setup

3.1. VLF Tan δ Measurement

The VLF Tan δ measurement system consists of a measurement controller, a PD filter, a divider, a corona ball, and a 6 m long XLPE cable. A 0.1 Hz AC power source was used, and the applied voltage levels were selected as 0.5 U0, 1.0 U0, and 1.5 U0 based on IEEE Std. 400, where U0 is phase to ground. The laboratory temperature was maintained at room temperature, and the XLPE cable to be measured was also stored in the laboratory.
The selected voltages were applied to conduct VLF Tan δ measurements on the XLPE cable. After taking 10 measurements at 0.5 U0, the voltage was increased to 1.0 U0 and the same number of measurements were recorded. Subsequently, measurements were conducted using the same method at 1.5 U0. Upon completion of the measurements, the sample data obtained at each voltage level was averaged to derive mean values.

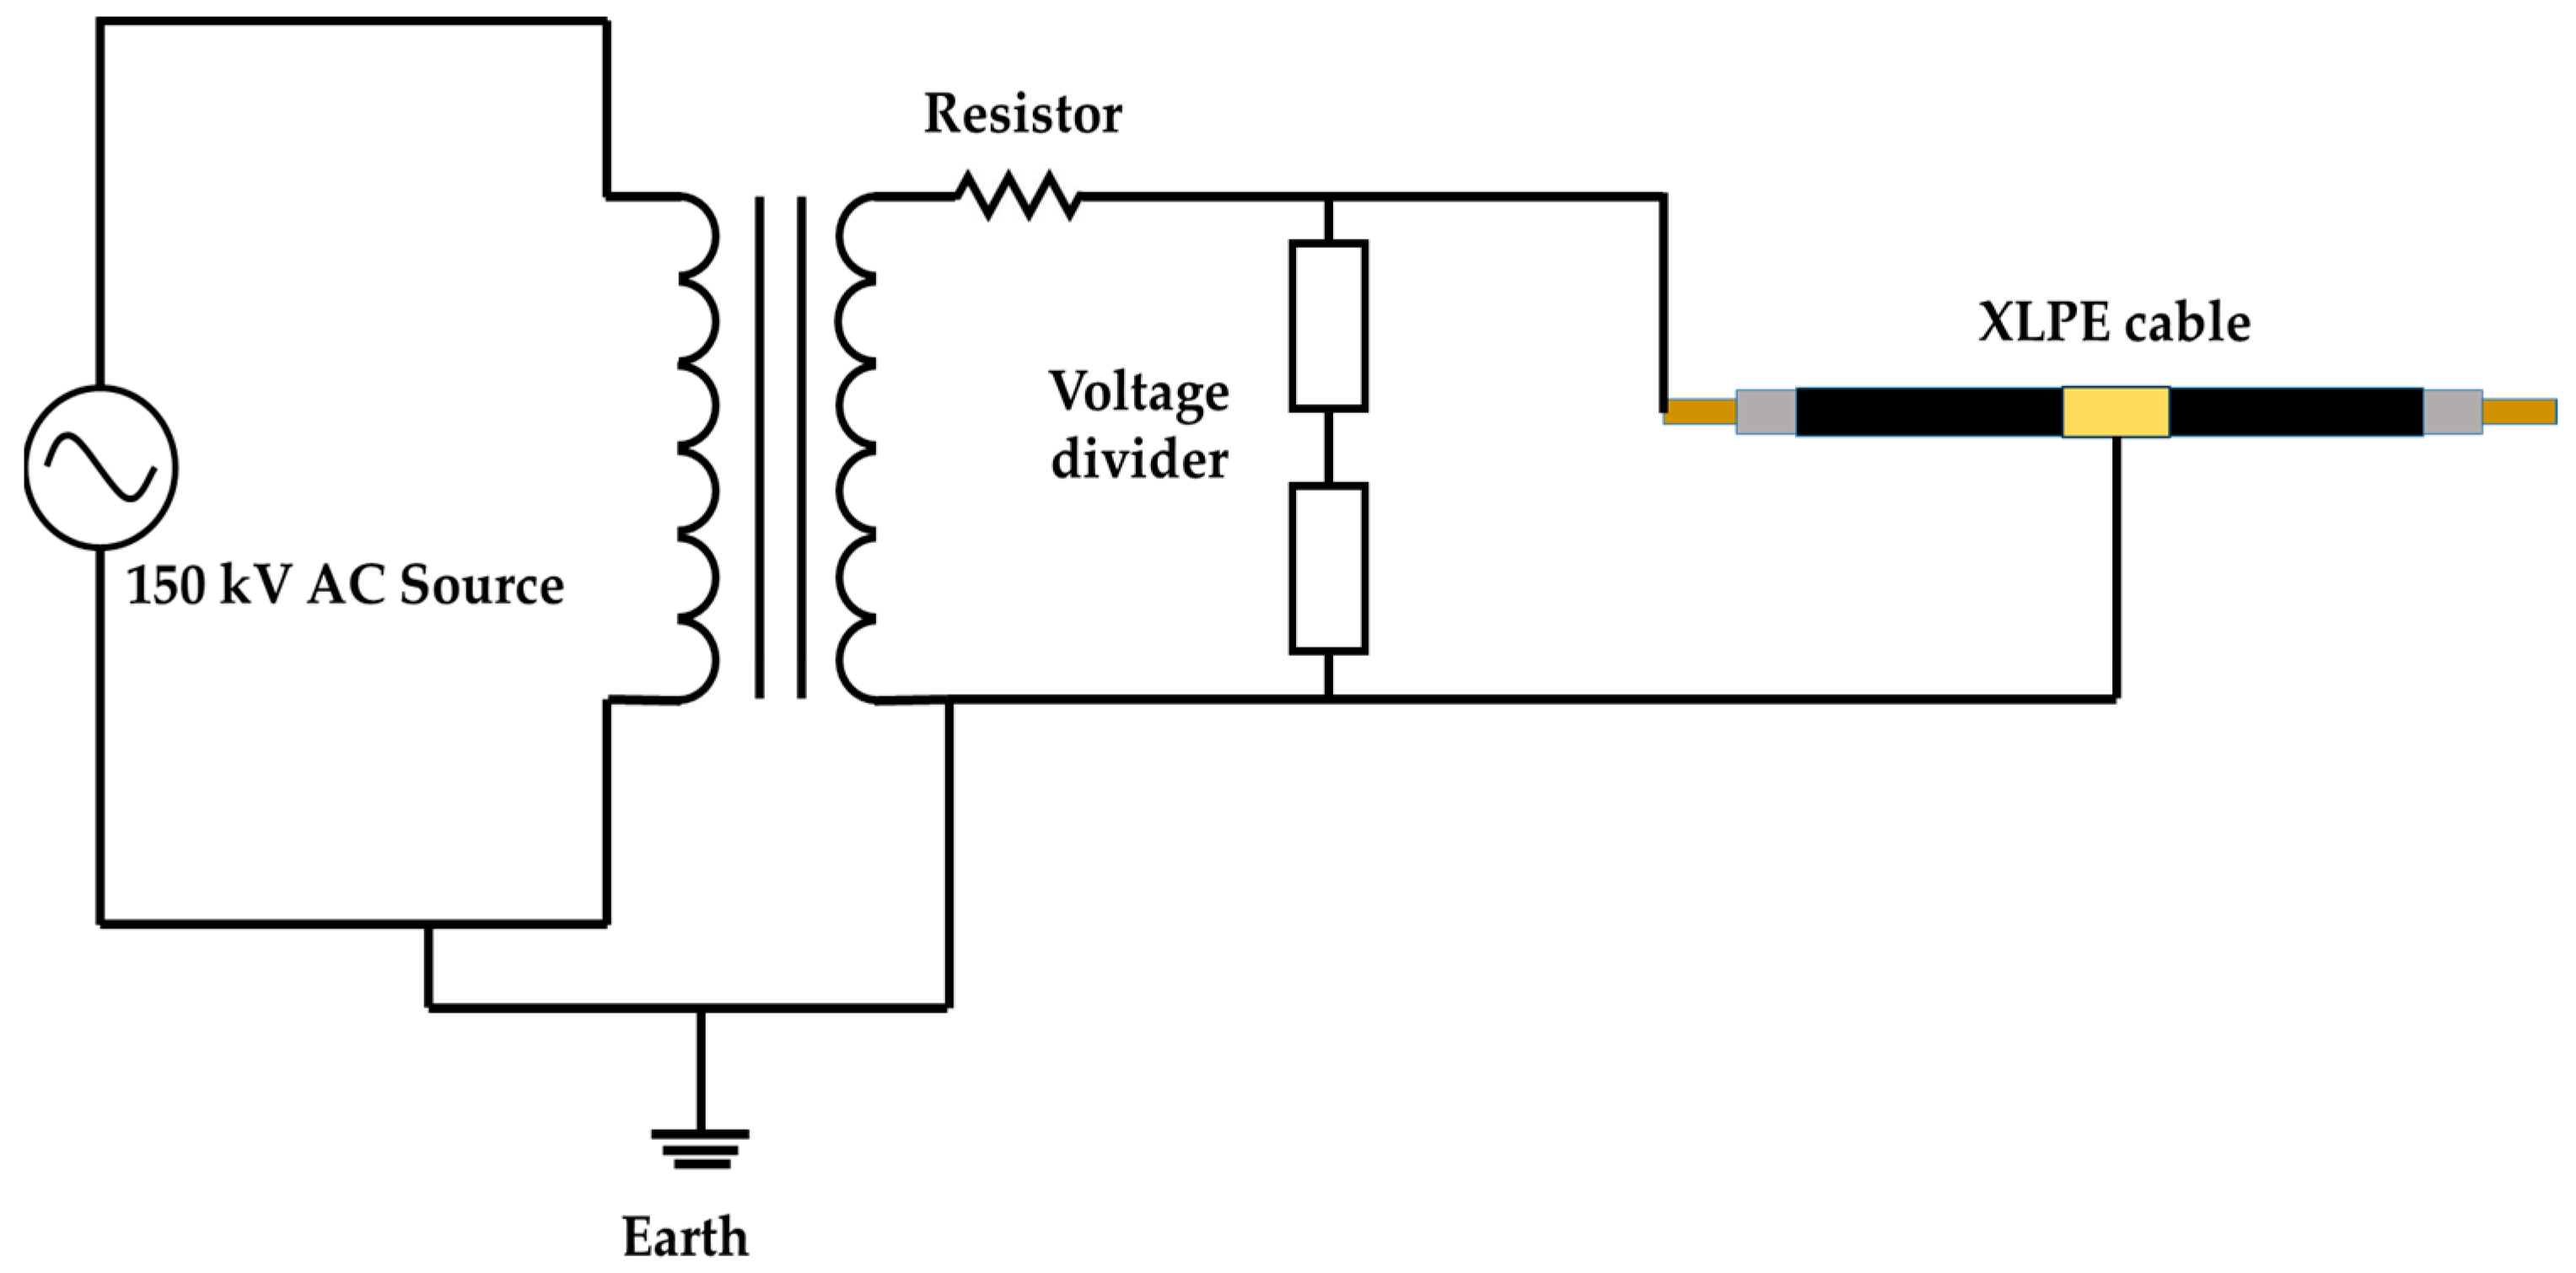
3.2. Dielectric Breakdown Test of the XLPE Cable

After the VLF Tan δ measurement was completed, a dielectric breakdown test of the XLPE cable was performed. The experimental setup consists of a 150 kV AC voltage source and a 6 m XLPE cable as shown in Figure 3. The voltage was increased from 0 V to 10 kV and then applied for 10 min. If dielectric breakdown did not occur, the voltage was raised to 10 kV and continued for 10 min. This process was repeated until dielectric breakdown occurred. It takes a lot of time to conduct a dielectric breakdown test for all cables starting from 0 V. Therefore, the test was conducted by applying voltage starting from 50% of the anticipated breakdown voltage. It was derived from the breakdown voltage of the cable measured starting from 0 V. After that, the voltage was gradually increased to 50% of the anticipated breakdown voltage and then applied for 10 min. The process was repeated by increasing the voltage by 10 kV and maintaining it for 10 min until dielectric breakdown occurred. When dielectric breakdown was measured, the location of the XLPE cable breakdown was confirmed as shown in Figure 4. If breakdown in the XLPE insulation was as depicted in Figure 4a, the cable was replaced with another XLPE cable. Cutting the section with breakdown and terminating the XLPE cable results in a shortened length, preventing further experimentation. However, in cases where it happened at the semiconductor layer–XLPE interface, as shown in Figure 4b, the cable was cut and terminations were made to facilitate additional experimentation.

3.3. Tensile Strength and Elongation at Break Measurement

Upon completion of the dielectric breakdown experiment on the XLPE cable, the cable was cut and processed into ribbon-shaped tape samples. According to IEC 60811-1 [23], the thickness of the specimens must be selected between 0.8 mm and 2.0 mm. Therefore, after verifying the thickness of the prepared specimens, dumbbell-shaped samples were fabricated as illustrated in Figure 5. Before measuring mechanical evaluations, it is necessary to measure the average thickness of the prepared dumbbell specimens to ensure reliable analysis results. The thickness at both ends and the center of the 4 mm wide section was measured, and the average of these measurements was defined as the thickness of the dumbbell specimen. Afterward, the tensile strength and elongation at break were measured using a tensile tester. The tests were conducted at room temperature with an elongation rate of 250 mm/min. The tensile strength and elongation at break were determined based on the average of three tests conducted using the same method.

3.4. XRD Measurements and Crystallinity Calculations

X-ray diffraction (XRD) is a technique used to analyze crystal structures. Measurements were conducted by irradiating X-rays onto the XLPE specimens to analyze the crystal structure based on the installation location of the XLPE cable. The specimen was manufactured with a size of 10 mm × 10 mm, and a D8 ADVANCE XRD was used. The X-rays were Cu-Ka, and the Bragg angle interval was scanned from 15° to 35° at a rate of 1°/min. Once the XRD assessment was completed, it was checked for whether there was a difference in peak angle depending on the installation location. Afterward, each area was calculated by estimating the normal distribution. The area was used to determine crystallinity using Equation (1)
χ ( % ) = a r e a 2 + a r e a 3 a r e a 1 + a r e a 2 + a r e a 3
where χ(%) is the crystallinity, Area 1 is amorphous area, Area 2 is the area of first peak, and Area 3 is the area of the second peak.

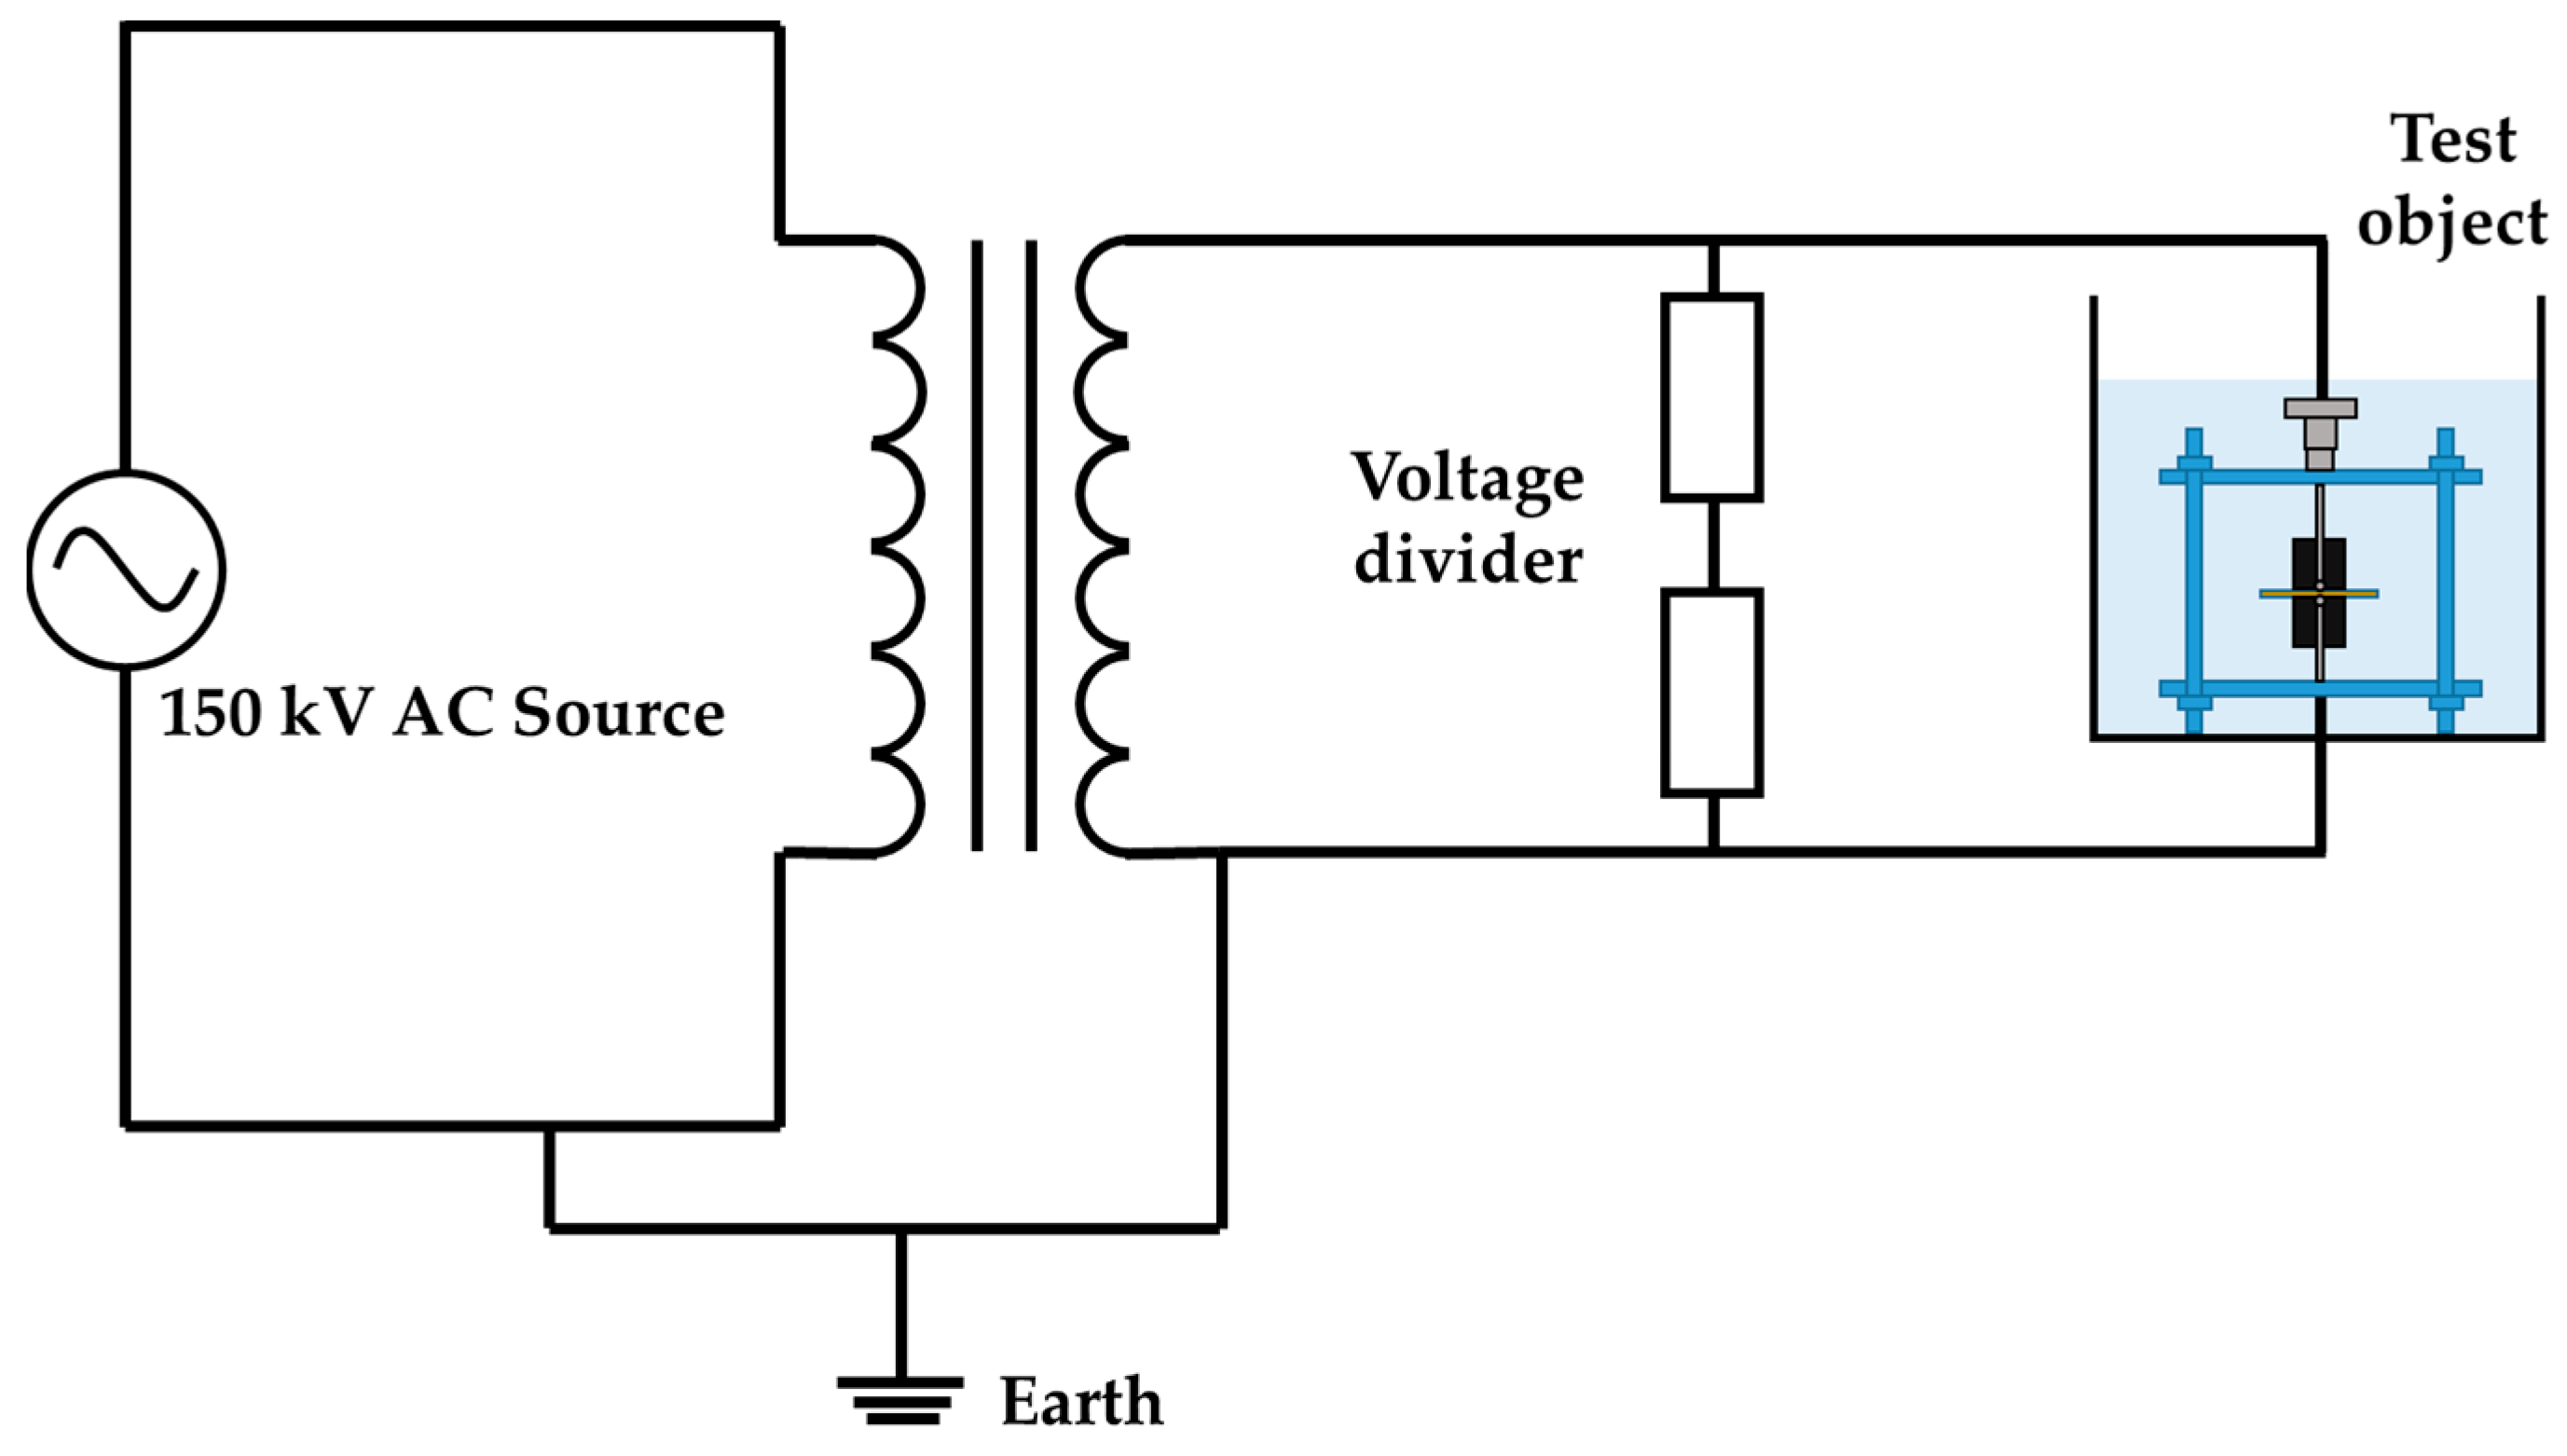
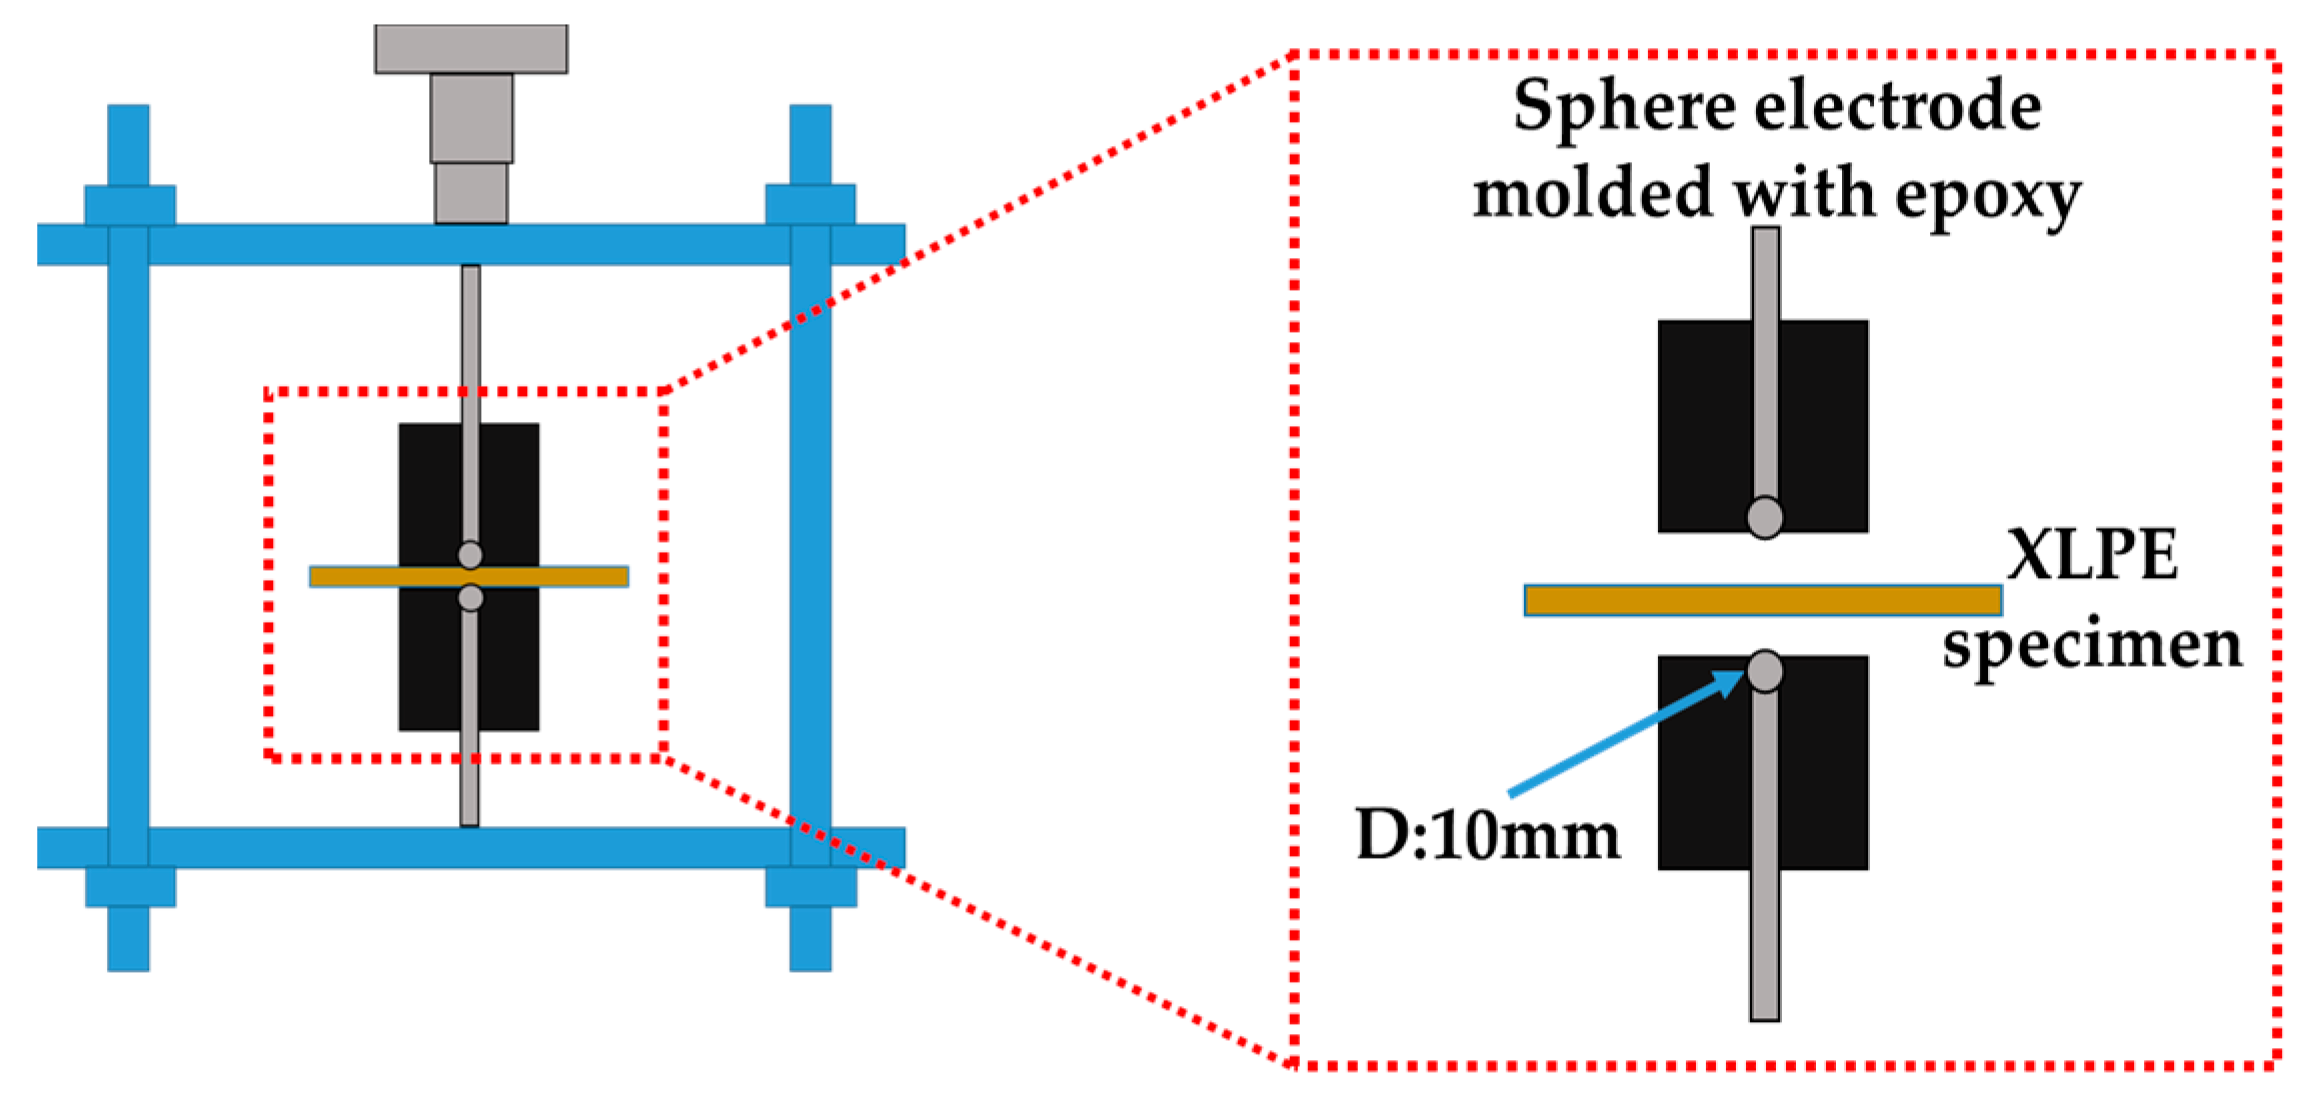
3.5. Dielectric Breakdown Test Method for the XLPE Specimens

When performing a dielectric breakdown test on a 6 m XLPE cable, it is possible to measure only one breakdown voltage. Additional dielectric breakdown tests are difficult to execute due to the shortened cable length. Creating specimens enables repetitive experiments, allowing for breakdown tests to be conducted on XLPE specimens. The experimental setup consists of a 150 kV AC voltage source, a water tank, mineral oil, an XLPE specimen, jigs, and epoxy molding electrodes, as shown in Figure 6. Mineral oil was used to prevent surface discharge of the XLPE specimen. The jigs and epoxy molding electrodes are as shown in Figure 7. The applied electrode was made of a 10 mm diameter sphere electrode molded with epoxy. This design minimizes surface discharge and ensures that dielectric breakdown occurs at the shortest distance between electrodes, enhancing the reliability of the dielectric breakdown test.
The specimen’s dimensions were 50 mm × 50 mm, and its thickness was determined by averaging four measurements taken around the point where dielectric breakdown occurred. The voltage was increased by 1 kV and maintained for 10 s. If dielectric breakdown was not measured, the process of applying voltage was repeated by increasing by 1 kV and holding for 10 s each time. Since the dielectric breakdown test takes a lot of time, the anticipated breakdown voltage was derived from the measured breakdown voltage. Voltage was applied up to 50% of the expected breakdown voltage. Afterward, the process of increasing the voltage was repeated until dielectric breakdown occurred. The dielectric breakdown test was measured a total of 10 times, and the average value of 8 tests excluding the maximum and minimum values was selected as the breakdown voltage.

4. Results and Discussion
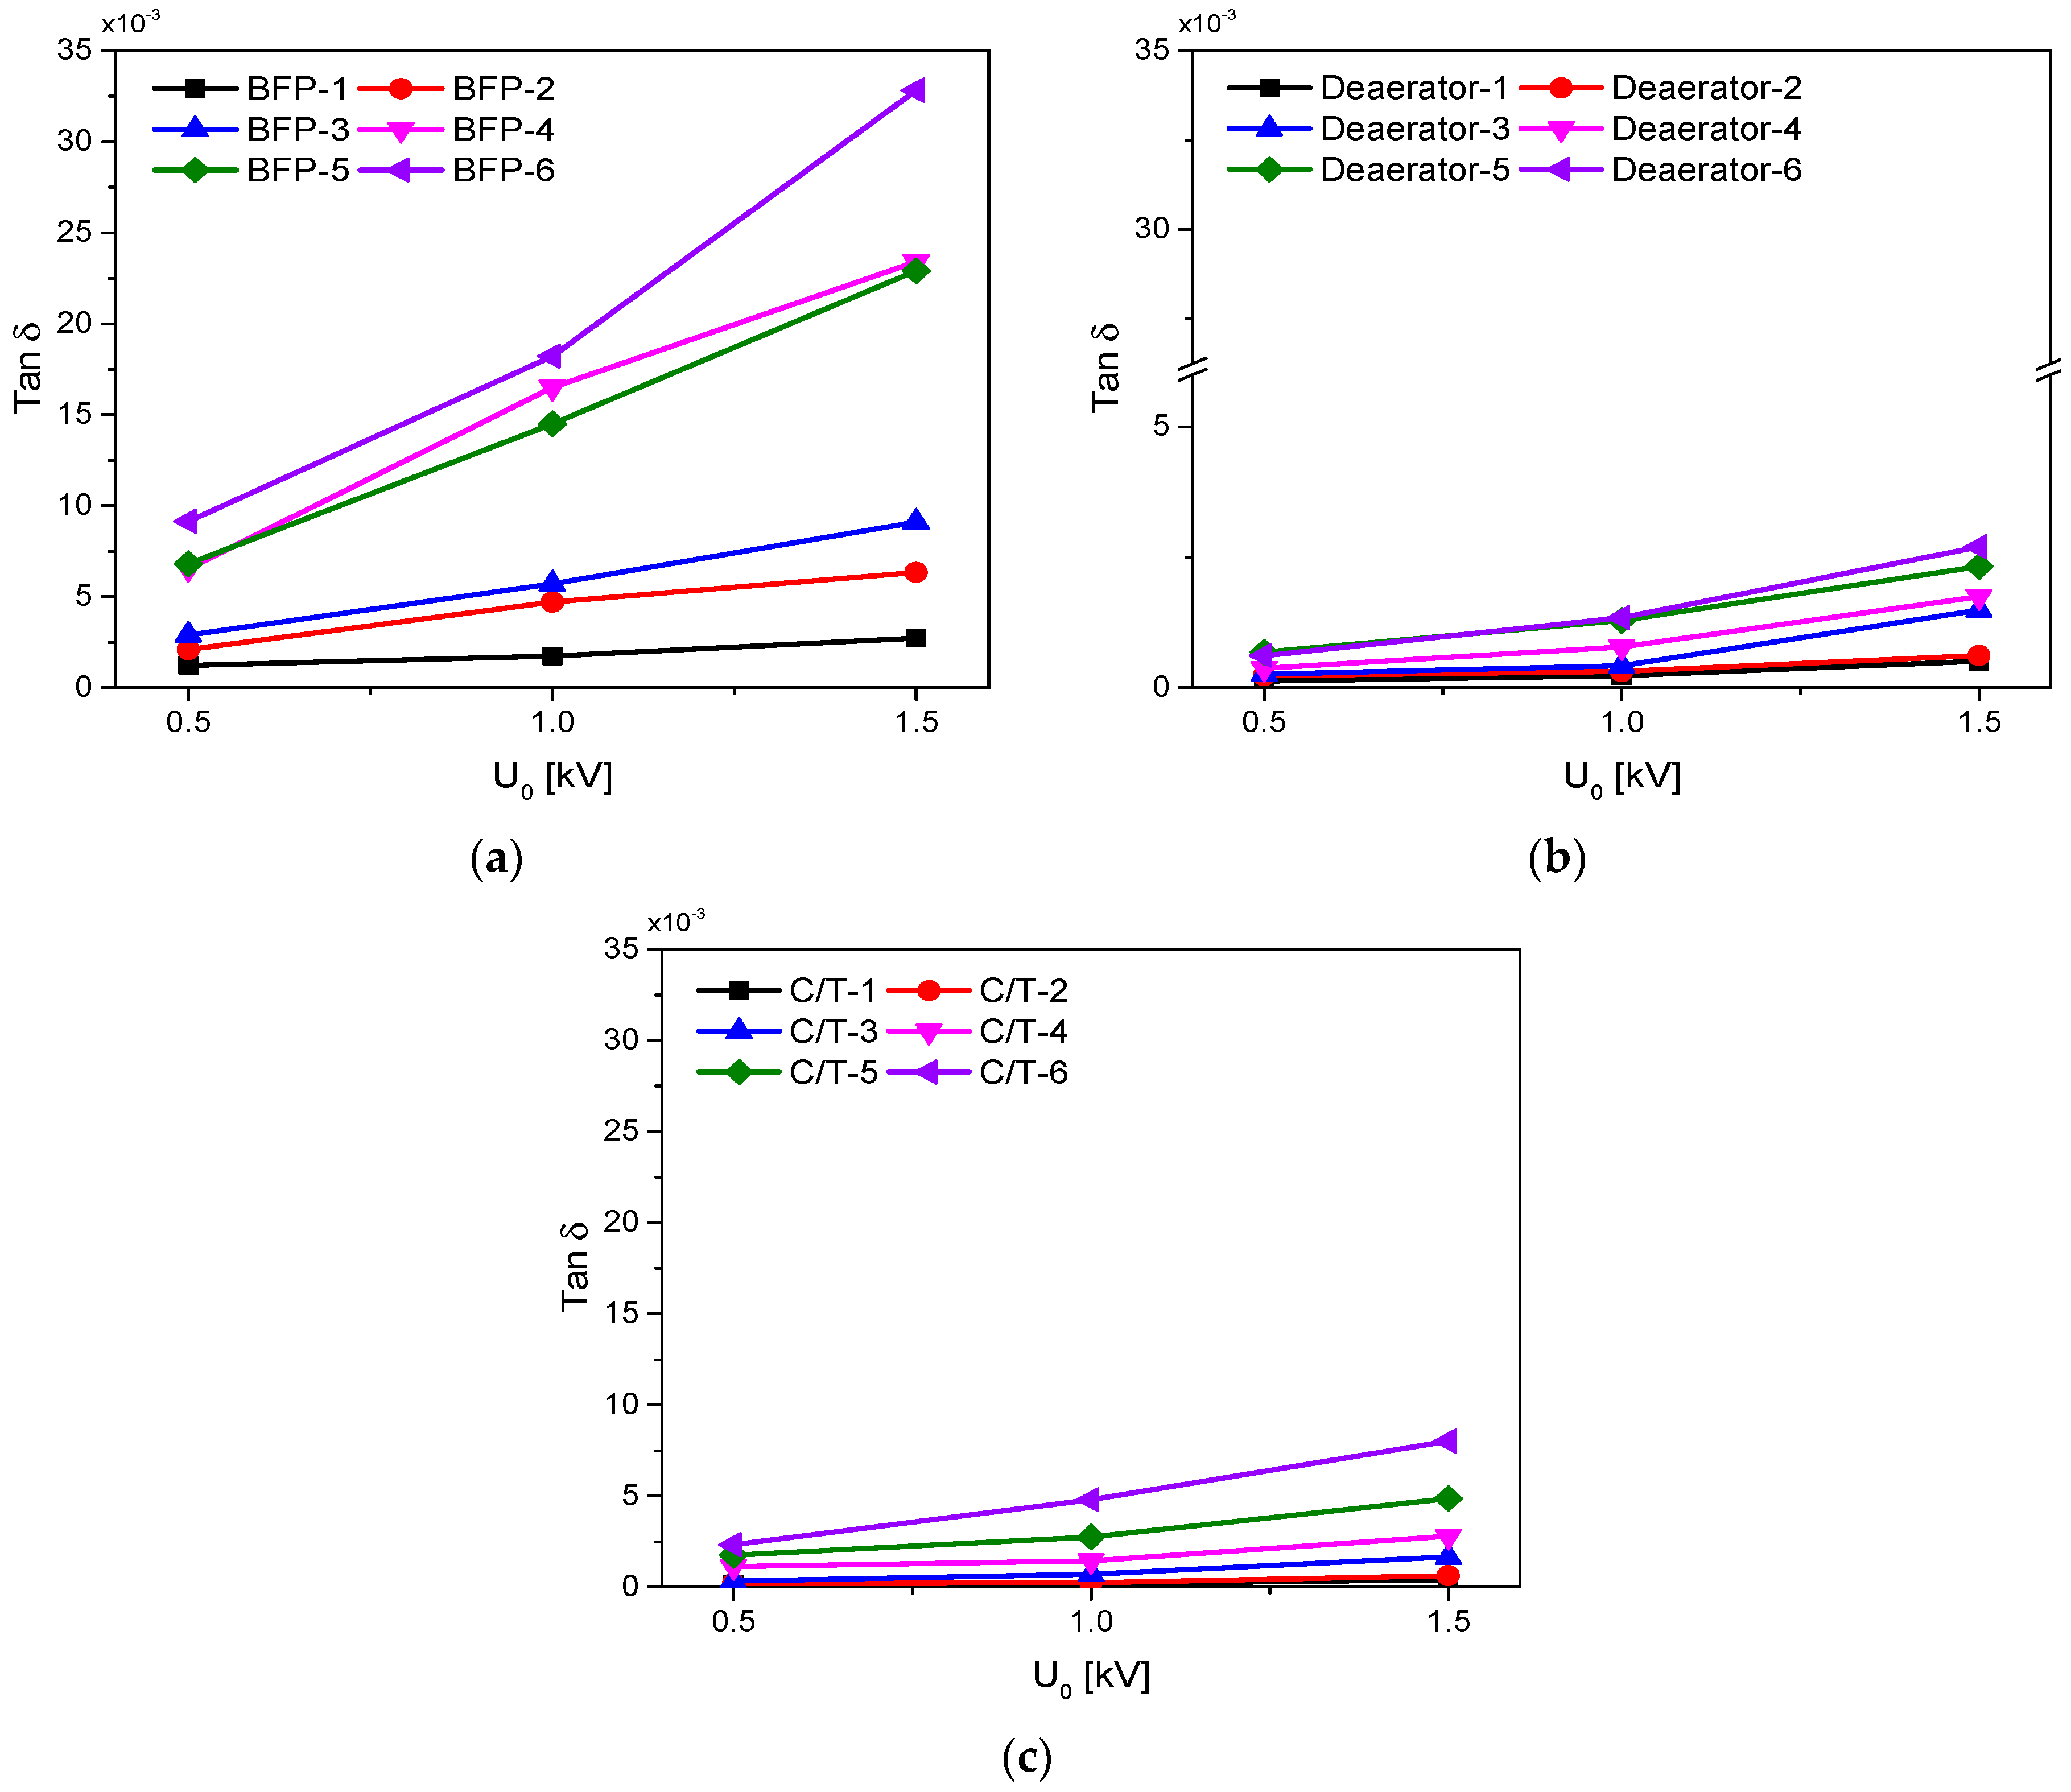
4.1. VLF Tan δ

The VLF Tan δ of the XLPE cables installed in the combined heat and power plant was measured, as shown in Table 2 and Figure 8. When comparing the BFP, the deaerator booster pump, and the cooling tower, it was observed that the VLF Tan δ deviation of the BFP was significantly large. The cooling tower also showed deviation, and the variance of the deaerator booster pump was the smallest. It was observed that the VLF Tan δ of the XLPE cable installed in the BFP, the deaerator, and the cooling tower increases linearly as U0 increases. The rise in the VLF Tan δ with the increment in U0 signifies an increase in losses within the insulator. The DTD (1.5 U0–0.5 U0) was also calculated to determine whether the high Tan δ is due to insulation degradation. If DTD is low while both 0.5 U0 and 1.5 U0 are high, it is due to measurement environmental effects. Therefore, the DTD value is important in analyzing insulation performance. It is confirmed that the cable installed in the BFP has the highest values of VLF Tan δ and DTD, so the deterioration in insulation performance is the greatest. Based on IEEE Std 400.2, if the DTD is 5 or more, further study is advised. Therefore, BFP-3 to BFP-6 require caution. The VLF Tan δ of the XLPE cable installed in the deaerator booster pump is as shown in Figure 8b. According to 1.0 U0 and DTD, it is the lowest VLF Tan δ compared to cables in other installation locations. However, through the DTD from deaerator-3 to deaerator-6, it is confirmed that the cable has gradually degraded. Deaerator-5 was identified as the XLPE cable installed in the deaerator booster pump that has experienced the most significant degradation. However, it is similar to the VLF Tan δ of the cable with the best insulation condition in the BFP. Therefore, the deaerator cables, having the lowest VLF Tan δ and DTD values compared to cables in other locations, exhibit the best insulation performance. Figure 8c shows the VLF Tan δ of the XLPE cable installed in the cooling tower. In the case of C/T, 1.0 U0 and DTD were measured to be higher than the deaerator and lower than the BFP. Similar to the deaerator, degradation progresses from C/T-3 to C/T-6. The cooling tower cable has better insulation performance than the BFP, but lower than the deaerator. According to IEEE Std 400.2, further study is only advised for C/T-6.

4.2. Dielectric Breakdown Voltage of the XLPE Cable

Table 3 provides the breakdown voltage of the XLPE cable according to the installation location. If dielectric breakdown occurred at the semiconductor layer–XLPE interface or flashover in the cable, additional experiments were conducted. Because dielectric breakdown occurred in the interface of BFP-3, the measurement was performed again after the cable was terminated. The lowest breakdown voltage of the XLPE cable installed in the BFP is 62.8 kV, and the highest voltage is 74.4 kV. There is approximately a 16% deviation in breakdown voltage. For Deaerator-1 and Deaerator-2, dielectric breakdown measurements could not be taken due to the occurrence of flashovers. Deaerator-5 was retested to measure the breakdown voltage after experiencing dielectric breakdown at the interface. When comparing the breakdown voltages measured from Deaerator-3 to Deaerator-6 excluding flashovers, there is approximately a 10% difference. It was confirmed that the breakdown voltage was higher and the deviation was smaller than that of the BFP. C/T-3 experienced dielectric breakdown at the interface twice, so further experiments could not be conducted. This means that the cable became too short for additional testing. Comparing the breakdown voltages of the remaining cooling tower cables, there is approximately a 15% variance. The deviation is similar to that of the BFP. Through this, the breakdown voltage of BFP was the lowest, followed by C/T, and the deaerator booster pump was the best.

4.3. Tensile Strength and Elongation at Break Evaluation

Figure 9 shows the graph of the tensile strength and elongation at break according to the installation location. The tensile strength is highest in the cooling tower and lowest in the deaerator booster pump, with approximately a 15% deviation. By removing the extreme values for comparison, it becomes difficult to distinguish differences in tensile strength according to the installation location. The deviation between the maximum and minimum values of the elongation at break is around 4%. Therefore, similar to tensile strength, it is challenging to compare differences in the elongation at break according to the installation location.

4.4. XRD and Crystallinity Evaluation

The XRD measurement data of the XLPE specimens according to the installation location is as shown in Figure 10. The XRD analysis identified peaks at 21.3° and 23.4°. There was no difference in the peak angles of intensity according to the installation location. For additional examination, each area is calculated through normal distribution as shown in Figure 10. The derived crystallinity is shown in Figure 11. When assessing the crystallinity according to the installation location, the BFP and cooling tower were similar. The difference between the highest and lowest values of crystallinity at each installation location was the largest for the cooling tower and BFP. However, removing the extreme values, the greatest deviation was observed in the BFP. This confirms that there is a significant difference in degradation. The crystallinity was highest for the XLPE cable installed in the deaerator booster pump. Additionally, the variation in data was relatively low. This means that the deterioration progressed less than in other locations.

4.5. Dielectric Breakdown Test of the Specimens

The dielectric strength of the specimens is as shown in Figure 12. The dielectric strength distribution of the XLPE cable specimens installed in the BFP is the lowest. However, it was confirmed that the variation in dielectric strength was the largest. The dielectric strength of the specimens in the cooling tower was similar to that of the BFP, but slightly higher. The difference in dielectric strength was also similar to that of the BFP, but the deviation in the data, removing the extreme values, was the smallest. The deaerator booster pump shows the highest dielectric strength distribution, with about 10% higher insulation performance.

4.6. Correlation with the VLF Tan δ

The correlation between the VLF Tan δ and the dielectric breakdown of the cable is shown in Figure 13a, while the relationship between the VLF Tan δ and the characteristic evaluation of the specimen appears in Figure 13b–e. In Figure 13a, data for Deaerator-1, Deaerator-2, and C/T-3 were excluded. The VLF Tan δ values for the excluded data are 0.23, 0.31, and 0.7 based on 1.0 U0. The reason for exclusion is that during the cable dielectric breakdown test, flashovers occurred, or dielectric breakdown happened at the interface between the semiconductor layer and the XLPE insulator. It was observed that as it increases, the breakdown voltage of the cable decreases. The highest breakdown voltage was 79.2 kV, and the lowest voltage was 62.8, a decrease of about 20%. The VLF Tan δ at each voltage is 0.18 and 14.5. If the VLF Tan δ data are distributed between 0.183 and 1.74, the breakdown voltages range from 72.8 to 79.2 [kV]. For Tan δ values within the range of 2.75 to 5.7, the breakdown voltages were measured between 67.8 and 72.8 [kV]. The remaining data is 14.5~18.2, and the breakdown voltage is 62.8~69.5 [kV]. Although repeated dielectric breakdown tests could not be performed due to the insufficient number of cables with high value, it was possible to observe the distribution of dielectric breakdown voltage according to the Tan δ. This confirmed that there is a correlation between the Tan δ and the breakdown voltage of the cable.
The tensile strength and elongation at break according to the VLF Tan δ are as shown in Figure 13b,c. Even as the Tan δ increases, the tensile strength and elongation at break show a consistent distribution. The tensile strength was mostly measured around 3.0 to 3.2 [kgf/mm2]. The elongation at break is also distributed between approximately 568% and 580%, but unlike the tensile strength, it ranges from about 568% to 572% as it increases. Therefore, the elongation at break showed a tendency to decrease as it raised. However, it was found that it has a minor correlation with both the tensile strength and elongation at break.
The crystallinity according to the Tan δ is as shown in Figure 13d. When the Tan δ is below 2, the crystallinity is distributed around 31% to 33%. However, a crystallinity of approximately 31% to 32% was derived when the Tan δ ranges from 2 to 6. If it was 14 to 18, the crystallinity was calculated to be around 30% to 31%. Among the 18 Tan δ values, 11 are distributed within values below 2. Although the number of crystallinity measurements at higher Tan δ values is limited, it was observed that as it increases, there is a trend of decreasing crystallinity.
The dielectric strength graph for the specimens Is depicted In Figure 13e. With an increasing VLF Tan δ, a corresponding decrease in specimen dielectric strength was observed. For low values, strengths were distributed between approximately 63 to 73 [kV/mm], whereas higher values yielded measurements ranging from 59 to 62 [kV/mm]. When the VLF Tan δ values were 0.23 and 18.21, the dielectric strengths recorded were 72.9 and 59.6 [kV/mm], respectively, indicating a difference of about 19%. These findings confirm a clear relationship between the VLF Tan δ and the dielectric strength of the specimens.

4.7. Discussion

The VLF Tan δ measurements, dielectric breakdown tests, and mechanical and chemical analyses of the XLPE cables installed in the BFP, deaerator booster pump, and cooling tower of a combined heat and power plant demonstrated that even identical cables can exhibit different outcomes depending on their installation location. Through the VLF Tan δ, it was shown that the BFP had the most deteriorated insulation performance, with the highest deviation. Next was the cooling tower, while the deaerator booster pump demonstrated the best insulation performance. The breakdown voltage of the cable from previous studies shows similar characteristics to the VLF Tan δ. The breakdown voltage of the BFP shows the lowest distribution, followed by the cooling tower. The deaerator booster pumps exhibited the highest breakdown voltage distribution. Different results were obtained for the tensile strength and elongation at break. The lowest value of tensile strength was measured in the deaerator booster pump. The mechanical performance of the BFP and deaerator booster pump was similar. The cooling tower was analyzed to have the best performance. The lowest data for the elongation at break was measured in the deaerator booster pump, but the BFP showed a distribution of lower performance. The cooling tower and deaerator booster pump have a similar performance. The degree of crystallinity was obtained with similar results to the VLF Tan δ and breakdown voltage of the cable. The breakdown voltage of the specimens showed that the electrical performance was lowest for BFP and, subsequently, for the cooling tower and the deaerator booster pump.
Comparing the installation environments and measurement results, it is inferred that the BFP had more extensive degradation due to a higher number of cables exposed to high temperature, high pressure, and steam environments. The cooling tower, involved in condensing high-temperature steam into water, releases a large amount of steam, leading to the inference that long-term exposure to a steam environment has contributed to its degradation. Unlike the BFP and cooling tower, the deaerator booster pump is not an environment that accelerates cable degradation; hence, it is expected to have the least deterioration among the cables. Through this, it is deduced that cables that have been field-aged for a long period through electrical stress have the highest deterioration, while the impact of mechanical deterioration was negligible depending on the installation environment.
When the VLF Tan δ was analyzed for characteristic evaluation of cables and specimens, it was confirmed that it has inverse correlation with the breakdown voltage of the cable, the dielectric strength of the specimen, and the crystallinity. This analysis indicates that electrical and chemical performance begin to deteriorate when the Tan δ exceeds 2, based on a 1.0 U0. Subsequently, when the Tan δ is more then 14, the electrical performance decreased by approximately 20% compared to the best values observed. However, several improvements are necessary for reliable diagnostics. The BFP and cooling tower have a large deviation in measurement; therefore, six cables are not enough to evaluate deterioration depending on the installation location. More than half of the Tan δ data are below 2, and there are only seven ranging from 2.75 to 18.21. Therefore, the amount of data is insufficient to accurately determine trends when degradation has occurred. Additionally, it was not possible to determine how close the cable was installed to the BFP, cooling tower, and deaerator booster pump. Therefore, accurate analysis was difficult due to the existence of deviations in experimental values. Future research should focus on considering more cables and study the impact of exact locations on the reliability of the experimental results.
In conclusion, this study has confirmed that even identical cables, when installed and operated in different locations and environments, undergo varying degrees of degradation. This insight can be utilized in diagnosing the insulation of cables that are nearing the end of their service life.

5. Conclusions

This study evaluated and analyzed the insulation performance of XLPE cables manufactured in 1991, based on their installation locations. The VLF Tan δ, breakdown voltage, tensile strength, elongation at break, and crystallinity of the cable were measured. Through the measured results, the insulation performance according to the installation location was estimated. Additionally, the correlation between the Tan δ and other characteristics was also evaluated. The results of this study are as follows:
  • Analyses of the VLF Tan δ of the XLPE cables revealed that degradation occurred in the order of the BFP, the cooling tower, and the deaerator booster pump.
  • The dielectric breakdown tests of the cables also showed the lowest breakdown in the following order: the BFP, the cooling tower, and the deaerator booster pump.
  • It is difficult to analyze the tensile strength and elongation at break characteristics depending on the installation location.
  • The crystallinity and the dielectric strength of the XLPE specimens make it challenging to measure the differences between the BFP and the cooling tower but distinguishing them from the deaerator booster pump is feasible.
  • It was found that the cable’s breakdown voltage, the specimen’s crystallinity, and the specimen’s dielectric strength decrease as the Tan δ increases. However, the tensile strength and elongation at break showed less association with the Tan δ.
This study confirmed that identical cables can degrade differently depending on their installation location. This indicates that even cables nearing the end of their service lifespan can represent differences in insulation performance depending on their installation location and environment. Furthermore, by identifying the relationship between the Tan δ and breakdown voltage, it is possible to assess how degradation affects insulation performance. As a result, it can be suggested that comparing electrical properties is more effective for evaluating cable degradation.

Author Contributions

Conceptualization, H.-S.K.; investigation, H.-S.K.; methodology, J.J.; resources, H.-S.K.; formal analysis, J.J.; visualization, J.J.; writing—original draft preparation, H.-S.K.; supervision, B.-W.L.; writing—review and editing, B.-W.L. All authors have read and agreed to the published version of the manuscript.

Funding

This research received no external funding.

Data Availability Statement

The original contributions presented in the study are included in the article, further inquiries can be directed to the corresponding author.

Acknowledgments

This work was supported in part by the Korean Institute of Energy Technology Evaluation and Planning (KETEP) and in part by the Ministry of Trade, Industry and Energy (MOTIE) of the Republic of Korea (No. 20217610100050). This work was supported by Korea Institute of Energy Technology Evaluation and Planning (KETEP) grant funded by the Korea Government (MOTIE) (20224000000160, DC Grid Energy Innovation Research Center).

Conflicts of Interest

The authors declare no conflicts of interest.

References

  1. German-Sobek, M.; Cimbala, R.; Király, J. Change of dielectric parameters of XLPE cable due to thermal aging. Electroteh. Electron. Autom. 2014, 62, 47. [Google Scholar]
  2. Wang, Q.; Liu, R.; Qin, S.; Chen, X.; Shen, Z.; Hou, Z.; Ju, Z. Insulation Properties and Degradation Mechanism for XLPE Subjected to Different Aging Periods. CSEE J. Power Energy Syst. 2023, 9, 1959–1967. [Google Scholar]
  3. Li, G.; Wang, Z.; Lan, R.; Wei, Y.; Nie, Y.; Li, S.; Lei, Q. The Lifetime Prediction and Insulation Failure Mechanism of XLPE for High-Voltage Cable. IEEE Trans. Dielectr. Electr. Insul. 2023, 30, 761–768. [Google Scholar] [CrossRef]
  4. Liu, F.; Huang, X.; Wang, J.; Jiang, P. Insulation ageing diagnosis of XLPE power cables under service conditions. In Proceedings of the 2012 IEEE International Conference on Condition Monitoring and Diagnosis, Bali, Indonesia, 23–27 September 2012; pp. 647–650. [Google Scholar]
  5. Morsalin, S.; Phung, B.T. Dielectric response study of service-aged XLPE cable based on polarisation and depolarisation current method. IEEE Trans. Dielectr. Electr. Insul. 2020, 27, 58–66. [Google Scholar] [CrossRef]
  6. Li, C.; Chu, Z.; Zhang, L.; Zhang, J.; Tao, J. Insulation aging diagnosis and defect location of crosslinked polyethylene cable in the distribution network based on radio frequency identification. Mater. Express 2023, 13, 1772–1781. [Google Scholar] [CrossRef]
  7. Liu, Y.; Cao, X. Insulation performance evaluation of HV AC/DC XLPE cables by 0.1 Hz tan δ test on circumferentially peeled samples. IEEE Trans. Dielectr. Electr. Insul. 2017, 24, 3941–3950. [Google Scholar] [CrossRef]
  8. Morsalin, S.; Phung, B.T.; Danikas, M.G. Influence of Partial Discharge on Dissipation Factor Measurement at Very Low Frequency. In Proceedings of the 2018 Condition Monitoring and Diagnosis (CMD), Perth, WA, Australia, 23–26 September 2018; pp. 1–4. [Google Scholar]
  9. Bolliger, D. Simultaneous Partial Discharge and Tan Delta Measurements: New Technology in Cable Diagnostics. In Proceedings of the 2018 IEEE/PES Transmission and Distribution Conference and Exposition (T&D), Denver, CO, USA, 16–19 April 2018; pp. 1–5. [Google Scholar]
  10. IEEE Std 400.2-2013; IEEE Guide for Field Testing of Shielded Power Cable Systems Using Very Low Frequency (VLF) (less than 1 Hz). IEEE: Piscataway, NJ, USA, 2013; pp. 1–60.
  11. Nampalliwar, T.; Negi, K.; Rewatkar, R.; Manwatkar, N.; Jaiswal, B.; Raut, S.; Korsane, D.T. Study on the test Performance of Underground XLPE Cables. Int. J. Innov. Res. Electr. Electron. Instrum. Control Eng. 2017, 5, 8–12. [Google Scholar] [CrossRef]
  12. Morsalin, S.; Sahoo, A.; Phung, B.T. Diagnostic Testing of Power Cable Insulation for Reliable Smart Grid Operation. In Proceedings of the 2019 IEEE Electrical Insulation Conference (EIC), Calgary, AB, Canada, 16–19 June 2019; pp. 509–512. [Google Scholar]
  13. Kim, D.; Cho, Y.; Kim, S.-M. A study on three dimensional assessment of the aging condition of polymeric medium voltage cables applying very low frequency (VLF) tan δ diagnostic. IEEE Trans. Dielectr. Electr. Insul. 2014, 21, 940–947. [Google Scholar] [CrossRef]
  14. Li, J.; Zhao, X.; Yin, G.; Li, S.; Zhao, J.; Ouyang, B. The effect of accelerated water tree ageing on the properties of XLPE cable insulation. IEEE Trans. Dielectr. Electr. Insul. 2011, 18, 1562–1569. [Google Scholar] [CrossRef]
  15. Du, B.X.; Li, H.; Gao, Y.; Wang, L.; Huo, Z. Deterioration analysis of ex-serviced 110 kV XLPE cable based on residual charge method. In Proceedings of the 2009 IEEE Conference on Electrical Insulation and Dielectric Phenomena, Virginia Beach, VA, USA, 18–21 October 2009; pp. 303–306. [Google Scholar]
  16. Wang, H.M.; Fang, S.C.; Meng, Z.Z.; Song, P.X.; Li, X.; Zhu, M.Z.; Zhu, X.H.; Yu, Y.; Du, X. Dielectric Properties of High Voltage XLPE Power Cables Taken from Service. In Proceedings of the 2019 IEEE Conference on Electrical Insulation and Dielectric Phenomena (CEIDP), Richland, WA, USA, 20–23 October 2019; pp. 186–189. [Google Scholar]
  17. Kim, C.; Jin, Z.; Jiang, P.; Zhu, Z.; Wang, G. Investigation of dielectric behavior of thermally aged XLPE cable in the high-frequency range. Polym. Test. 2006, 25, 553–561. [Google Scholar] [CrossRef]
  18. Zhang, Y.; Wu, Z.; Qian, C.; Tan, X.; Yang, J.; Zhong, L. Research on Lifespan Prediction of Cross-Linked Polyethylene Material for XLPE Cables. Appl. Sci. 2020, 10, 5381. [Google Scholar] [CrossRef]
  19. Hernandez-Mejia, J.C.; Perkel, J.; Harley, R.; Hampton, N.; Hartlein, R. Correlation between tan δ diagnostic measurements and breakdown performance at VLF for MV XLPE cables. IEEE Trans. Dielectr. Electr. Insul. 2009, 16, 162–170. [Google Scholar] [CrossRef]
  20. Abraham, N.; Chacko, S.; Sathyan, S.; Sreenath, K.C.; Venugopal, P. An Assessment of Design parameters and Vibration Characteristics of Boiler feed pump for Auxiliary power consumption. IJIRST–Int. J. Innov. Res. Sci. Technol. 2015, 1, 102–109. [Google Scholar]
  21. Sharapov, V.I.; Kudryavtseva, E.V. Hydrodynamics and mass transfer deaeration of water on thermal power plants when used natural gas as a desorbing agent. J. Phys. Conf. Ser. 2017, 891, 012102. [Google Scholar] [CrossRef]
  22. Holmberg, H.; Ahtila, P. The thermal analysis of a combined heat and power plant undergoing Clausius–Rankine cycle based on the theory of effective heat-absorbing and heat-emitting temperatures. Appl. Therm. Eng. 2014, 70, 977–987. [Google Scholar] [CrossRef]
  23. IEC 60811-1-1; Common Test Methods for Insulating and Sheathing Materials of Electric Cables and Optical Cables. IEC: Geneva, Switzerland, 2001.
Figure 1. Location of cables installed in the combined heat and power plant.
Energies 17 02024 g001
Figure 2. Peeling of 10 cm wide XLPE specimens.
Energies 17 02024 g002
Figure 3. Schematic diagram of cable dielectric breakdown.
Energies 17 02024 g003
Figure 4. Location of where dielectric breakdown occurred: (a) dielectric breakdown occurred in XLPE insulation; (b) dielectric breakdown occurred at the semiconductor layer–XLPE interface.
Energies 17 02024 g004
Figure 5. Dumbbell-shaped specimen.
Energies 17 02024 g005
Figure 6. Schematic diagram of the dielectric breakdown of the XLPE specimen.
Energies 17 02024 g006
Figure 7. Jigs and electrodes.
Energies 17 02024 g007
Figure 8. VLF Tan δ depending on the installation location: (a) BFP; (b) deaerator booster pump; (c) cooling tower.
Energies 17 02024 g008
Figure 9. Mechanical evaluation according to the installation location: (a) tensile strength; (b) elongation at break.
Energies 17 02024 g009
Figure 10. XRD depending on the installation location.
Energies 17 02024 g010
Figure 11. Crystallinity of the XLPE specimens depending on the installation location.
Energies 17 02024 g011
Figure 12. Dielectric strength of the XLPE specimens depending on the installation location.
Energies 17 02024 g012
Figure 13. Correlation with the Tan δ: (a) Tan δ and cable insulation breakdown; (b) Tan δ and tensile strength; (c) Tan δ and elongation at break; (d) Tan δ and crystallinity; (e) Tan δ and specimen dielectric strength.
Energies 17 02024 g013
Table 1. Cable installation location and sample name.
Installation
Location
Sample NameConditionYearLength [m]
Boiler feedwater pumpBFP-1Field-aged19916
BFP-2
BFP-3
BFP-4
BFP-5
BFP-6
Deaerator booster pumpDeaerator-1Field-aged19916
Deaerator-2
Deaerator-3
Deaerator-4
Deaerator-5
Deaerator-6
Cooling towerC/T-1Field-aged19916
C/T-2
C/T-3
C/T-4
C/T-5
C/T-6
Table 2. VLF Tan δ depending on installation location.
Sample Name0.5 U01.0 U01.5 U0DTD
(1.5 U0–0.5 U0)
Standard
Deviation TD
BFP-11.221.742.721.5<0.1
BFP-22.154.766.344.19<0.1
BFP-32.915.789.16.19<0.1
BFP-46.5516.5123.416.850.75
BFP-56.816.5522.916.10.24
BFP-69.1518.2132.8223.670.92
Deaerator-10.120.230.510.39<0.1
Deaerator-20.230.310.620.39<0.1
Deaerator-30.260.421.51.24<0.1
Deaerator-40.370.781.751.38<0.1
Deaerator-50.681.293.262.580.13
Deaerator-60.621.342.72.08<0.1
C/T-10.150.180.410.26<0.1
C/T-20.190.240.630.44<0.1
C/T-30.340.71.551.21<0.1
C/T-41.131.452.81.67<0.1
C/T-51.752.754.873.120.15
C/T-62.334.88.025.69<0.1
Table 3. Dielectric breakdown voltage and type depending on installation location.
Sample NameBreakdown
Voltage [kV]
TypeBreakdown
Voltage [kV]
Type
BFP-174.4BD--
BFP-272.8BD--
BFP-368.1Interface72.6BD
BFP-469.5BD--
BFP-562.8BD--
BFP-664BD--
Deaerator-184.5Flashover87Flashover
Deaerator-278.9BD--
Deaerator-378.9BD--
Deaerator-472.8BD--
Deaerator-570.8Interface76.6BD
Deaerator-674.2BD--
C/T-179.2BD--
C/T-273.5Interface74.6BD
C/T-372.9Interface66.7Interface
C/T-473.4BD--
C/T-570.6BD--
C/T-667.8BD--
Disclaimer/Publisher’s Note: The statements, opinions and data contained in all publications are solely those of the individual author(s) and contributor(s) and not of MDPI and/or the editor(s). MDPI and/or the editor(s) disclaim responsibility for any injury to people or property resulting from any ideas, methods, instructions or products referred to in the content.

