
Effect of Inlet Pressure on the Biodegradability Index of Cavitated Herbal Waste

Faculty of Environmental Engineering, Lublin University of Technology, Nadbystrzycka 40B, 20-618 Lublin, Poland
*
Authors to whom correspondence should be addressed.
Energies 2024, 17(9), 2023; https://0-doi-org.brum.beds.ac.uk/10.3390/en17092023
Submission received: 2 April 2024
/
Revised: 17 April 2024
/
Accepted: 23 April 2024
/
Published: 25 April 2024
(This article belongs to the Section A4: Bio-Energy)
Abstract
:This paper analyzes the effect of inlet pressure on the index of biodegradability of cavitated herbal waste (HW) following its suspension in mechanically treated wastewater (MTW) for further biological processes. Hydrodynamic cavitation (HC) was carried out at inlet pressures of 3.5, 5.0, and 7.0 bar. The BOD5/COD ratio increased by 30% between the 5th and 10th minutes of the process, with the inlet pressure amounting to 3.5 bar, which indicated increased biodegradability of HW. For the higher inlet pressures used, the value of the biodegradability index (BI) increased by 23% and 13% for 5.0 and 7.0 bar, respectively, after 60 min of the process. The value of COD as well as the VS, TS, TC and TOC concentrations dropped for each analyzed inlet pressure, which indicated that complex organic compounds were effectively destroyed. The highest disintegration degree (DDCOD) was achieved with an inlet pressure of 3.5 bar. SEM analysis was performed to analyze the changing morphological structure of the HW. It was proven that the structural morphology of the herbal waste was significantly influenced by hydrodynamic cavitation, which could affect subsequent biological processing.
1. Introduction
The human population is continuously increasing, which could lead to the depletion of natural resources. Additionally, the amount of biomass used annually is almost 72 gigatons, and this figure is expected to reach 100 gigatons by 2030 [1]. The development of the global economy in various sectors, such as agriculture, food, and energy, is now faced with addressing global climate issues, in addition to reducing dependence on fossil fuels. Continued use of non-renewable energy resources poses an ever-increasing environmental threat. A new approach based on lignocellulosic biomass as a renewable energy source may offer a promising solution with high potential in terms of applications and energy supply [2]. The primary lignocellulosic biomass sources include agricultural waste, organic municipal waste, forestry waste, specially grown energy crops, and industrial waste (e.g., paper, wood, and herbal waste) [3]. Lignocellulosic biomass is a promising and economically viable fossil fuel alternative. The composition of this biomass is varied, with a hierarchical structure, mainly including cellulose, hemicellulose, and lignin, which constitute 40–60%, 20–40%, and 10–25%, respectively, in addition to other components such as phenolic groups and minerals. The biological processing of this biomass is difficult due to the crystalline nature of cellulose; its encapsulation by the lignin–hemicellulose matrix, with strong hydrogen and covalent bonds; as well as the hydrophobic properties of lignin [4]. Although lignocellulosic biomass has a high methane potential for anaerobic digestion, the efficiency of biogas production can be affected by its complex structure [5]. Therefore, conducting pretreatment to remove physical and chemical barriers, in addition to improving the biodegradability of lignocellulosic waste by reducing the degree of cellulose crystallinity and polymerization, partial depolymerization of hemicellulose, modification and removal of lignin, as well as increasing the porosity and surface area of the lignocellulosic material, is crucial [6]. It should be noted that the pretreatment method is selected depending on different factors, including the type of lignocellulosic feedstock, the desired end products, and economic considerations. Researchers continue to explore and optimize pretreatment techniques to make the bioconversion of lignocellulosic biomass more efficient and economically viable. Nowadays, different pretreatment methods, including biological, chemical, physical, as well as combinational methods, have been developed to improve the accessibility of the fibers in lignocellulosic biomass. Physical pretreatment methods involve mechanical processes, such as milling, grinding, and irradiation, to break down the structural barriers in the biomass. These processes help in reducing the particle size, increasing the surface area, and enhancing the accessibility of cellulose fibers [7,8]. Biological pretreatment involves the use of microorganisms, like fungi or bacteria, to degrade lignin and hemicellulose [9]. Chemical pretreatment constitutes a highly prospective method for improving cellulose biodegradability via the removal of hemicellulose and/or lignin. The chemicals used for this purpose include salts, acids, alkalis, and oxidizing agents [10,11,12]. In addition, extraction and catalysis processes can be used to treat lignocellulosic matter [13]. Advanced oxidation processes (AOPs) like cavitation (hydrodynamic/acoustic), the Fenton reaction, ozonation, UV photolysis, photocatalysis, wet air oxidation, and hydrogen peroxidation are also employed in the chemical pretreatment of water, wastewater, and waste [14]. Hydrodynamic cavitation (HC) is a promising method. Its high efficiency stems from the formation, growth, as well as collapse of vapor/gas microbubbles produced by the pressure decrease in a flowing liquid by cavitation devices [15,16,17]. During the process, a very large amount of energy is released and localized in so-called “hot spots” that have a transient temperature of approximately 10,000 K and a pressure of 1000 atm. This causes water molecules to break down into oxidizing radicals and leads to the oxidation, as well as the degradation, of organic molecules. What is more, the mechanical force, caused by microbubbles, which are created by the violent collapse of the bubbles, also interacts with the surface with a pressure of about 1 GPa and shock waves, destroying organic molecules [18]. Currently, HC is employed for disinfection and treatment of wastewater and water [19,20], biogas production [21], cell disruption [22,23], and pulp refining. HC seems to be a promising method, especially when using raw materials that are difficult to decompose such as herbal wastes classified as lignocellulosic biomass. It is noteworthy that there is no work on the pretreatment of herbal waste in relation to its application for biological decomposition processes. The present analysis examined the effect of inlet pressure on the BI of cavitated herbal waste suspended in mechanically treated wastewater and its suitability in other biological processes.
2. Materials and Methods
2.1. Materials
The HW originated from a herb processing plant (Lublin Province, Poland). The raw material was waste from the processing of alchemilla, sage, St. John’s wort, and lemon balm, following their separate collection. Under laboratory conditions, mixing of the wastes was carried out in proportions that corresponded to their quantities produced at the afore-mentioned plant (alchemilla/sage/St. John’s wort/lemon balm at 16:28:28:28 by weight). Mechanically treated wastewater, used as a medium to suspend the waste, was collected from the Hajdów wastewater treatment plant (Lublin, Poland), characterized by an average daily flow of 120,000 m3. During the study, nine 35 L samples of wastewater were collected from the primary settling tank to ensure that the experiment was conducted for three inlet pressures in triplicate. Following its transport to the laboratory, the HW was subjected to grinding; then, it was sieved through a 1.4 mm sieve, and an additional 24 h maceration process with MPW was conducted (4 L of wastewater and 900 g of HW) before the hydrodynamic cavitation process was carried out. The purpose of this was to supply moisture to the HW as well as prevent the formation of herbal agglomerates that could contribute to clogging pipes in the laboratory installation. Afterwards, wastewater was added to the macerated HW to a volume of 30 L, which created the mixture finally used in the HC. As a result of the cavitation device used and the possibility of swelling of the herbal waste, 900 g of waste suspended in 30 L of MTW was the maximum dose used to maintain an acceptable content of 1% TSs. Table 1 shows the relevant parameters that characterized the wastewater, the HW, and the mixture thereof. The presented data are the average values from the experiments conducted in triplicate. The organization of the experiment is shown in Figure 1.
2.2. Operational Set-Up and Laboratory Installation
The experiment was carried out in a loop arrangement comprising a cavitation device, a pressure-generating pump, and a circulation tank with a capacity of 30 L. Cavitation was induced by a steel plate with a diameter of 64 mm and a concentric hole with an inlet/outlet diameter of 3/10 mm. Montusiewicz et al. [24] presented the laboratory installation for HC in detail. The analysis involved the effect of cavitation inlet pressure on the possibility of improving the biodegradability of HW suspended in MTW as well as changes in the morphological structure of the HW and the mixture composition during the process. As a control test, an experiment was carried out by cavitating wastewater. The impacts of cavitation duration and inlet pressure on the pretreatment results, as well as the selection of the most favorable option regarding energy consumption, were assessed via sampling in accordance with a schedule that included the following time intervals: 2, 5, 10, 30, 45, and 60 min. (Table 2 shows the number of passes of the mixture through the cavitation zone.) The following inlet pressures were used: 3.5, 5.0, and 7.0 bar. For each pressure used (Table 2), the cavitation number (Cv) was calculated using the following equation:
where p2 corresponds to the fully recovered pressure behind the nozzle (Pa), pv is the vapor pressure of the liquid (Pa), ρ is the density of the liquid (kg m−3), and v0 represents the velocity of flow through the orifice (ms−1).
Cv = (p2 − pv)/(0.5·ρ·v02)
2.3. Analytical Methods
2.3.1. The Physicochemical Analyses
The evaluation of the increase in biodegradability as a result of HC was based on the increase in the BOD5/COD (biochemical oxygen demand/chemical oxygen demand) ratio or the substrate biodegradability index (BI), in addition to the increase in BOD5 and sCOD (soluble chemical oxygen demand). In addition, differences in the characteristics of the HW and MPW mixture for three different inlet pressures were determined. The parameters analyzed for characterizing the HW macerated in the cavitated and raw HW and MTW mixtures, as well as the substrates themselves, were as follows: TSs (total solids), VSs (volatile solids), phenols, COD, BOD5, TC (total carbon), alkalinity, and levels of pH. A comparable process was carried out for the supernatant, and the parameters determined included the following: TOC (total organic carbon), sCOD, and VFAs (volatile fatty acids). Supernatant samples were collected using a filter with a 0.45 μm pore size. Standard cuvette tests corresponding to the parameters were performed in the majority of analyses. The contents of TSs and VSs were established using the Standard Methods for the Examination of Water and Wastewater (APHA, 2012). The pH values were measured using a CP-501 electronic pH meter (ELMETRON, Zabrze, Poland). Additionally, TOC was determined with a Shimadzu TOC-5050A (Shimadzu Corporation, Tokyo, Japan)total organic carbon analyzer. StatsoftStatistica software (v 13) was used to perform the statistical analysis.
2.3.2. SEM Analysis
SEM analysis was conducted to investigate the morphological structure of the analyzed materials. A Hitachi SU 3500 (Hitachi High-Tech Group, Tokyo, Japan) scanning electron microscope at an accelerating voltage of 20 kV was used for this purpose. Monochromatic images showing the difference in electron flux were obtained using a secondary electron detector; this enabled us to observe the microstructures and surface topography of the investigated samples. A working distance of approximately 5.1 mm and a vacuum at a pressure of 50 Pa were adopted in the SEM analysis. Prior to the SEM analysis, the samples were sputtered with a thin layer of Au.
3. Results and Discussion
3.1. Effect of HC on the Characetristics of the Cavitated Mixture
The impact of HC on the composition and biodegradability of the cavitated mixture was analyzed on the basis of the differences in its raw characteristics between the different time intervals (Table 3).
For each of the analyzed inlet pressures, systematic decreases in the values of COD, TSs, VSs, TC, and TOC concentrations were observed. Hydrodynamic cavitation, as one of the AOPs, allows the effective reduction of organic pollutants, as expressed by the mentioned parameters. The main oxidation mechanisms for the degradation of organic matter are radical reactions, which has been confirmed by other researchers [25,26]. Kunz and Wagner [27] proposed a disintegration degree (DDCOD) to determine the effectiveness of cavitation in terms of disintegration. In subsequent years, it was modified by other researchers [28,29]. This is a comparison of the soluble chemical oxygen demand in cavitated and raw mixtures. The equation used for determining the degree of disintegration is as follows: DDCOD = (sCODc − sCODr)/(sODr − sCODr) × 100, where CODr is the total chemical oxygen demand of the mixture before cavitation, sCODr is the soluble COD fraction before cavitation, and sCODc is the soluble COD fraction after the process. When the inlet pressure was equal to 3.5 bar, the disintegration rate increased with HC running time, as expected. It should be noted that, with short cavitation times, the differences were greatest. At 5 min, the DDCOD amounted to 37.6%, whereas at 10 min it was 53.9%, while after 60 min, the value grew to 62.3%. The degree of disintegration was much lower for inlet pressures of 5.0 and 7.0 bar and did not exceed 10% in both cases. Zielinski et al. [30] used a mechanical disintegrator consisting of a multifunctional rotor to cavitate aerobic granular sludge. They obtained the highest disintegration rate for COD of 37% after 20 min of the process. Gutiérrez-Mosquera et al. [31] analyzed hydrodynamic cavitation at an inlet pressure of 3 bar as a method for landfill leachate treatment. For the cavitation process, a reduction of 38.56–53.2% was found after 30, 60, and 90 min. Solubilization of lignocellulosic matter is expressed as a reduction in COD and an increase in SCOD concentration. The greatest changes could be seen in the initial minutes of the process at an inlet pressure of 3.5 bar, i.e., at 2, 5, and 10 min. For inlet pressures of 5.0 and 7.0 bar, the solubilization of lignocellulosic matter was significantly lower. The increase in the degree of degradation during HC of the herbal waste at an inlet pressure of 3.5 bar was due to the efficiency of organic matter removal, with an associated increase in VFA and phenolic contents. The VFA concentration for 3.5 bar increased by 21 and 10% after 60 and 10 min of HC, respectively, possibly indicating lipid degradation. For pressures of 5.0 and 7.0 bar, an increase in VFA concentration was also observed during the process. The highest values were obtained after 60 min of the process and were 18% and 14% for 5.0 and 7.0 bar, respectively. The release observed for an inlet pressure of 3.5 bar seems to confirm the improved biodegradability of herbal waste; moreover, it may indicate that HC is capable of converting certain hard-to-degrade compounds into forms which are more biodegradable. This is supported by other researchers who investigated HC as a method for wastewater pretreatment [32]. Dębowski et al. [33] used a hydrodynamic cavitation process to pretreat a substrate based on a mixture of cattle manure and milking station sludge, which was subsequently biologically stabilized. They observed an increase in the concentration of organic compounds in the dissolved phase, expressed as COD and VFAs. An increase in the phenol concentration with process duration was also observed. The higher the inlet pressure used, the higher the phenol release rate. The highest increase in phenol concentration was noted for 7.0 bar (from 35.5 to 44.5 mg L−1 in 60 min). For lower inlet pressures, the increase in the phenol concentration after 60 min of the process was 15% and 20% for 3.5 and 5.0 bar, respectively. The increase in the concentration of phenols may indicate the decomposition of lignin, which is very important for its conversion in biotechnological processes. Previous studies by the authors reported a decrease in hemicellulose, cellulose, and acid lignin content with the duration of the HC process. As for the increase in monosaccharides and phenols during the HC process, it is proportional to the decrease in hemicellulose and lignin contents [34]. The pH and alkalinity were also increased for each of the pressures analyzed, which may indicate improved buffering conditions. The biodegradability index (BI) of the herbal waste mixture suspended in wastewater increased for all analyzed inlet pressures. The highest values were obtained for a pressure of 3.5 bar, increasing from 0.36 to 0.47 after 10 min of the process. For pressures of 5 and 7 bar, the highest increases in the BI rate were obtained after 60 min. The BI increased from 0.26 to 0.32 and from 0.23 to 0.26 with 5 and 7 bar, respectively. These results were confirmed by Padoley et al. [35], who observed that hydrodynamic cavitation enhanced the biodegradability of distillery wastewater. Pretreatment under optimized conditions (at an inlet pressure of 13 bar) led to an increase in BI from 0.13 to 0.32 and reductions in the COD and TOC concentrations of 32.24% and 31.43%, respectively. Bis et al. [36] investigated the possibility of using hydrodynamic cavitation to improve the biodegradability of mature landfill leachate. At an inlet pressure of 7 bar, they observed the highest increase in the biodegradability index (BI) of about 22%, i.e., from a value of 0.046 to 0.056. Dhanke et al. [37] analyzed the effect of hydrodynamic cavitation on the increase in biodegradability of wastewater from the fish processing industry. The effect of operating pressure was determined in terms of the COD reduction and changes in BOD and BI values. Treatment was carried out at inlet operating pressures of 6 bar and 8 bar. With an inlet pressure of 8 bar applied, the COD value decreased with the duration of the experiment, and the reduction reached a peak value of 50% after 120 min. In the same manner, the BOD increased from 3250 mg/L to 3510 mg/L. The value of the biodegradability index increased to 0.35 from 0.25 in the first 40 min and finally reached a value of 0.55 after 160 min of running the process. It should be noted that the high biodegradability rate allows the efficient use of waste prepared in this way in the anaerobic digestion process. The results obtained indicate that using HC effects changes in the molecular structure of organic matter and can transform resistant organic substances into compounds characterized by greater biodegradability.
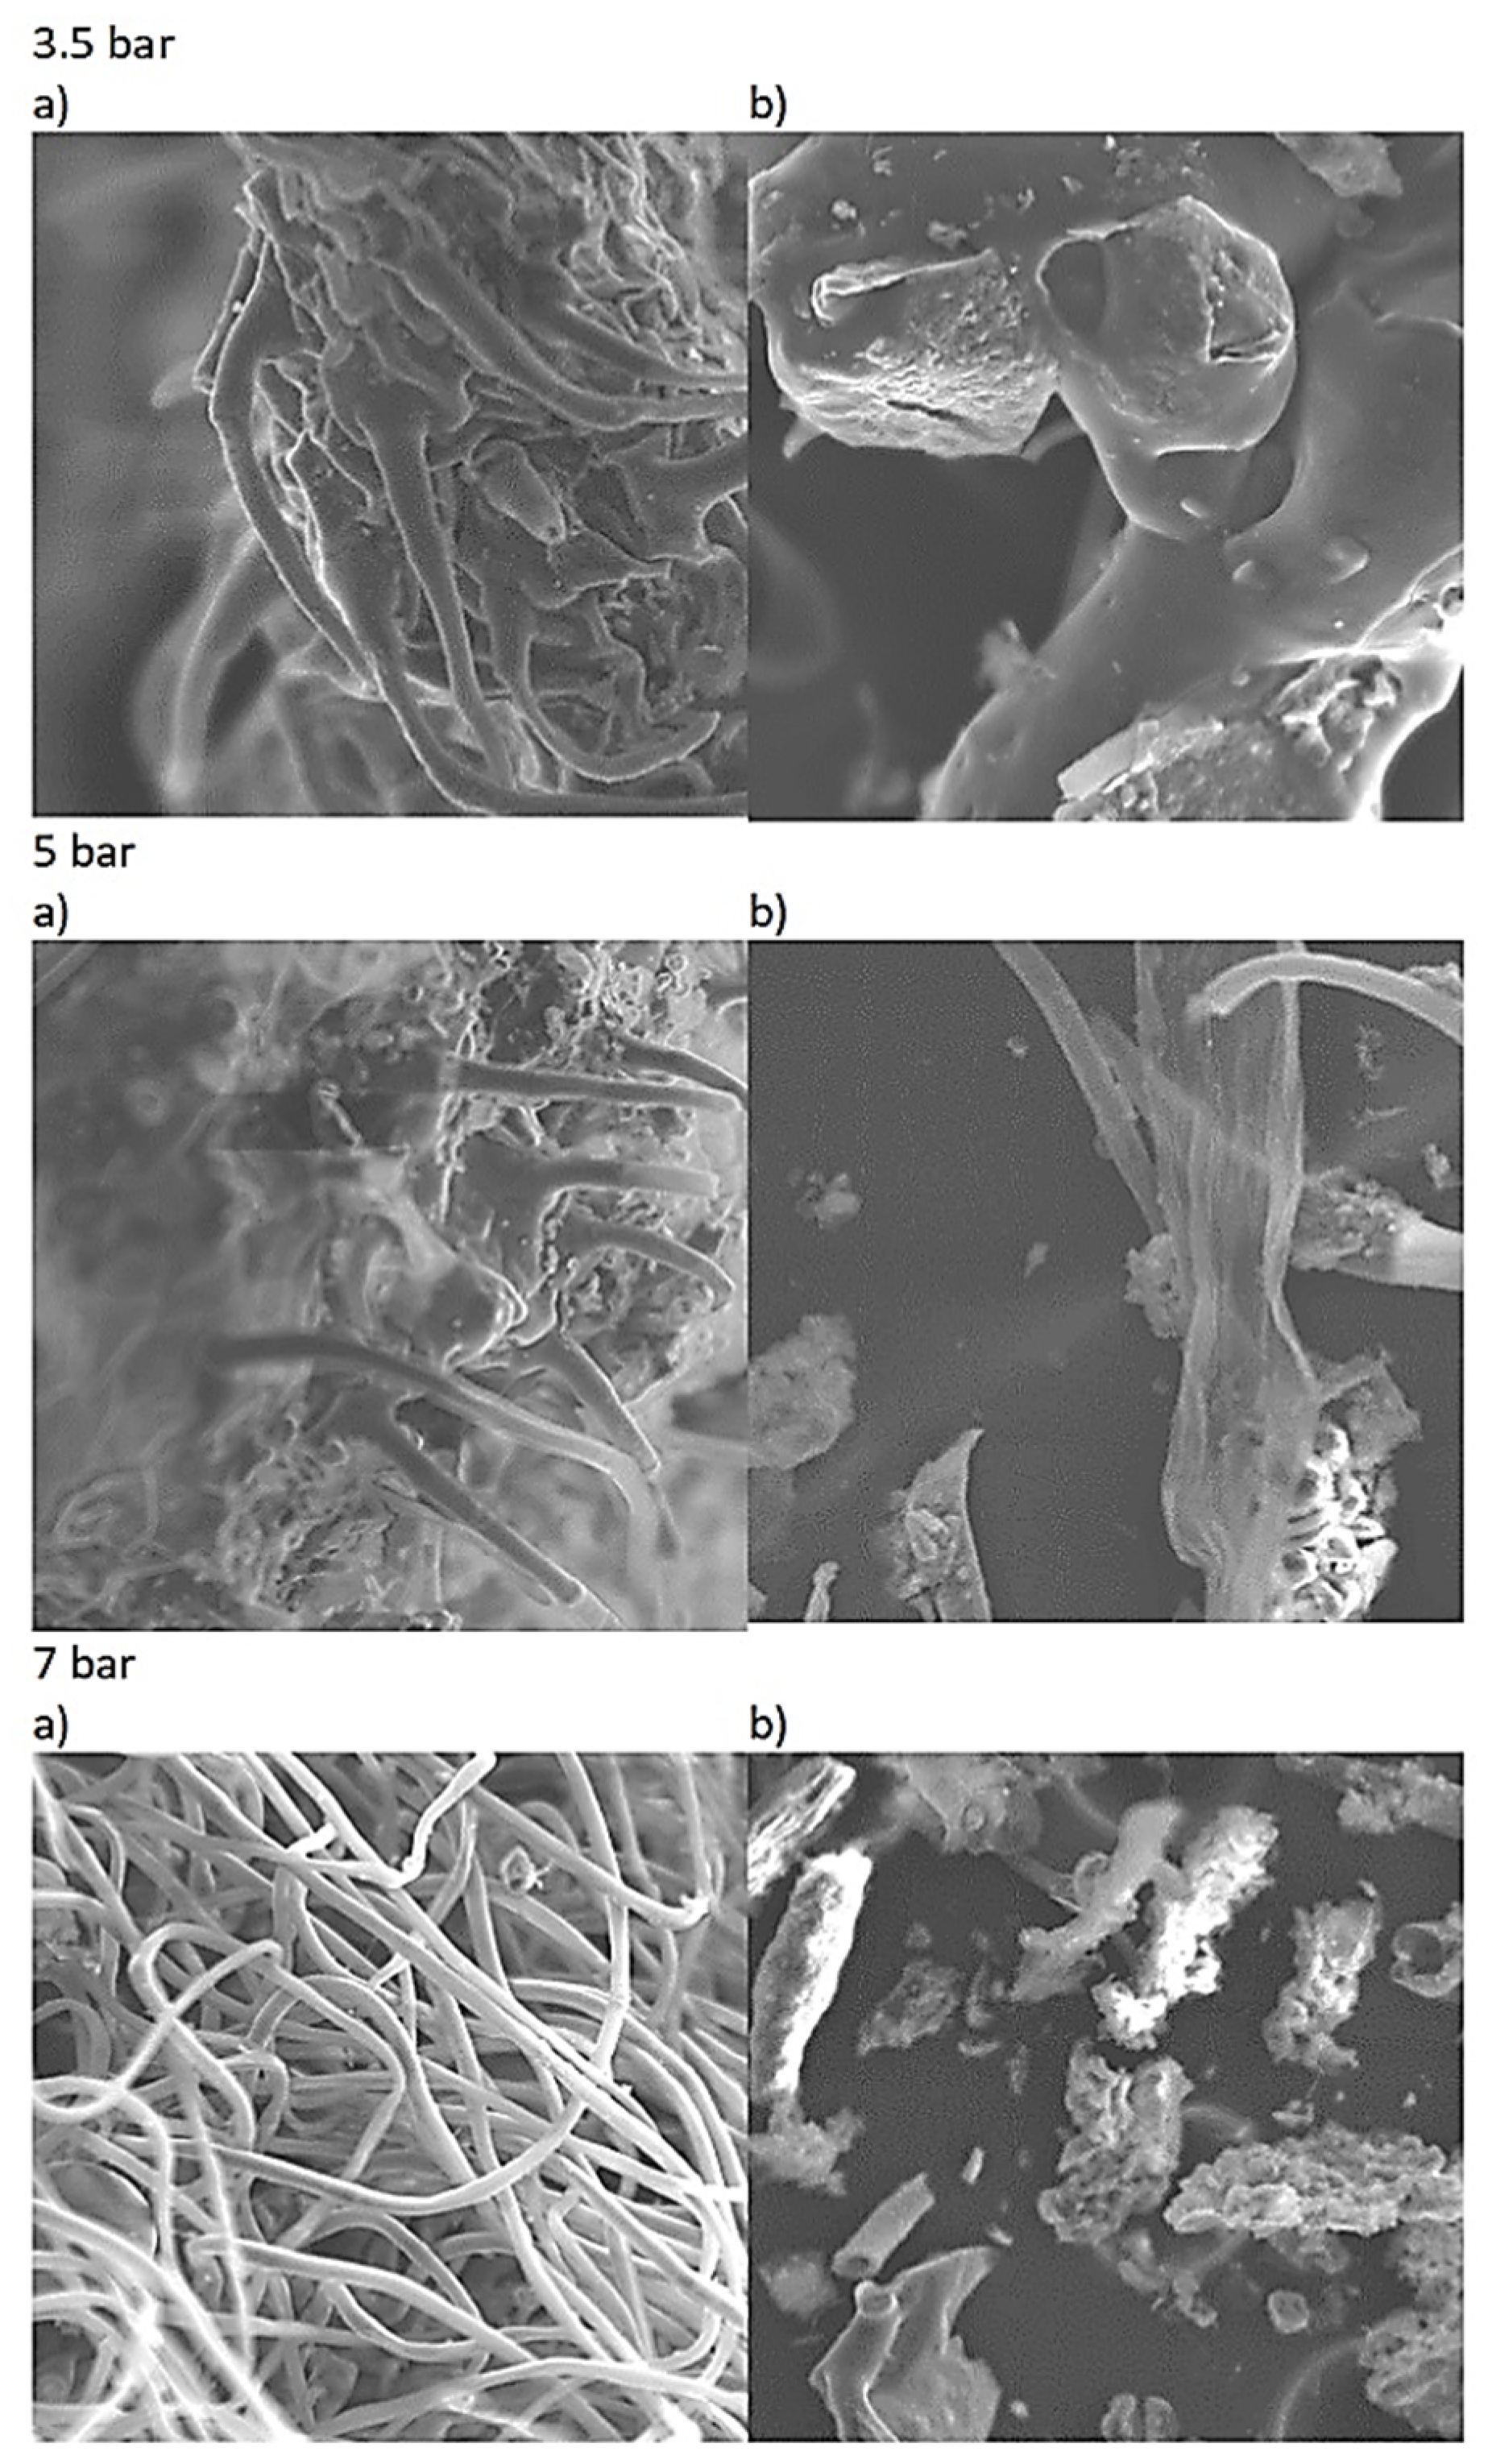
3.2. SEM Analysis—Morpological Structure
Changes in the morphological composition and surface topography of the mixture of herbal waste and wastewater before and after the cavitation process were analyzed by SEM (Figure 2).
This analysis is commonly used by researchers to determine the impact that various pretreatment methods have on the morphologies of lignocellulosic matter. SEM analysis of all samples before the cavitation process showed undisturbed and smooth surfaces (Figure 1a). However, following 60 min of pretreatment, holes began to appear on the surfaces and the structures were destroyed, which may have been caused by the removal of lignin (Figure 2b). This is confirmed by the study of Tahangavelu et al. [38], who used hydrodynamic cavitation and enzymatic pretreatment for delignification of corncob. Similar changes were also observed in sugarcane bagasse (SCB) treated by hydrodynamic cavitation, as described by Teran Hilares et al. [39]. The surface morphology of SCB was also analyzed using SEM images. The pretreated SCB had a characteristic loosened structure due to the destructive effects of cavitation (i.e., high-velocity microjets and shock waves). Grimaldi et al. [40] showed that the pretreatment of biomass contributes to lignin removal by two-stage cell wall destruction, loosening the bonds between adjacent cell walls as well as causing degradation within the cell wall through exfoliation and the formation of holes. Similar effects were achieved in the present study, which has significant implications for the subsequent biological processing of lignocellulosic matter.
3.3. Energy Balance
In order to evaluate the benefits of cavitation, it is necessary to consider the energy input as well as the further processing steps of cavitated substances, such as anaerobic decomposition. Determining the cavitation yield for the inlet pressures tested enabled the establishment of energy efficiency (Table 4). This quantity was determined based on the quantity of removed COD per total supplied energy. According to the data, the lowest consumption of power was observed at an inlet pressure of 3.5 bar. For the other analyzed pressures, the power consumption was higher, which was due to the much higher value of the inlet pressure and the higher value of the pressure resulting from the passage of the examined medium through the cavitation inducer. For all inlet pressures used, cavitation yields were highest in the initial minutes of running the process.
Considering the values of COD removed in the process, the most optimal values in terms of cavitation yield were obtained with an inlet pressure of 3.5 bar. The cavitation yield was 837.5 mg kJ−1 after 2 min, 220.5 mg kJ−1 after 5 min, and 120.9 mg kJ−1 after 10 min. After this time, the cavitation yield decreased to a value of 6.3 mg kJ−1 after 60 min. Achieving such high cavitation yields at the 2nd, 5th, and 10th minutes of the process provided an increase in BI values from 0.36 to 0.37 at the second minute and to 0.46 and 0.47 at the 5th and 10th minutes, respectively. For the other pressures analyzed, the high values of cavitation efficiency did not correspond to an increase in the biodegradability coefficient. It follows that in order to achieve the maximum BI and avoid unnecessary energy costs, one should run the HC process for 5 and a maximum of 10 min at an inlet pressure of 3.5 bar.
4. Conclusions
Using HC as a method of pretreatment affected the biodegradability rate of herbal waste suspended in wastewater. The highest BI values were recorded after 5 and 10 min of the process with an inlet pressure of 3.5 bar, and the biodegradability index increased by about 30% compared to the mixture before cavitation. Energy efficiency tests confirmed the results of the physicochemical analysis. To sum up, to increase the biodegradability of herbal waste using hydrodynamic cavitation, an inlet pressure of 3.5 bar and a cavitation time interval of 5 to 10 min are optimal. Increasing pressure beyond 3.5 bar becomes increasingly less effective at processing biomass.
Author Contributions
Conceptualization, M.L. and A.M.; methodology, M.L.; software, A.S.; validation, M.L., A.M. and A.S.; formal analysis, M.L. and A.S.; investigation, M.L., A.M. and A.S.; resources, M.L.; data curation, M.L.; writing—original draft preparation, M.L.; writing—review and editing, M.L. and A.S.; supervision, M.L. All authors have read and agreed to the published version of the manuscript.
Funding
This research was supported by the Polish Ministry of Science and Higher Education [research funding FD-20/IS-6/036, FD-20/IS-6/023, and FD-20/IS-6/020].
Data Availability Statement
The dataset is available on request from the authors.
Conflicts of Interest
The authors declare no conflicts of interest.
References
- Usmani, Z.; Sharma, M.; Awasthi, A.K.; Lukk, T.; Tuohy, M.G.; Gong, L.; Nguyen-Tri, P.; Goddard, A.D.; Bill, R.M.; Nayak, S.C.; et al. Lignocellulosic biorefineries: The current state of challenges and strategies for efficient commercialization. Renew. Sustain. Energy Rev. 2021, 148, 111258. [Google Scholar] [CrossRef]
- Abraham, A.; Mathew, A.K.; Park, H.; Choi, O.; Sindhu, R.; Parameswaran, B.; Pandey, A.; Park, J.H.; Sang, B.I. Pretreatment strategies for enhanced biogas production from lignocellulosic biomass. Bioresour. Technol. 2020, 301, 122725. [Google Scholar] [CrossRef] [PubMed]
- Roy, S.; Dikshit, P.K.; Sherpa, K.C.; Singh, A.; Jacob, S.; Chandra Rajak, R. Recent nanobiotechnological advancements in lignocellulosic biomass valorization: A review. J. Environ. Manag. 2021, 297, 113422. [Google Scholar] [CrossRef] [PubMed]
- Woiciechowski, A.L.; Dalmas Neto, C.J.; Porto de Souza, L.; Carvalho Neto, V.D.P.; Novak Sydney, A.C.; Letti, L.A.J.; Karp, S.G.; Zevallos Torres, L.A.; Soccol, C.R. Lignocellulosic biomass: Acid and alkaline pretreatments and their effects on biomass recalcitrance—Conventional processing and recent advances. Bioresour. Technol. 2020, 304, 122848. [Google Scholar] [CrossRef] [PubMed]
- Kumari, D.; Singh, R. Pretreatment of lignocellulosic wastes for biofuel production: A critical review. Renew. Sustain. Energy Rev. 2018, 90, 877–891. [Google Scholar] [CrossRef]
- Jönsson, L.J.; Martín, C. Pretreatment of lignocellulose: Formation of inhibitory by-products and strategies for minimizing their effects. Bioresour. Technol. 2016, 199, 103–112. [Google Scholar] [CrossRef] [PubMed]
- Mankar, A.R.; Pandey, A.; Modak, A.; Pant, K.K. Pretreatment of lignocellulosic biomass: A review on recent advances. Bioresour. Technol. 2021, 334, 125235. [Google Scholar] [CrossRef] [PubMed]
- Singh, R.; Kumar, R.; Sarangi, P.K.; Kovalev, A.A.; Vivekanand, V. Effect of physical and thermal pretreatment of lignocellulosic biomass on biohydrogen production by thermochemical route: A critical review. Bioresour. Technol. 2023, 369, 128458. [Google Scholar] [CrossRef] [PubMed]
- Tamilselvan, R.; Selwynraj, A.I. Enhancing biogas generation from lignocellulosic biomass through biological pretreatment: Exploring the role of ruminant microbes and anaerobic fungi. Anaerobe 2024, 85, 102815. [Google Scholar] [CrossRef]
- Abolore, R.S.; Jaiswal, S.; Jaiswal, A.K. Green and sustainable pretreatment methods for cellulose extraction from lignocellulosic biomass and its applications: A review. Carbohydr. Polym. Technol. Appl. 2024, 7, 100396. [Google Scholar] [CrossRef]
- Bharadwaj, A.V.S.L.S.; Dev, S.; Zhuang, J.; Wang, Y.; Yoo, C.G.; Jeon, B.-H.; Aggarwal, S.; Park, S.H.; Kim, T.H. Review of chemical pretreatment of lignocellulosic biomass using low-liquid and low-chemical catalysts for effective bioconversion. Bioresour. Technol. 2003, 368, 128339. [Google Scholar] [CrossRef] [PubMed]
- Meenakshisundaram, S.; Fayeulle, A.; Leonard, E.; Ceballos, C.; Pauss, A. Fiber degradation and carbohydrate production by combined biological and chemical/physicochemical pretreatment methods of lignocellulosic biomass—A review. Bioresour. Technol. 2021, 331, 125053. [Google Scholar] [CrossRef] [PubMed]
- Kuznetsov, B.N.; Sudakova, I.G.; Chudina, A.I.; Garyntseva, N.V.; Kazachenko, A.S.; Skripnikov, A.M.; Yuriy Malyar, Y.N.; Ivanov, I.P. Fractionation of birch wood biomass into valuable chemicals by the extraction and catalytic processes. Biomass Convers. Biorefin. 2024, 14, 2341–2355. [Google Scholar] [CrossRef]
- M’Arimi, M.M.; Mecha, C.A.; Kiprop, A.K.; Ramkat, R. Recent trends in applications of advanced oxidation processes (AOPs) in bioenergy production: Review. Renew. Sustain. Energy Rev. 2020, 121, 109669. [Google Scholar] [CrossRef]
- Prado, C.A.; Antunes, F.A.F.; Rocha, T.M.; Sánchez-Muñoz, S.; Barbosa, F.G.; Terán-Hilares, R.; Cruz-Santos, M.M.; Arruda, G.L.; da Silva, S.S.; Santos, J.C. A review on recent developments in hydrodynamic cavitation and advanced oxidative processes for pretreatment of lignocellulosic materials. Bioresour. Technol. 2022, 345, 126458. [Google Scholar] [CrossRef] [PubMed]
- Hamidi, R.; Damizia, M.; De Filippis, P.; Patrizi, D.; Verdone, N.; Vilardi, G.; de Caprariis, B. Recent developments and future outlooks of hydrodynamic cavitation as an intensification technology for renewable biofuels production. J. Environ. Chem. Eng. 2023, 11, 110819. [Google Scholar] [CrossRef]
- Verdini, F.; Calcio Gaudino, E.; Grillo, G.; Tabasso, S.; Cravotto, G. Cellulose Recovery from Agri-Food Residues by Effective Cavitational Treatments. Appl. Sci. 2021, 11, 4693. [Google Scholar] [CrossRef]
- Madison, M.J.; Coward-Kelly, G.; Liang, C.; Karim, M.N.; Falls, M.; Holtzapple, M.T. Mechanical pretreatment of biomass—Part I: Acoustic and hydrodynamic cavitation. Biomass Bioenergy 2017, 98, 135–141. [Google Scholar] [CrossRef]
- Song, X.; Hou, R.; Zhang, W.; Liu, J. Hydrodynamic cavitation as an efficient water treatment method for various sewage: A review. Water Sci. Technol. 2022, 86, 302–320. [Google Scholar] [CrossRef]
- Terán Hilares, R.; Sánchez Vera, F.P.; Colina Andrade, G.J.; Tejada Meza, K.; García, J.C.; Pacheco Tanaka, D.A. Continuous Cultivation of Microalgae in Cattle Slaughterhouse Wastewater Treated with Hydrodynamic Cavitation. Water 2022, 14, 1288. [Google Scholar] [CrossRef]
- Patil, P.B.; Gogate, P.R.; Csoka, L.; Dregelyi-Kiss, A.; Horvath, M. Intensification of biogas production using pretreatment based on hydrodynamic cavitation. Ultrason. Sonochem. 2016, 30, 79–86. [Google Scholar] [CrossRef] [PubMed]
- Lee, A.K.; Lewis, D.M.; Ashman, P.J. Microalgal cell disruption by hydrodynamic cavitation for the production of biofuels. J. Appl. Phycol. 2015, 27, 1881–1889. [Google Scholar] [CrossRef]
- Mevada, J.; Devi, S.; Pandit, A. Large scale microbial cell disruption using hydrodynamic cavitation: Energy saving options. Biochem. Eng. J. 2019, 143, 151–160. [Google Scholar] [CrossRef]
- Montusiewicz, A.; Pasieczna-Patkowska, S.; Lebiocka, M.; Szaja, A.; Szymańska-Chargot, M. Hydrodynamic cavitation of brewery spent grain diluted by wastewater. Chem. Eng. J. 2017, 313, 946–956. [Google Scholar] [CrossRef]
- Gągol, M.; Cako, E.; Fedorov, K.; Soltani, R.D.C.; Przyjazny, A.; Boczkaj, G. Hydrodynamic cavitation based advanced oxidation processes: Studies on specific effects of inorganic acids on the degradation effectiveness of organic pollutants. J. Mol. Liq. 2020, 307, 113002. [Google Scholar] [CrossRef]
- Mohod, A.V.; Silva Costa Teixeira, A.C.; Bagal, M.V.; Gogate, P.R.; Giudici, R. Degradation of organic pollutants from wastewater using hydrodynamic cavitation: A review. J. Environ. Chem. Eng. 2023, 11, 109773. [Google Scholar] [CrossRef]
- Kunz, P.; Wagner, S. Results and outlooks of investigations of sewage sludge disintegration. In Ergebnisse und Perspektive aus Untersuchungen zur Klärschlammdesintegration; AWT Abwassertechnik: Lauchhammer, Germany, 1994. [Google Scholar]
- Müller, J. Mechanical Disintegration of Sewage Sludge Mechanischer Klärschlammaufschluß-, Schriftenereihe “Berichte aus der Verfahrenstechnik” der Fakultät für Maschinenbau und Elektrotechnik der Universität Braunschweig; Shaker Verlag: Duren, Germany, 1996. [Google Scholar]
- Langone, M.; Ferrentino, R.; Trombino, G.; De Puiseau, D.W.; Andreottola, G.; Rada, E.C.; Ragazzi, M. Application of novel hydrodynamic cavitation system I wastewater treatment plants. UPB Sci. Bull. Ser. D 2015, 77, 225–234. [Google Scholar]
- Zieliński, M.; Dębowski, M.; Kazimierowicz, J.; Nowicka, A.; Dudek, M. Application of Hydrodynamic Cavitation in the Disintegration of Aerobic Granular Sludge—Evaluation of Pretreatment Time on Biomass Properties, Anaerobic Digestion Efficiency and Energy Balance. Energies 2024, 17, 335. [Google Scholar] [CrossRef]
- Gutiérrez-Mosquera, L.F.; Arias-Giraldo, S.; Zuluaga-Meza, A. Landfill leachate treatment using hydrodynamic cavitation: Exploratory evaluation. Heliyon 2022, 8, e09019. [Google Scholar] [CrossRef] [PubMed]
- Bhat, A.P.; Gogate, P.R. Cavitation-based pre-treatment of wastewater and waste sludge for improvement in the performance of biological processes: A review. J. Environ. Chem. Eng. 2021, 9, 104743. [Google Scholar] [CrossRef]
- Dębowski, M.; Kazimierowicz, J.; Nowicka, A.; Dudek, M.; Zieliński, M. The Use of Hydrodynamic Cavitation to Improve the Anaerobic Digestion of Waste from Dairy Cattle Farming—From Laboratory Tests to Large-Scale Agricultural Biogas Plants. Energies 2024, 17, 1409. [Google Scholar] [CrossRef]
- Lebiocka, M.; Montusiewicz, A.; Pasieczna-Patkowska, S.; Szaja, A. Pretreatment of herbal waste using sonication. Bioresour. Technol. 2023, 377, 128932. [Google Scholar] [CrossRef] [PubMed]
- Padoley, K.V.; Saharan, V.K.; Mudliar, S.N.; Pandey, S.N.; Pandit, A.B. Cavitationally induced biodegradability enhancement of a distillery wastewater. J. Hazard. Mater. 2012, 219–220, 69–74. [Google Scholar] [CrossRef] [PubMed]
- Bis, M.; Montusiewicz, A.; Ozonek, J.; Pasieczna-Patkowska, S. Application of hydrodynamic cavitation to improve the biodegradability of mature landfill leachate. Ultrason. Sonochem. 2015, 26, 378–387. [Google Scholar] [CrossRef] [PubMed]
- Dhanke, P.; Wagh, S.; Patil, A. Treatment of fish processing industry wastewater using hydrodynamic cavitational reactor with biodegradability improvement. Water Sci. Technol. 2019, 80, 2310–2319. [Google Scholar] [CrossRef]
- Thangavelu, K.; Desikan, R.; Taran, O.P.; Uthandi, S. Delignification of corncob via combined hydrodynamic cavitation and enzymatic pretreatment: Process optimization by response surface methodology. Biotechnol. Biofuels 2018, 11, 203. [Google Scholar] [CrossRef]
- Terán Hilares, R.; de Almeida, G.F.; Ahmed, M.A.; Antunes, F.A.F.; da Sliva, S.S.; Han, J.-I.; Santos, J.C.D. Hydrodynamic cavitation as an efficient pretreatment method for lignocellulosic biomass: A parametric study. Bioresour. Technol. 2017, 235, 301–308. [Google Scholar] [CrossRef]
- Grimaldi, M.P.; Marques, M.P.; Laluce, C.; Cilli, E.M.; Sponchiado, S.R.P. Evaluation of lime and hydrothermal pretreatments for efcient enzymatic hydrolysis of raw sugarcane bagasse. Biotechnol. Biofuels 2015, 8, 205. [Google Scholar] [CrossRef]
Figure 1.
Organization scheme of the experimental work.

Figure 2.
SEM images of HW and MPW mixture: (a) raw sample; (b) sample after 60 min of cavitation.


Table 1.
Parameters of the substrates and the mixture thereof (average values and standard deviations are included).
Table 1.
Parameters of the substrates and the mixture thereof (average values and standard deviations are included).
| Parameter | Unit | MTW | HW | Raw Mixture of HW and MTW | ||
|---|---|---|---|---|---|---|
| 3.5 Bar | 5 Bar | 7 Bar | ||||
| Biochemical oxygen demand (BOD5) | mg L−1 | 275 ± 23.6 | 1204 ± 194.4 | 1380 ± 245.2 | 1269 ± 210.2 | 1280 ± 171.3 |
| Chemical oxygen demand (COD) | mg L−1 | 491 ± 35.1 | 6395 ± 249.4 | 3837 ± 215.1 | 4951 ± 298.1 | 5800 ± 205.2 |
| Soluble chemical oxygen demand (sCOD) | mg L−1 | 415 ± 38.6 | 2720 ± 241.8 | 2476 ± 212.2 | 2505 ± 199.6 | |
| Volatile fatty acids (VFAs) | mg L−1 | 129 ± 42.1 | 1133 ± 50.1 | 937 ± 32.2 | 890 ± 30.5 | |
| Phenols | mg L−1 | 2.76 ± 0.38 | 40.8 ± 1.57 | 37.5 ± 1.45 | 35.5 ± 1.38 | |
| Alkalinity | mgCaCO3 L−1 | 462.1 ± 51.4 | 452 ± 19.9 | 502 ± 25.6 | 601 ± 30.1 | |
| pH | - | 6.68 ± 0.12 | 6.16 ± 0.07 | 6.42 ± 0.11 | 6.57 ± 0.09 | |
| Total solids (TSs) | g kg−1 | 0.97 ± 0.03 | 962 ± 108 | 6.36 ± 0.11 | 8.62 ± 0.12 | 9.48 ± 0.12 |
| Volatile solids (VSs) | g kg−1 | 0.32 ± 0.03 | 818 ± 102 | 4.89 ± 0.09 | 6.43 ± 0.09 | 7.67 ± 0.09 |
| Total carbon (TC) | mg L−1 | 241 ± 27.7 | 903.2 ± 20.8 | 949 ± 30.1 | 835 ± 33.7 | |
| Total organic carbon (TOC) | mg L−1 | 60 ± 5.5 | 746 ± 25.5 | 824 ± 31.8 | 720 ± 21.1 | |
| Acid detergent lignin (ADL) | %TSs | 10.3 ± 0.34 | ||||
| Cellulose | %TSs | 16.2 ± 0.41 | ||||
| Hemicellulose | %TSs | 5.53 ± 0.17 | ||||
| Monosaccharides | %TSs | 11.3 ± 0.29 | ||||
Table 2.
The cavitation number values and the number of passes through the cavitation zone for the analyzed inlet pressures.
Table 2.
The cavitation number values and the number of passes through the cavitation zone for the analyzed inlet pressures.
| Parameter | Unit | Inlet Pressure [Bar] | ||
| 3.5 | 5.0 | 7.0 | ||
| p2 | Pa | 96,286 | 95,132 | 95,879 |
| pv | Pa | 2063 | 2063 | 2063 |
| v0 | ms−1 | 41.59 | 54.75 | 77.38 |
| cv | -- | 0.11 | 0.06 | 0.03 |
| Time | Unit | Passes through the Cavitation Zone | ||
| 2 | min | 1.18 | 1.55 | 2.19 |
| 5 | min | 2.94 | 3.87 | 5.47 |
| 10 | min | 5.88 | 7.74 | 10.94 |
| 30 | min | 17.64 | 23.22 | 32.82 |
| 45 | min | 26.46 | 34.83 | 49.23 |
| 60 | min | 35.28 | 46.44 | 65.64 |
Table 3.
Changes in physicochemical indicators during HC at various pressures (average values and standard deviations are given).
Table 3.
Changes in physicochemical indicators during HC at various pressures (average values and standard deviations are given).
| Time | COD | sCOD | BOD5 | BI | TSs | VSs | TC | TOC | pH | VFAs | Alkalinity | Phenols |
|---|---|---|---|---|---|---|---|---|---|---|---|---|
| min | mg L−1 | mg L−1 | mg L−1 | - | g kg−1 | g kg−1 | mg L−1 | mg L−1 | - | mg L−1 | mg L−1 | mg L−1 |
| 3.5 bar | ||||||||||||
| 0 | 3837 ± 515.1 | 2720 ± 241.8 | 1380 ± 245.2 | 0.36 | 6.36 ± 0.11 | 4.89 ± 0.09 | 903 ± 35.1 | 746 ± 25.5 | 6.16 ± 0.07 | 1133 ± 50.1 | 452 ± 19.9 | 40.8 ± 1.57 |
| 2 | 3803 ± 497.5 | 2990 ± 239.5 | 1391 ± 212.9 | 0.37 | 6.26 ± 0.09 | 4.31 ± 0.08 | 863 ± 29.7 | 741 ± 24.9 | 6.67 ± 0.09 | 1145 ± 49.7 | 476 ± 19.5 | 41.0 ± 1.68 |
| 5 | 3740 ± 480.5 | 3104 ± 228.1 | 1718 ± 238.9 | 0.46 | 5.36 ± 0.11 | 3.96 ± 0.09 | 888 ± 31.2 | 737 ± 28.7 | 6.8 ± 0.08 | 1174 ± 60.2 | 485 ± 20.2 | 42.4 ± 1.58 |
| 10 | 3640 ± 492.5 | 3216 ± 238.7 | 1699 ± 201.7 | 0.47 | 5.69 ± 0.10 | 3.22 ± 0.10 | 871 ± 33.4 | 715 ± 30.5 | 6.85 ± 0.09 | 1250 ± 70.5 | 508 ± 20.6 | 43.5 ± 1.79 |
| 30 | 3570 ± 452.1 | 3297 ± 249.1 | 1499 ± 198.8 | 0.42 | 5.66 ± 0.08 | 3.37 ± 0.11 | 883 ± 32.7 | 712 ± 26.7 | 6.97 ± 0.10 | 1290 ± 55.9 | 515 ± 17.9 | 43.9 ± 1.80 |
| 45 | 3437 ± 398.5 | 3313 ± 248.5 | 1452 ± 186.7 | 0.42 | 5.28 ± 0.12 | 3.09 ± 0.09 | 896 ± 31.0 | 711 ± 27.8 | 7.07 ± 0.11 | 1299 ± 56.7 | 565 ± 20.8 | 46.2 ± 1.75 |
| 60 | 3447 ± 397.6 | 3173 ± 229.6 | 1478 ± 182.2 | 0.43 | 4.80 ± 0.09 | 2.48 ± 0.08 | 870 ± 29.5 | 713 ± 30.9 | 7.2 ± 0.10 | 1372 ± 42.9 | 598 ± 19.8 | 46.7 ± 1.87 |
| 5 bar | ||||||||||||
| 0 | 4951 ± 298.1 | 2476 ± 212.2 | 1269 ± 210.2 | 0.26 | 8.62 ± 0.12 | 6.43 ± 0.09 | 949 ± 30.1 | 824 ± 31.8 | 6.42 ± 0.11 | 937 ± 32.2 | 502 ± 25.6 | 37.5 ±1.45. |
| 2 | 4858 ± 277.6 | 2444 ± 207.6 | 1329 ± 195.8 | 0.27 | 8.66 ± 0.10 | 6.87 ± 0.07 | 909 ± 29.7 | 760 ± 33.1 | 6.58 ± 0.09 | 945 ± 29.7 | 525 ± 18.9 | 37.8 ± 1.50 |
| 5 | 4863 ± 285.4 | 2554 ± 209.5 | 1303 ± 201.4 | 0.27 | 7.80 ± 0.08 | 5.33 ± 0.08 | 911 ± 28.5 | 797 ± 29.7 | 6.60 ± 0.10 | 964 ± 30.3 | 548 ± 20.8 | 39.9 ± 1.52 |
| 10 | 4813 ± 264.7 | 2568 ± 210.5 | 1352 ± 204.6 | 0.28 | 7.77 ± 0.09 | 5.36 ± 0.04 | 925 ± 29.6 | 778 ± 30.5 | 6.69 ± 0.09 | 994 ± 35.6 | 589 ± 19.8 | 41.9 ± 1.49 |
| 30 | 4767 ± 225.4 | 2689 ± 200.9 | 1317 ± 213.5 | 0.28 | 7.37 ± 0.12 | 5.20 ± 0.07 | 896 ± 27.8 | 743 ± 28.4 | 6.82 ± 0.08 | 909 ± 37.8 | 601 ± 17.8 | 43.8 ± 1.47 |
| 45 | 4744 ± 298.1 | 2651 ± 212.6 | 1345 ± 209.9 | 0.28 | 7.17 ± 0.11 | 5.56 ± 0.05 | 894 ± 30.2 | 730 ± 24.4 | 6.88 ± 0.08 | 1043 ± 40.1 | 612 ± 20.1 | 44.6 ± 1.39 |
| 60 | 4257 ± 278.9 | 2595 ± 215.9 | 1349 ± 210.1 | 0.32 | 6.97 ± 0.07 | 4.45 ± 0.07 | 859 ± 35.5 | 711 ± 28.7 | 6.99 ± 0.10 | 1110 ± 41.1 | 642 ± 19.8 | 45.1 ± 1.42 |
| 7 bar | ||||||||||||
| 0 | 5800 ± 205.2 | 2505 ± 199.6 | 1280 ± 171.3 | 0.23 | 9.48 ± 0.12 | 7.67 ± 0.09 | 835 ± 33.7 | 720 ± 21.1 | 6.57 ± 0.09 | 890 ± 30.5 | 601 ± 30.1 | 35.5 ± 1.38 |
| 2 | 5733 ± 207.9 | 2319 ± 197.5 | 1297 ± 118.5 | 0.23 | 9.28 ± 0.13 | 7.38 ± 0.11 | 763 ± 30.4 | 645 ± 19.8 | 6.76 ± 0.11 | 892 ± 29.9 | 612 ± 25.1 | 36.3 ± 1.35 |
| 5 | 5724 ± 210.1 | 2424 ± 195.7 | 1305 ± 116.9 | 0.23 | 9.13 ± 0.14 | 7.61 ± 0.12 | 769 ± 31.2 | 645 ± 20.1 | 6.83 ± 0.12 | 896 ± 31.7 | 628 ± 22.2 | 36.5 ± 1.40 |
| 10 | 5684 ± 209.5 | 2489 ± 198.2 | 1331 ± 202.2 | 0.23 | 8.79 ± 0.10 | 7.08 ± 0.10 | 750 ± 29.9 | 635 ± 22.9 | 6.91 ± 0.09 | 921 ± 32.5 | 638 ± 21.8 | 40.2 ± 1.65 |
| 30 | 5661 ± 204.5 | 2529 ± 189.5 | 1364 ± 199.5 | 0.24 | 8.60 ± 0.09 | 7.09 ± 0.09 | 759 ± 30.6 | 635 ± 23.7 | 7.07 ± 0.11 | 938 ± 33.5 | 651 ± 23.9 | 41.5 ± 1.35 |
| 45 | 5531 ± 203.1 | 2575 ± 192.4 | 1382 ± 189.5 | 0.25 | 8.53 ± 0.11 | 7.08 ± 0.11 | 761 ± 29.8 | 637 ± 25.4 | 7.20 ± 0.10 | 992 ± 35.8 | 678 ± 29.7 | 42.7 ± 1.39 |
| 60 | 5297 ± 201.9 | 2680 ± 189.9 | 1395 ± 190.5 | 0.26 | 8.48 ± 0.11 | 7.07 ± 0.12 | 738 ± 30.5 | 623 ± 20.7 | 7.26 ± 0.11 | 1016 ± 36.9 | 695 ± 29.1 | 44.5 ± 1.42 |
Table 4.
The cavitation yields at inlet pressures of 3.5, 5.0, and 7.0 bar.
| Time | Electrical Power Consumption | Energy Efficiency—Total Energy Supplied | Power Density | COD Removed | Cavitation Yield |
|---|---|---|---|---|---|
| min | Js−1 | kJ | kJ ml−1 | mg mL−1 | mg kJ−1 |
| 3.5 bar | |||||
| 2 | 20 | 2.4 | 0.00008 | 0.067 | 837.5 |
| 5 | 44 | 13.2 | 0.00044 | 0.097 | 220.5 |
| 10 | 81.5 | 48.9 | 0.00163 | 0.197 | 120.9 |
| 30 | 259 | 466.2 | 0.01554 | 0.267 | 17.2 |
| 45 | 389 | 1050.3 | 0.03050 | 0.4 | 11.4 |
| 60 | 519 | 1868.4 | 0.06228 | 0.39 | 6.3 |
| 5 bar | |||||
| 2 | 25 | 3 | 0.0001 | 0.093 | 930.0 |
| 5 | 57 | 17.1 | 0.00057 | 0.088 | 154.4 |
| 10 | 114 | 68.4 | 0.0028 | 0.138 | 60.5 |
| 30 | 343 | 617.4 | 0.02058 | 0.184 | 8.9 |
| 45 | 515 | 1390.4 | 0.04635 | 0.207 | 4.5 |
| 60 | 687 | 2473.2 | 0.08244 | 0.694 | 8.4 |
| 7 bar | |||||
| 2 | 35 | 4.2 | 0.00014 | 0.067 | 478.6 |
| 5 | 77 | 23.1 | 0.00077 | 0.076 | 98.7 |
| 10 | 154 | 92.4 | 0.00308 | 0.116 | 37.7 |
| 30 | 463 | 833.4 | 0.02778 | 0.139 | 5.0 |
| 45 | 694 | 1873.8 | 0.06246 | 0.269 | 4.3 |
| 60 | 925 | 3330 | 0.11100 | 0.503 | 4.5 |
Disclaimer/Publisher’s Note: The statements, opinions and data contained in all publications are solely those of the individual author(s) and contributor(s) and not of MDPI and/or the editor(s). MDPI and/or the editor(s) disclaim responsibility for any injury to people or property resulting from any ideas, methods, instructions or products referred to in the content. |
© 2024 by the authors. Licensee MDPI, Basel, Switzerland. This article is an open access article distributed under the terms and conditions of the Creative Commons Attribution (CC BY) license (https://creativecommons.org/licenses/by/4.0/).
Share and Cite
MDPI and ACS Style
Lebiocka, M.; Montusiewicz, A.; Szaja, A. Effect of Inlet Pressure on the Biodegradability Index of Cavitated Herbal Waste. Energies 2024, 17, 2023. https://0-doi-org.brum.beds.ac.uk/10.3390/en17092023
AMA Style
Lebiocka M, Montusiewicz A, Szaja A. Effect of Inlet Pressure on the Biodegradability Index of Cavitated Herbal Waste. Energies. 2024; 17(9):2023. https://0-doi-org.brum.beds.ac.uk/10.3390/en17092023
Chicago/Turabian StyleLebiocka, Magdalena, Agnieszka Montusiewicz, and Aleksandra Szaja. 2024. "Effect of Inlet Pressure on the Biodegradability Index of Cavitated Herbal Waste" Energies 17, no. 9: 2023. https://0-doi-org.brum.beds.ac.uk/10.3390/en17092023
Note that from the first issue of 2016, this journal uses article numbers instead of page numbers. See further details here.