Article

Numerical Analysis of the Plantar Pressure Points during the Stance Phases for the Design of a 3D-Printable Patient-Specific Insole

by
Jesus Alejandro Serrato-Pedrosa
1,*,
Guillermo Urriolagoitia-Sosa
1,*,
Beatriz Romero-Ángeles
1,*,
Francisco Carrasco-Hernández
2,
Francisco Javier Gallegos-Funes
1,
Alfonso Trejo-Enriquez
1,
Alfredo Carbajal-López
1,
Jorge Alberto Gomez-Niebla
1,
Martin Ivan Correa-Corona
1 and
Guillermo Manuel Urriolagoitia-Calderón
1
1
Instituto Politécnico Nacional, Escuela Superior de Ingeniería Mecánica y Eléctrica, Sección de Estudios de Posgrado e Investigación, Unidad Profesional Adolfo López Mateos, Edificio 5, 2do, Piso, Biomechanics Group, Col. Lindavista, Del. Gustavo A. Madero, Ciudad de México 07320, Mexico
2
Universidad Tecnológica de Durango, Departamento Académico de Mecatrónica y Energías Renovables, Carretera Durango—Mezquital km 4.5 s/n, Gabino Santillán, Durango C.P. 34308, Mexico
*
Authors to whom correspondence should be addressed.
Submission received: 2 March 2024 / Revised: 18 April 2024 / Accepted: 22 April 2024 / Published: 26 April 2024
(This article belongs to the Special Issue Recent Advances in Foot Prosthesis and Orthosis)

Abstract

:
The study of the phenomena occurring in the plantar region is remarkably intriguing, especially when performing a normal gait cycle where the foot is under loading conditions. The effects presented in the foot while walking provide relevant indicators regarding clinical means for enhancing regular performance or rehabilitation therapies. Nevertheless, more than traditional methods are needed to biomechanically evaluate foot structural conditions, leading to an incomplete database for determining the patient’s needs so that advanced methodologies provide detailed medical assessment. Therefore, it is necessary to employ technological engineering tools to optimize biomechanical plantar pressure evaluations to reach suitable personalized treatments. This research initially evaluated numerically the pressure points in the foot sole region in each one of the five stance phases in a normal gait cycle. Medical imaging techniques were utilized to construct an anatomically accurate biomodel of the soft tissues of the right foot. The Finite Element Method was employed to predict peak plantar pressure in barefoot conditions for all stance phases; results from this case study presented a close alignment with gait experimental testing implemented to analyze the feasibility and validation of all mechanical considerations for the numerical analyses. Hence, having a solid foundation in the biomechanical behavior from the first case study close estimates, a 3D-printable patient-specific insole was designed and numerically analyzed to observe the mechanical response in the plantar critical zones utilizing a personalized orthotic device. Results from the second case study notably demonstrated a crucial decrement in excessive pressure values. Employing morphological customization orthopedics modeling combined with 3D-printable materials is revolutionizing assistive device design and fabrication techniques. The fundamental contribution of this research relies on deepening the knowledge of foot biomechanics from an interdisciplinary approach by numerically analyzing pressure distribution in critical regions for all five stances phases; thus, based on the methods employed, the results obtained contribute to the advances of patient-specific foot orthopedics.

1. Introduction

Accurately identifying plantar contact and pressure distribution is of great interest to clinicians and researchers in evaluating foot functions, human movement, and posture, which is considered indispensable to understanding its effects on the gait of the human body [1,2,3,4]. Human gait is considered an essential physiological activity for every individual, to the point of being compared to breathing or sleeping [5]. Briefly explained, the gait cycle is divided into two phases: the stance and swing phases, representing 60% and 40% of the total human gait, respectively. The stance phase is subdivided into five different stages. When the foot initially has contact with the ground, it is known as the heel strike phase. Once it has made contact, the foot progressively descends towards the ground to have a foot flat, which is the loading response stage. Next is the mid-stance position, where the body tilts forward, with the ankle joint as the pivot and the hip joint on top. Heel rise occurs when the forefoot area comes into contact directly to propel the body. Finally, when part of the toes is the only area in contact with the ground, the end of the stance phase is commonly referred to as toe-off or pre-swing [6,7,8,9]. The analysis of the distribution of pressure points in the foot under this activity facilitates the understanding of its functionality and the ability of the foot to adapt to different surfaces and conditions. The comprehension of how a foot distributes pressure and adjusts to each step provides valuable insights into a primary data source in gait and posture analysis; foot pressure reveals the otherwise challenging to analyze biomechanical effects occurring at the interface between the foot and the supporting surface, enabling the evaluation of underlying musculoskeletal behavior [10,11,12].
From a biomechanical approach, stresses and strains generated in each position and movement during normal walking set the standard for predicting a possible tendency to develop foot pathologies [13,14,15,16,17]. The employment of numerical simulations marks a turning point in analyzing human anatomy behavior in various scenarios and the prosthetic and orthotic design [18,19,20,21]. Regarding foot healthcare and footwear production, this shift promises a future where efficiency and cost-optimization reign supreme over conventional experimental testing to meet truly personalized insole construction demands [22,23]. In addition, an increasing technological trend is guiding the path toward a more sustainable and innovative production of foot orthotics by implementing additive manufacturing [24,25,26].
Foot orthoses have always been a mainstay in podiatric treatment and have conventionally been manufactured using a cast-and-mold approach. However, recent advancements in 3D printing technology offer the potential for patient-specific, customizable insoles. The study and research of foot insole construction through additive manufacturing materials are of great interest to the scientific community to replicate and enhance the mechanical behavior of standard orthoses [27,28,29]. Throughout the literature, different 3D-printable material testing has been conducted to compare the mechanical behavior to reproduce shock-absorbing effects, polymers such as polylactic acid (PLA), acrylonitrile butadiene styrene (ABS), polyamide filaments (NYLON), polyamide (PA), and thermoplastic polyurethane (TPU) are the printing materials most studied and employed for footwear purposes [30,31,32]. An optimized mechanical response along with the highest standard for comfort are the main aims of current 3D-printing technologies for foot insole design; a combination of novel approaches in infill percentages, infill matrix patterns, combined material structures, and numerical analyses [33,34,35,36,37,38] have improved traditional hand-made workflows in orthopedic devices. Another crucial aspect of the recent advancements in 3D-printed patient-specific insoles is 3D scanning technology, which allows the acquisition of more precise anthropometric data, resulting in advantages in time and accuracy to obtain a detailed three-dimensional copy that meets the actual morphology of such a complex geometry of the human body [39,40,41] over traditional foot plaster models and conventional measurement techniques that lack data consistency due to utilizing diverse procedures and different measurement instruments for foot dimension evaluation [42,43,44]. These increasingly technological methods have revolutionized the ergonomics and footwear industry and have significantly impacted clinical applications since they provide cutting-edge advancements in tangible solutions to musculoskeletal disorders [45,46,47,48]. The capability of 3D modeling and printing of foot orthoses have provided promising prospects for improving patient care of all ages, conditions, and activities. Clinical studies investigating 3D-printed insoles in specific applications are being developed more frequently, with promising results emerging in sports performance enhancement, elderly populations, children’s feet, and pathological feet. These studies have promoted the understanding, diagnosis, and treatment of specific musculoskeletal conditions by applying engineering principles, such as reverse engineering [49,50,51,52,53,54].
Therefore, a comprehensive study that accurately quantifies peak plantar pressure during a normal gait cycle performing all stance phases is crucial to deepening into weight bearing and pressure distribution foot functions, revolutionizing a worldwide approach to foot health management and enabling further precise interventions to individual needs. Consequently, this leads to personalized foot health care flourishment and fully customized foot orthotic devices based on the accurate morphology of the individual [55,56,57]. Through the Finite Element Method, it is possible to obtain and analyze plantar distribution numerically in detail during the different stance phases of the gait cycle. This multifaceted approach promises to significantly advance the understanding of foot pressure points while performing all stance phases during a normal gait, aiming to develop more effective and personalized plantar orthoses.
This study seeks to delve deeper into the interactions among foot soft tissues, pressure points, and orthosis-relieving properties. To employ Finite Element analyses, a 3D anatomical model with high-fidelity detail is generated through established medical imaging techniques [19]. Such models offer the distinct advantage of capturing the complex geometrical features of human biological systems, enabling detailed analysis and insights not readily achievable through traditional 2D representations. This current research is focused on numerically analyzing stance phases for barefoot plantar pressure validated with experimental testing to design a fully customized foot orthosis for numerically evaluating the biomechanical effects in the sole region utilizing the orthopedic device, where the level of complexity to understanding foot-insole plantar effects challenges experimental testing, which commonly yields to insufficient and poorly explained data for accurate foot function diagnosis. Likewise, this manuscript can provide a different innovative approach to gait patterns, optimize foot health, and enhance the quality of life for individuals requiring plantar support.

2. Materials and Methods

2.1. Biomodel Construction

The 3D foot model was developed on a 30-year-old male Mexican adult exhibiting apparent health status through a computed tomography (CT) scan. Additionally, the patient presented a standard body mass index and foot morphology (Figure 1a). Subsequently, image acquisition, visualization, and segmentation of the DICOM data for 3D model construction were conducted. The biomodel reconstruction process corresponds to a previous study conducted [58]. The segmentation process mainly focused on reconstructing two critical soft tissue structures, the intrinsic foot muscles and the skin, and profoundly comprehending the biomechanical analysis of pressure points on the plantar surface. Intrinsic foot musculature contributes to postural maintenance and shock absorption functions by employing its stabilizing actions [59]. Due to the high concentration of multiple tissue layers and the anatomical variance within the intrinsic muscle group, the modeling approach was represented as a unified encapsulated body.
The segmentation process was initially performed utilizing the medical software Simpleware ScanIP® (version 3.2 Build 1) (Figure 1b). Once this process has been appropriately conducted, solidification and smoothing of elements created were applied to the biological model to optimize its complex geometry, hence acquiring a more realistic morphology. A re-meshing was also generated in the biomodel, resulting in a computationally efficient mesh structure better suited for further discretization. All computational procedures were conducted within the Materialise 3-Matic® software (version 21.0) (Figure 1c).
The complex biomodel was finally exported to Finite Element Analysis software ANSYS Workbench® (version 2021 R1 student) (Figure 1d), where the type of mechanical analysis to be developed was defined, the mechanical properties of the biological elements were applied, the geometries were discretized, and boundary conditions and the application of external agents were established (Figure 1e).
As mentioned above, the steps explained correspond to the Finite Element software preprocessing stage, which, once completed, generates a convergence of the partial differential equations towards a result to obtain the solution of the biomodel and finally visualize the mechanical behavior obtained (Figure 1f).

2.2. Gait Experimental Baropodometric Testing

The present study employed the FreeSTEP® software (version v.1.4.01) and the Professional 180 cm × 50 cm Platform baropodometer for quantifying pressure points during a gait cycle analysis. This pressure-measuring device utilizes a matrix of resistive sensors equipped with 24 K gold conductors and an insulating coating capable of registering data at a frequency of up to 500 Hz. Notably, the system captures three pressure traces per complete step, enhancing the resolution and depth of information regarding the impact of ground reaction forces in the plantar region. This high data acquisition rate enabled the capture of approximately 400 frames per second, dynamically adapting to the patient’s walking rhythm or speed throughout the study. The patient walked barefoot several times at a comfortable and average pace to obtain a representative regular gait pattern. The program automatically divided the pressure zone on the soles of the feet. Feet were sectioned into eight anatomical regions, mainly separating the rearfoot, midfoot, and forefoot. Automatic sectioning allowed the adequate limit of each stance phase to define the boundary conditions for the numerical analysis. A baropodometric platform system was selected to perform experimental testing over in-shoe systems since they provide accurate fundamental data to evaluate barefoot pressure distribution conditions, guiding to adequate insole design. In addition, in-shoe systems may lead to discomfort, alter gait patterns due to the sensors, and change foot pressure profile effects. Also, sensor size limitations can affect spatial resolution [17,60,61,62,63].

2.3. Finite Element Analyses Simulating the Stance Phases of the Gait Cycle

2.3.1. First Case Study

The assignment of mechanical properties to the model corresponds to valuable insights found in biomechanical literature by Luboz for the muscle-encapsulated tissue and skin mechanical properties [64]. Moreover, ground reaction forces in the plantar region were produced by employing a rigid plate [65]. The mechanical properties values can be seen in Table 1. To achieve high fidelity in results, the Finite Element model discretization was employed with high-order 3D solid elements with 20 nodes per element. The analysis encompasses three distinct regions: skin, encapsulated muscle mass, and plate. Through a combination of fine and semi-controlled meshing techniques, a total of 371,120 elements and 196,576 nodes were generated.
To numerically study the gait using the biological model of the patient utilizing the Finite Element Method, five different numerical studies corresponding to the five stance phases that the foot undergoes during a normal gait are considered.
Once the angles and orientation of the foot were determined for each stance phase according to the experimental analysis, the boundary conditions for foot position were assigned according to the position the foot took for each one of the phases. Furthermore, the model incorporates embedded regions in the upper and medial-lateral zones to ensure realistic biomechanical behavior. These embedded regions are surrounded by constraint regions, simulated by 2-mm-wide tapes relative to the foot dimensions. This approach prevents unrealistic lateral displacement during load application. Similarly, constraints in the instep and toe area restrict excessive vertical loading transfer. These boundary embedding conditions were considered since no bony tissues were re-constructed to focus more on soft tissue mechanical behavior. Likewise, these constraint considerations provide structural integrity in the model, replicating osseous tissue function, thus avoiding unrealistic deformations in the model. Applying this mechanical approach has successfully evaluated plantar pressure distribution in a previous study [58].
As an external agent, the rigid plate was set to apply a vertical displacement that simulates the effects of ground reaction forces on the plantar surface. According to the medical-experimental literature, it is recorded that between 1–2 mm of additional displacement is generated in the skin of the foot sole according to the degree of dorsiflexion and plantar flexion [66]. On the other hand, another study showed a similar displacement of 1–3 mm in the forefoot in the dorsiflexion of the toes during the pre-swing phase [67]. Even in different investigations, ranges between 6 and 10 mm were used as indentation elements on the forefoot side to evaluate the heel response [68]; a range between 10 and 14 mm [69] was also tested. Using ultrasound and ultrasound scans, stretching on the skin of the sole up to 10 mm was appreciated in the areas of contact of the foot with the ground during walking [70]. Therefore, according to these considerations from experimental literature, vertical displacements between 5.5 and 8.5 mm were applied for the respective stance phases. Once the parameters necessary to determine the application of the external agent for each stance phase were analyzed, a vertical displacement of 6 mm was used to simulate the effects of the ground reaction forces. Likewise, the position and orientation of the foot in that phase obtained from the experimental analysis were used. Figure 2a represents the loading and boundary conditions for which the numerical solution was developed for the heel strike stance phase. The same constraints were used to assign boundary conditions for the loading response stage; a vertical displacement of 7 mm was implemented to analyze this stance phase (Figure 2b). A vertical displacement of 5.5 mm was employed as an external agent for the mid-stance position (Figure 2c). The assignment for the external agent corresponds to a vertical displacement of 8 mm to analyze the heel rise phase. Likewise, the constraints previously used were also considered (Figure 2d). To simulate the pre-swing phase, which is where most plantar pressure is generated, a vertical displacement of 8.5 mm was applied (Figure 2e). Furthermore, a coefficient of friction of 0.6 between the foot and ground was included, complementing loading and boundary conditions parameters [71].

2.3.2. Second Case Study

A personalized 3D-designed full-length total contact insole assigned with thermoplastic polyurethane (TPU) properties was employed to analyze the biomechanical behavior and attenuation effects of peak plantar pressure contact points within patient-specific orthopedic footwear under identical anatomical positioning and mechanical principles, simulating all five stance phases of the gait cycle. This inclusion reflects the common practice of orthotic devices, where the insole’s cushioning properties absorb a significant portion of ground reaction forces [72]. The medical foundation on the plantar region studies shows that parametrically modeled insoles demonstrably influence optimal biomechanical behavior [73,74].
Therefore, the selection of TPU as the insole material was considered after analyzing various research highlighting its advantageous characteristics. Notably, its printability through fused deposition modeling (FDM) aligns with the principles of additive manufacturing [75,76], offering cost-effective and customizable 3D-printed solutions [77]. Furthermore, TPU boasts ideal mechanical strength conducive to outstanding cushioning effects and excessive pressure relief. An extensive review of existing methodologies was conducted to create the 3D-designed orthotic insole; the methodology was mainly focused on the patient’s specific right foot geometry. The employment of accurate foot morphology from the re-constructed biomodel provided unique data to meet absolute customization in the design process; SpaceClaim® CAD software (version 2021 R1 student) was utilized for the custom foot orthotic design.
The acquisition of foot morphology as the establishment for the design of personalized footwear principals has been used and stated in various research as a crucial parameter to optimize insole design [58,78,79,80]. Personalized insole design process workflow is represented in Figure 3.
Likewise, the right foot biomodel, a re-meshing of elements, was performed on the customized insole, computationally optimizing the discretization process for numerical analysis needs with uniform elements. Discretization was employed in a semi-controlled manner utilizing high-order elements. This process generated a total of 62,065 nodes and 34,816 elements. It is noteworthy to mention that for both study cases, the convergence of Finite Element Analyses was computationally efficient due to uniform discretization, accurate assignment of loading and boundary conditions, and appropriate hardware and software utilized (Intel Core i9-12900H, 16 GB RAM, and GeForce RTX 3070 TI); this allowed us to obtain results within a short period of 10 min. The personalized foot insole based on patient morphology was defined with TPU material properties from the literature (Table 2) [81,82,83]. Moreover, a coefficient of friction of 0.5 was implemented for the interaction between the foot and the orthotic insole [84].

3. Results

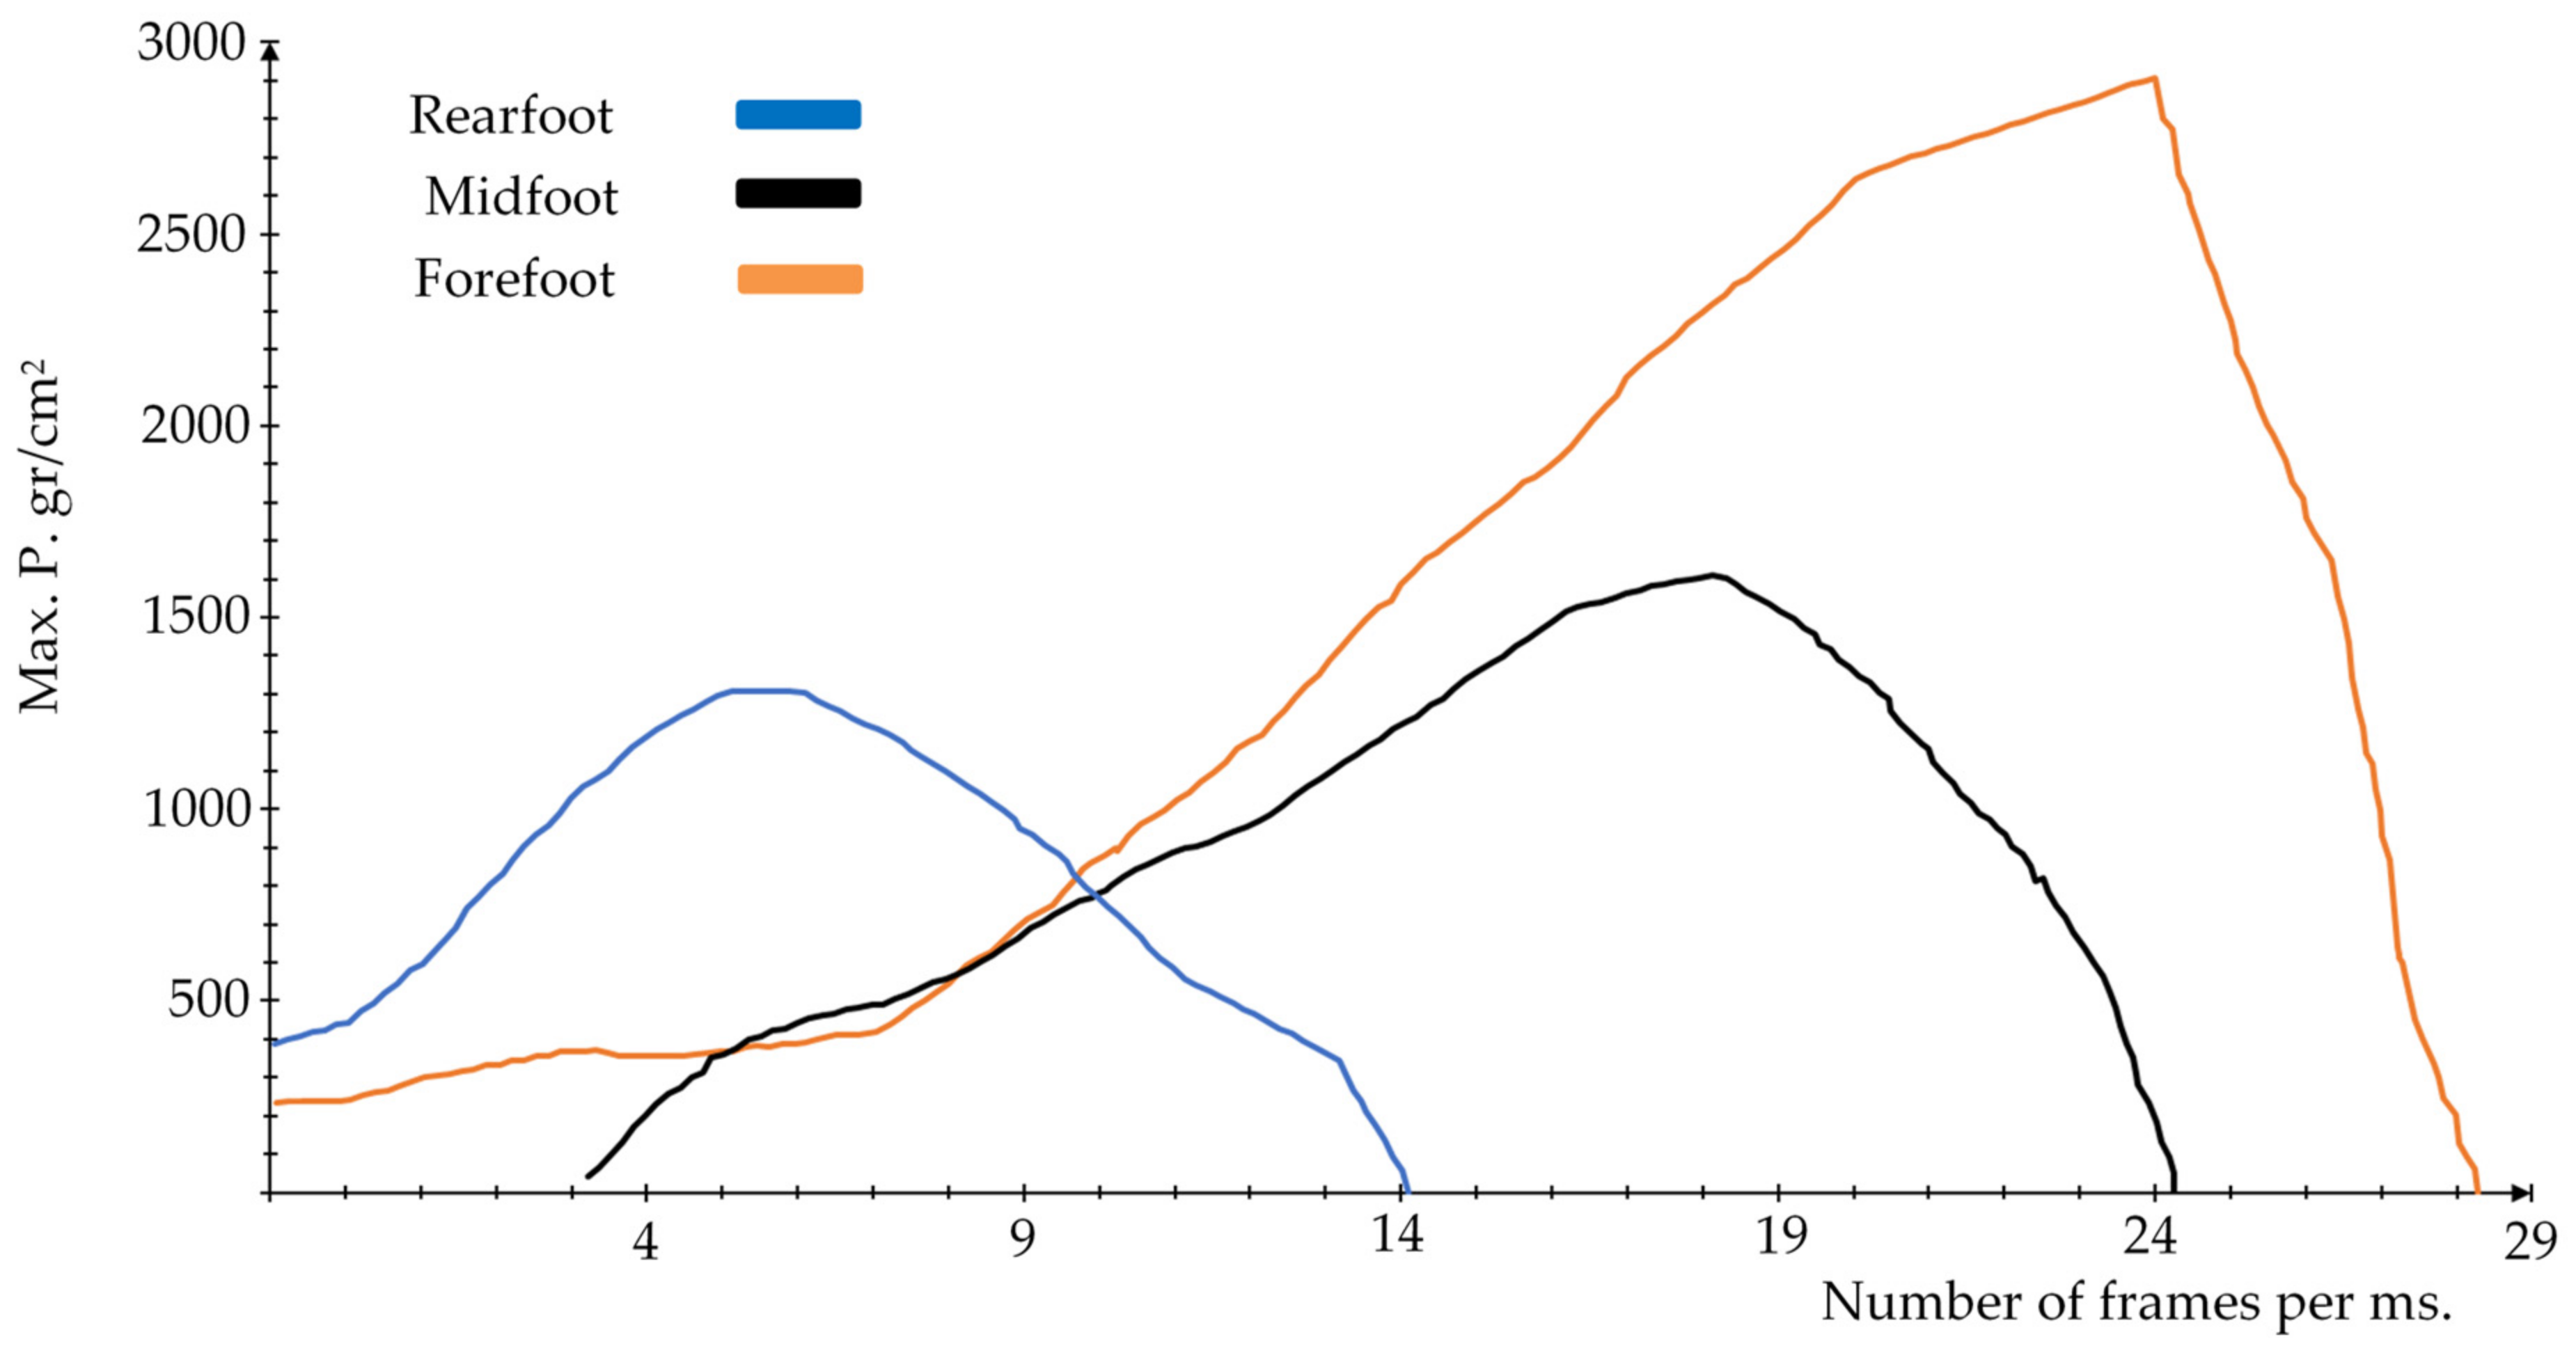
3.1. Results Gait Experimental Baropodometric Testing

The results and general clinical assessments of the experimental analysis are shown in Figure 4. This result provided a general idea of the behavior and distribution of plantar pressure under typical conditions in the transition of stance phases during the gait cycle. Despite tending to relapse and stance mainly on the left foot, the behavior of the right foot is completely normal. Significant support in the forefoot area over the rearfoot (about 72 and 28%, respectively) was exhibited, which physiologically is considered minimally abnormal; however, this is not detrimental to its performance. Thus, it was obtained that a higher percentage of the total load is concentrated in the forefoot area, mainly in the central part over the second and third metatarsal heads, about 27.12%. This percentage was followed by a concentration of 17.12% on the fourth and fifth metatarsal heads, and finally, 10.65% on the first head.
To numerically study the gait using the biological model of the patient utilizing the Finite Element Method, five different numerical studies corresponding to the five stance phases that the foot undergoes during a normal gait are considered. During the experimental analysis of the gait cycle, the evolution of the contact zones of the foot with the ground was obtained visually; these zones correspond to an average of the number of frames per millisecond taken in 831 ms (milliseconds). Twenty-nine frames of the path of the right foot were recorded over a surface of 118 cm2 (Figure 5 and Figure 6).
Based on the contact phases recorded in the baropodometric study, a graph was made between the information collected by the software and the contact area of the plantar zone concerning the frame recorded to determine the precise contact angle between the foot and the ground (Figure 7). The relationship between the contact between the rearfoot and the ground was taken with a positive angle as it was the beginning of the registration during gait. Therefore, the first stance phase (heel strike) was recorded in the second frame (frame 1) with an angle of 14°, and the loading response phase had an angle of 8° and was recorded in frame number 5. The mid-stance phase was recorded in frame 10, where the angle was 0°, and the foot was fully supported on the ground. As soon as the forefoot area connected with the ground, the angle was assumed to have a minus value since it passed through a 0 and acquired values with the opposite sign. Heel rise had an angle with the ground of −18° and was recorded in frame 17. Finally, the pre-swing phase was presented in the 25th frame with an angle of −30°. Negative-valued angles are only for reference, considering that the recording of the contacts began in the rearfoot area and ended with the forefoot at the tip of the hallux.
Furthermore, not only was the accurate definition of the contact angle between the foot and the ground known, but also the direction and orientation of the foot were given through the experimental analysis by recording a Fick angle at the foot of 18°, which records an entirely normal angle of external rotation of the midline of the body [85]. Considering this parameter, it is understood that the right foot tends to perform a slight normal adduction in the forefoot part during gait.
The gait experimental testing results were graphed according to the total number of frames taken and the maximum plantar pressure values exerted for each one of the stance phases. Figure 8 shows the results and specific behavior of the three crucial plantar regions: forefoot, midfoot, and rearfoot. The maximum pressure measurement was initiated by analyzing the rearfoot region from the heel strike phase to the pre-swing phase in the forefoot and toes region.

3.2. Results of the First Case Study of Finite Element Analyses Simulating the Stance Phases of the Gait Cycle

The convergence of the numerical analysis equations allowed the acquisition of accurate predictive pressure results; von Mises stress failure theory was priorly employed due to its ability to provide valuable estimation data in the biomechanical behavior of the foot sole, employing the result of different types of stresses in all axis and planes. Therefore, it is ideal to evaluate the biomodel (tensile) ductile properties and the complex conditions of the plantar region under the gait cycle. Figure 9, Figure 10, Figure 11, Figure 12 and Figure 13 represent the predicted pressure for each one of the stance phases. For Figure 9, Figure 10, Figure 11, Figure 12 and Figure 13, stance phases were shortened to H.S. for heel strike, L.R. for loading response, M.S. for mid-stance, H.R. for heel rise, and P.S. for pre-swing. Detailed numerical data, including maximum and minimum values, are provided in Appendix A and Table A1 and Table A2.

3.3. Validation and Comparison to First Case Study Results with Experimental Gait Cycle Testing Results

For the validation process, the considerations taken to obtain the results numerically and the maximum plantar pressure values in each of the five stance phases were compared with those acquired in the baropodometric gait study. The von Mises stress distribution was used since it is ideal for evaluating soft tissues and musculoskeletal conditions in biomechanical applications. Based on the graph in Figure 8, a comparison was made between the experimental and numerical results of maximum plantar pressure (Figure 14, Figure 15 and Figure 16). In the heel strike phase corresponding to frame 1, a 596 gr/cm2 pressure was recorded, equating to 0.05844 MPa. The plantar pressure prediction using the Finite Element Method provided a value of around 0.0444–0.0593 MPa according to the color scale presented (Figure 14). For the loading response phase, a 1297 g/cm2 pressure value corresponding to 0.12719 MPa was experimentally acquired (frame 5). Numerically, in this stance phase, the values oscillated from 0.0719–0.1619 MPa. However, in some zones, a value closer to the experimental one of 0.1259 MPa was obtained (Figure 14).
Through the Finite Element Method, values of 0.0572–0.0716 MPa were obtained, where in some points, there were stress concentrators that increased foot sole pressure to 0.1289 MPa due to the contact between the plate and the plantar zone (Figure 15). The mid-stance phase had a plantar pressure of 797 g/cm2, equal to 0.07815 MPa, according to the baropodometric study (photogram 10).
In the heel rise phase, the plantar pressure rose to 2158 gr/cm2, corresponding to 0.21162 MPa (frame 17). For the numerical analysis corresponding to this phase, a continuous section under the first metatarsal head was predicted and came closest to the experimental result with a value of 0.2005 MPa (Figure 16). Finally, the baropodometric result generated a plantar pressure of 2908 gr/cm2 for the pre-swing phase, equal to 0.28517 MPa (frame 25). The numerical simulation obtained values of 0.2729 MPa in the hallux areas, where, anatomically, there was a higher pressure concentration for this gait stance phase (Figure 16).

3.4. Results of the Second Case Study of Finite Element Analyses Simulating the Stance Phases of the Gait Cycle

Plantar pressure results utilizing the patient-specific insole simulating all five stance phases are shown in Figure 17, Figure 18, Figure 19, Figure 20 and Figure 21. These Finite Element results allow us to visualize the pressure redistribution on the foot sole, highlighting the insole’s shock-absorbing and relieving capabilities. Detailed numerical data, including maximum and minimum values, are provided in Appendix A and Table A3 and Table A4. In Figure 22, the von Mises stress distribution fields for all stance phases in the plantar region of the customized insole are depicted.

4. Discussion

The current research employed a high-complexity biological model of the right foot focused on segmenting soft tissues, intrinsic muscles, and skin. In contrast to most foot Finite Element Analyses that employ bony tissues, this research presents a novel and different approach to analyzing the plantar surface with a yet-defined 3D detailed model development. Both numerical and experimental testing were conducted to biomechanically evaluate the behavior of pressure distribution on the foot sole region during all five stance phases in a normal gait cycle to design a 3D-printable personalized foot insole based on the patient’s unique morphology for evaluating the complex behavior of foot-insole effects presented in the plantar zone. The assignment of loading and boundary conditions presented in the Finite Element Analysis showed an innovative and unconventional method to employ new mechanical considerations to analyze soft tissues; utilizing a displacement as an external agent allowed the development of accurate effects.
Numerical results indicated that the highest concentrations of von Mises stress fields are found in the pre-swing phase in the forefoot, specifically at the hallux, as well as in the values of the experimental analysis. These Finite Element Method results, particularly the stress distribution (ring-shaped), should be interpreted within the context of the model’s construction and considerations, specifically using only soft tissue. The contact between the ground tends to displace the tissue due to its high ductility, resulting in a higher stress concentration in the contour and not in the center. Despite this limitation, the agreement with experimental data regarding pressure spectrum, peak plantar pressure, and average pressure suggests that the model offers valuable insights into soft tissue pressure distribution biomechanical behavior during foot–ground contact. Furthermore, previous research reported this ring-shaped or gap stress distribution field, stating that the mentioned effect occurs only by analyzing soft tissue [86]. Thus, the plantar pressure distribution showed agreement with the two types of analysis, which validates numerical analyses as both had similar behavior and patterns, having an average error range in the five stance phases of less than 5% in the maximum pressure points of the numerical simulation compared to the experimental one.
On the other hand, most of the analyses showed a uniform stress distribution, commonly green shades in the isochromatic scale, with values between 0.055 and 0.08 MPa, corresponding to the general average pressure. The baropodometric test registered a result of 787 gr/cm2, equal to 0.0771 MPa. This study evaluated the effects caused on the foot sole for each one of the stance phases from a statically mechanical study, representing the exact moment when the foot is in contact with the ground, disregarding dynamic considerations, which enables this method to optimize and simplify dynamic analysis. The high fidelity of the results obtained in the experimental testing and the first case study indicate that despite any modeling and dynamic simplifications previously mentioned, the principles and parameters utilized in the Finite Element Analysis were accurate and appropriate to simulate the stance phases of a normal gait cycle. Furthermore, the findings of this study are consistent with observations previously reported in the literature of Finite Element Analyses focused on the gait cycle. Despite methodological differences, numerical results align closely with the observations reported by the cited research [87] for the mid-stance, heel rise, and pre-swing values along the plantar zone; the loading response also shows good agreement in the heel lateral region. Similar stress distribution and values presented in this research for the heel rise phase replicate the findings from different investigation groups [88,89]. Results obtained in the hallux when evaluating the pre-swing phase are in solid concordance with results reported in a numerical study in the first ray [90]. The total elastic strain values in Appendix A tables show consistent behavior with an analysis of the strain effects in the plantar region skin [91].
The comprehension of the biomechanical behavior of the model under gait cycle stance phases provided essential insights to design a 3D-printable patient-specific insole. Numerical results for the second case study supported the insole’s material selection and the accurate parametric design to considerably attenuate peak plantar pressure, specifically in critical stance phases, such as heel strike and pre-swing. The prediction of pressure points during the performance of daily activities through Finite Element analyses facilitates novel approaches that seek high-biofidelity methods to analyze and understand dynamics in real-life biomechanics, aiming to enhance current customization principles for orthotic and prosthetic devices, contributing innovative scientific solutions to the medical field.
The presented research is categorized as a presentation of a method for presenting a distinctive approach with innovative mechanical considerations to analyze pressure points in a healthy patient, which also brings certain limitations for the methods implemented. The need to employ the proposed methods in various healthy patients before testing them in pathological foot cases is worth mentioning. Methods employed have a relevant impact in providing proper knowledge and general guidelines in the study of pressure points and their re-distribution towards designing fully customized foot orthopedic devices. Further approaches in pathological and specific-condition cases can potentially be achieved using the described methods; for example, future research focused on the elderly, children, or athletes.

5. Limitations

The interpretation of the findings presented in the current study and their applicability requires careful consideration due to the simplifications employed, the modeling approach conducted, and the need for specific patient data to conduct numerical simulations with a significant degree of fidelity. A clear example of these limitations is the non-consideration of bony tissue (neglecting cortical and trabecular structures) that simplified the construction of biological elements in the model; since the 3D model was only focused on foot soft tissues, the model is not adequate to evaluate whole foot structural conditions; along with the utilized boundary conditions where they were based on specific situations, moments, or instants during stance phases of a normal gait, simulating a quasi-static analysis disregarding dynamic considerations; results estimations cannot be directly and precisely compared to experimental data for the simplified assumptions previously stated. Even though similar behavior patterns are provided, clinical assessment by a professional is necessary for any decision-making procedure. Likewise, constant advancements in medical imaging facilitate the development of increasingly sophisticated three-dimensional biological models. This progress allows the incorporation of detailed representations of the complex foot musculature (intrinsic and extrinsic muscles); furthermore, assigning material properties that more accurately reflect biological tissues is required, as only linear elastic, homogeneous, and isotropic properties were assumed for this research work. In addition, the Finite Element model was constructed based on a specific patient approach and not targeted to a vast population; thus, further investigation is needed to be developed in different population groups. In recognition of the manuscript’s limitations, the results were primarily intended to provide a qualitative analysis of the biomechanical pressure distribution effects on the plantar region from a mechanical-computational perspective. This approach acknowledges that the results presented may not represent the exact whole-foot behavior but estimate a suitable prediction of the effects generated in the plantar zone.

6. Conclusions

The current research has provided feasible results predicting plantar pressure points during the different stance phases, even under quasi-static considerations disregarding dynamic conditions, which demonstrates the impact of the Finite Element Method as a powerful tool for analyzing the human body. Applying an innovative and unconventional way to evaluate the foot sole when performing a gait cycle provided a valuable medical-validated database for clinicians to deepen their understanding regarding foot structural behavior. The reconstruction of biological three-dimensional models combined with numerical simulations is remarkably successful in being the short-term assistive methodology for medical procedures, such as surgical planning, prescription of orthopedic devices, rehabilitation therapies, and more knowledgeable biomechanical principles for education. The emerging techniques to design and develop high-performance customized orthopedics focus on 3D-printable materials that are often numerically evaluated before being printed and further used. Likewise, the use of 3D-printing technologies has increasingly been recognized as a standard for orthopedics design and reconstruction due to their high performance, which are advantageous techniques for being time-efficient and affordable compared to traditional procedures. Precisely, the unique patient-specific needs for plantar supports are successfully being achieved by the methods presented in the manuscript, from the 3D patient morphology modeling to numerical simulations that analyze the accuracy of the insole design and cushioning properties assigned to suitably re-distribute excessive pressure points. Thus, all methods described in the current research align with recent advances in foot biomechanics, which aim to revolutionize the footwear and prosthetic lower limb industry, contributing to enhancing rehabilitation treatments and people’s life quality through optimized foot orthotics with the primary goal of achieving specific individual needs.

Author Contributions

Conceptualization, J.A.S.-P., G.U.-S., B.R.-Á. and F.C.-H.; methodology, J.A.S.-P., G.U.-S., B.R.-Á. and G.M.U.-C.; validation, J.A.S.-P., G.U.-S., B.R.-Á., G.M.U.-C. and F.J.G.-F.; formal analysis, J.A.S.-P., G.U.-S., B.R.-Á. and A.T.-E.; investigation, J.A.S.-P., G.U.-S., B.R.-Á. and G.M.U.-C.; resources, J.A.S.-P., G.U.-S., B.R.-Á. and J.A.G.-N.; writing—original draft preparation, J.A.S.-P., G.U.-S., B.R.-Á. and M.I.C.-C.; writing—review and editing, J.A.S.-P., G.U.-S., B.R.-Á. and F.C.-H.; visualization, J.A.S.-P., G.U.-S., B.R.-Á. and A.C.-L.; supervision, J.A.S.-P., G.U.-S., B.R.-Á. and F.C.-H.; project administration, J.A.S.-P., G.U.-S., B.R.-Á. and G.M.U.-C. All authors have read and agreed to the published version of the manuscript.

Funding

This research received no external funding.

Institutional Review Board Statement

The study was conducted in accordance with the Declaration of Helsinki, and approved by the Ethics Committee of Biomechanics Group, Instituto Politécnico Nacional, Escuela Superior de Ingeniería Mecánica y Eléctrica, Sección de Estudios de Posgrado e Investigación, Unidad Profesional Adolfo López Mateos (approval number BIOMEC/0012/2023, 14 June 2023).

Informed Consent Statement

Written informed consent has been obtained from the patient(s) to publish this paper.

Data Availability Statement

All data generated or analyzed during this study are included within the article.

Acknowledgments

The authors gratefully acknowledge the Instituto Politécnico Nacional and Consejo Nacional de Humanidades Ciencias y Tecnologías for supporting this research.

Conflicts of Interest

The authors declare no conflict of interest.

Appendix A

Table A1. First case study summary of numerical evaluation results for the heel strike, loading response, and mid-stance phases.
Type of AnalysisHeel Strike PhaseLoading Response PhaseMid-Stance Phase
MaximumMinimumMaximumMinimumMaximumMinimum
Total deformation (mm)6.341607.133706.16590
Deformation X axis (mm)0.9612−0.96161.749−1.27353.0399−1.7385
Deformation Y axis (mm)6.3411−0.07617.1337−0.19156.1624−0.9437
Deformation Z axis (mm)1.0297−0.85931.4182−1.56032.1061−1.7235
Total elastic strain (mm/mm)0.69678.299 × 10−160.59024.39 × 10−160.94645.95 × 10−16
Elastic strain X axis (mm/mm)0.3455−0.25590.2692−0.20040.4559−0.2695
Elastic strain Y axis (mm/mm)0.39−0.64200.1909−0.42400.5435−0.6249
Elastic strain Z axis (mm/mm)0.2724−0.27340.3155−0.19250.3726−0.3106
Nominal stress X axis (MPa)0.0617−0.11740.0891−0.17040.1152−0.1162
Nominal stress Y axis (MPa)0.0643−0.14950.0659−0.21070.1247−0.1511
Nominal stress Z axis (MPa)0.0663−0.11020.0593−0.16040.1442−0.1217
Shear stress XY plane (MPa)0.0373−0.02810.0488−0.05400.0466−0.0634
Shear stress YZ plane (MPa)0.0343−0.02580.0537−0.04490.0470−0.0383
Shear stress XZ plane (MPa)0.0220−0.01880.0331−0.02080.0226−0.0252
von Mises stress (MPa)0.133400.161900.12890
Maximum principal stress (MPa)0.0730−0.08300.0905−0.15360.1825−0.1088
Minimum principal stress (MPa)0.0511−0.16720.0238−0.21740.0713−0.1653
Table A2. First case study summary of numerical evaluation results for the heel rise and pre-swing phases.
Type of AnalysisHeel RisePre-Swing
MaximumMinimumMaximumMinimum
Total deformation (mm)8.169909.16250
Deformation X axis (mm)1.6727−2.1772.2721−2.7693
Deformation Y axis (mm)8.1698−1.25699.1615−0.7243
Deformation Z axis (mm)2.0717−2.67181.5841−2.4929
Total elastic strain (mm/mm)1.08934.26 × 10−161.42494.029 × 10−16
Elastic strain X axis (mm/mm)0.4747−0.28710.7611−0.3579
Elastic strain Y axis (mm/mm)0.2355−0.74210.4636−1.1273
Elastic strain Z axis (mm/mm)0.4177−0.25610.5801−0.5227
Nominal stress X axis (MPa)0.0952−0.19730.1034−0.2758
Nominal stress Y axis (MPa)0.0752−0.34860.1452−0.4176
Nominal stress Z axis (MPa)0.1148−0.25080.1210−0.3123
Shear stress XY plane (MPa)0.0655−0.10530.0704−0.1368
Shear stress YZ plane (MPa)0.0693−0.07280.0896−0.0909
Shear stress XZ plane (MPa)0.0366−0.04880.0453−0.0437
von Mises stress (MPa)0.200500.27290
Maximum principal stress (MPa)0.1454−0.17830.1531−0.2691
Minimum principal stress (MPa)0.0374−0.38550.1013−0.4533
Table A3. Second case study summary of numerical evaluation results for the heel strike, loading response, and mid-stance phases.
Type of AnalysisHeel Strike PhaseLoading Response PhaseMid-Stance Phase
MaximumMinimumMaximumMinimumMaximumMinimum
Total deformation (mm)5.026906.157704.92850
Deformation X axis (mm)1.4225−0.59251.8206−0.87421.8526−1.3961
Deformation Y axis (mm)5.0266−0.07056.1576−0.10744.9284−0.5991
Deformation Z axis (mm)0.6477−0.59660.9268−0.77881.2221−1.3223
Total elastic strain (mm/mm)0.35965.6254 × 10−140.35747.1839 × 10−140.72519.997 × 10−14
Elastic strain X axis (mm/mm)0.1172−0.11370.1698−0.1330.3588−0.2016
Elastic strain Y axis (mm/mm)0.2019−0.24020.2964−0.27670.3121−0.5439
Elastic strain Z axis (mm/mm)0.1603−0.14780.1329−0.18420.2458−0.3044
Nominal stress X axis (MPa)0.0257−0.05710.0464−0.09290.0995−0.3104
Nominal stress Y axis (MPa)0.019−0.05910.0415−0.0990.0888−0.413
Nominal stress Z axis (MPa)0.027−0.06050.0439−0.09830.0773−0.3432
Shear stress XY plane (MPa)0.0143−0.01530.0187−0.01880.061−0.0422
Shear stress YZ plane (MPa)0.0158−0.01960.0146−0.01410.0564−0.0531
Shear stress XZ plane (MPa)0.0083−0.01120.0102−0.01160.0265−0.0276
von Mises stress (MPa)0.052900.070700.13330
Maximum principal stress (MPa)0.0424−0.05360.0578−0.09010.1196−0.3092
Minimum principal stress (MPa)0.0157−0.06820.0299−0.10240.0632−0.4185
Table A4. Second case study summary of numerical evaluation results for the heel rise and pre-swing phases.
Type of AnalysisHeel RisePre-Swing
MaximumMinimumMaximumMinimum
Total deformation (mm)7.536708.40160
Deformation X axis (mm)1.2509−1.87333.0257−1.8019
Deformation Y axis (mm)7.5367−0.93278.3979−0.4156
Deformation Z axis (mm)1.7482−2.18832.1923−1.6503
Total elastic strain (mm/mm)1.00114.7186 × 10−161.04241.5761 × 10−15
Elastic strain X axis (mm/mm)0.4901−0.28810.5395−0.2877
Elastic strain Y axis (mm/mm)0.2103−0.74890.4538−0.9172
Elastic strain Z axis (mm/mm)0.4304−0.22450.4146−0.3263
Nominal stress X axis (MPa)0.0912−0.19220.1105−0.3156
Nominal stress Y axis (MPa)0.0757−0.31030.0724−0.3358
Nominal stress Z axis (MPa)0.0813−0.22180.0874−0.3223
Shear stress XY plane (MPa)0.0732−0.08970.0611−0.0702
Shear stress YZ plane (MPa)0.0543−0.06980.0636−0.1045
Shear stress XZ plane (MPa)0.0303−0.03690.0417−0.028
von Mises stress (MPa)0.16800.18740
Maximum principal stress (MPa)0.14−0.16380.1187−0.3047
Minimum principal stress (MPa)0.0642−0.32420.0384−0.3572

References

  1. Lou, C.; Wang, S.; Liang, T.; Pang, C.; Huang, L.; Run, M.; Liu, X. A Graphene-Based Flexible Pressure Sensor with Applications to Plantar Pressure Measurement and Gait Analysis. Materials 2017, 10, 1068. [Google Scholar] [CrossRef] [PubMed]
  2. Kim, D.; Lewis, C.L.; Gill, S.V. Effects of obesity and foot arch height on gaitmechanics: A cross-sectional study. PLoS ONE 2021, 16, e0260398. [Google Scholar] [CrossRef] [PubMed]
  3. Mei, Q.; Kim, H.K.; Xiang, L.; Shim, V.; Wang, A.; Baker, J.S.; Gu, Y.; Fernandez, J. Toward improved understanding of foot shape, foot posture, and foot biomechanics during running: A narrative review. Front. Physiol. 2022, 13, 1062598. [Google Scholar] [CrossRef]
  4. Ang, C.K.; Solihin, M.I.; Chan, W.J.; Ong, Y.Y. Study of Plantar Pressure Distribution. MATEC Web. Conf. 2018, 237, 01016. [Google Scholar] [CrossRef]
  5. Nandikolla, K.V.; Bochen, R.; Meza, S.; Garcia, A. Experimental Gait Analysis to Study Stress Distribution of the Human Foot. J. Med. Eng. 2017, 2017, 3432074. [Google Scholar] [CrossRef] [PubMed]
  6. Pirker, W.; Katzenschlager, R. Gait disorders in adults and the elderly. Wien. Klin. Wochenschr. 2017, 129, 81–95. [Google Scholar] [CrossRef] [PubMed]
  7. Cicirelli, G.; Impedovo, D.; Dentamaro, V.; Marani, R.; Pirlo, G.; D’Orazio, T.R. Human Gait Analysis in Neurodegenerative Diseases: A Review. IEEE J. Biomed. Health Inform. 2022, 26, 229–242. [Google Scholar] [CrossRef]
  8. Stöckel, T.; Jacksteit, R.; Behrens, M.; Skripitz, R.; Bader, R.; Mau-Moeller, A. The mental representation of the human gait in young and older adults. Front. Psychol. 2015, 6, 943. [Google Scholar] [CrossRef] [PubMed]
  9. Hulleck, A.A.; Menoth-Mohan, D.; Abdallah, N.; El-Rich, M.; Khalaf, K. Present and future of gait assessment in clinical practice: Towards the application of novel trends and technologies. Front. Med. Technol. 2022, 4, 901331. [Google Scholar] [CrossRef]
  10. Taş, S.; Çetin, A. An investigation of the relationship between plantar pressure distribution and the morphologic and mechanic properties of the intrinsic foot muscles and plantar fascia. Gait Post. 2019, 72, 217–221. [Google Scholar] [CrossRef]
  11. Rusu, L.; Paun, E.; Marin, M.I.; Hemanth, J.; Rusu, M.R.; Calina, M.L.; Bacanoiu, M.V.; Danoiu, M.; Danciulescu, D. Plantar Pressure and Contact Area Measurement of Foot Abnormalities in Stroke Rehabilitation. Brain Sci. 2021, 11, 1213. [Google Scholar] [CrossRef]
  12. Abdul Razak, A.H.; Zayegh, A.; Begg, R.K.; Wahab, Y. Foot Plantar Pressure Measurement System: A Review. Sensors 2012, 12, 9884–9912. [Google Scholar] [CrossRef] [PubMed]
  13. Chen, J.-L.; Dai, Y.-N.; Grimaldi, N.S.; Lin, J.-J.; Hu, B.-Y.; Wu, Y.-F.; Gao, S. Plantar Pressure-Based Insole Gait Monitoring Techniques for Diseases Monitoring and Analysis: A Review. Adv. Mater. Technol. 2022, 7, 2100566. [Google Scholar] [CrossRef]
  14. Jones, A.D.; Crossland, S.R.; Nixon, J.E.; Siddle, H.J.; Russell, D.A.; Culmer, P.R. STrain Analysis and Mapping of the Plantar Surface (STAMPS): A novel technique of plantar load analysis during gait. Proc. Inst. Mech. Eng. H 2023, 237, 841–854. [Google Scholar] [CrossRef] [PubMed]
  15. Crossland, S.R.; Siddle, H.J.; Culmer, P.; Brockett, C.L. A plantar surface shear strain methodology utilising Digital Image Correlation. J. Mech. Behav. Biomed. Mater. 2022, 136, 105482. [Google Scholar] [CrossRef] [PubMed]
  16. Syed, N.; Karvannan, H.; Maiya, A.G.; Binukumar, B.; Prem, V.; Chakravarty, R.D. Plantar pressure distribution among asymptomatic individuals: A cross-sectional study. Foot Ankle Spec. 2012, 5, 102–106. [Google Scholar] [CrossRef] [PubMed]
  17. Chatwin, K.E.; Abbott, C.A.; Boulton, A.J.M.; Bowling, F.L.; Reeves, N.D. The role of foot pressure measurement in the prediction and prevention of diabetic foot ulceration—A comprehensive review. Diabetes Metab. Res. Rev. 2020, 36, e3258. [Google Scholar] [CrossRef] [PubMed]
  18. Trejo-Enriquez, A.; Urriolagoitia-Sosa, G.; Romero-Ángeles, B.; García-Laguna, M.Á.; Guzmán-Baeza, M.; Martínez-Reyes, J.; Rojas-Castrejon, Y.Y.; Gallegos-Funes, F.J.; Patiño-Ortiz, J.; Urriolagoitia-Calderón, G.M. Numerical Evaluation Using the Finite Element Method on Frontal Craniocervical Impact Directed at Intervertebral Disc Wear. Appl. Sci. 2023, 13, 11989. [Google Scholar] [CrossRef]
  19. Maya-Anaya, D.; Urriolagoitia-Sosa, G.; Romero-Ángeles, B.; Martinez-Mondragon, M.; German-Carcaño, J.M.; Correa-Corona, M.I.; Trejo-Enríquez, A.; Sánchez-Cervantes, A.; Urriolagoitia-Luna, A.; Urriolagoitia-Calderón, G.M. Numerical Analysis Applying the Finite Element Method by Developing a Complex Three-Dimensional Biomodel of the Biological Tissues of the Elbow Joint Using Computerized Axial Tomography. Appl. Sci. 2023, 13, 8903. [Google Scholar] [CrossRef]
  20. Cruz-López, S.; Urriolagoitia-Sosa, G.; Romero-Ángeles, B.; Urriolagoitia-Calderón, G.M.; Marquet-Rivera, R.A.; Hernández-Vázquez, R.A.; Mastache-Miranda, O.A.; Vázquez-Feijo, J.A. Biomechanical analysis of the femur bone with the cotyle of the hip prosthesis. MOJ Appl. Bionics Biomech. 2023, 7, 11–12. [Google Scholar] [CrossRef]
  21. Martinez-Mondragon, M.; Urriolagoitia-Sosa, G.; Romero-Ángeles, B.; Pérez-Partida, J.C.; Cruz-Olivares, I.M.; Urriolagoitia-Calderón, G. Bilinear Numerical Analysis of the Structural Behavior of a Dental Implant Applied as a Biomaterial Carbon Fiber Reinforced Polyether-Ether-Ketone (CFR-PEEK): A Finite Element Analysis. Dent. Hypoth. 2023, 14, 45–48. [Google Scholar]
  22. Telfer, S.; Erdemir, A.; Woodburn, J.; Cavanagh, P.R. What Has Finite Element Analysis Taught Us about Diabetic Foot Disease and Its Management? A Systematic Review. PLoS ONE 2014, 9, e109994. [Google Scholar] [CrossRef] [PubMed]
  23. Rai, D.V.; Aggarwal, L.M. The Study of Plantar Pressure Distribution in Normal and Pathological Foot. Pol. J. Med. Phys. Eng. 2006, 12, 25–34. [Google Scholar]
  24. Ukobitz, D.; Faullant, R. Leveraging 3D Printing Technologies: The Case of Mexico’s Footwear Industry. Res.—Technol. Manag. 2021, 64, 20–30. [Google Scholar] [CrossRef]
  25. Jandova, S.; Mendricky, R. Benefits of 3D Printed and Customized Anatomical Footwear Insoles for Plantar Pressure Distribution. 3D Print. Addit. Manuf. 2022, 9, 547–556. [Google Scholar] [CrossRef] [PubMed]
  26. Ali, M.H.; Trubayev, S.; Shehab, E. 3D Printed Large-Scale Insole and Its Challenges. In Proceedings of the 8th Brunei International Conference on Engineering and Technology 2021, Universiti Teknologi Brunei, Seri Begawan, Brunei Darussalam, 8–10 November 2021. [Google Scholar]
  27. Shaikh, S.; Jamdade, B.; Chanda, A. Effects of Customized 3D-Printed Insoles in Patients with Foot-Related Musculoskeletal Ailments—A Survey-Based Study. Prosthesis 2023, 5, 550–561. [Google Scholar] [CrossRef]
  28. Chen, R.K.; Jin, Y.-A.; Wensman, J.; Shih, A. Additive manufacturing of custom orthoses and prostheses—A review. Addit. Manuf. 2016, 12, 77–89. [Google Scholar] [CrossRef]
  29. Wu, S.; Zeng, T.; Liu, Z.; Ma, G.; Xiong, Z.; Zuo, L.; Zhou, Z. 3D Printing Technology for Smart Clothing: A Topic Review. Materials 2022, 15, 7391. [Google Scholar] [CrossRef]
  30. Kumar, R.; Sarangi, S.K. 3D-Printed Orthosis: A Review on Design Process and Material Selection for Fused Deposition Modeling Process. In Advances in Materials Processing and Manufacturing Applications, 1st ed.; Patnaik, A., Kozeschnik, E., Kukshal, V., Eds.; Springer Singapore Publishing: Singapore, 2021; Volume 1, pp. 531–538. [Google Scholar]
  31. Rodriguez-Colon, R.; Nayak, V.V.; Parente, P.E.L.; Leucht, P.; Tovar, N.; Lin, C.C.; Rezzadeh, K.; Hacquebord, J.H.; Coelho, P.G.; Witek, L. The presence of 3D printing in orthopedics: A clinical and material review. J. Orthop. Res. 2023, 41, 601–613. [Google Scholar] [CrossRef]
  32. Kumar, P.; Rajak, D.K.; Abubakar, M.; Ali, S.G.M.; Hussain, M. 3D Printing Technology for Biomedical Practice: A Review. J. Mater. Eng. Perform. 2021, 30, 5342–5355. [Google Scholar] [CrossRef]
  33. Gelaziene, E.; Milasiene, D. Influence of the Type of Plastic and Printing Technologies on the Compressive Behavior of 3D-Printed Heel Prototypes. Materials 2023, 16, 1930. [Google Scholar] [CrossRef] [PubMed]
  34. Teixeira, R.; Coelho, C.; Oliveira, J.; Gomes, J.; Pinto, V.V.; Ferreira, M.J.; Nóbrega, J.M.; Silva, A.F.D.; Carneiro, O.S. Towards Customized Footwear with Improved Comfort. Materials 2021, 14, 1738. [Google Scholar] [CrossRef]
  35. Rico-Baeza, G.; Pérez-Soto, G.I.; Morales-Hernández, L.A.; Cuan-Urquizo, E.; Camarillo-Gómez, K.A. Additively Manufactured Foot Insoles Using Body-Centered Cubic (BCC) and Triply Periodic Minimal Surface (TPMS) Cellular Structures. Appl. Sci. 2023, 13, 12665. [Google Scholar] [CrossRef]
  36. Kermavnar, T.; Shannon, A.; O’Sullivan, L.W. The application of additive manufacturing/3D printing in ergonomic aspects of product design: A systematic review. Appl. Ergon. 2021, 97, 103528. [Google Scholar] [CrossRef] [PubMed]
  37. Walker, K.J.; Przestrzelski, B.T.; Kaluf, B.; Driggers, N.H.; Ballard, W.D., 2nd; Pruett, T.C.; Hoeffner, S.L.; DesJardins, J.D. Novel 3D-printed foot orthoses with variable hardness: A comfort comparison to traditional orthoses. Med. Eng. Phys. 2023, 115, 103978. [Google Scholar] [CrossRef] [PubMed]
  38. Hudak, Y.F.; Li, J.S.; Cullum, S.; Strzelecki, B.M.; Richburg, C.; Kaufman, G.E.; Abrahamson, D.; Heckman, J.T.; Ripley, B.; Telfer, S.; et al. A novel workflow to fabricate a patient-specific 3D printed accommodative foot orthosis with personalized latticed metamaterial. Med. Eng. Phys. 2022, 104, 103802. [Google Scholar] [CrossRef] [PubMed]
  39. Lee, Y.C.L.; Lin, G.; Wang, M.J.J. Comparing 3D foot scanning with conventional measurement methods. J. Foot Ankle Res. 2014, 7, 44. [Google Scholar] [CrossRef]
  40. Sacco, R.; Munoz, M.-A.; Billuart, F.; Lalevée, M.; Beldame, J. Validation of an Automated Optical Scanner for a Comprehensive Anthropometric Analysis of the Foot and Ankle. Bioengineering 2023, 10, 968. [Google Scholar] [CrossRef] [PubMed]
  41. Silva, R.; Silva, B.; Fernandes, C.; Morouço, P.; Alves, N.; Veloso, A. A Review on 3D Scanners Studies for Producing Customized Orthoses. Sensors 2024, 24, 1373. [Google Scholar] [CrossRef]
  42. Barrios-Muriel, J.; Romero-Sánchez, F.; Alonso-Sánchez, F.J.; Rodríguez Salgado, D. Advances in Orthotic and Prosthetic Manufacturing: A Technology Review. Materials 2020, 13, 295. [Google Scholar] [CrossRef]
  43. Farhan, M.; Wang, J.Z.; Bray, P.; Burns, J.; Cheng, T.L. Comparison of 3D scanning versus traditional methods of capturing foot and ankle morphology for the fabrication of orthoses: A systematic review. J. Foot Ankle Res. 2021, 14, 2. [Google Scholar] [CrossRef] [PubMed]
  44. Rogati, G.; Leardini, A.; Ortolani, M.; Caravaggi, P. Semi-automatic measurements of foot morphological parameters from 3D plantar foot scans. J. Foot Ankle Res. 2021, 14, 18. [Google Scholar] [CrossRef] [PubMed]
  45. Chhikara, K.; Sidhu, S.S.; Gupta, S.; Saharawat, S.; Kataria, C.; Chanda, A. Development and Effectiveness Testing of a Novel 3D-Printed Multi-Material Orthosis in Nurses with Plantar Foot Pain. Prosthesis 2023, 5, 73–87. [Google Scholar] [CrossRef]
  46. Hasibuzzaman, M.; Wahab, A.A.; Seng, G.H.; Ramlee, M.H. Three-dimensional printed orthosis in biomedical application: A short review. J. Phys. Conf. Ser. 2021, 2071, 012025. [Google Scholar] [CrossRef]
  47. Agarwal, R.; Malhotra, S.; Gupta, V.; Jain, V. The application of Three-dimensional printing on foot fractures and deformities: A mini-review. Ann. 3D Print. Med. 2022, 5, 100046. [Google Scholar] [CrossRef]
  48. Negru, N.; Leba, M.; Rosca, S.; Marica, L.; Ionica, A. A new approach on 3D scanning-printing technologies with medical applications. IOP Conf. Ser. Mater. Sci. Eng. 2019, 572, 012049. [Google Scholar] [CrossRef]
  49. Brognara, L.; Mafla-España, M.A.; Gil-Molina, I.; Castillo-Verdejo, Y.; Cauli, O. The Effects of 3D Custom Foot Orthotics with Mechanical Plantar Stimulation in Older Individuals with Cognitive Impairment: A Pilot Study. Brain Sci. 2022, 12, 1669. [Google Scholar] [CrossRef]
  50. Anggoro, P.W.; Tauviqirrahman, M.; Jamari, J.; Bayuseno, A.P.; Bawono, B.; Avelina, M.M. Computer-aided reverse engineering system in the design and production of orthotic insole shoes for patients with diabetes. Cogent Eng. 2018, 5, 1470916. [Google Scholar] [CrossRef]
  51. Mo, S.; Leung, S.H.S.; Chan, Z.Y.S.; Sze, L.K.Y.; Mok, K.M.; Yung, P.S.H.; Ferber, R.; Cheung, R.T.H. The biomechanical difference between running with traditional and 3D printed orthoses. J. Sports Sci. 2019, 37, 2191–2197. [Google Scholar] [CrossRef]
  52. Wang, Y.; Jiang, W.; Gan, Y.; Yu, Y.; Dai, K. Clinical Observation of 3D Printing Technology in Insoles for Flexible Flatfoot Patients. J. Shanghai Jiaotong Univ. 2021, 26, 398–403. [Google Scholar] [CrossRef]
  53. Mueller, J.; Richter, M.; Schaefer, K.; Ganz, J.; Lohscheller, J.; Mueller, S. How to measure children’s feet: 3D foot scanning compared with established 2D manual or digital methods. J. Foot Ankle Res. 2023, 16, 21. [Google Scholar] [CrossRef]
  54. Lin, K.-W.; Chou, L.-W.; Su, Y.-T.; Wei, S.-H.; Chen, C.-S. Biomechanical Effect of 3D-Printed Foot Orthoses in Patients with Knee Osteoarthritis. Appl. Sci. 2021, 11, 4200. [Google Scholar] [CrossRef]
  55. Shih, K.-S.; Jhou, S.-Y.; Hsu, W.-C.; Hsu, C.-C.; Chen, J.-W.; Yeh, J.-C.; Hung, Y.-C. A Biomechanical Investigation of Athletic Footwear Traction Performance: Integration of Gait Analysis with Computational Simulation. Appl. Sci. 2020, 10, 1672. [Google Scholar] [CrossRef]
  56. Niu, J.; Liu, J.; Zheng, Y.; Ran, L.; Chang, Z. Are arch-conforming insoles a good fit for diabetic foot? Insole customized design by using finite element analysis. Hum. Factors Ergon. Manuf. 2020, 30, 303–310. [Google Scholar] [CrossRef]
  57. Zhang, H.; Lin-Lv, M.; Yang, J.; Niu, W.; Cheung, J.C.; Sun, W.; Wong, D.W.; Ni, M. Computational modelling of foot orthosis for midfoot arthritis: A Taguchi approach for design optimization. Acta Bioeng. Biomech. 2020, 22, 75–83. [Google Scholar] [PubMed]
  58. Serrato-Pedrosa, J.A.; Urriolagoitia-Sosa, G.; Romero-Ángeles, B.; Urriolagoitia-Calderón, G.M.; Cruz-López, S.; Urriolagoitia-Luna, A.; Carbajal-López, D.E.; Guereca-Ibarra, J.R.; Murillo-Aleman, G. Biomechanical Evaluation of Plantar Pressure Distribution towards a Customized 3D Orthotic Device: A Methodological Case Study through a Finite Element Analysis Approach. Appl. Sci. 2024, 14, 1650. [Google Scholar] [CrossRef]
  59. Jastifer, J.R. Intrinsic muscles of the foot: Anatomy, function, rehabilitation. Phys. Ther. Sport 2023, 61, 27–36. [Google Scholar] [CrossRef]
  60. Zulkifli, S.S.; Loh, W.P. A state-of-the-art review of foot pressure. Foot Ankle Surg. 2020, 26, 25–32. [Google Scholar] [CrossRef] [PubMed]
  61. Jones, A.D.; De Siqueira, J.; Nixon, J.E.; Siddle, H.J.; Culmer, P.R.; Russell, D.A. Plantar shear stress in the diabetic foot: A systematic review and meta-analysis. Diabet. Med. 2022, 39, e14661. [Google Scholar] [CrossRef]
  62. Oliveira, L.B.; Maranho, D.A.; Cliquet, A.; Dinato, M.C.M.E.; Pagnano, R.G. Reliability of wireless insole baropodometry of normal individual’s gait. Acta Ortop. Bras. 2021, 29, 238–241. [Google Scholar] [CrossRef]
  63. Chevalier, T.L.; Hodgins, H.; Chockalingam, N. Plantar pressure measurements using an in-shoe system and a pressure platform: A comparison. Gait Posture 2010, 31, 397–399. [Google Scholar] [CrossRef] [PubMed]
  64. Luboz, V.; Perrier, A.; Bucki, M.; Diot, B.; Cannard, F.; Vuillerme, N.; Payan, Y. Influence of the calcaneus shape on the risk of posterior heel ulcer using 3D patient-specific biomechanical modeling. Ann. Biomed. Eng. 2015, 43, 325–335. [Google Scholar] [CrossRef] [PubMed]
  65. Su, H.; Mo, Z.; Guo, J.; Fan, Y. The effect of arch height and material hardness of personalized insole on correction and tissues of flatfoot. J. Heathc. Eng. 2017, 2017, 8614341. [Google Scholar] [CrossRef]
  66. Kharazi, M.; Bohm, S.; Theodorakis, C.; Mersmann, F.; Arampatzis, A. Quantifying mechanical loading and elastic strain energy of the human Achilles tendon during walking and running. Sci. Rep. 2021, 11, 5830. [Google Scholar] [CrossRef] [PubMed]
  67. Bojsen-Møller, F.; Lamoreux, L. Significance of free-dorsiflexion of the toes in walking. Acta. Orthop. Scand. 1979, 50, 471–479. [Google Scholar] [CrossRef]
  68. Shaulian, H.; Gefen, A.; Wolf, A. Computational modeling of the plantar tissue stresses induced by the clinical practice of off-loading of the diabetic foot. In The Science, Etiology and Mechanobiology of Diabetes and its Complications, 1st ed.; Gefen, A., Ed.; Academic Press: London, UK, 2021; Volume 1, p. 38. [Google Scholar]
  69. Chokhandre, S.; Halloran, J.P.; van den Bogert, A.J.; Erdemir, A. A three-dimensional inverse finite element analysis of the heel pad. J. Biomech. Eng. 2012, 134, 031002. [Google Scholar] [CrossRef] [PubMed]
  70. Strzalkowski, N.D.; Triano, J.J.; Lam, C.K.; Templeton, C.A.; Bent, L.R. Thresholds of skin sensitivity are partially influenced by mechanical properties of the skin on the foot sole. Physiol. Rep. 2015, 3, e12425. [Google Scholar] [CrossRef]
  71. Zhang, M.; Mak, A.F.T. In vivo friction properties of human skin. Prosthet. Orthot. Int. 1999, 23, 135–141. [Google Scholar] [CrossRef] [PubMed]
  72. Van Alsenoy, K.; van der Linden, M.L.; Ryu, J.H.; Girard, O.; Al Raisi, L.; Santos, D. Isolated and combined effects of EVA and TPU custom foot orthoses on constant speed, treadmill running kinematics. Front. Earth Sci. 2023, 11, 1170661. [Google Scholar] [CrossRef]
  73. Zolfagharian, A.; Lakhi, M.; Ranjbar, S.; Bodaghi, M. Custom Shoe Sole Design and Modeling Toward 3D Printing. Int. J. Bioprint. 2021, 7, 396. [Google Scholar] [CrossRef]
  74. Xie, J.; Zhou, Z.; Luo, T.; Pang, H.; Meng, X.; Zhou, F. Study on Design and Additive Manufacturing of Customized Bionic Sports Sole for the Elderly. IEEE Access 2021, 9, 69830–69838. [Google Scholar] [CrossRef]
  75. Li, J.; Shu, W.; Yang, Y.; Yan, R. Parametric modeling and performance analysis of a personalized insole based on 3D scanning and selective laser sintering. Int. J. Comp. Integr. Manuf. 2020, 33, 936–945. [Google Scholar] [CrossRef]
  76. Ravi, T.; Ranganathan, R.; Ramesh, S.P.; Dandotiya, D.S. 3D Printed Personalized Orthotic Inserts Using Photogrammetry and FDM Technology. In Fused Deposition Modeling Based 3D Printing. Materials Forming, Machining and Tribology, 1st ed.; Dave, H.K., Davim, J.P., Eds.; Springer International Publishing: Cham, Switzerland, 2021; Volume 1, pp. 349–361. [Google Scholar]
  77. Danko, M.; Sekac, J.; Dzivakova, E.; Zivcak, J.; Hudak, R. 3D Printing of Individual Running Insoles—A Case Study. Orthop. Res. Rev. 2023, 15, 105–118. [Google Scholar] [CrossRef] [PubMed]
  78. Brognara, L.; Navarro-Flores, E.; Iachemet, L.; Serra-Catalá, N.; Cauli, O. Beneficial Effect of Foot Plantar Stimulation in Gait Parameters in Individuals with Parkinson’s Disease. Brain Sci. 2020, 10, 69. [Google Scholar] [CrossRef]
  79. Anggoro, P.W.; Bawono, B.; Jamari, J.; Tauviqirrahman, M.; Bayuseno, A.P. Advanced design and manufacturing of custom orthotics insoles based on hybrid Taguchi-response surface method. Heliyon 2021, 7, e06481. [Google Scholar] [CrossRef]
  80. Yildiz, K.; Medetalibeyoglu, F.; Kaymaz, I.; Ulusoy, G.R. Triad of foot deformities and its conservative treatment: With a 3D customized insole. Proc. Inst. Mech. Eng. Part. H J. Eng. Med. 2021, 235, 780–791. [Google Scholar] [CrossRef]
  81. Nouman, M.; Chong, D.Y.R.; Srewaradachpisal, S.; Chatpun, S. The Effect of Customized Insole Pads on Plantar Pressure Distribution in a Diabetic Foot with Neuropathy: Material and Design Study Using Finite Element Analysis Approach. Appl. Sci. 2023, 13, 399. [Google Scholar] [CrossRef]
  82. Nouman, M.; Dissaneewate, T.; Chong, D.Y.R.; Chatpun, S. Effects of thickness and length of custom made insole on plantar pressure for diabetic foot with neuropathy: A finite element approach. Songklanakarin J. Sci. Technol. 2021, 43, 1677–1684. [Google Scholar]
  83. Tang, L.; Wang, L.; Bao, W.; Zhu, S.; Li, D.; Zhao, N.; Liu, C. Functional gradient structural design of customized diabetic insoles. Songklanakarin J. Mech. Behav. Biomed. Mater. 2019, 94, 279–287. [Google Scholar] [CrossRef]
  84. Lemmon, D.; Shiang, T.; Hashmi, A.; Ulbrecht, J.S.; Cavanagh, P.R. The effect of insoles in therapeutic footwear—A finite element approach. J. Biomech. 1997, 30, 615–620. [Google Scholar] [CrossRef]
  85. Rawlings, N. The Way We Stand: A Sequential Case Study on Foot Angle. J. Biosci. Med. 2023, 11, 79–89. [Google Scholar] [CrossRef]
  86. Ghazali, M.J.; Ren, X.; Rajabi, A.; Zamri, W.F.H.W.; Mohd Mustafah, N.; Ni, J. Finite Element Analysis of Cushioned Diabetic Footwear Using Ethylene Vinyl Acetate Polymer. Polymers 2021, 13, 2261. [Google Scholar] [CrossRef]
  87. Akrami, M.; Qian, Z.; Zou, Z.; Howard, D.; Nester, C.J.; Ren, L. Subject-specific finite element modelling of the human foot complex during walking: Sensitivity analysis of material properties, boundary and loading conditions. Biomech. Model Mechanobiol. 2018, 17, 559–576. [Google Scholar] [CrossRef]
  88. Wang, Y.; Li, Z.; Wong, D.W.; Cheng, C.K.; Zhang, M. Finite element analysis of biomechanical effects of total ankle arthroplasty on the foot. J. Orthop. Translat. 2017, 12, 55–65. [Google Scholar] [CrossRef] [PubMed]
  89. Chen, W.M.; Lee, S.J.; Lee, P.V.S. Plantar pressure relief under the metatarsal heads: Therapeutic insole design using three-dimensional finite element model of the foot. J. Biomech. 2015, 48, 659–665. [Google Scholar] [CrossRef] [PubMed]
  90. Budhabhatti, S.P.; Erdemir, A.; Petre, M.; Sferra, J.; Donley, B.; Cavanagh, P.R. Finite element modeling of the first ray of the foot: A tool for the design of interventions. J. Biomech. Eng. 2007, 129, 750–756. [Google Scholar] [CrossRef]
  91. Mo, F.; Li, Y.; Li, J.; Zhou, S.; Yang, Z. A three-dimensional finite element foot-ankle model and its personalisation methods analysis. Int. J. Mech. Sci. 2022, 219, 107108. [Google Scholar] [CrossRef]
Figure 1. 3D foot biomodel reconstruction and analysis methods. (a) Medical imaging study. (b) Segmentation process. (c) Model optimization process. (d) Model optimization process. (e) Numerical analyses. (f) Analysis and interpretation of results.
Prosthesis 06 00032 g001
Figure 2. Loading and boundary condition free body diagrams for all stance phases. (a) Heel strike. (b) Loading response. (c) Mid-stance. (d) Heel rise. (e) Pre-swing.
Prosthesis 06 00032 g002
Figure 3. Workflow of the design process of a patient-specific 3D-printable foot orthosis. (a) Foot morphology’s mold. (b) Insole base. (c) Personalized 3D-printable insole.
Prosthesis 06 00032 g003
Figure 4. General clinical assessment of dynamic analysis.
Prosthesis 06 00032 g004
Figure 5. Initial gait cycle frame evolution.
Prosthesis 06 00032 g005
Figure 6. Final gait cycle frame evolution.
Prosthesis 06 00032 g006
Figure 7. Graph between the angle of foot contact with the ground and the recording of frames per milliseconds during the experimental analysis.
Prosthesis 06 00032 g007
Figure 8. Results of the maximum foot pressure registered and the recording of frames per millisecond during the experimental analysis.
Prosthesis 06 00032 g008
Figure 9. von Mises stress (H.S.). (a) Left side view. (b) Plantar region. (c) Right side view.
Prosthesis 06 00032 g009
Figure 10. von Mises stress (L.R.). (a) Left side view. (b) Plantar region. (c) Right side view.
Prosthesis 06 00032 g010
Figure 11. von Mises stress (M.S.). (a) Left side view. (b) Plantar region. (c) Right side view.
Prosthesis 06 00032 g011
Figure 12. von Mises stress (H.R.). (a) Left side view. (b) Plantar region. (c) Right side view.
Prosthesis 06 00032 g012
Figure 13. von Mises stress (P.S.). (a) Left side view. (b) Plantar region. (c) Right side view.
Prosthesis 06 00032 g013
Figure 14. Comparison of experimental and numerical results. (a) Heel strike phase. (b) Loading response phase.
Prosthesis 06 00032 g014
Figure 15. Comparison of experimental and numerical results of the mid-stance phase.
Prosthesis 06 00032 g015
Figure 16. Comparison of experimental and numerical results. (a) Heel rise. (b) Pre-swing phase.
Prosthesis 06 00032 g016
Figure 17. von Mises stress with patient-specific foot orthosis (H.S.). (a) Left side view. (b) Plantar region. (c) Right side view.
Prosthesis 06 00032 g017
Figure 18. von Mises stress with patient-specific foot orthosis (L.R.). (a) Left side view. (b) Plantar region. (c) Right side view.
Prosthesis 06 00032 g018
Figure 19. von Mises stress with patient-specific foot orthosis (M.S.). (a) Left side view. (b) Plantar region. (c) Right side view.
Prosthesis 06 00032 g019
Figure 20. von Mises stress with patient-specific foot orthosis (H.R.). (a) Left side view. (b) Plantar region. (c) Right side view.
Prosthesis 06 00032 g020
Figure 21. von Mises stress with patient-specific foot orthosis (P.S.). (a) Left side view. (b) Plantar region. (c) Right side view.
Prosthesis 06 00032 g021
Figure 22. von Mises stress in the plantar region of the patient-specific insole for all stance phases. (a) Heel strike. (b) Loading response. (c) Mid-stance. (d) Heel rise. (e) Pre-swing.
Prosthesis 06 00032 g022
Table 1. Mechanical properties of the elements [64,65].
MaterialYoung’s Modulus (MPa)Poisson’s Ratio
Foot skin0.20.485
Foot muscles0.060.495
Plate support210,0000.3
Table 2. Mechanical properties of TPU insole [81,82,83].
MaterialYoung’s Modulus (MPa)Poisson’s Ratio
Thermoplastic Polyurethane (TPU)110.45
Disclaimer/Publisher’s Note: The statements, opinions and data contained in all publications are solely those of the individual author(s) and contributor(s) and not of MDPI and/or the editor(s). MDPI and/or the editor(s) disclaim responsibility for any injury to people or property resulting from any ideas, methods, instructions or products referred to in the content.

