Article

Meta-Feature-Based Traffic Accident Risk Prediction: A Novel Approach to Forecasting Severity and Incidence

by
Wei Sun
1,
Lili Nurliynana Abdullah
2,*,
Puteri Suhaiza Sulaiman
2 and
Fatimah Khalid
2
1
Computer Vision, Faculty of Computer Science and Information, Universiti Putra Malaysia, Serdang 43400, Malaysia
2
Department of Multimedia, Faculty of Computer Science and Information, Universiti Putra Malaysia, Serdang 43400, Malaysia
*
Author to whom correspondence should be addressed.
Submission received: 8 April 2024 / Revised: 23 April 2024 / Accepted: 24 April 2024 / Published: 25 April 2024
(This article belongs to the Special Issue Emerging Transportation Safety and Operations: Practical Perspectives)

Abstract

:
This study aims to improve the accuracy of predicting the severity of traffic accidents by developing an innovative traffic accident risk prediction model—StackTrafficRiskPrediction. The model combines multidimensional data analysis including environmental factors, human factors, roadway characteristics, and accident-related meta-features. In the model comparison, the StackTrafficRiskPrediction model achieves an accuracy of 0.9613, 0.9069, and 0.7508 in predicting fatal, serious, and minor accidents, respectively, which significantly outperforms the traditional logistic regression model. In the experimental part, we analyzed the severity of traffic accidents under different age groups of drivers, driving experience, road conditions, light and weather conditions. The results showed that drivers between 31 and 50 years of age with 2 to 5 years of driving experience were more likely to be involved in serious crashes. In addition, it was found that drivers tend to adopt a more cautious driving style in poor road and weather conditions, which increases the margin of safety. In terms of model evaluation, the StackTrafficRiskPrediction model performs best in terms of accuracy, recall, and ROC–AUC values, but performs poorly in predicting small-sample categories. Our study also revealed limitations of the current methodology, such as the sample imbalance problem and the limitations of environmental and human factors in the study. Future research can overcome these limitations by collecting more diverse data, exploring a wider range of influencing factors, and applying more advanced data analysis techniques.

1. Introduction

Traffic accidents have escalated into a significant global public health issue, resulting in a considerable number of fatalities and injuries annually. According to the 2018 Global Status Report on Road Safety by the World Health Organization (WHO), approximately 1.35 million individuals experience road accidents worldwide annually, with traffic-related injuries being the leading cause of death among individuals aged 5 to 29 years [1]. Consequently, the prevention and reduction in traffic accidents on an international scale are an imperative necessity. During our investigation into the effects of urbanization on traffic accidents, it was discerned that human factors are crucial in influencing traffic accident occurrences in numerous countries and regions. Data collected from the World Health Organization (WHO) indicate that approximately 10% of road traffic deaths are related to drink driving; this corresponds to self-reported rates of 16–21% of people admitting to drink driving in a survey conducted by the European Survey Research Association (ESRA). The same self-reports reveal that nearly 50% of drivers across 48 countries report exceeding the speed limit outside built-up areas [2]. Speeding, drink-driving, driver fatigue, distracted driving, and non-use of safety belts, child restraints and helmets are among the key behaviours contributing to road injury and death [3]. Vulnerable road users such as pedestrians, cyclists, moped riders, and motorcyclists are particularly at high risk of severe or fatal injury when motor vehicles collide with them because of their lack of protection [4].
In our investigation of the effects of urbanization on traffic accidents, we determined that human factors play a pivotal role in influencing traffic accident occurrences across various countries and regions. Particularly in Morocco, human factors have been identified as one of the primary reasons behind the nation’s roads being ranked among the most perilous globally. A survey conducted in Sudan revealed that individual factors were responsible for 60.6% of traffic accidents, with suboptimal road conditions (45.5%), animal-related factors (5.6%), and vehicle scarcity (1.4%) also contributing significantly [5]. The Czech In-depth Accident Study (CzIDAS) indicates that distractions account for 40% of the analyzed accidents, highlighting the significance of this factor. Distractions may stem from a variety of causes, including attention overload (35%), distracted driving (19%), and monotonous driving (13%) [6]. Furthermore, the likelihood of road traffic accidents is directly correlated with environmental factors such as rainfall, extreme low temperatures, fog, and hot weather conditions. The incident rates of accidents are 34%, 25%, 21%, and 20%, respectively, attributable to fog, rain, temperature variances, and additional weather-related factors [7]. From a geographical standpoint, the proportion of fatal traffic collisions is notably higher in rural regions (66%) compared to urban areas (34%). Accidents predominantly occur on straight roads, succeeded by curved roads, intersections, and Y/T intersections, which witness the highest rates of traffic fatalities [8]. This paragraph accentuates the impact of human factors, environmental conditions, and geographical location on the rates of traffic accidents, factors that are especially critical in the context of urbanization. Urbanization directly influences road-use patterns and traffic flow, thereby significantly impacting traffic safety.
However, challenges remain in the realm of traffic safety research. The issue of data imbalance in traffic accident studies is a persistent concern [9,10], as is the need for greater interpretability and transparency in traffic safety risk analysis [11,12,13]. Additionally, while much research has focused on local attributes of traffic accidents, there is growing recognition of the importance of incorporating contextual information from the entire scene for a more explicit and classification [14,15].
In light of these findings, there is a growing need for advanced methods to analyze and predict traffic crash risk. Traditional models, while valuable, have limitations in terms of predictive accuracy and the ability to handle complex, multifaceted data. This gap highlights the need for new methods that combine the strengths of various approaches to provide more accurate analysis. This study introduces StackTrafficRiskPrediction, a predictive model of traffic risk hazard, which is a pioneering attempt in the field of traffic safety analysis. In this study, a series of classification models are first utilized to generate meta-features, which are subsequently applied to train a regression model, i.e., a meta-model. In this way, we are able to not only capture the underlying patterns of the data using classification models, but also provide greater flexibility and accuracy in predicting continuous outputs through regression models. Our results not only provide an effective framework for predicting injury severity in traffic accidents, but also offer new perspectives on the application of machine learning in the field of traffic safety.

2. Literature Review

Within the scholarly discourse on traffic accident severity classification, accidents are typically categorized into the following three distinct types: “fatal”, “serious”, and “minor”. Fatal crashes, defined as accidents resulting in the death of one or more individuals, have a profound global impact. Research underscores this, noting that on average, 1.35 million people perish annually in traffic accidents [16,17]. Serious accidents refer to incidents that culminate in substantial injuries, albeit non-fatal in nature. The severity of these accidents is typically assessed based on the quantity of individuals injured and the extent of direct property damage incurred [18]. Minor accidents are characterized by less severe injuries, and while the direct discourse on such incidents is limited, ancillary research implicitly addresses these minor injuries through the analysis of various accident types and their influence on overall accident severity [19]. These classifications offer a foundational framework for comprehending the diverse severities of injuries sustained in traffic accidents and are pivotal in the development of tailored prevention strategies and interventions.
An exhaustive review of the literature pertaining to factors influencing traffic accidents reveals that meteorological conditions, roadway conditions, and individual factors are integral in determining the frequency and severity of traffic accidents. Meteorological conditions exert a substantial impact on traffic accidents, with varying weather conditions influencing different types of accidents in distinct manners, for instance, snowy conditions predominantly affect cycling accidents, whereas daylight glare significantly elevates the risk of multi-vehicle collisions on highways [20,21,22,23,24]. Roadway conditions, encompassing aspects such as traffic congestion and the state of the pavement, play a pivotal role in the incidence of accidents. Research has elucidated an inverse correlation between traffic congestion and the frequency of accidents, while the condition of the road surface has also been found to significantly influence the occurrence of accidents [25,26]. Individual factors, particularly those encompassing driver error and fatigue, exert a profound impact on the incidence of road accidents. While existing research has delved into the relationship between personal factors and traffic accidents, a notable research gap remains regarding the precise assessment of the impact of personal factors, particularly in relation to drivers’ psychological and physiological states on accidents [27,28]. These studies illuminate the myriad factors influencing road accidents and underscore areas necessitating further exploration in future research endeavors to enhance overall road safety.
Conventional traffic accident data analysis methodologies have been employed to meticulously examine traffic safety issues, utilizing a spectrum of data analysis techniques including plain Bayesian classifiers, logistic regression, linear regression, K-nearest neighbours (K-NN) algorithms, K-mean clustering algorithms, auto-encoders, transfer learning, and transformer techniques. These methods are extensively utilized in road safety research, encompassing a broad spectrum of aspects ranging from road condition analysis to driving behaviour assessment and the development of collision warning systems. Plain Bayesian classifiers have gained particular prominence in applications such as pavement detection and the safety assessment of driving behaviour [29,30,31]. Logistic regression has been used to analyze accident severity and driving behaviour [32,33,34], whereas linear regression has played an important role in studies on the relationship between economic dynamics, road design improvements and traffic safety [35,36,37]. K-NN algorithms have shown their clustering and classification capabilities in accident prediction and case retrieval [38,39]. K-mean clustering and auto-coders have been used to extract hidden information from traffic accident data and to performing accident hotspot identification [40,41,42]. Transfer learning and transformer techniques have shown potential in traffic accident risk prediction and detection [43,44,45,46]. These research methodologies not only demonstrate the diversity and intricacy of data analytics within the realm of traffic safety, but also highlight potential limitations and chart out future research trajectories for the application of these techniques in real-world traffic scenarios.
Research in applied traffic accident analysis has focused on the following three areas: traffic accident prediction, real-time traffic behaviour analysis, and driver fatigue and distraction detection. Research in traffic accident prediction focuses on understanding the factors that lead to accidents and applying various machine learning models to make predictions, especially on motorways and high-class roads [47,48]. Real-time traffic behaviour analysis uses advanced techniques such as linking vehicle data for real-time assessment of traffic safety and analyzing the driving behaviour of urban bus drivers [49]. The field of driver fatigue and distraction detection, on the other hand, focuses on the development of effective detection methods and systems, including identification using machine learning techniques [50,51,52]. These studies elucidate the multifaceted nature and intricacy of road safety research, simultaneously identifying the limitations of current studies and outlining prospective avenues for future research. This includes refining the applicability of predictive models, converting research findings into actionable road safety measures, and augmenting the thoroughness and scalability of real-time assessment frameworks.
Research in contextual information analysis of traffic accidents focuses on understanding personality and behavioural traits in traffic accidents, utilizing nationwide traffic accident datasets, and applying advanced technologies such as the Internet of Vehicles (IoV) and artificial intelligence (AI) for accident prediction and prevention. Research has shown that driver personality and behavioural patterns have a significant impact on traffic safety [53,54,55,56]. In addition, the use of metadata and meta-features is becoming increasingly important in crash analysis, as these techniques can improve the accuracy and efficiency of crash detection, understand the relationship between driving behaviour and crash risk, and perform long-term trend analysis [57,58,59]. Collectively, these studies underscore the significance of comprehending contextual factors in traffic accidents and exemplify the implementation of sophisticated techniques such as artificial intelligence, machine learning, and context-aware systems in exhaustive traffic accident analysis. These studies furnish the field with novel insights, methodologies, and data resources, bearing significant practical implications for the enhancement of traffic safety and the prevention of accidents.
The application and analysis of metadata are becoming important research directions in the field of traffic accident analysis. The utilization of metadata not only improves the accuracy and efficiency of traffic accident detection, but also provides insights for understanding the context and causes of accidents. For example, a traffic accident detection model developed using a metadata registry demonstrates how the accuracy of accident detection can be improved [60]. Through meta-analysis of the relationship between traffic violations and accidents, researchers have been able to reveal biases between self-reported and archived data as well as provide insights into the link between personality traits and traffic accidents [57]. On a technical level, the development of multidimensional design methods for spatial data warehouses and geo-decision tools demonstrates the important application of metadata in spatial analysis and road accident analysis [59]. Long-term trend analyses using metadata, such as the analysis of road accidents in the Ugandan region, have revealed patterns and trends in accident occurrence [61]. These studies show that metadata play a key role in improving traffic safety and preventing accidents.
Overall, these studies not only provide insights into the meta-characterization of traffic accidents, but also provide valuable references for future traffic safety management and accident prevention strategies. By integrating multiple data and models, the application of meta-characterization shows great potential in improving traffic safety.

3. Research Methodology

Based on the detailed background provided in the previous two chapters, the experimental design in Chapter 3 focuses on developing and validating the StackTrafficRiskPrediction model as shown in Figure 1. The study began with data collection, followed by data cleaning to deal with incomplete and erroneous data. This was immediately followed by feature extraction, focusing on traffic risk features. After defining and selecting the meta-features, the meta-feature generation process was performed. Then, the meta-model was designed, and regression techniques were selected to integrate it into a complete model. In the comparison phase, the new model was compared with existing models. Finally, a training and evaluation phase was performed, which included a training process and evaluation metrics to assess model performance. The entire process emphasizes a step-by-step approach from data preprocessing to model comparison and evaluation to ensure model accuracy and validity.

3.1. Model Structural Design

3.1.1. Objective

The main goal of the StackTrafficRiskPrediction model is to improve the accuracy of traffic accident risk prediction by utilizing stacked integrated learning methods. This model aims to improve the prediction of traffic accident severity by creating meta-features through a classification-based base model. It integrates multiple factors, including environmental conditions, road characteristics, and human factors, to comprehensively analyze the complexity of traffic accidents and enhance prediction.

3.1.2. Meta Model Structure

The StackTrafficRiskPrediction model is a sophisticated ensemble learning framework that combines multiple machine learning techniques to improve the prediction of traffic crash risks. The architecture of this model is built upon two primary layers, the base layer and the meta-model layer as shown in Figure 2.
(1)
Base Layer (Classification Models):
  • Composition: This layer comprises a series of different classification models. Each model is designed to capture specific aspects of traffic accident data, such as accident severity, type of accident, and contributing factors.
  • Function: These models analyze various features of the data, like weather conditions, road types, and driver behaviors, to classify different aspects of traffic accidents.
  • Output: The primary output of this layer is a set of meta-features. These are derived from the predictions of each classification model and represent a higher-level abstraction of the data.
(2)
Meta-Model Layer (Regression Model):
  • Integration: The meta-model is a regression model that takes the meta-features generated by the base layer as its input. This layer effectively synthesizes the insights gained from the base classification models into a cohesive prediction.
  • Algorithm selection: Logistics regression was chosen for the regression algorithm in the meta-model.
  • Objective: The purpose of the meta-model is to predict the continuous risk score of traffic accidents, providing a nuanced understanding of the likelihood and severity of accidents under various conditions.
(3)
Stacking Mechanism:
  • Principle: The model employs a stacking approach where the predictions of several base classifiers serve as input features for the meta-model. This approach harnesses the strengths of different models, mitigating their individual weaknesses.
  • Advantage: By combining multiple models, the StackTrafficRiskPrediction model aims to capture a broader spectrum of patterns and relationships within the data, which might be missed by a single model.
(4)
Integration with Classification Models:
  • The output of the classification model is first converted into meta-features. These meta-features are normalized to ensure consistency in their scales and distributions, making the meta-features suitable as inputs to the meta-model. In the process of weighting and combining meta-features, different weights are assigned to each meta-feature based on their predictive power and relevance. In addition, the study employs feature selection and dimensionality reduction techniques to refine the meta-feature set. Then, in the model training and tuning phase, the meta-model is trained on the basis of these meta-features with the goal of minimizing the prediction error and optimizing the performance metrics.

3.2. Data Collection and Preprocessing

3.2.1. Data Collection

The StackTrafficRiskPrediction model utilizes data from multiple sources for the analysis of factors influencing traffic accidents. These sources include data from police and transportation department reports, providing detailed information on each accident, including time, location, type of vehicles involved, nature of the accident, weather data, road condition, and casualties, as shown in Table 1. In this study, 4000 traffic accidents were selected as data sets from February 2016 to December 2020.

3.2.2. Data Cleaning

Data collected from these various sources contain inconsistencies, missing values, and outliers. The cleaning process includes the following steps:
  • Dealing with missing values: depending on the nature and extent of the missing data, missing values are identified, and records of missing values are removed.
  • Consistency checking: this is carried out to ensure that data from different sources are consistent in terms of units, scale, and format.

3.3. Definition and Selection of Meta-Features

3.3.1. Definition

In machine learning and statistical modeling, meta-features usually refer to features derived from the original data set to enhance the predictiveness and interpretability of the model. Traditionally, these features might include statistical descriptors, model-based predictions, or be the product of feature engineering [62]. In this study, the traditional meta-feature definition is extended and applied to the context of traffic accident risk prediction. The meta-features studied are not only derived based on the raw data, but also include higher-order features derived from the predictions and internal states of the underlying classification model. These higher-order features can capture subtle patterns and relationships that cannot be observed or quantified through the raw data alone [63].

3.3.2. Selection

In terms of meta-feature selection, this study selected multiple types of meta-features to improve the accuracy and explanatory power of traffic accident risk prediction. Specifically, they include traditional statistical descriptor meta-features, meta-features based on traffic accident prediction results, and high-order meta-features derived from predictions and internal states of classification models. These meta-features not only reflect the fundamental properties of the original data, but also enhance the model’s predictive power by capturing deeper patterns and relationships.

3.3.3. Generation Process of Meta-Features

Traditional interactive variables or derived features, such as polynomial combination and categorical feature intersection, belong to traditional feature engineering methods. These methods mainly combine two or more original features through mathematical or logical operations to create new features to reveal possible interactive effects between these features.
  • Polynomial combination: By combining features through mathematical operations (such as multiplication) as shown in Table 2, new features are generated, such as multiplying “Age” and “Driving Experience” to obtain “Age_Experience”, which is used to reveal how these two variables jointly affect the risk of accidents.
  • Categorical feature crossover: This includes combining classification features into a new classification feature as shown in Table 3, such as combining “road conditions” with “weather conditions” to generate a new feature “Road_Weather”. These features capture direct relationships between variables by explicitly combining them in the original data.
Each base classification model in the StackTrafficRiskPrediction framework focuses on predicting the severity of traffic accidents, using the classification base model output probabilities as new features as shown in Table 4. At the same time, the input factors are shown in Table 1. This includes extracting features from the intermediate layers of the deep learning models, and capturing complex patterns learned by the models. Finally, it is ensured that these meta-features are properly normalized and transformed for input into the meta-model.
In contrast to the above feature engineering, the research uses transformers to obtain internal high-order features as Table 5. These features are extracted from the internal structure of the model and can reflect deeper data patterns and relationships. These outputs can reflect the contextual and deep semantic information in the text data. In the creation of internal high-level characteristics, 128 dimensions were studied to extract 128 characteristics of each traffic accident case.
Combining the above-mentioned ways of combining the features, the meta-features of this study were obtained.

3.4. Model Training and Evaluation

3.4.1. Training Process

  • Model Training: The training process involves feeding the training dataset into the model and iteratively adjusting the model parameters to minimize the loss function.
  • Complexity Management: To handle the complexity of the model, especially if using a deep learning approach, techniques like dropout and early stopping are employed to prevent overfitting.
  • Hyperparameter Tuning: Techniques like grid search can be used to find the optimal set of hyperparameters for the model.

3.4.2. Evaluation Metrics

For Classification Components:
  • Accuracy: Measures the proportion of correctly predicted instances.
  • Recall: Measures the proportion of actual positives that were correctly identified.
  • F1: The F1 score is the reconciled mean of precision and recall, and is a composite of precision and recall, particularly applicable to those cases where the categories are unbalanced.
Validation Techniques
  • Cross-Validation: K-fold cross-validation is used, especially for smaller datasets, to ensure that the model’s performance is consistent across different subsets of the data. This technique involves dividing the data into k subsets and training the model k times, each time using a different subset as the test set and the remaining as the training set.
  • Performance Benchmarking: The model’s performance is compared with established benchmarks or similar models in the field to assess its relative effectiveness.
In summary, the training and evaluation of the StackTrafficRiskPrediction model require careful consideration of data handling, model complexity, and appropriate evaluation metrics. The combination of different metrics for classification and regression components will provide a greater understanding of the model’s performance.

4. Results and Discussion

After experiments, the performance of the severity prediction model of traffic accidents based on the meta-based model was obtained as follows Table 6. This meta-model performs best in categorizing minor accidents with very high accuracy. It also showed some reliability in predicting serious and fatal accidents. And when comparing the model without meta characteristics, the accuracy rate is higher than other models.
The results of the five-fold cross-validation are shown in Table 7, which shows the performance of the meta-model on different accident severity levels (fatal, serious, and light). For fatal accidents, the accuracy of the model averages 0.8248 and reaches a maximum of 0.9396, which indicates that the model has high accuracy and stability for predicting fatal accidents. However, it performs relatively poorly in the prediction of serious accidents, with an average accuracy of 0.7336, with the lowest accuracy dropping to 0.6094, which may point out that the model has some limitations or needs further optimization in dealing with such accidents.
For light accidents, the model performed similarly to fatal accidents, with an average accuracy of 0.7503, which shows that the model is relatively balanced but slightly less accurate in predicting light accidents than fatal accidents. In addition, there is a small difference in the minimum accuracy between the predictions of minor and fatal accidents, which suggests that there is some consistency in the model’s performance in predicting accidents of different severities. Overall, the meta-model showed some volatility in the prediction of traffic accidents at various severity levels, especially the fluctuation of accuracy on the prediction of severe accidents, which requires targeted improvement or adjustment of the model parameters to improve the accuracy and stability of the prediction in subsequent studies.
After analyzing the data from the study, as shown in Figure 3, it was found that people between 31 and 50 years old are prone to major traffic accidents. Also, when analyzing the data on driving experience and severity of traffic risk, it was found that drivers with 2–5 years of experience were more likely to be involved in traffic accidents. Among the factors about road surface, light and weather, the study found that when drivers encounter bad road surface and weather, they instead drive more carefully and have a higher safety margin than a normal driving environment.
As shown in Figure 4, without the addition of meta-features, the study found a correlation between “Accident_severity” and several factors. In particular, “Number_of_casualties” has a significant positive correlation with accident severity, meaning that as the number of casualties in an accident increase, the severity of the accident tends to increase. In addition, ‘Light_conditions’ also showed some degree of correlation with accident severity, suggesting that the severity of accidents varies under different light conditions. However, factors such as ‘Weather_conditions’, ‘Road_surface_conditions’ and ‘Type_of_collision’ were associated with the ‘Type_of_collision’. Factors such as “Accident_severity” correlate strongly with “Road_surface_conditions” and “Type_of_collision”, suggesting that they are major factors in accident severity. Therefore, the meta-feature selection in the study was performed by combining these features to form a new dataset based on the base model of the study.
The prediction results of each base model were derived after the training and evaluation of the model, as shown in Table 8. In the performance evaluation of the different base models of the StackTrafficRiskPrediction model, we find that the GradientBoostingClassifier performs the best on all the metrics, with the highest accuracy, recall, and F1 scores, and shows optimal performance on the ROC–AUC values. RandomForestClassifier and LogisticRegression follow closely, and these two models have better F1 scores and ROC–AUC values while maintaining high accuracy and recall, showing a more balanced performance. AdaBoostClassifier (AdaBoostClassifier) also shows good performance similar to logistic regression. In contrast, Gaussian Naive Bayes and KNeighborsClassifier, while performing moderately well in terms of accuracy and recall, were slightly lacking in terms of F1 scores and ROC–AUC values. The DecisionTreeClassifier performed the worst on this dataset, especially on the ROC–AUC values, possibly due to overfitting or failing to effectively capture the complexity of the data.
In evaluating the predictive performance of the GradientBoostingClassifier model as shown in Table 9, it can be analyzed in terms of its precision, recall, F1 score, and overall accuracy on different categories. The model performs well in terms of overall accuracy, reaching 0.77, while its weighted avg (weighted avg) precision, recall, and F1 score are 0.75, 0.77, and 0.76, respectively, which shows a high prediction efficiency taking into account the difference in the number of samples in the categories. In particular, on category 2, the model exhibits high precision (0.85), recall (0.89), and F1 score (0.87), indicating a significant advantage in prediction in this category. However, in terms of macro avg precision, recall and F1 score, the average performance of the model on different categories is only around 0.37, reflecting a more insufficient performance on small-sample categories (especially categories 0 and 1), which may be related to the insufficient number of samples and the imbalance of categories. In summary, the GradientBoostingClassifier performs well in dealing with major categories, but still needs to be improved in terms of prediction accuracy on small-sample categories to achieve a more balanced and prediction effect.
This heat map shows the correlation between various factors and accident severity in Figure 5. The depth of the color indicates the strength of the correlation, where red represents a positive correlation and blue represents a negative correlation. Analyzing the chart reveals that no factors show a very strong positive correlation with accident severity. However, Light_conditions and Age_of_driver showed strong negative correlations with accident severity, suggesting that better lighting conditions or certain age groups of drivers may lead to lower accident severity. Weather_conditions also showed a negative correlation, but the correlation was not particularly strong.
Comparative analysis of the performance of the meta-model with several other models (including logistic regression, decision tree classifier, K nearest neighbor classifier, Gaussian Naive Bayes, random forest classifier, AdaBoost classifier and gradient boosting classifier) was carried out. Finally, we discovered some salient features of the meta-model and its advantages and disadvantages, as shown in Table 10.
First of all, the meta-model performs outstandingly in processing “Fatal”-type events with an accuracy of 0.9613, which is much higher than the other models, showing its potential in identifying serious events. However, the performance of the meta-model in terms of precision and recall is unsatisfactory. Its precision rate is only 0.0344, the recall rate is 0.1111, and the F1 score is extremely low, only 0.0526. This shows that although the model can identify “Fatal” events well, it still needs to be greatly improved in terms of certainty and coverage.
For “Serious” and “Light”-type events, the meta-model’s performance also shows certain advantages. In the “Serious”-type event, its accuracy reached 0.9069, but it also faced problems of low precision and low recall, and its corresponding F1 score was only 0.0241. In the “Light”-type event, the meta-model showed high accuracy (0.7508), precision (0.8837) and recall (0.7524), and the F1 score reached 0.8128, showing good overall performance.
Overall, the performance of the meta-model in processing different types of events varies. Its main advantage lies in its high accuracy for “Fatal”-type events, indicating that it can effectively distinguish serious events in some cases. However, this model is generally low in precision and recall, especially when dealing with “Fatal” and “Serious”-type events, which may lead to a large number of misjudgments and missed misjudgments, thus affecting the actual application effect of the model. Therefore, future work should focus on improving the precision and recall of the meta-model to achieve more balanced and reliable performance.
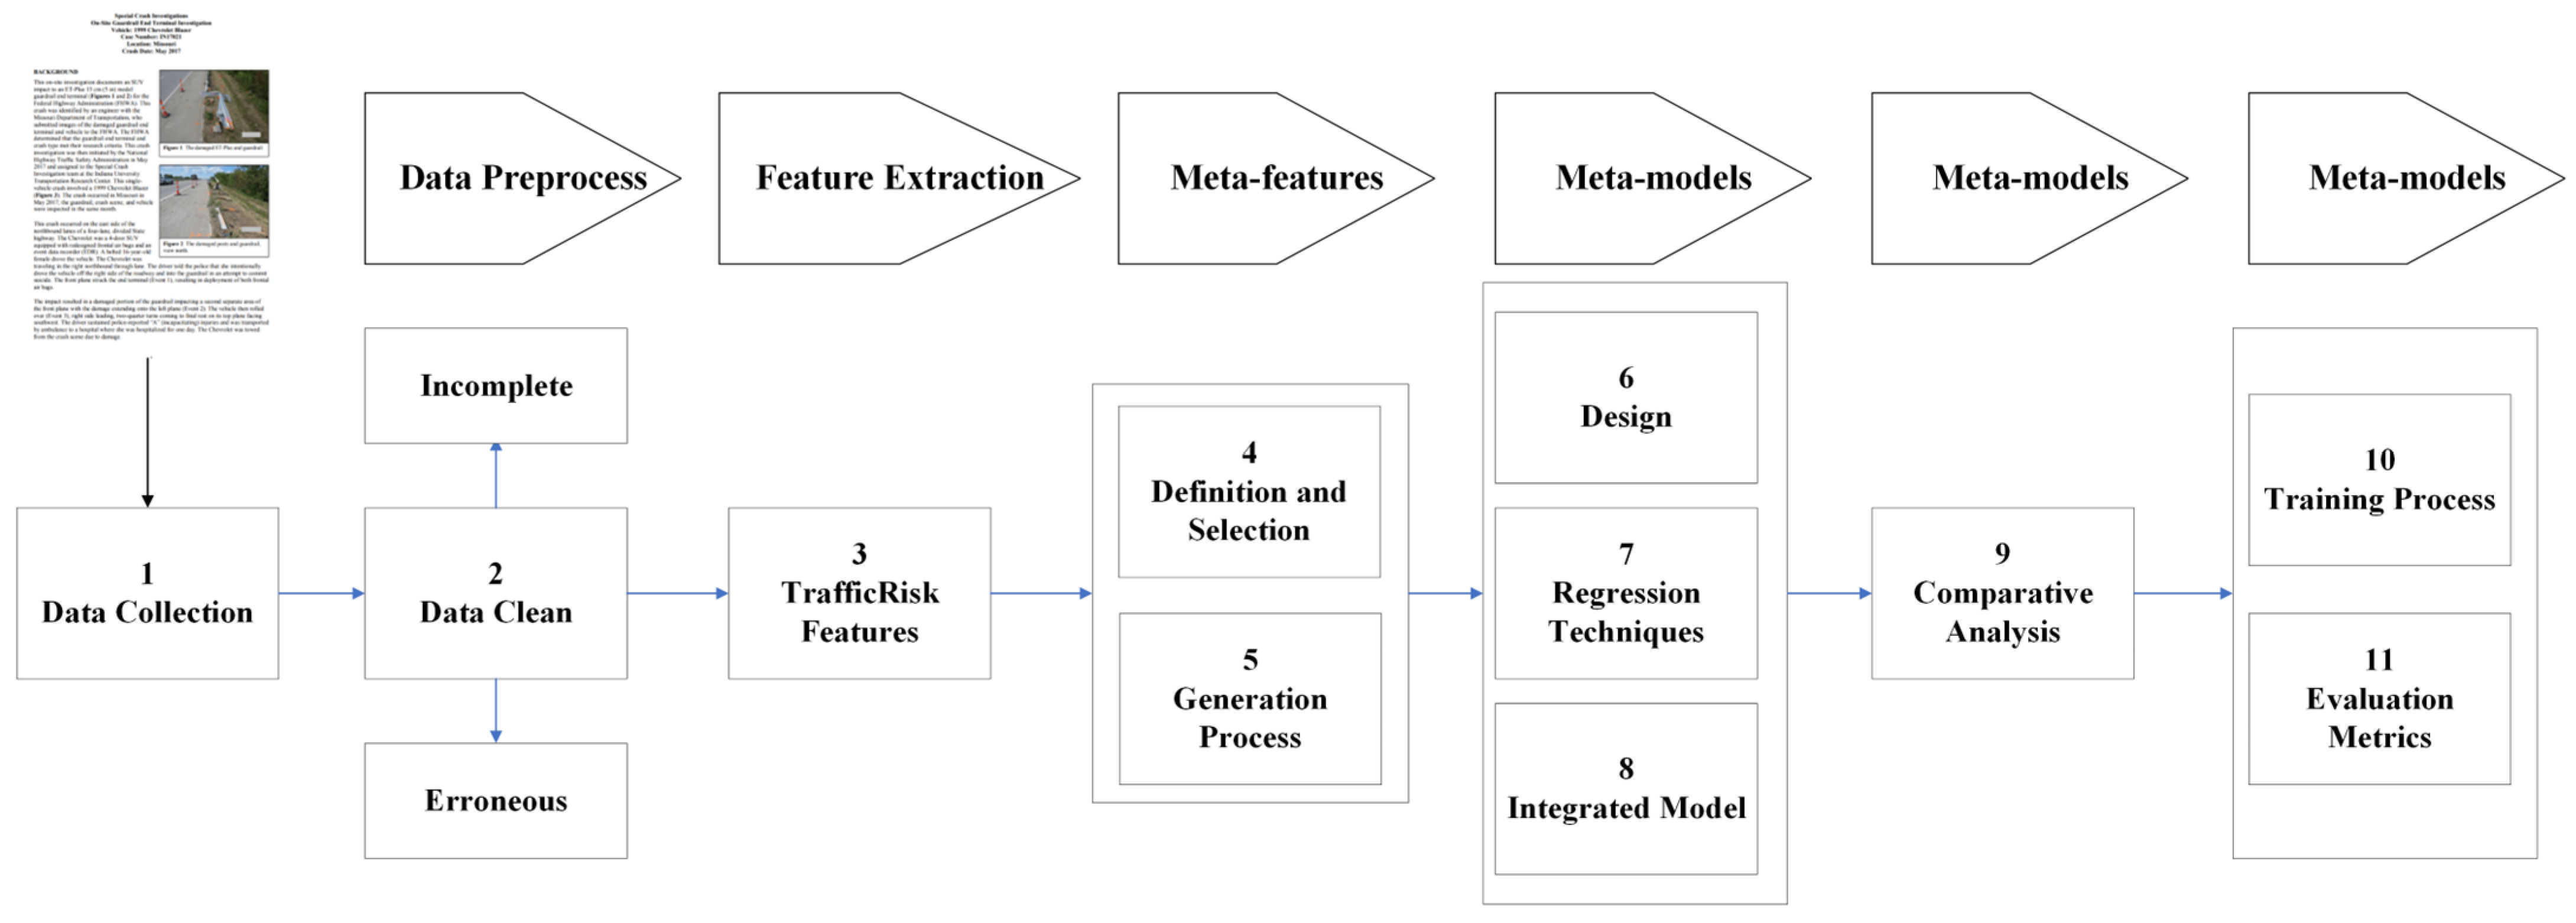
In the StackTrafficRiskPrediction framework, the meta-model is an advanced regression model designed to capture the complex relationships between traffic risk factors and predict the severity of traffic accidents by integrating multiple meta-features derived from different basic classification models. This model structure includes an input layer, multiple processing layers and an output layer, which is designed to process and output the level of traffic accident risk through a deep neural network. Meta-features include combined features and base model predicted probabilities, and the choice of regression technique—first classifying severity using a random forest classifier and subsequently modeling using linear regression—is based on the properties of the meta-feature and the size and complexity of the data.
However, although the meta-model shows high accuracy in the prediction of “Fatal”-type events, it performs poorly in terms of precision and recall overall, especially when dealing with “Fatal” and “Serious”-type events. This performance may be due to problems in several aspects, i.e., the integration of meta-features may not be sufficient, the model may be too simplified and fail to simulate the complex relationships between data in detail, or the model may be overfitted on specific data, resulting in insufficient generalization ability.
In response to the above problems, there are still some methods to improve the performance of the meta-model. First, we can strengthen feature engineering, which can further analyze and integrate more diverse features, such as introducing time series analysis or data features of specific locations to enhance the model’s ability to handle complex predictive capabilities of traffic scenarios. Secondly, to optimize the model structure, we can consider adjusting the existing neural network architecture and explore the application of new deep learning technologies, such as convolutional neural networks (CNNs) or long short-term memory networks (LSTMs). These technologies can better handle time and spatially dependent data. Finally, the model training method can be strengthened, and more advanced cross-validation and regularization strategies can be adopted to avoid overfitting and ensure that the model has good prediction accuracy and adaptability to unseen data. By implementing these improvements, the meta-model will be able to more effectively assess and predict traffic accident risks and provide more accurate and reliable decision support for traffic safety management.

5. Conclusions

In this study, the research introduces the StackTrafficRiskPrediction model, which is a method for predicting the severity of traffic crashes by utilizing meta-features derived from environmental, human factors and traffic characteristics. The results show that the model is effective in identifying key factors affecting the risk of traffic crashes, such as driver age, driving experience, road surface conditions, lighting conditions, and weather conditions.
The innovative aspect of our work is the meta-modeling approach, in which we employ a stacked integrated learning strategy. This strategy utilizes the outputs of various underlying classification models as meta-features, which are subsequently used to train regression models aimed at predicting the severity of traffic accidents. A comparative performance analysis shows that the meta-model has an accuracy of 0.9613, 0.9069, and 0.7508 in predicting fatal, serious, and minor accidents, respectively, demonstrating high predictive effectiveness, and excels especially when dealing with fatal and serious accident prediction. This approach allows for a more detailed picture of complex patterns in the data, thus improving the overall predictive accuracy of the model. In contrast, traditional logistic regression models perform poorly in these areas, with accuracies of only 0.7182, 0.8669, and 0.6289 in predicting fatal, serious, and minor accidents. This further highlights the superiority of the StackTrafficRiskPrediction model.
Despite these advantages, we also observed that although the model performs well in predicting major categories such as accident severity, its accuracy is limited when dealing with categories with smaller sample sizes. In addition, our study highlights some limitations that need to be addressed. The problem of sample imbalance, especially in small categories, suggests the need for further data collection and integration to enhance the generalization ability of the model. In addition, although this study focused on specific environmental and human factors, it did not cover all potential factors that may affect the risk of traffic accidents. Future research could gain a more comprehensive understanding of crash risk by exploring other influencing factors such as vehicle technology and roadway design.
In conclusion, the StackTrafficRiskPrediction model demonstrates great potential in advancing the field of traffic accident risk prediction. By continually refining and extending the model, we aim to develop more robust tools and strategies for traffic safety management and accident prevention that can significantly reduce the incidence and severity of traffic accidents.

Author Contributions

Conceptualization, W.S. and L.N.A.; methodology, W.S.; software, W.S.; validation, W.S., L.N.A., P.S.S. and F.K.; formal analysis, W.S.; investigation, W.S.; resources, W.S.; data curation, W.S.; writing—original draft preparation, W.S.; writing—review and editing, L.N.A., P.S.S. and F.K.; visualization, W.S.; supervision, W.S.; project administration, L.N.A. All authors have read and agreed to the published version of the manuscript.

Funding

This research received no external funding.

Data Availability Statement

The data presented in this study are available on request from the corresponding author.

Conflicts of Interest

The authors declare no conflict of interest.

References

  1. World Health Organization. Global Status Report on Road Safety 2018; World Health Organization: Geneva, Switzerland, 2018; Available online: https://www.who.int/publications/i/item/9789241565684 (accessed on 6 April 2024).
  2. World Health Organization. Global Status Report on Road Safety 2023; World Health Organization: Geneva, Switzerland, 2023; Available online: https://www.who.int/publications/i/item/9789240086517 (accessed on 6 April 2024).
  3. World Health Organization. Global Plan for the Decade of Action for Road Safety 2021–2030; World Health Organization: Geneva, Switzerland, 2021; Available online: https://www.who.int/teams/social-determinants-of-health/safety-and-mobility/decade-of-action-for-road-safety-2021-2030 (accessed on 6 April 2024).
  4. UN ESCAP. Road Safety: Saving Lives beyond 2020 in the Asia-Pacific Region. 2020. Available online: https://hdl.handle.net/20.500.12870/2881 (accessed on 6 April 2024).
  5. Deme, D. Review on factors causes road traffic accident in Africa. J. Civ. Eng. Res. Technol. 2019, 1, 1–8. [Google Scholar] [CrossRef]
  6. Bucsuházy, K.; Matuchová, E.; Zůvala, R.; Moravcová, P.; Kostíková, M.; Mikulec, R. Human factors contributing to the road traffic accident occurrence. Transp. Res. Procedia 2020, 45, 555–561. [Google Scholar] [CrossRef]
  7. Hammad, H.M.; Ashraf, M.; Abbas, F.; Bakhat, H.F.; Qaisrani, S.A.; Mubeen, M.; Fahad, S.; Awais, M. Environmental factors affecting the frequency of road traffic accidents: A case study of sub-urban area of Pakistan. Environ. Sci. Pollut. Res. 2019, 26, 11674–11685. [Google Scholar] [CrossRef] [PubMed]
  8. Darma, Y.; Karim, M.R.; Abdullah, S. An analysis of Malaysia road traffic death distribution by road environment. Sādhanā 2017, 42, 1605–1615. [Google Scholar] [CrossRef]
  9. Parsa, A.B.; Taghipour, H.; Derrible, S.; Mohammadian, A. Real-time accident detection: Coping with imbalanced data. Accid. Anal. Prev. 2019, 129, 202–210. [Google Scholar] [CrossRef]
  10. Zhang, Z.; Niu, Z.; Li, Y.; Ma, X.; Sun, S. Research on the influence factors of accident severity of new energy vehicles based on ensemble learning. Front. Energy Res. 2023, 11, 1329688. [Google Scholar] [CrossRef]
  11. Adadi, A.; Berrada, M. Peeking Inside the Black-Box: A Survey on Explainable Artificial Intelligence (XAI). IEEE Access 2018, 6, 52138–52160. [Google Scholar] [CrossRef]
  12. Coeckelbergh, M. Artificial Intelligence, Responsibility Attribution, and a Relational Justification of Explainability. Sci. Eng. Ethics 2020, 26, 2051–2068. [Google Scholar] [CrossRef]
  13. Gilpin, L.H.; Bau, D.; Yuan, B.Z.; Bajwa, A.; Specter, M.; Kagal, L. Explaining Explanations: An Overview of Interpretability of Machine Learning. arXiv 2019, arXiv:1806.00069. [Google Scholar]
  14. Kumar, S.; Mahima Srivastava, D.K.; Kharya, P.; Sachan, N.; Kiran, K. Analysis of risk factors contributing to road traffic accidents in a tertiary care hospital. A hospital based cross-sectional study. Chin. J. Traumatol. 2020, 23, 159–162. [Google Scholar] [CrossRef]
  15. Panda, C.; Dash, A.K.; Dash, D.P. Assessment of Risk Factors of Road Traffic Accidents: A Panel Model Analysis of Several States in India. Vis. J. Bus. Perspect. 2020, 23, 097226292211132. [Google Scholar] [CrossRef]
  16. Ahmed, S.K.; Mohammed, M.G.; Abdulqadir, S.O.; El-Kader RG, A.; El-Shall, N.A.; Chandran, D.; Rehman ME, U.; Dhama, K. Road traffic accidental injuries and deaths: A neglected global health issue. Health Sci. Rep. 2023, 6, e1240. [Google Scholar] [CrossRef] [PubMed]
  17. Chand, A.; Jayesh, S.; Bhasi, A.B. Road traffic accidents: An overview of data sources, analysis techniques and contributing factors. Mater. Today Proc. 2021, 47, 5135–5141. [Google Scholar] [CrossRef]
  18. Jianfeng, X.; Hongyu, G.; Jian, T.; Liu, L.; Haizhu, L. A classification and recognition model for the severity of road traffic accident. Adv. Mech. Eng. 2019, 11, 168781401985189. [Google Scholar] [CrossRef]
  19. Yang, Z.; Zhang, W.; Feng, J. Predicting multiple types of traffic accident severity with explanations: A multi-task deep learning framework. Saf. Sci. 2022, 146, 105522. [Google Scholar] [CrossRef]
  20. Becker, N.; Rust, H.W.; Ulbrich, U. Weather impacts on various types of road crashes: A quantitative analysis using generalized additive models. Eur. Transp. Res. Rev. 2022, 14, 37. [Google Scholar] [CrossRef]
  21. Drosu, A.; Cofaru, C.; Popescu, M.V. Relationships between Accident Severity and Weather and Roadway Adherence Factors in Crashes Occurred in Different Type of Collisions. In The 30th SIAR International Congress of Automotive and Transport Engineering: Science and Management of Automotive and Transportation Engineering; Springer International Publishing: Cham, Switzerland, 2020; pp. 251–264. [Google Scholar]
  22. Edwards, J.B. The Relationship Between Road Accident Severity and Recorded Weather. J. Saf. Res. 1998, 29, 249–262. [Google Scholar] [CrossRef]
  23. Lio, C.-F.; Cheong, H.-H.; Un, C.-H.; Lo, I.-L.; Tsai, S.-Y. The association between meteorological variables and road traffic injuries: A study from Macao. PeerJ 2019, 7, e6438. [Google Scholar] [CrossRef] [PubMed]
  24. Xing, F.; Huang, H.; Zhan, Z.; Zhai, X.; Ou, C.; Sze, N.N.; Hon, K.K. Hourly associations between weather factors and traffic crashes: Non-linear and lag effects. Anal. Methods Accid. Res. 2019, 24, 100109. [Google Scholar] [CrossRef]
  25. Mkwata, R.; Chong, E.E.M. Effect of pavement surface conditions on road traffic accident—A Review. E3S Web Conf. 2022, 347, 01017. [Google Scholar] [CrossRef]
  26. Retallack, A.E.; Ostendorf, B. Current Understanding of the Effects of Congestion on Traffic Accidents. Int. J. Environ. Res. Public Health 2019, 16, 3400. [Google Scholar] [CrossRef] [PubMed]
  27. Gopalakrishnan, S. A Public Health Perspective of Road Traffic Accidents. J. Fam. Med. Prim. Care 2012, 1, 144. [Google Scholar] [CrossRef] [PubMed]
  28. Paramasivan, K.; Subburaj, R.; Sharma, V.M.; Sudarsanam, N. Relationship between mobility and road traffic injuries during COVID-19 pandemic—The role of attendant factors. PLoS ONE 2022, 17, e0268190. [Google Scholar] [CrossRef] [PubMed]
  29. Tijani, A.; Molyet, R.; Alam, M. Collision Warning System Using Naïve Bayes Classifier. Tech. Rom. J. Appl. Sci. Technol. 2022, 4, 39–56. [Google Scholar] [CrossRef]
  30. Yang, F.J. An implementation of naive bayes classifier. In Proceedings of the 2018 International Conference on Computational Science and Computational Intelligence (CSCI), Las Vegas, NV, USA, 12–14 December 2018; IEEE: New York, NY, USA, 2018; pp. 301–306. [Google Scholar]
  31. Yang, L.; Aghaabbasi, M.; Ali, M.; Jan, A.; Bouallegue, B.; Javed, M.F.; Salem, N.M. Comparative Analysis of the Optimized KNN, SVM, and Ensemble DT Models Using Bayesian Optimization for Predicting Pedestrian Fatalities: An Advance towards Realizing the Sustainable Safety of Pedestrians. Sustainability 2022, 14, 10467. [Google Scholar] [CrossRef]
  32. Ashqar, H.I.; Shaheen, Q.H.; Ashur, S.A.; Rakha, H.A. Impact of risk factors on work zone crashes using logistic models and Random Forest. In Proceedings of the 2021 IEEE International Intelligent Transportation Systems Conference (ITSC), Indianapolis, IN, USA, 19–22 September 2021; IEEE: New York, NY, USA, 2021; pp. 1815–1820. [Google Scholar]
  33. Eboli, L.; Forciniti, C.; Mazzulla, G. Factors influencing accident severity: An analysis by road accident type. Transp. Res. Procedia 2020, 47, 449–456. [Google Scholar] [CrossRef]
  34. Otte, D.; Facius, T.; Brand, S. Serious injuries in the traffic accident situation: Definition, importance and orientation for countermeasures based on a representative sample of in-depth-accident-cases in Germany. Int. J. Crashworth. 2018, 23, 18–31. [Google Scholar] [CrossRef]
  35. Aldala’in, S.A.; Sukor, N.S.A.; Obaidat, M.T. The Impact of Road Alignment toward Road Safety: A review from statistical perspective. In Proceedings of AICCE’19: Transforming the Nation for a Sustainable Tomorrow; Springer: Berlin/Heidelberg, Germany, 2020; Volume 4, pp. 729–735. [Google Scholar]
  36. Hauer, E. The Art of Regression Modeling in Road Safety; Springer: New York, NY, USA, 2015; Volume 38. [Google Scholar]
  37. Ranadive, M.S.; Das, B.B.; Mehta, Y.A.; Gupta, R. (Eds.) Recent Trends in Construction Technology and Management: Select Proceedings of ACTM 2021; Springer Nature: Singapore, 2023; Volume 260. [Google Scholar] [CrossRef]
  38. Dong, X.; Lu, M. Optimal Road accident case retrieval algorithm based on k -nearest neighbor. Adv. Mech. Eng. 2019, 11, 168781401882452. [Google Scholar] [CrossRef]
  39. Hatti, M. (Ed.) Artificial Intelligence and Heuristics for Smart Energy Efficiency in Smart Cities: Case Study: Tipasa, Algeria; Springer Nature: Singapore, 2021; Volume 361. [Google Scholar]
  40. Anderson, T.K. Kernel density estimation and K-means clustering to profile road accident hotspots. Accid. Anal. Prev. 2009, 41, 359–364. [Google Scholar] [CrossRef]
  41. Priyanka, G.; Jayakarthik, D.R. Road Safety Analysis by Using K-Means Algorithm. Int. J. Pure Appl. Math. 2020, 119, 253–257. [Google Scholar]
  42. Puspitasari, D.; Wahyudi, M.; Rizaldi, M.; Nurhadi, A.; Ramanda, K.; Sumanto. K-Means Algorithm for Clustering the Location of Accident-Prone on the Highway. J. Phys. Conf. Ser. 2020, 1641, 012086. [Google Scholar] [CrossRef]
  43. Kang, M.; Lee, W.; Hwang, K.; Yoon, Y. Vision Transformer for Detecting Critical Situations and Extracting Functional Scenario for Automated Vehicle Safety Assessment. Sustainability 2022, 14, 9680. [Google Scholar] [CrossRef]
  44. Liu, X.; Lu, J.; Chen, X.; Fong YH, C.; Ma, X.; Zhang, F. Attention based spatio-temporal graph convolutional network with focal loss for crash risk evaluation on urban road traffic network based on multi-source risks. Accid. Anal. Prev. 2023, 192, 107262. [Google Scholar] [CrossRef]
  45. Sohail, A.; Cheema, M.A.; Ali, M.E.; Toosi, A.N.; Rakha, H.A. Data-driven approaches for road safety: A comprehensive systematic literature review. Saf. Sci. 2023, 158, 105949. [Google Scholar] [CrossRef]
  46. Tamagusko, T.; Correia, M.G.; Huynh, M.A.; Ferreira, A. Deep Learning applied to Road Accident Detection with Transfer Learning and Synthetic Images. Transp. Res. Procedia 2022, 64, 90–97. [Google Scholar] [CrossRef]
  47. Silva, P.B.; Andrade, M.; Ferreira, S. Machine learning applied to road safety modeling: A systematic literature review. J. Traffic Transp. Eng. 2020, 7, 775–790. [Google Scholar] [CrossRef]
  48. Pourroostaei Ardakani, S.; Liang, X.; Mengistu, K.T.; So, R.S.; Wei, X.; He, B.; Cheshmehzangi, A. Road car accident prediction using a machine-learning-enabled data analysis. Sustainability 2023, 15, 5939. [Google Scholar] [CrossRef]
  49. Mussah, A.R.; Adu-Gyamfi, Y. Machine Learning Framework for Real-Time Assessment of Traffic Safety Utilizing Connected Vehicle Data. Sustainability 2022, 14, 15348. [Google Scholar] [CrossRef]
  50. Dong, B.-T.; Lin, H.-Y.; Chang, C.-C. Driver Fatigue and Distracted Driving Detection Using Random Forest and Convolutional Neural Network. Appl. Sci. 2022, 12, 8674. [Google Scholar] [CrossRef]
  51. Kashevnik, A.; Shchedrin, R.; Kaiser, C.; Stocker, A. Driver Distraction Detection Methods: A Literature Review and Framework. IEEE Access 2021, 9, 60063–60076. [Google Scholar] [CrossRef]
  52. Koay, H.V.; Chuah, J.H.; Chow, C.-O.; Chang, Y.-L. Detecting and recognizing driver distraction through various data modality using machine learning: A review, recent advances, simplified framework and open challenges (2014–2021). Eng. Appl. Artif. Intell. 2022, 115, 105309. [Google Scholar] [CrossRef]
  53. Aswad, M.; Al-Sultan, S.; Zedan, H. Context aware accidents prediction and prevention system for VANET. In Proceedings of the 3rd International Conference on Context-Aware Systems and Applications, Dubai, United Arab Emirates, 7–9 October 2014; pp. 162–168. [Google Scholar]
  54. Legree, P.J.; Heffner, T.S.; Psotka, J.; Martin, D.E.; Medsker, G.J. Traffic crash involvement: Experiential driving knowledge and stressful contextual antecedents. J. Appl. Psychol. 2003, 88, 15–26. [Google Scholar] [CrossRef] [PubMed]
  55. Sümer, N. Personality and behavioral predictors of traffic accidents: Testing a contextual mediated model. Accid. Anal. Prev. 2003, 35, 949–964. [Google Scholar] [CrossRef] [PubMed]
  56. Zhu, X.; Yuan, Y.; Hu, X.; Chiu, Y.-C.; Ma, Y.-L. A Bayesian Network model for contextual versus non-contextual driving behavior assessment. Transp. Res. Part C Emerg. Technol. 2017, 81, 172–187. [Google Scholar] [CrossRef]
  57. Af Wåhlberg, A.; Barraclough, P.; Freeman, J. Personality versus traffic accidents; meta-analysis of real and method effects. Transp. Res. Part F Traffic Psychol. Behav. 2017, 44, 90–104. [Google Scholar] [CrossRef]
  58. Barraclough, P.; Af Wåhlberg, A.; Freeman, J.; Watson, B.; Watson, A. Predicting Crashes Using Traffic Offences. A Meta-Analysis that Examines Potential Bias between Self-Report and Archival Data. PLoS ONE 2016, 11, e0153390. [Google Scholar] [CrossRef] [PubMed]
  59. Selmoune, N.; Derbal, K.; Alimazighi, Z. Spatial Data Warehouse Multidimensional Design Approach and Geo-Decisional Tool for Road Accidents Analysis. In Proceedings of the 2019 International Conference on Information and Communication Technologies for Disaster Management (ICT-DM), Paris, France, 18–20 December 2019; IEEE: New York, NY, USA, 2019; pp. 1–8. [Google Scholar]
  60. Ki, Y.K.; Kim, J.W.; Baik, D.K. A traffic accident detection model using metadata registry. In Proceedings of the Fourth International Conference on Software Engineering Research, Management and Applications (SERA’06), Seattle, WA, USA, 9–11 August 2006; IEEE: New York, NY, USA, 2006; pp. 255–259. [Google Scholar]
  61. Balikuddembe, J.K.; Ardalan, A.; Khorasani-Zavareh, D.; Nejati, A.; Munanura, K.S. Road traffic incidents in Uganda: A systematic review study of a five-year trend. J. Inj. Violence Res. 2017, 9, 17–25. [Google Scholar] [CrossRef]
  62. Jomaa, H.S.; Schmidt-Thieme, L.; Grabocka, J. Dataset2vec: Learning dataset meta-features. Data Min. Knowl. Discov. 2021, 35, 964–985. [Google Scholar] [CrossRef]
  63. Zhou, H.; Xiao, S.; Zhang, S.; Peng, J.; Zhang, S.; Li, J. Jump Self-attention: Capturing High-order Statistics in Transformers. Adv. Neural Inf. Process. Syst. 2022, 35, 17899–17910. [Google Scholar]
Figure 1. Flow chart of StackTrafficRiskPrediction.
Vehicles 06 00034 g001
Figure 2. An overview of the StackTrafficRiskPrediction.
Vehicles 06 00034 g002
Figure 3. Incidents of severity of traffic accidents due to different factors. In summary, 1 means light, 2 means serious, and 3 means fatal. (a) Age_band_of_driver: Incidents of traffic accident severity due to driver age. (b) Driving_experience: Incidents of traffic accident severity due to driver experience. (c) Road_surface_conditions: Incidents of traffic accident severity due to road. (d) Light_conditions: Incidents of traffic accident severity due to light. (e) Weather_conditions: Incidents of traffic accident severity due to weather.
Vehicles 06 00034 g003
Figure 4. Heatmap of accident severity without meta-features.
Vehicles 06 00034 g004
Figure 5. Heatmap of accident severity with meta-features.
Vehicles 06 00034 g005
Table 1. Original data items.
ItemsExplanationTypes
TimeSpecific moment of the accident occurrence, usually indicated by hours and minutes.Randomness
Day_of_weekThe specific day of the week on which the accident occurred.‘Monday’, ‘Sunday’, ‘Friday’, ‘Wednesday’, ‘Saturday’, ‘Thursday’, ‘Tuesday’
Age_band_of_driverA categorized range indicating the age group of the driver involved.‘18–30’, ‘31–50’, ‘Under 18’, ‘Over 51’
Sex_of_driverThe gender of the driver involved in the accident.‘Male’, ‘Female’
Educational_levelThe highest level of formal education attained by the driver.‘Above high school’, ‘Junior high school’, ‘Elementary school’, ‘High school’
Driving_experienceThe total duration or years of experience the driver has in driving.‘1–2 yr’, ‘Above 10 yr’, ‘5–10 yr’, ‘2–5 yr’
Area_accident_occuredThe specific location or type of area where the accident took place.‘Residential areas’, ‘Office areas’, ‘Recreational areas’,
‘Industrial areas’, ‘Church areas’, ‘Market areas’, ‘Rural village areas’, ‘Outside rural areas’, ‘Hospital areas’, ‘School areas’, ‘Rural village areas Office areas’, ‘Recreational areas’
Road_surface_conditionsThe condition of the road at the accident spot.‘Dry’, ‘Wet or damp’, ‘Snow’, ‘Flood over 3 cm. deep’
Light_conditionsThe level of natural or artificial lighting at the time of the accident.‘Daylight’, ‘Darkness-lights lit’, ‘Darkness-no lighting’,
‘Darkness-lights unlit’
Weather_conditionsThe environmental weather conditions during the accident.‘Normal’, ‘Raining’, ‘Raining and Windy’, ‘Cloudy’, ‘Windy’, ‘Snow’, ‘Fog or mist’
IndividualThis term could refer to any single person involved in the accident, often focusing on their specific characteristics or role.‘Drinking’, ‘Normal’, ‘Operating’, ‘Talking’, ‘Texting’
Accident_severityThe classification of the accident based on its seriousness or consequences.‘Light’, ‘Serious’, ‘Fatal’
Table 2. Polynomial combination of meta-features.
ItemsExplanationTypes of Examples
Age_ExperienceThe effect of the interaction of age and experience on accident risk is revealed.‘(18–30) × (1–2 yr)’, ‘(31–50) × (1–2 yr)’, ‘(Under 18) × (1–2 yr)’, ‘(Over 51) × (1–2 yr)’, etc.
Table 3. Categorical feature crossover of meta-features.
ItemsExplanationTypes of Examples
Road_WeatherIndicates a combination of different pavement conditions in each weather.‘Dry-Normal’, ‘Wet or damp-Normal’, ‘Snow-Normal’, ‘Flood over 3 cm. deep-Normal’, etc.
Individual_RoadIndicates a combination of different personal factors in each roadway.‘Drinking-Dry’, ‘Normal-Dry’, ‘Operating-Dry’, ‘Talking-Dry’, ‘Texting-Dry’, etc.
Individual_WeatherIndicates combinations of different personal factors in each weather.‘Drinking-Raining’, ‘Normal-Raining’, ‘Operating-Raining’, ‘Talking-Raining’, ‘Texting-Raining’, etc.
Table 4. Value of meta-features.
ItemsExplanation
LogisticRegressionThe output from a logistic regression model can be used as a meta-feature, representing the probability of accident_severity occurring.
DecisionTreeClassifierThe decision paths taken in a decision tree, which lead to a certain prediction, can be encoded as meta-features.
KNeighborsClassifierFor each prediction, the count or proportion of neighbors voting for each class can be used as a meta-feature.
Gaussian Naive BayesThe posterior probabilities generated by GNB, based on the assumption of normally distributed features, can be used.
RandomForestClassifierRandom forests provide insights into feature importance, which can be used as meta-features.
AdaBoostClassifierAdaBoost focuses on instances that are harder to classify, adjusting weights accordingly.
GradientBoostingClassifierThe outputs from gradient boosting, which builds trees in a sequential correction manner, can be used.
Table 5. Meta-features of internal high-level characteristics.
Feature1Feature2Feature128
2.85379982.84972292.8519573
2.91217852.909592.9110537
2.7812812.78815842.7881358
Table 6. Performance of meta-model testing.
Model TypeFatalSeriousLight
Meta-model0.96130.90690.7508
LogisticRegression0.71820.86690.6289
Table 7. Five-fold validation of meta-model testing.
TypeFatalSeriousLight
Accuracy0.82830.75530.8283
0.73810.60940.6180
0.73390.76820.7639
0.88410.79820.7725
0.93960.73700.7715
Average0.82480.73360.7503
Table 8. Performance of basic models without meta-features.
ItemsAccuracyRecallF1 ScoreROC–AUC
LogisticRegression0.843750.843750.772240.61956
DecisionTreeClassifier0.744720.744720.753420.55011
KNeighborsClassifier0.826290.826290.769820.54124
Gaussian Naive Bayes0.814520.814520.762210.61222
RandomForestClassifier0.846180.846180.783710.68336
AdaBoostClassifier0.842530.842530.771810.62343
GradientBoostingClassifier0.848620.848620.784410.70539
Table 9. Prediction performance of GradientBoostingClassifier.
PrecisionRecallF1 ScoreSupport
00.080.040.0552
10.230.180.20552
20.850.890.873091
Accuracy 0.773695
Macro avg0.380.370.373695
Weighted avg0.750.770.763695
Table 10. Performance of meta-model with other models.
ItemsTypeAccuracyPrecisionRecallF1 Score
LogisticRegressionFatal0.71650.68290.15550.2533
Serious0.89690.06250.00210.0041
Light0.61160.63120.81570.7117
DecisionTreeClassifierFatal0.73650.56800.57870.5733
Serious0.82130.20870.26970.2353
Light0.66550.72770.69540.7112
KNeighborsClassifierFatal0.73020.58520.43890.5016
Serious0.89180.33330.05000.0870
Light0.64780.68070.75440.7157
Gaussian Naive BayesFatal0.69850.54220.24660.3390
Serious0.89600.42860.02500.0472
Light0.62710.63130.86750.7308
RandomForestClassifierFatal0.79550.72000.58380.6448
Serious0.87030.54550.20000.2927
Light0.75090.76230.82790.7937
AdaBoostClassifierFatal0.72680.63540.32970.4342
Serious0.86690.20830.23970.2153
Light0.69760.68680.87830.7708
GradientBoostingClassifierFatal0.78640.67860.30810.4238
Serious0.85350.50000.01670.0323
Light0.72080.68100.84870.7556
Meta-modelFatal0.96130.03440.11110.0526
Serious0.90690.05250.01210.0241
Light0.75080.88370.75240.8128
Disclaimer/Publisher’s Note: The statements, opinions and data contained in all publications are solely those of the individual author(s) and contributor(s) and not of MDPI and/or the editor(s). MDPI and/or the editor(s) disclaim responsibility for any injury to people or property resulting from any ideas, methods, instructions or products referred to in the content.

