
Numerical Simulation of Stress Disturbance Mechanism Caused by Hydraulic Fracturing of Shale Formation

1
School of Petroleum Engineering, Yangtze University, Wuhan 434025, China
2
Research Institute of CNOOC Shenzhen Branch, Shenzhen 518052, China
*
Author to whom correspondence should be addressed.
Processes 2024, 12(5), 886; https://0-doi-org.brum.beds.ac.uk/10.3390/pr12050886
Submission received: 2 April 2024
/
Revised: 24 April 2024
/
Accepted: 25 April 2024
/
Published: 27 April 2024
(This article belongs to the Special Issue Advanced Fracturing Technology for Oil and Gas Reservoir Stimulation)
Abstract
:Characterizing changes in rock properties is essential for the hydraulic fracture and re-fracture parameter optimization of shale formations. This paper proposed a hydraulic fracturing model to investigate the changes in rock properties during hydraulic fracturing using SPH, and the changes in the stress field and rock properties were quantitatively characterized. The simulation results indicated that the minimum horizontal principal stress increased by 10 MPa~15 MPa during fracture propagation, which is the main reason for the uneven propagation in multi-fracture propagation. Affected by the stress disturbance, the stimulated area was divided into four parts based on the changes in Young’s modulus and permeability; the more seriously the stress disturbance was affected, the higher the permeability of the stimulated zone was, and the smaller the stimulated zone was. Meanwhile, a zone with reduced permeability appeared due to the compression effect caused by the high injection pressure, and this increased with the increase in stress disturbance. The main reason for this was that strain formed because of the compression effect from the high injection pressure. The higher the stress disturbance, the higher the accumulated strain. This new model provides a new method for fracture parameter optimization, which also provides a foundation for the re-fracture parameter optimization of shale formations.
1. Introduction
Creating a complex fracture network is the key element for shale gas development because of the low permeability of shale formations [1,2]. This is an effective technology to improve the permeability of shale formations, but hydraulic fracturing also causes micro-earthquakes due to rock strain or stress disturbance. Hydraulic fracturing has become essential in recent decades [3]. During hydraulic fracturing, a large volume of fracturing fluid is injected into the shale formation. This leads to the compressional deformation of rocks due to the high net pressure inside the fractures. This compressional deformation is the main cause of stress disturbance during hydraulic fracturing. For the re-fracturing and hydraulic fracturing of adjacent wells, understanding the mechanism of stress perturbation and changes in rock properties is critical.
To determine the mechanism of hydraulic fracture distribution, numerical models of hydraulic fractures based on FEM, DEM, and FEM-DEM have been proposed, and the behavior of hydraulic fracture propagation has been determined [4,5]. It has clearly been shown that the horizontal principal stress difference is the parameter controlling crack propagation in multi-crack propagation simulations. This study suggests that increasing the cluster space and injection rate can cause the uniform propagation of multi-stage fractures. Furthermore, it has been observed that the pore pressure can control fracture propagation [6,7]. The hydraulic fractures tended to deflect to the high-pore-pressure areas while fracturing. In addition, the main factor limiting the propagation of intermediate fractures was the deflection of the maximum principal stress in the horizontal direction. The simulations showed that the spreading resistance increased by 6–8 MPa as a result of the deflection of maximum principal stress in the horizontal direction [8]. Meanwhile, natural fractures are also an important element in fracture networks. A series of numerical models have been developed to observe how hydraulic fractures propagate under varying principal horizontal stresses and angles of approach in order to investigate the relationship between natural and hydraulic fractures in fractured formations. The results showed that hydraulic fracturing occurred in the presence of natural fractures, and the following three types of fractures emerged: crossing, arresting, and terminating [9,10,11,12]. On the other hand, high principal stress in the horizontal direction and the approach angles inhibited the propagation of fractures [13,14]. The area with horizontal principal stress and angle of approach can be split into three parts based on how hydraulic fracture propagation occurs. The bedding surface interfered with the propagation of the hydraulic fracture in the vertical direction. In addition, the minimum principal stress in the horizontal direction and the stratigraphic thickness were found to be the most important geologic parameters affecting the fracture height. On the other hand, a large horizontal principal stress difference and great stratigraphic thickness may restrict the fracturing height in a single formation [15,16]. Additionally, thickening the fracturing fluid and boosting the injection rate have been shown to cause an increase in fracture height. The main goal of this study was to examine the factors contributing to surpassing the low fracture limit in shale formations, and it was found that high net pressures resulting from high injection rates and fracturing fluid viscosities play a significant role [17,18]. Experimental simulations to directly observe fracture extension were also conducted. The effects of stress, the injection parameters, and the rock mechanics on fracture extension were investigated using CT scans, and the results of the simulation were in good agreement with the experimental data.
As noted above, the study of hydraulic fracture growth in shale involves factors that influence the creation of an intricate fracture network. Understanding changes in the stress field and the rock properties of shale formations is of importance for significantly improving the productivity of the shale oil and gas industries via widespread re-fracturing. The currently used numerical model is inadequate to effectively describe the changes in the stress field and rock properties after hydraulic fracturing. Smoothed-particle hydrodynamics (SPH) is better suited to calculating the strain and stress fields. To investigate the stress perturbation mechanism and changes in rock properties during hydraulic fracturing, this work presents a new simulation method based on SPH to characterize the changes in the stress field and rock properties after hydraulic fracturing. In this simulation, the rock matrix is characterized by its particles, which effectively solves the problem of the predetermined fracture propagation path in the hydraulic fracturing procedure, resulting in a variety of extended fracture paths and the better characterization of stress field variations. Additionally, permeability is introduced to characterize fracture propagation and the creation of a high-permeability flow channel during the hydraulic fracturing process. Thus, the extension of hydraulic fractures can be effectively described by the changes in permeability.
2. Mathematical Methods
2.1. Boundary Conditions
As indicated in Figure 1, the whole domain was divided into two parts, , and the whole domain was bounded by . The normal vector indicates the direction of relative to the joint plane.
The classical strong forms of strong discontinuity equations are presented in [19] as follows:
where represents the traction, represents the mass density, represents the velocity, denotes the stress tensor, represents the body force, and represents the outward normal vector of the domain.
2.2. Governing Equations
During the simulations, the fracturing fluid was subject to mass and momentum conservation laws. These are expressed in the Lagrangian system as follows. The constitutive stress–strain relationship in rocks is also given in [20].
In the above equation, represents the pore pressure, denotes the Kronecker delta, and describes the second-order deviatoric stress tensor.
The results of the elastic and plastic strain calculations are as follows:
where represents the elastic strain, and denotes the plastic strain.
The generalized Hook’s law was used to determine the stress rate of the tensor [21]:
where represents the bulk moduli, represents the standard isotropic elastic tensor of the fourth order, represents the rate of deviatoric components of the elastic strain tensor, represents the shear moduli, and represents the rate of volumetric components of the elastic strain tensor.
This simulation considered the rock as a Drucker–Prager material, with a yield criterion that is represented by a circular cone surface and is given by
and
where and represent the angle of friction and the cohesion of the material, respectively.
2.3. Damage Evaluation
For the quantitative evaluation of rock damage during hydraulic fracturing, the hydraulic fracture propagation behavior is characterized by the D parameter:
where represents the fracture propagation velocity.
The simulation presented in this equation was used to control the growth of damage:
where .
A damage threshold in the following form was used to identify the damage condition:
where and represent the material properties that characterize fracture activation, and denotes the volume of the SPH particle.
Formation permeability after hydraulic fracturing was quantified as
where represents the initial permeability; denotes the principal stress; describes the pore pressure; and represents the Biot coefficient.
3. Simulation Results
3.1. Verification
In comparison with Zheng’s experiments [22], the effectiveness of the proposed model was verified. The rock specimens used were 30 cm × 30 cm × 30 cm. The center of the rock sample was the injection point. The simulated accumulated displacement was found to be similar to the results of the experiments. As illustrated in Figure 2, the established model proved to be effective, with a maximum accumulated displacement error of 5.7% for 4#DDS and an average error of 3.2% for the other three DDSs, which were compared to the experimental and simulation findings.
3.2. Model Description
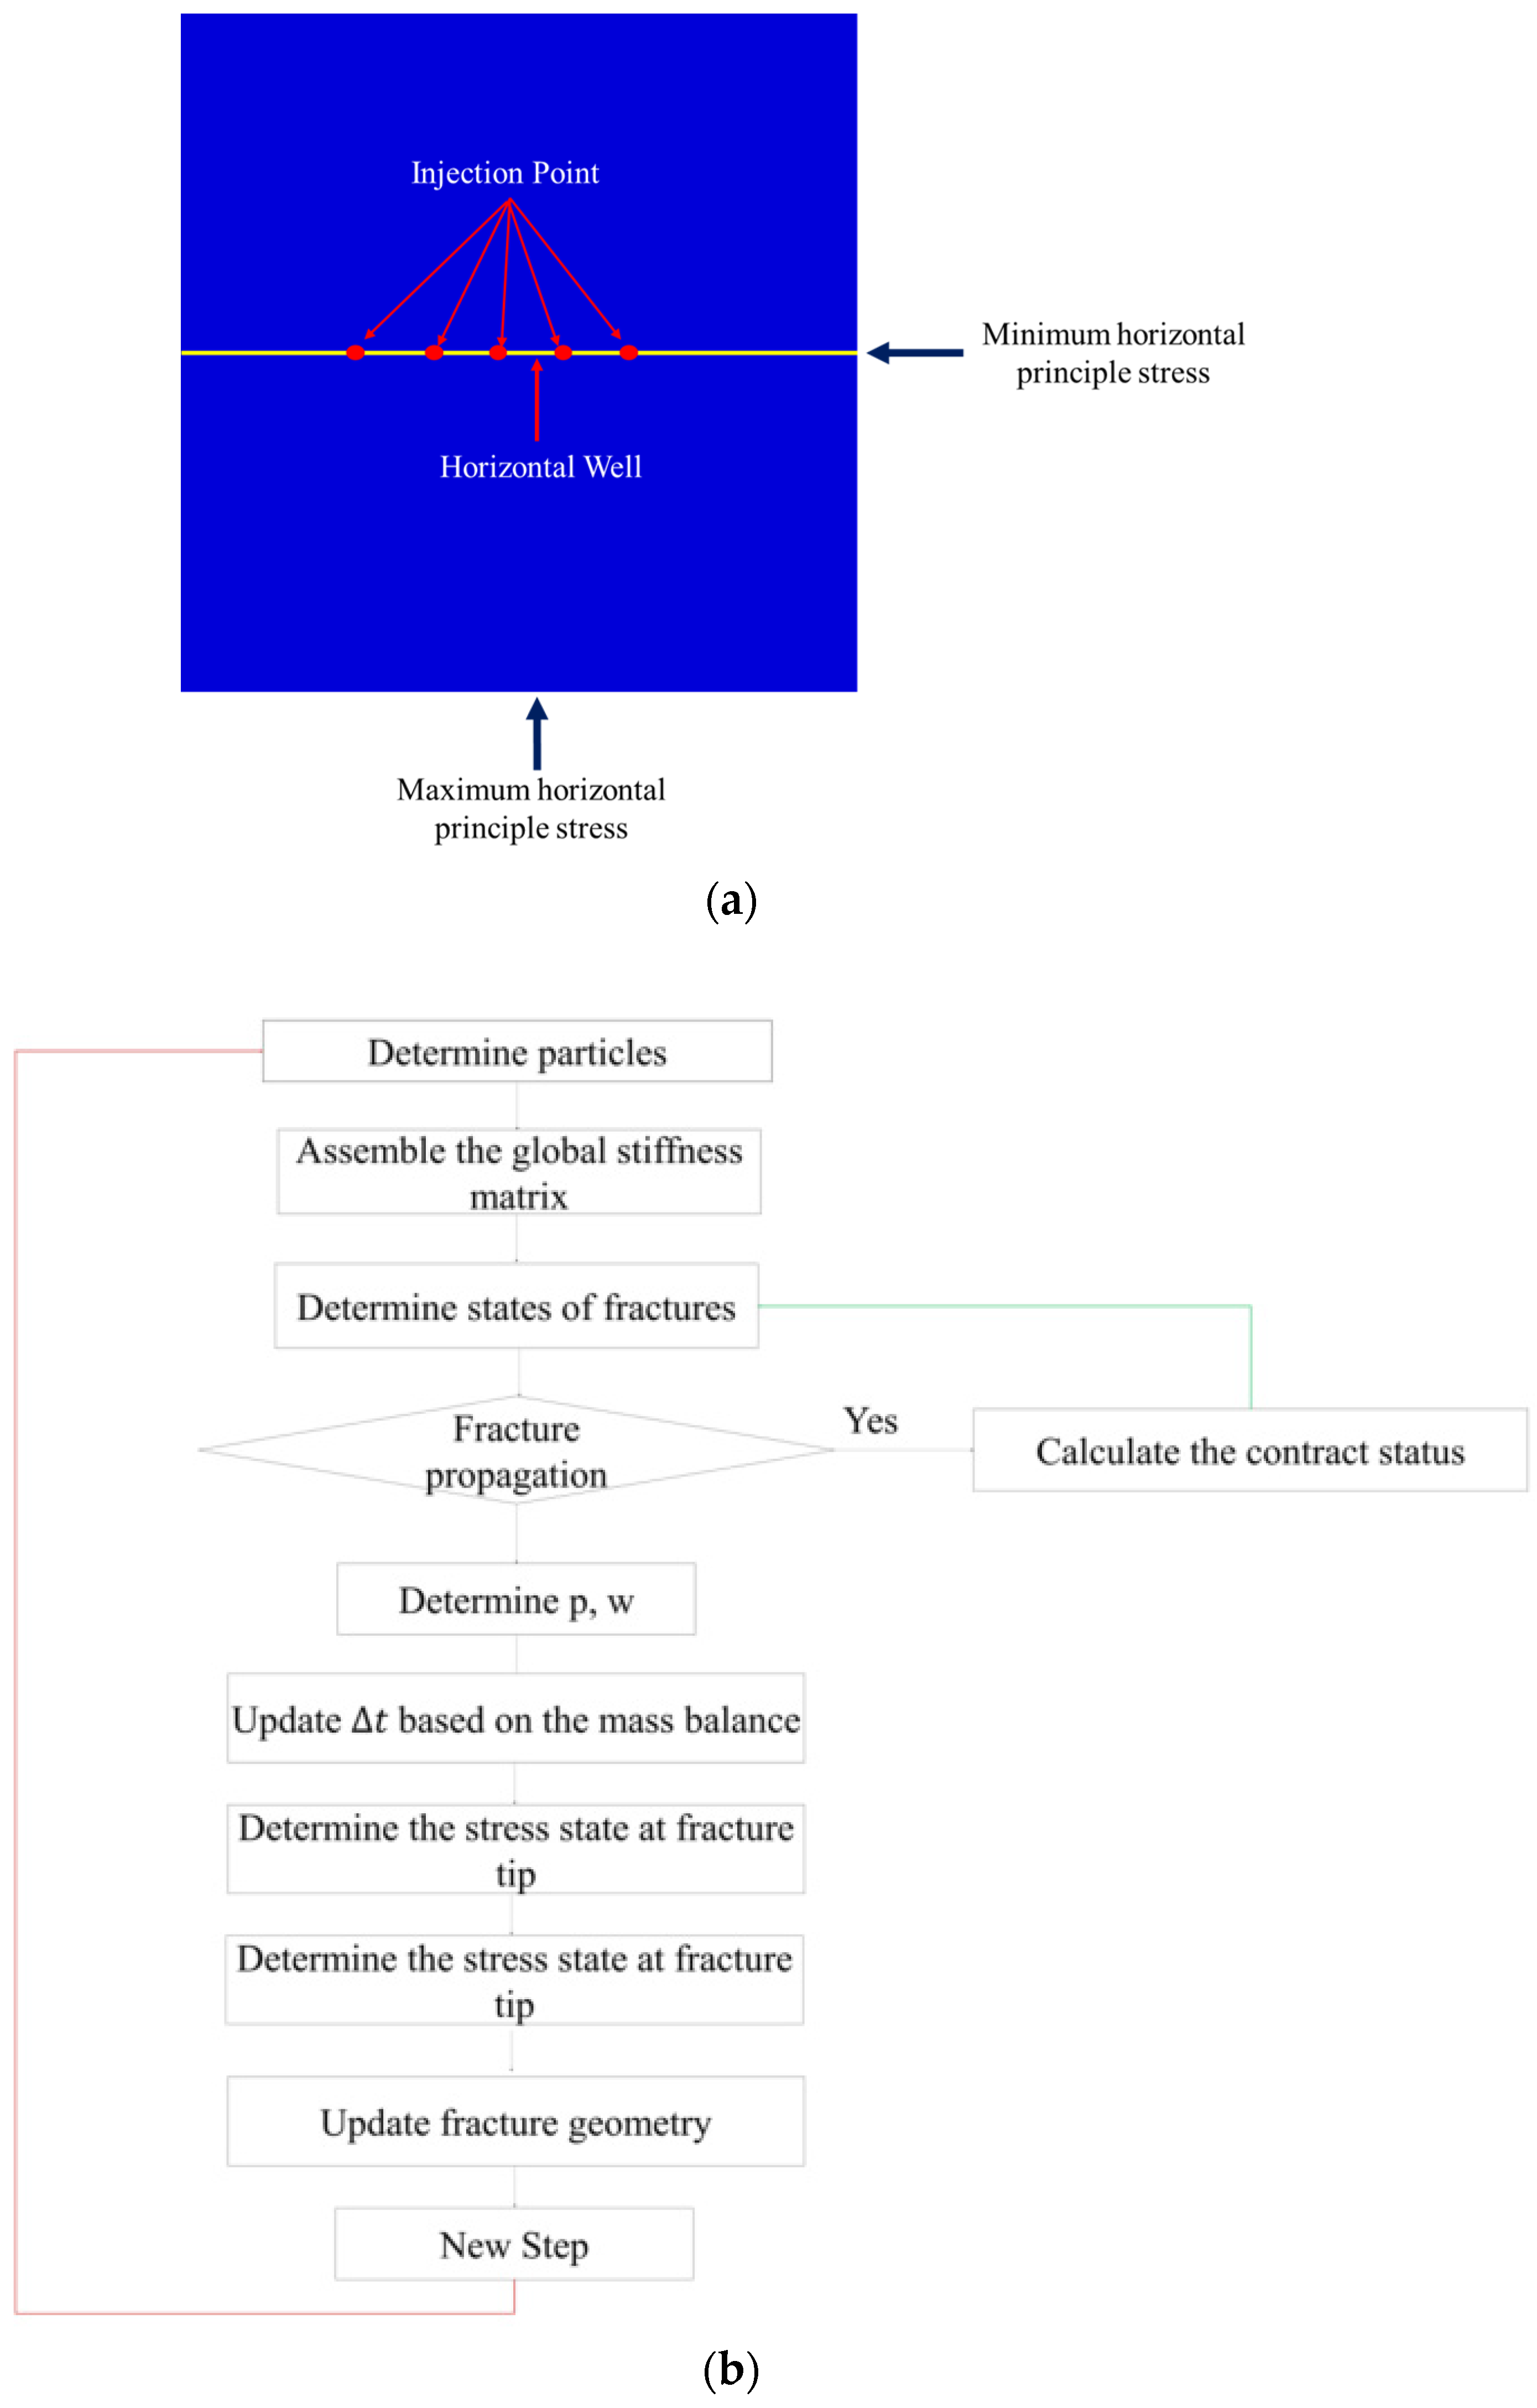
To study the changes in stress distribution and rock properties during hydraulic fracturing, numerical models were used to simulate the stress field and rock properties under different stimulated volumes. The numerical model size was 120 m × 120 m, and the injection points were located at the fracture opening. The principal stress distribution is shown in Figure 3a, and the calculation procedure is presented in Figure 3b. The stress field was under observation during the simulations, and the boundary conditions are listed in Table 1. The stress boundary conditions comprised the maximum and minimum horizontal principal stresses, the vertical stress, and the pore pressure. The generated fracture was characterized by permeability (Equation (15)), and the initial value was 0.35 mD, which was determined from its distribution. The calculation of the proposed hydraulic fracturing model used in the simulations is depicted in Figure 3b.
3.3. Results
Figure 4 depicts the distribution of hydraulic fractures under different clusters, with a cluster space of 15 m. The simulation results indicate that the hydraulic fractures were asymmetric in distribution, and the central fractures were much shorter than the adjacent fractures. Meanwhile, the fracture geometry was also very different. The main reason for this was that the horizontal principal stress experienced great changes during hydraulic fracturing. The whole simulation lasted for 1.4 h using the Windows 11 system. The UMAT program was developed, which was embedded into ABAQUS to study the propagation of fractures.
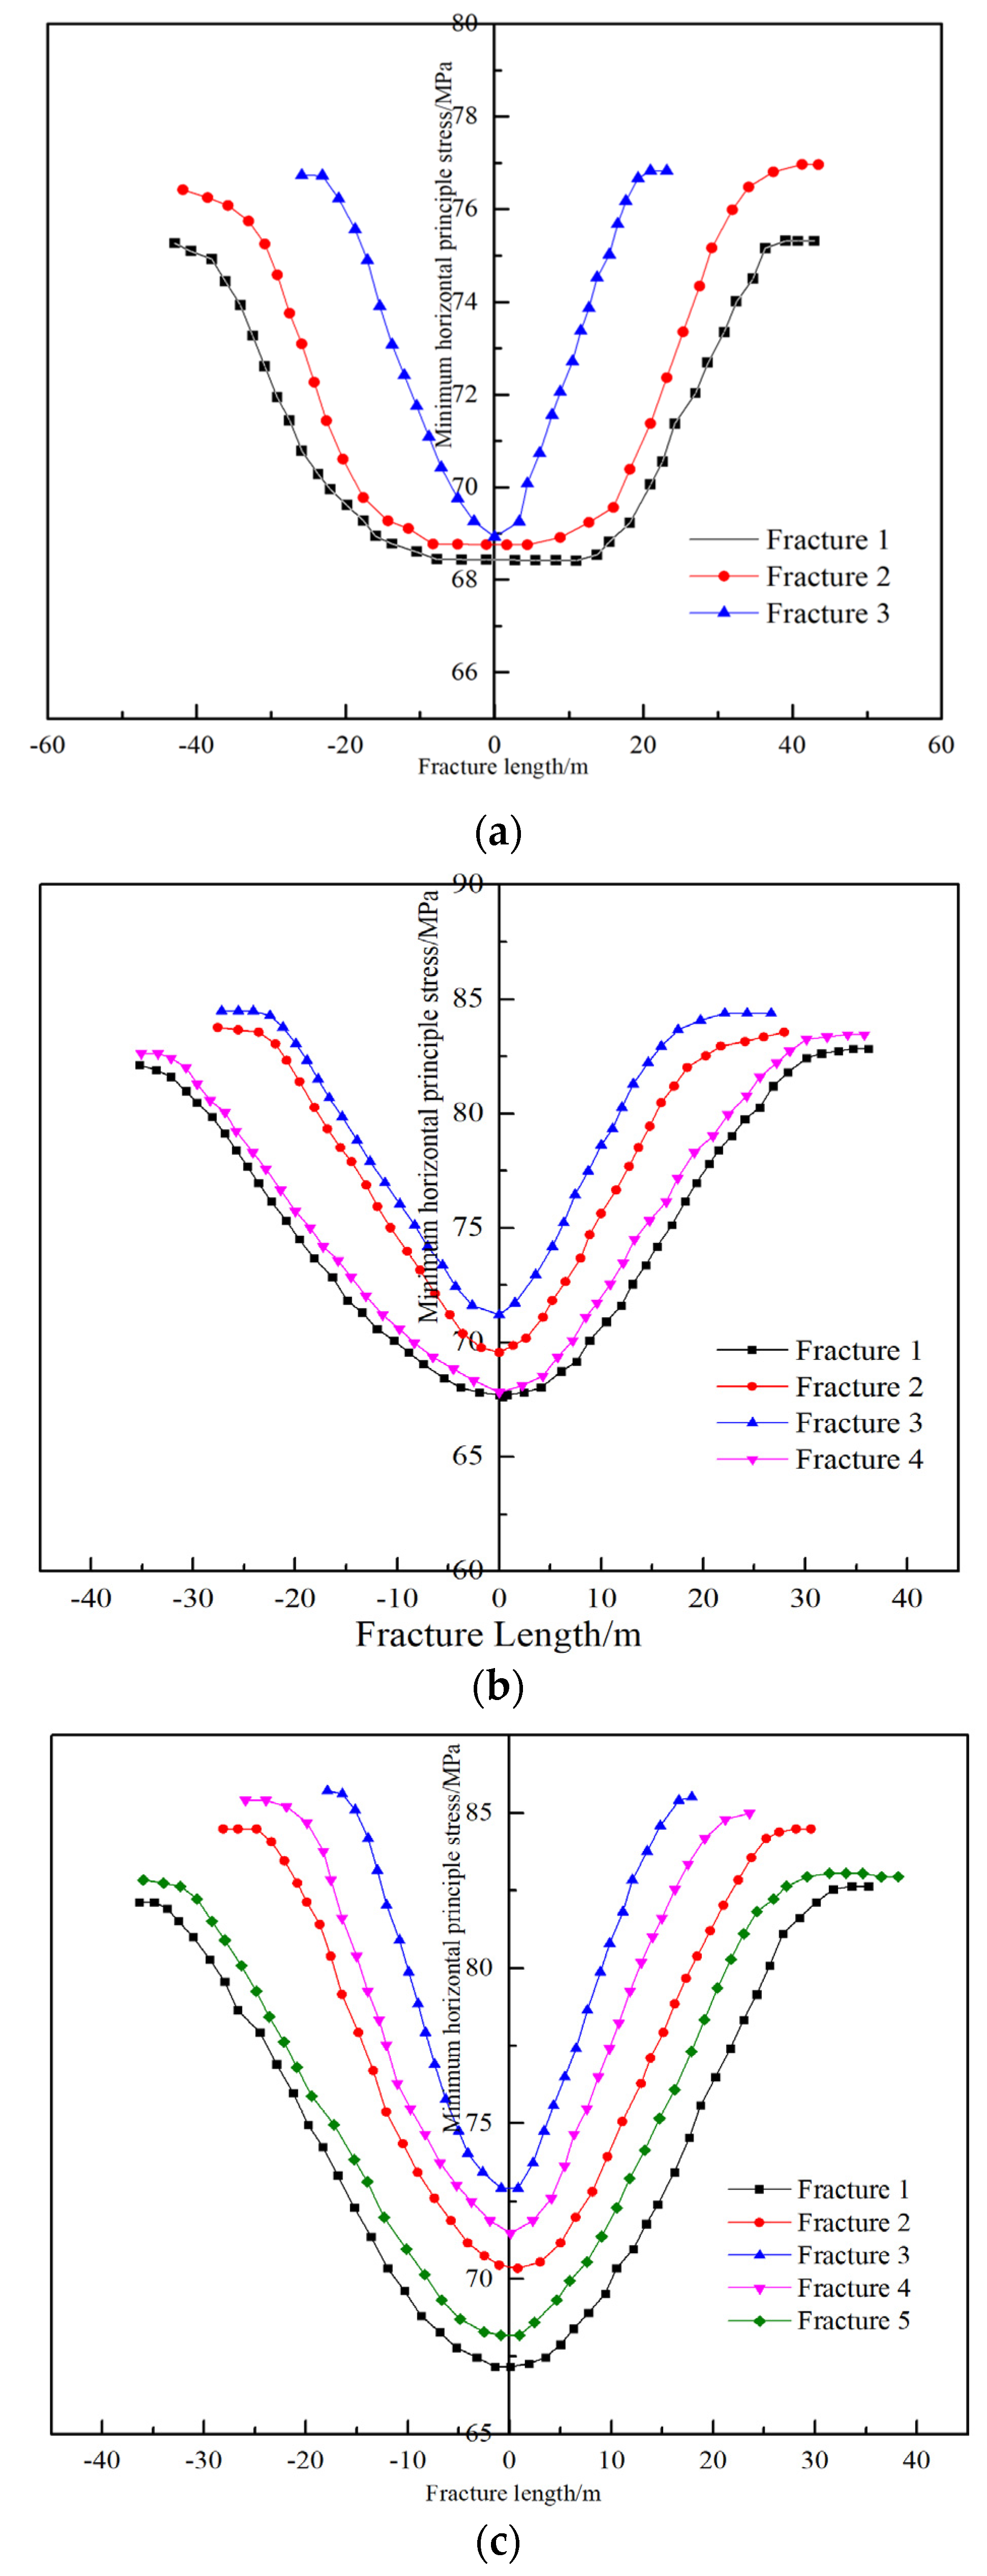
To help define the changes in this stress, Figure 5 shows the minimum principal stress in the horizontal direction along the hydraulic fracture. From the simulations, it can be seen that the minimum principal stress in the horizontal direction increased greatly during hydraulic fracture propagation. From Figure 5a, it can be seen that the minimum principal stress in the horizontal direction increased to 76.96 MPa when three cracks were formed, and those of the other two cracks were 75.31 MPa and 76.27 MPa. The average minimum horizontal principal stresses were 70.39 MPa, 74.27 MPa, and 71.32 MPa, which was the main reason for the limitation of the middle crack. Figure 5b shows that the lowest value of minimum principal stress in the horizontal direction was at the injection point, and this increased with hydraulic fracture propagation. After hydraulic fracturing, the highest value of minimum principal stress in the horizontal direction was 84.39 MPa for fracture 3, and its average increase in the horizontal direction was 8.27 MPa. The minimum principal stress in the horizontal direction increased by 45.34% on average, as shown in Figure 5a. Figure 5c shows that the minimum principal stress in the horizontal direction was 81.62 MPa for fracture 1 after hydraulic fracturing, and this increased to 85.61 MPa and 86.34 MPa for fractures 2 and 3, respectively. Meanwhile, the average increase in minimum principal stress in the horizontal direction increased to 11.37 MPa, which increased by 99.82%. In addition, it can also be found that the minimum principal stress in the horizontal direction had a funnel shape. This indicates that the stress disturbance area increased with the number of fractures.
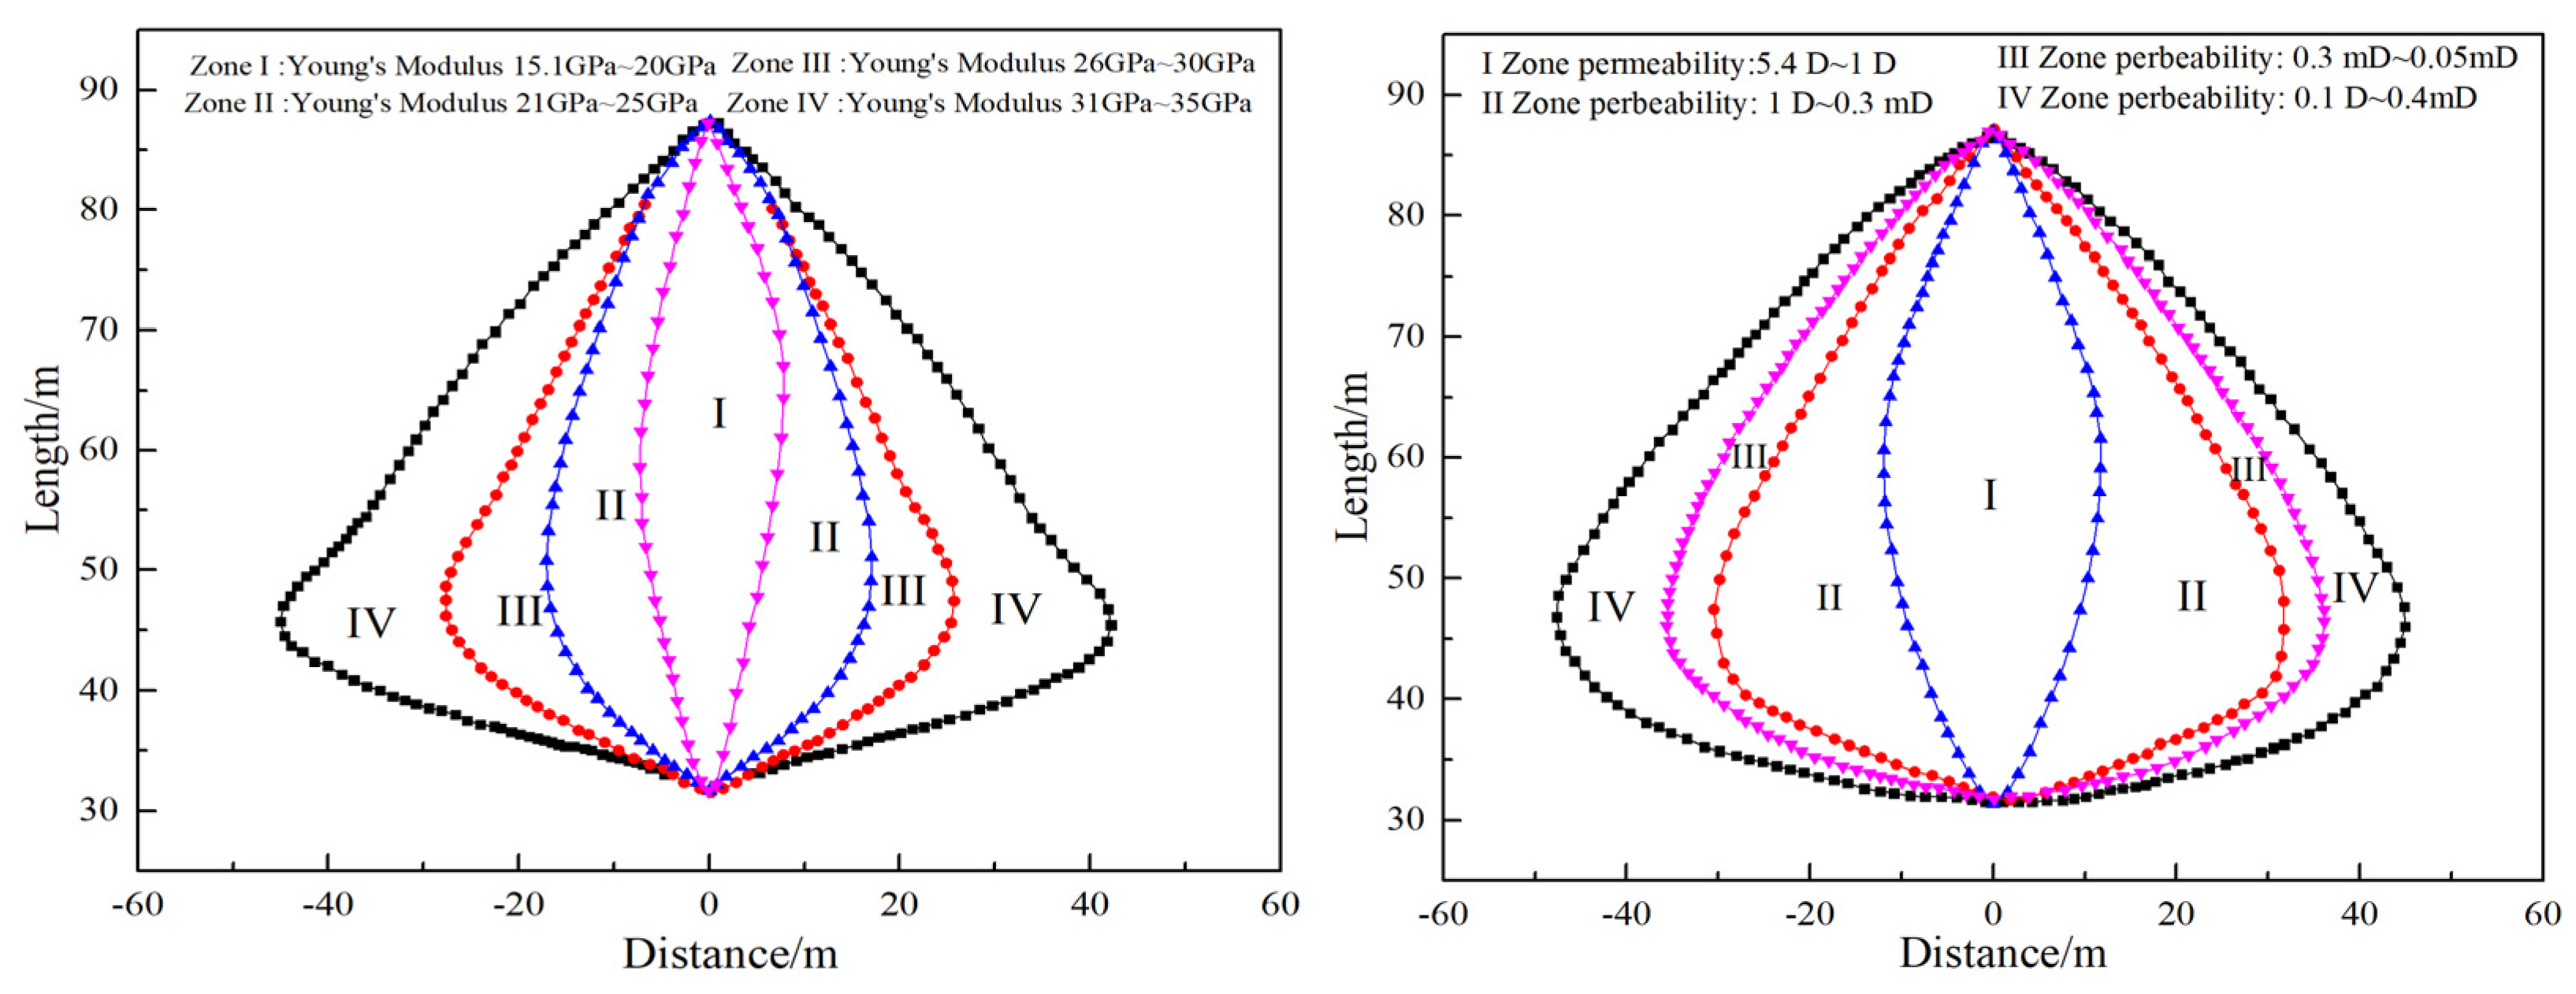
The physical properties of the shale formation after hydraulic fracturing are plotted in Figure 5, Figure 6 and Figure 7 to further characterize the changes in rock properties after hydraulic fracturing. Three fractures were generated post-hydraulic fracturing, and the Young’s modulus of the rock and the permeability distribution of the shale are illustrated in Figure 6. From the simulations, the original rock mechanical properties and permeability are shown in Table 1. It is clear from Figure 6a that the Young’s modulus of shale decreased following hydraulic fracturing. The fractured zone can be divided into four parts according to the degree of the Young’s modulus reduction. Zone I: The Young’s modulus experienced a large decrease, which varied from 15.0 GPa to 20.0 GPa. The formation permeability greatly increased in this area. Zone II: The Young’s modulus grew from 20.0 GPa to 25.0 GPa. In this zone, the degree of stress perturbation was slightly reduced compared with that in zone I, and the changes in Young’s modulus and permeability were smaller than those in zone I. For zones III and IV, the degree of stress perturbation was obviously reduced, and the Young’s modulus in these areas was slightly reduced. From Figure 6b, it can be seen that the permeability in zones I and II obviously increased, while the permeability in zone III slightly decreased. The main reason for this was that the fracture surface suffered compression deformation under high pressure inside the fracture, resulting in damage to rocks in the deep formation. The porosity of the rocks under compression deformation decreased, and the local permeability of the rocks slightly decreased due to the characteristics of porous media in the rock. According to the experimental findings, a shear failure occurred in the rocks in the deep formation under compressive deformation, so the permeability in zone IV slightly increased. When four fractures occurred or fractures were made by hydraulic action, the changes in the Young’s modulus and permeability showed the same trend (Figure 7 and Figure 8). As the number of fractures increased, the area with reduced permeability also increased. The main reason for this physical phenomenon was that as the number of fractures increased, compression deformation caused by the high injection pressure became more serious, and thus, the area with reduced permeability increased. It should also be noted that the area with decreased permeability enlarged as more fractures developed. This accounts for the strain generated in the stimulated area during hydraulic fracturing, and this strain was increased with the increase in fracture degree in the central zone. Thus, as more fractures developed, the area of zone III largely increased.
4. Discussion
The effects of the stress field, cluster space, and fracturing fluid viscosity on the rock properties were simulated to further clarify the changes in the zone with reduced permeability.
4.1. Stress Field
The horizontal principal stress difference was the main factor influencing hydraulic fracture distribution. In the simulations, stress fields with horizontal principal stress differences of 15 MPa, 12 MPa, 9 MPa, and 6 MPa were simulated. The cluster space was 15 m, four fractures were created in this process, and the other parameters were the same as those given in Table 1. It can be seen that the change in Young’s modulus varied from −53.75 m to 55.92 m, and the permeability varied from −43.28 m to 43.64 m, as shown in Figure 9a. When the stress difference between two horizontal principal stresses increased to 9 MPa, the change in Young’s modulus decreased from 109.67 m to 87.5 m, and the permeability decreased from 86.92 m to 64.57 m. The change in Young’s modulus decreased continuously to 79.4 m, and the permeability decreased to 61.3 m when the stress difference reached 15 MPa. Although the horizontal principal stress differential significantly reduced the stimulated region, the highest value of permeability was obviously larger. The main reason for this is that the generated fractures were confined to a smaller area as the horizontal principal stress difference increased. The central area was stimulated more thoroughly, so the Young’s modulus degraded more, and the permeability improved more under the same injection conditions. The strain in the center area also increased due to the restriction of fractures, which increased with the horizontal principal stress difference. Meanwhile, that of the whole stimulated area obviously decreased due to the fact that the created fractures were restricted to a smaller area under a high horizontal principal stress differential, while the strain of the other area was comparatively smaller.
4.2. Cluster Space
The other factor influencing hydraulic fracture distribution is cluster space, according to the existing research. Hydraulic fracture propagation with different cluster spaces was simulated to further investigate the changes in rock properties during hydraulic fracturing. In these simulations, the other parameters were the same as shown in Table 1, and cluster spaces of 8 m, 12 m, 16 m, and 20 m were simulated. From the simulations, the Young’s modulus decreased to below 20 GPa in zone I, and the lowest value was 6.2 GPa, with the highest permeability of 11.6 D, as shown in Figure 10. In addition, the area in which the Young’s modulus changed was larger than the area in which the permeability changed. The main reason for this was that the permeability of a shale formation can be obviously improved only when the current Young’s modulus decreases to the threshold. When the cluster space increased to 12 m, the lowest Young’s modulus was 7.6 GPa in zone I, and the highest permeability was 11.2 D. When the cluster space continuously increased to 20 m, the lowest Young’s modulus increased to 13.8 GPa, while the highest permeability decreased to 8.2 D. Based on the simulations, it can be concluded that decreasing the cluster space can dramatically increase the number of hydraulic fractures formed. The highest permeability of the stimulated area also showed the same tendency. The width of the stimulated area decreased by 49.1%, while the highest permeability increase was 41.5% compared with that when the cluster space was 8 m. Therefore, the changes in Young’s modulus and permeability also decreased, and the peak permeability decreased with an increase in cluster space. In addition, the formation strain also decreased with an increase in cluster space, so the area with reduced permeability decreased.
4.3. Viscosity of Fracturing Fluid
The viscosity of the fracturing fluid was the most important technical factor influencing the fracture geometry during hydraulic fracturing. We simulated different viscosities (1.0 mPa.s, 10.0 mPa.s, 50.0 mPa.s, and 100.0 mPa.s) and characterized the changes in formation properties after hydraulic fracturing to investigate the effect of fracturing fluid viscosity on the formation properties. The Young’s modulus and permeability are shown in Figure 11a–d. The simulation results show that the total stimulated area decreased with increasing fracturing fluid viscosity. Under a viscosity of 1.0 mPa.s, the width of the area with changed permeability was 76.4 m, while it decreased to 71.3 m when the fracturing fluid viscosity increased to 10.0 mPa.s. A large change also took place when the fracturing fluid viscosity climbed to 50.0 mPa.s, and the width of the area with changed permeability was 60.3 m. As the width of the area with changed permeability decreased, the peak permeability largely increased from 9.0 D to 18.1 D when the fracturing fluid viscosity increased from 1.0 mPa.s to 100.0 mPa.s. This indicated that high fracturing fluid viscosity was beneficial for creating high-permeability fractures, while low fracturing fluid viscosity was helpful for creating a complex fracture network. The most important reason why high fracturing fluid viscosity contributed to higher hydraulic fracture permeability was because the net pressure generated by high viscosity was much higher than that caused by low viscosity. In addition, the area with reduced permeability was also larger because the high net pressure was also a source of high stress.
5. Conclusions
Stress disturbance is an important factor affecting the stimulated volume during hydraulic fracturing, and knowledge of the stress disturbance mechanism is critical for the optimization of hydraulic fracture parameters. In this paper, a numerical model was developed to describe the alterations in Young’s modulus and the permeability distribution following hydraulic fracturing. The findings are summarized as follows.
(1) Increasing the minimum principal stress in the horizontal direction was found to be the main factor influencing the fracture propagation behavior in multi-stage hydraulic fracturing. During fracture propagation, the minimum principal stress in the horizontal direction increased from 10 MPa to 15 MPa, and the maximum value of minimum principal stress in the horizontal direction was located at the fracture tip, which largely restricted fracture propagation.
(2) The whole stimulated area can be divided into four parts. In the parts which were severely affected by stress disturbance, the Young’s modulus severely decreased, and the permeability of the formation greatly increased. A zone with reduced permeability formed in the stimulated area due to the stress caused by the high injection pressure.
(3) The main reason for the permeability decrease in the stimulated zone during hydraulic fracturing was formation compression. For rocks, the porosity and local permeability decreased under compression deformation. The compression effect on reservoir rocks increased with the heterogeneity of the reservoir stress and fracturing fluid viscosity, whereas it was negative in the cluster space.
Author Contributions
Conceptualization, Y.Z. and H.Z.; methodology, Y.Z. and H.Z.; formal analysis, Y.Z., H.Z., Y.L. and R.L.; investigation, Y.Z., H.Z., Y.L. and R.L.; resources, H.Z.; data curation, Y.Z., H.Z., Y.L. and R.L.; writing—original draft preparation, Y.Z. and H.Z.; writing—review and editing, Y.Z. and H.Z.; supervision, H.Z.; project administration, H.Z., Y.L. and R.L.; funding acquisition, R.L. All authors have read and agreed to the published version of the manuscript.
Funding
This work was supported by National Natural Science Foundation of China [Grant Number: [62173049].
Data Availability Statement
The authors confirm that the data supporting the findings of this study are available within the article.
Conflicts of Interest
The authors declare no conflict of interest.
References
- Taheri-Shakib, J.; Ghaderi, A.; Hosseini, S.; Hashemi, A. Debonding and coalescence in the interaction between hydraulic and natural fracture: Accounting for the effect of leak-off. J. Nat. Gas Sci. Eng. 2016, 36, 454–462. [Google Scholar] [CrossRef]
- Shi, S.; Zhuo, R.; Cheng, L.; Xiang, Y.; Ma, X.; Wang, T. Fracture Characteristics and Distribution in Slant Core from Conglomerate Hydraulic Fracturing Test Site (CHFTS) in Junggar Basin, Northwest China. Processes 2022, 10, 1646. [Google Scholar] [CrossRef]
- Wei, C.; Zhang, B.; Li, S.; Fan, Z.; Li, C. Interaction between Hydraulic Fracture and Pre-Existing Fracture under Pulse Hydraulic Fracturing. SPE Prod. Oper. 2021, 36, 553–571. [Google Scholar] [CrossRef]
- Liu, B.H.; Jin, Y.; Chen, M. Influence of vugs in fractured-vuggy carbonate reservoirs on hydraulic fracture propagation based on laboratory experiments. J. Struct. Geol. 2019, 124, 143–150. [Google Scholar] [CrossRef]
- Shakib, J.T.; Akhgarian, E.; Ghaderi, A. The effect of hydraulic fracture characteristics on production rate in thermal EOR methods. Fuel 2015, 141, 226–235. [Google Scholar] [CrossRef]
- Liu, X.; Qu, Z.; Guo, T.; Sun, Y.; Wang, Z.; Bakhshi, E. Numerical simulation of non-planar fracture propagation in multi-cluster fracturing with natural fractures based on Lattice methods. Eng. Fract. Mech. 2019, 220, 106625. [Google Scholar] [CrossRef]
- Guo, J.; Lu, Q.; Zhu, H.; Wang, Y.; Ma, L. Perforating cluster space optimization method of horizontal well multi-stage fracturing in extremely thick unconventional gas reservoir. J. Nat. Gas Sci. Eng. 2015, 26, 1648–1662. [Google Scholar] [CrossRef]
- Yin, P.F.; Yang, S.Q.; Gao, F.; Tian, W.L.; Zeng, W. Numerical investigation on hydraulic fracture propagation and multi-perforation fracturing for horizontal well in Longmaxi shale reservoir. Theor. Appl. Fract. Mech. 2023, 125, 103921. [Google Scholar] [CrossRef]
- Tang, J.; Wu, K.; Li, Y.; Hu, X.; Liu, Q.; Ehlig-Economides, C. Numerical investigation of the interactions between hydraulic fracture and bedding planes with non-orthogonal approach angle. Eng. Fract. Mech. 2018, 200, 1–16. [Google Scholar] [CrossRef]
- Wang, S.; Li, H.; Li, D. Numerical Simulation of Hydraulic Fracture Propagation in Coal Seams with Discontinuous Natural Fracture Networks. Processes 2018, 6, 113. [Google Scholar] [CrossRef]
- Tan, P.; Chen, G.; Wang, Q.; Zhao, Q.; Chen, Z.; Xiang, D.; Xu, C.; Feng, X.; Zhai, W.; Yang, Z.; et al. Simulation of hydraulic fracture initiation and propagation for glutenite formations based on discrete element method. Front. Earth Sci. 2023, 10, 1116492. [Google Scholar] [CrossRef]
- Zheng, H.; Pu, C.S.; Sun, C. Study on the interaction between hydraulic fracture and natural fracture based on extended finite element method. Eng. Fract. Mech. 2020, 230, 106981. [Google Scholar] [CrossRef]
- Cao, M.; Hirose, S.; Sharma, M.M. Factors controlling the formation of complex fracture networks in naturally fractured geothermal reservoirs. J. Pet. Sci. Eng. 2022, 208, 109642. [Google Scholar] [CrossRef]
- Liu, Y.; Zheng, X.; Peng, X.; Zhang, Y.; Chen, H.; He, J. Influence of natural fractures on propagation of hydraulic fractures in tight reservoirs during hydraulic fracturing. Mar. Pet. Geol. 2022, 138, 105505. [Google Scholar] [CrossRef]
- Wang, S.; Li, Z.; Yuan, R.; Li, G.; Li, D. A shear hardening model for cohesive element method and its application in modeling shear hydraulic fractures in fractured reservoirs. J. Nat. Gas Sci. Eng. 2020, 83, 103580. [Google Scholar] [CrossRef]
- Jiang, M.; Wei, Y.; Li, T.; Dong, K. Influence of Horizontal Multi-Bedding on Hydraulic Fracture Propagation in Shale Reservoirs. Processes 2023, 11, 2846. [Google Scholar] [CrossRef]
- Chang, X.; Qiu, G.; Li, J.; Guo, Y. Research on the impact of pre-existing geological fractures on hydraulic fracturing in high in situ stress environments. Energy Sci. Eng. 2024, 12, 934–948. [Google Scholar] [CrossRef]
- Zhai, M.; Wang, D.; Li, L.; Zhang, Z.; Zhang, L.; Huang, B.; Li, A.; Zhang, Q. Investigation on the mechanism of hydraulic fracture propagation and fracture geometry control in tight heterogeneous glutenites. Energy Explor. Exploit. 2022, 40, 246–278. [Google Scholar] [CrossRef]
- Zhao, X.L.; Huang, B.X.; Grasselli, G. Numerical Investigation of the Fracturing Effect Induced by Disturbing Stress of Hydrofracturing. Front. Earth Sci. 2021, 9, 751626. [Google Scholar] [CrossRef]
- Zhu, D.; Zhang, L.; Song, X.; Lian, H.; Niu, D. Propagation mechanism of the hydraulic fracture in layered-fractured-plastic formations. Int. J. Fract. 2023, 241, 189–210. [Google Scholar] [CrossRef]
- Zheng, Y.; He, R.; Huang, L.; Bai, Y.; Wang, C.; Chen, W.; Wang, W. Exploring the effect of engineering parameters on the penetration of hydraulic fractures through bedding planes in different propagation regimes. Comput. Geotech. 2022, 146, 104736. [Google Scholar] [CrossRef]
- Tang, Y.; Zheng, H.; Xiang, H.; Nie, X.; Liao, R. Experimental Simulation on the Stress Disturbance Mechanism Caused by Hydraulic Fracturing on the Mechanical Properties of Shale Formation. Processes 2023, 11, 2931. [Google Scholar] [CrossRef]
Figure 1.
Domain with single joint plane, with a jump in the velocity field.

Figure 2.
Comparison between experimental and simulation results.

Figure 3.
(a) Sketch of hydraulic fracturing. (b) Calculation of the proposed hydraulic fracturing model. Proposed hydraulic fracturing model description and calculation procedure.
Figure 3.
(a) Sketch of hydraulic fracturing. (b) Calculation of the proposed hydraulic fracturing model. Proposed hydraulic fracturing model description and calculation procedure.

Figure 4.
Hydraulic fracture distribution under different clusters. (a) three clusters; (b) Four clusters; (c) five clusters.
Figure 4.
Hydraulic fracture distribution under different clusters. (a) three clusters; (b) Four clusters; (c) five clusters.

Figure 5.
(a) The minimum horizontal stress distribution along three hydraulic fractures. (b) The minimum horizontal stress distribution along four hydraulic fractures. (c) The minimum horizontal stress distribution along five hydraulic fractures.
Figure 5.
(a) The minimum horizontal stress distribution along three hydraulic fractures. (b) The minimum horizontal stress distribution along four hydraulic fractures. (c) The minimum horizontal stress distribution along five hydraulic fractures.

Figure 6.
Young’s modulus (a) and permeability distribution (b) of three fractures.

Figure 7.
Young’s modulus (a) and permeability distribution (b) of four fractures.

Figure 8.
Young’s modulus (a) and permeability distribution (b) of five fractures.

Figure 9.
(a) Young’s modulus and permeability distribution under the horizontal principal stress difference of 6 MPa. (b) Young’s modulus and permeability distribution under the horizontal principal stress difference of 9 MPa. (c) Young’s modulus and permeability distribution under the horizontal principal stress difference of 12 MPa. (d) Young’s modulus and permeability distribution under the horizontal principal stress difference of 15 MPa.

Figure 10.
(a) Young’s modulus and permeability distribution under the cluster space of 8 m. (b) Young’s modulus and permeability distribution under the cluster space of 12 m. (c) Young’s modulus and permeability distribution under the cluster space of 16 m. (d) Young’s modulus and permeability distribution under the cluster space of 20 m.


Figure 11.
(a) Young’s modulus and permeability distribution when viscosity of fracturing fluid was 1.0 mPa.s. (b) Young’s modulus and permeability distribution when fracturing fluid viscosity was 10.0 mPa.s. (c) Young’s modulus and permeability distribution when fracturing fluid viscosity was 50.0 mPa.s. (d) Young’s modulus and permeability distribution when fracturing fluid viscosity was 100.0 mPa.s.


Table 1.
Parameters of the hydraulic fracturing simulation.
| Item | Parameters | Unit | Value |
|---|---|---|---|
| Rock mechanical properties | Young’s modulus | GPa | 35.6 |
| Poisson’s rate | Dimensionless | 0.34 | |
| Tensile strength | MPa | 8.42 | |
| Shear strength | MPa | 8.61 | |
| Permeability | mD | 0.35 | |
| Injection parameters | Injection rate | m3/min | 4.0 |
| Viscosity of fracturing fluid | mPa.s | 20.0 | |
| Stress field | Vertical stress | MPa | 87.5 |
| Maximum horizontal principal stress | MPa | 78.6 | |
| Minimum horizontal principal stress | MPa | 68.6 | |
| Pore pressure | MPa | 23.8 |
Disclaimer/Publisher’s Note: The statements, opinions and data contained in all publications are solely those of the individual author(s) and contributor(s) and not of MDPI and/or the editor(s). MDPI and/or the editor(s) disclaim responsibility for any injury to people or property resulting from any ideas, methods, instructions or products referred to in the content. |
© 2024 by the authors. Licensee MDPI, Basel, Switzerland. This article is an open access article distributed under the terms and conditions of the Creative Commons Attribution (CC BY) license (https://creativecommons.org/licenses/by/4.0/).
Share and Cite
MDPI and ACS Style
Zhu, Y.; Zheng, H.; Liao, Y.; Liao, R. Numerical Simulation of Stress Disturbance Mechanism Caused by Hydraulic Fracturing of Shale Formation. Processes 2024, 12, 886. https://0-doi-org.brum.beds.ac.uk/10.3390/pr12050886
AMA Style
Zhu Y, Zheng H, Liao Y, Liao R. Numerical Simulation of Stress Disturbance Mechanism Caused by Hydraulic Fracturing of Shale Formation. Processes. 2024; 12(5):886. https://0-doi-org.brum.beds.ac.uk/10.3390/pr12050886
Chicago/Turabian StyleZhu, Yinghui, Heng Zheng, Yi Liao, and Ruiquan Liao. 2024. "Numerical Simulation of Stress Disturbance Mechanism Caused by Hydraulic Fracturing of Shale Formation" Processes 12, no. 5: 886. https://0-doi-org.brum.beds.ac.uk/10.3390/pr12050886
Note that from the first issue of 2016, this journal uses article numbers instead of page numbers. See further details here.