Article

Integrating Spatial and Non-Spatial Dimensions to Evaluate Access to Rural Primary Healthcare Service: A Case Study of Songzi, China

1
College of Urban & Environmental Sciences, Central China Normal University, Wuhan 430079, China
2
Key Laboratory for Geographical Process Analysis & Simulation of Hubei Province, Central China Normal University, Wuhan 430079, China
3
College of Public Administration, Huazhong Agricultural University, Wuhan 430070, China
4
Urban Big Data Centre, School of Social and Political Sciences, University of Glasgow, Glasgow G12 8RZ, UK
*
Author to whom correspondence should be addressed.
ISPRS Int. J. Geo-Inf. 2024, 13(5), 142; https://0-doi-org.brum.beds.ac.uk/10.3390/ijgi13050142
Submission received: 16 March 2024 / Revised: 20 April 2024 / Accepted: 26 April 2024 / Published: 27 April 2024

Abstract

:
Access to rural primary healthcare services has been broadly studied in the past few decades. However, most earlier studies that focused on examining access to rural healthcare services have conventionally treated spatial and non-spatial access as separate factors. This research aims to measure access to primary healthcare services in rural areas with the consideration of both spatial and non-spatial dimensions. The methodology of study is threefold. First, the Gaussian two-step floating catchment area (G-2SFCA) method was adopted to measure spatial access to primary healthcare services. Then, a questionnaire survey was conducted to investigate non-spatial access factors, including demographic condition, patient’s household income, healthcare insurance, education level, and patient satisfaction level with the services. After that, a comprehensive evaluation index system was employed to integrate both spatial and non-spatial access. The empirical study showed a remarkable disparity in spatial access to primary healthcare services. In total, 78 villages with 185,137 local people had a “low” or “very low” level of spatial access to both clinics and hospitals. For the non-spatial dimension, the results depicted that Songzi had significant inequalities in socioeconomic status (e.g., income, education) and patient satisfaction level for medical service. When integrating both spatial and non-spatial factors, the disadvantaged areas were mainly located in the eastern and middle parts. In addition, this study found that comprehensively considering the spatial and non-spatial access had a significant impact on results in healthcare access. In conclusion, this study calls for policymakers to pay more attention to primary healthcare inequalities within rural areas. The spatial and non-spatial access should be considered comprehensively when the long-term rural medical support policy is designated.

1. Background

Primary healthcare services provide the initial point of contact for individuals seeking healthcare and are focused on preventing illness, promoting health, and offering professional care for common health problems. These services are typically provided by various facilities, such as clinics, and general hospitals. Accessible primary healthcare services are essential to high-quality services and better health outcomes [1]. Numerous studies have consistently shown that rural primary healthcare services are comparatively less accessible when compared to those in other areas [2,3]. Therefore, enhancing comprehension of access to primary healthcare services in rural areas can aid healthcare planners and decision makers in improving health resource deployment and service efficiency in rural areas.
As a multi-dimensional concept, access to healthcare services has been extensively explored by scholars across various disciplines, such as geography, public policy, and sociology [4,5,6]. From a spatial perspective, access to healthcare can be differentiated between spatial and non-spatial access, where the former mainly concentrates on spatial/geographic costs (e.g., distance or travel time) between healthcare providers and patients [7]. The latter emphasizes non-geographical characteristics such as demographic factors, socioeconomic status, patients’ satisfaction level or healthcare insurance that can influence the ease of acquiring healthcare services [8]. Based on the utilization perspective, access can be classified as potential and revealed access, where the former represents the opportunity to reach the service provider but does not guarantee that patients can use the service immediately. The latter emphasizes when patients can actually use such services [9].
Various studies have confirmed that spatial and non-spatial access are both critical to evaluating the quality of healthcare services. On the one hand, spatial access affects health outcomes by influencing the ability of individuals to quickly reach appropriate healthcare facilities and utilize medical resources. Thus, it plays a critical role in determining whether people can reach healthcare services when they need it, ultimately impacting their health status and well-being. For example, Wang [10] indicated that better spatial access to primary healthcare remarkably decreased the potential risk of late diagnosis for breast cancer patients living outside Chicago, IL, USA, and they suggested that good spatial distribution of primary care resources is essential to prevent breast cancer.
Non-spatial access also plays a vital role in affecting whether patients can effectively access the healthcare services they need, often influenced by differences in demographic and socioeconomic characteristics [11,12,13]. Wan et al. [14] found that demographic factors such as disadvantaged population groups rather than spatial access had an increased risk of colorectal cancer mortality. Similarly, socioeconomic disadvantages (e.g., poverty, poor education and low insurance levels) influence an individual’s ability to afford and effectively navigate the healthcare system. Wang and Luo [8] grouped those demographic and socioeconomic factors that affected healthcare access into three categories, including socioeconomic disadvantages, high healthcare needs and sociocultural barriers. In addition to objective factors linked to demographic and socioeconomic dimensions, patients’ subjective perceptions, such as their satisfaction with the services, constitute a crucial factor in evaluating healthcare access [15,16].
During the last few decades, various methods have been developed to evaluate access to health services. Three types of methods are frequently implemented, including proximity-based measures, provider-to-population ratios (PPRs) and gravity-based models. The proximity-based measures focus on the distance or travel time between a patient’s location and their facility, which has been widely used in the healthcare field [17]. PPRs are always estimated by aggregated data within geographic/spatial scales such as catchment areas of healthcare services or administrative boundaries. Gravity-based models integrate the above measures with the consideration of potential interactions between healthcare demands and providers, which often incorporates with a distance decay function. The most popular gravity-based models are the two-step floating catchment area (2SFCA) [9] and its improved version named the Gaussian-based 2SFCA (G-2SFCA) [18]. Among those methods, the 2SFCA and G-2SFCA are comparatively more widely used in the healthcare field because the availability of medical resources and geographical costs are the two essential issues that healthcare planners face [19].
Geography should not be limited to spatial thinking alone, but should pay more attention to the trend of combining geography with social and political processes [20], reflecting on the association with social phenomena, going beyond simple descriptions and explanations of the spatial nature of social phenomena, and incorporating them into normative evaluation dimensions [21]. One limitation is that spatial and non-spatial access are always considered separately among the relevant studies [6,22,23], though many studies have indicated that both aspects can influence an individual’s ability to afford and effectively navigate the healthcare system [16]. Few efforts have tried to consider both dimensions of healthcare access, and non-spatial factors are frequently intertwined with secondary data on local demographic factors such as age, race, and gender [8,14], as well as local socioeconomic characteristics [11,13]. However, first-hand data about patients’ household incomes, insurance, education levels and satisfaction levels with medical services are always ignored by current studies, which makes it difficult to yield valuable insights into the healthcare seeking process and help to uncover subtle disparities within healthcare systems [15]. Thus, one contribution of this study is to measure primary healthcare access involving both spatial and non-spatial dimensions, with the consideration of first-hand data about rural patients, to gain a more profound understanding of access to the primary healthcare system.
Another limitation is that inequalities in primary healthcare access inside of rural areas are rarely studied, even if such problems are widespread globally. Existing scholars often investigate such inequalities from national [24,25], regional [26], municipal [27,28] or individual [23] levels, identifying areas with insufficient healthcare services and proposing policy implications for future healthcare planning. After continuous efforts by governments and decision makers, some studies have found varying degrees of alleviation in healthcare access disparities, especially between urban and rural areas [29]. However, inequalities in healthcare access inside of rural areas have received little attention. This may lead to increasing healthcare inequalities inside rural areas, even though urban–rural fairness has improved. Although Agbenyo et al. [30] focused on spatial access to healthcare in rural areas, non-spatial factors were ignored. Therefore, another contribution of this study is to fill this gap by investigating the extent of inequalities in access to primary healthcare services within rural areas, providing decision making support for policymakers to reach the goal of healthcare equalization.
This study investigates potential access to rural primary healthcare services by integrating spatial and non-spatial factors. The case study area, Songzi, is a rural area of Jingzhou City, Hubei, China. In detail, the aim of this research is threefold: (1) measure spatial access to the healthcare system based on the G-2SFCA method; (2) use a questionnaire survey to obtain data related to non-spatial access, including demographic, socio-economic characters, and patients’ level of satisfaction with medical services; (3) evaluate access to rural primary healthcare services by integrating both spatial and non-spatial factors. Songzi’s economic and social development is at the middle position of rural China, exhibiting a more universal character comparable to those of well-developed rural areas. Understanding the healthcare challenges faced by Songzi can contribute to helping address similar rural issues encountered in China and other developing countries worldwide.
This paper is structured as shown in Figure 1. The next section introduces methods of measuring access to healthcare services, mainly including the G-2SFCA and the entropy weight method. The empirical results related to spatial and integrated access are presented and described in Section 3. Section 4 discusses the significant findings of this study and the policy implications, concluding with the existing limitations of this research and further study.

2. Materials and Methods

2.1. Study Area and Data

The study area, Songzi, is located in the southwest of Hubei Province, China (110°14′–112°03′ E to 29°53′–30°22′ N). Songzi is the rural area of Jingzhou city, and the transition area from Jianghan plain to Western Hubei Mountain, covering an area of 2177 km2 with a population of 0.64 million at the start of 2022 [31]. Songzi has an important geographical location, located at the intersection of Jiaoliu Railway and Yangtze River, with convenient transportation. The terrain of Songzi is dominated by hills and plains, accounting for 59.5% and 37.7% of the total area, respectively. The economy of Songzi is diverse and primarily based on agriculture, while the fertile lands along the Yangtze River support the cultivation of rice, tea, and various other crops. Additionally, the industrial and tourism sectors have grown significantly in recent years, contributing to local economic development.
Songzi has a total of 16 districts with 278 villages, and the local government is in Xinjiangkou district, which is the most economically developed local town. The village constitutes the most diminutive rural administrative entity within China, encompassing a specific geographical region characterized by intimate social interactions. Furthermore, it also represents the most granular spatial level at which census population data are accessible. The average number of people in each district is 2523.3. Among all districts, the most populous district is Xinjiangkou, with a population of 127.4 thousand, but Xiejiaping has the smallest population, only 15.0 thousand. Hospitals that provide primary healthcare services can be classified into three hierarchical categories, including Grade I, II and III. Grade I hospitals are also called community healthcare centers or clinics. General hospitals are grouped into Grade II or III. In general, Grade III hospitals have comparatively the highest medical capacities. The service threshold is 15 min travel time for Grade I hospitals but 30 min for Grade II and III hospitals. Patients in rural China can choose to enter any level of hospital to seek primary care according to their needs and actual conditions. In 2022, Songzi City has a total of 382 medical institutions. Per thousand people, there are 5.54 hospital beds and 2.27 doctors. The socio-economic overview of various districts in Songzi can be found in Table 1.
The data employed in this research can be classified as spatial and non-spatial data. For the spatial dimension, the population distribution and demographic structure data were derived from Worldpop (https://www.worldpop.org/, accessed on 20 August 2023), which is structured by classes with a 5 year age range and different genders (male/female), represented by 100 m × 100 m lattices. The total population of each village is calculated by summing the number of people located in the lattices of the area. As shown in Figure 2, which shows the spatial distribution of the population in the study area, the densely populated areas were mainly distributed in the northern area, the southwest area and the seat of government. The location information of healthcare facilities was collected from Baidu Map (https://map.baidu.com/, accessed on 1 August 2023), which included 183 Grade I hospitals, 13 Grade II and 1 Grade III hospitals. Spatial data related to Songzi administrative boundaries were obtained from the Geographical Information Monitoring Cloud Platform (http://www.dsac.cn/. accessed on 15 July 2023), which serves as the predominant source for spatial, geographical, natural resource, and socioeconomic databases in China. For non-spatial data, we conducted a questionnaire survey in all levels of hospitals across 16 districts in Songzi, involving 1760 primary care patients, to gain a deeper understanding of individuals’ demographic and socio-economic condition as well as their subjective perceptions of healthcare services. All information related to patient privacy has been desensitized.

2.2. Research Methods

2.2.1. Measure Spatial Access

This study utilizes the gravity-based G-2SFCA model to assess spatial access, as it incorporates both accessibility and the availability of medical resources. This method has gained widespread acceptance for measuring primary care access, including clinics (Grade I hospitals) and general hospitals (Grade II or III hospitals). The G-2SFCA improves the previous 2SFCA by adding a Gaussian function to present the distance decay effect of seeking healthcare services [18], which is also a population-based measure method. The G-2SFCA consists of two successive steps, and the detail can be expressed as follows:
G ( d k j ,   d 0 ) e ( 1 2 )   ×   d k j d 0 2     e ( 1 2 ) 1     e 1 2               i f   d i j d 0 0                                                           i f   d i j > d 0
where G ( d k j ,   d 0 ) is the Gaussian function. d k j is the travel distance/time from the patient’s location i to the hospital j , and d o is the certain threshold travel distance/time that is pre-defined.
Step 1: evaluate supply-to-demand ratio within a certain distance/travel time (e.g., 10 km or 15 min) of each primary healthcare provider.
R j = S j k { d k j d o } G ( d k j ,   d 0 )   D k  
where R j is the supply-to-demand ratio at the hospital location j . S j is the supply capacity (i.e., number of inpatient beds) at the hospital j , and   D k is the volume of potential demand.
Step 2: sum up all the supply-to-demand ratios of all healthcare providers within the pre-defined distance/travel time of each potential demand location.
A i = j { t k j t 0   } G ( d k j ,   d 0 ) R j
where A i is the access score at the demand location i , and a higher value represents better spatial access.
With respect to the values of the parameters, the threshold travel time ( d 0 ) is 15 min for Grade I hospitals (i.e., clinics) and 30 min for Grade II and III hospitals (i.e., general hospitals), which meet the healthcare service requirements for different levels of hospitals [32]. S j is defined by the number of inpatient beds in hospital, which can be found in each hospital’s official website. D k is defined as the total number of residents in the village k .

2.2.2. Investigate Non-Spatial Access

Five dimensions of non-spatial factors are involved in this study, including demographic variables, income, education, healthcare insurance and satisfaction levels of healthcare service. Demographic variables (i.e., sex and age) influence the need for primary healthcare. In general, three population groups are often considered as having a high need for primary healthcare services, including children aged 0–4, females aged 15–44 and seniors with aged over 65 [8]. The spatial distributions of those groups can be obtained from the Worldpop dataset. Cooperating with the demographic data obtained from Worldpop, the ArcGIS 10.7 was employed to calculate the high healthcare needs ratio (HHNR) in each village, calculated by the following equation.
H H N R = C h i l d r e n 0 4   a g e s   +   f e m a l e 15 44   a g e s + s e n i o r s ( 65   +   a g e s ) t o t a l   p o p u l a t i o n
In order to investigate non-spatial factors related to patients themselves, this study conducted a two-month questionnaire survey in 16 districts in Songzi (from August to October 2019), assessing income levels, education levels of primary healthcare patients and health insurance, as well as their satisfaction degree with local medical services. The major questions about those dimensions are shown in Table 2. During the survey period, we selected hospitals at all levels in each district and surveyed 110 patients from each. In total, 1760 questionnaires were collected, with 1609 questionnaires considered valid, resulting in an effective response rate of 91.4%.

2.2.3. Integrating Spatial and Non-Spatial Access

The entropy weight method is a commonly used method in decision analysis, mainly used for multi-attribute decision making problems to determine the weights of each attribute [33]. The basic principle of the entropy weight method is based on the concept of information entropy. Information entropy is an indicator that measures the degree of information concentration, representing the maximum amount of information in a random variable when the sum of probabilities of each value appearing is 1. The entropy weight method determines the weight of each indicator by calculating the information entropy of each indicator, reducing the influence of subjective factors.
In this study, an indicator system of the comprehensive access score (CASi) is constructed to integrate various indicators of spatial and non-spatial factors, the entropy weight method was employed to determine the weights of various indicators for the spatial access score ( A i ) and above non-spatial factors.
Due to the different data units of the indicators, the indicators need to be dimensionless and processed by the standardized formula. The standardized formula of positive indicators is as shown in Equation (5):
Y i j = X i j min ( X i j ) max ( X i j ) min ( X i j )
The standardization formula of negative indicators is as follows:
Y i j = max ( X i j ) X i j max ( X i j ) min ( X i j )
Then, the method of information entropy is applied in this paper to calculate the weight of each spatial and non-spatial factor in comprehensive access evaluation. The information entropy formula of each group of data is as follows:
E j = ln ( N ) 1 i = 1 N p i j lnp ij  
Among them:
p i j = Y i j i = 1 N Y i j
According to the calculated information entropy, we calculated the weight W j of each group of data:
W j = 1 E j K E j ( j K )
where N is the total number of demand areas, and K is the total number of indicators. Xij represents the actual value of the j-th indicator at the i-th demand location, and Yij is the standardized value of Xij. The information entropy of j-th group of data is represented as Ej. Among them, Pij is the proportion of Yij to all values in the j-th indicator, which is equivalent to defining a certain probability that will have a significant impact on entropy Ej. Max (Xij) is the maximum value of Xij and min (Xij) is the minimum value of it. By substituting the index data into the above formula, the weight of the j-th indicator ( W j ) can be calculated.
After the weights of all indicators have been evaluated, the comprehensive access score at the i-th location ( C A S i ) is calculated by Equation (10).
C A S i = j = 1 K W j X i j

3. Results

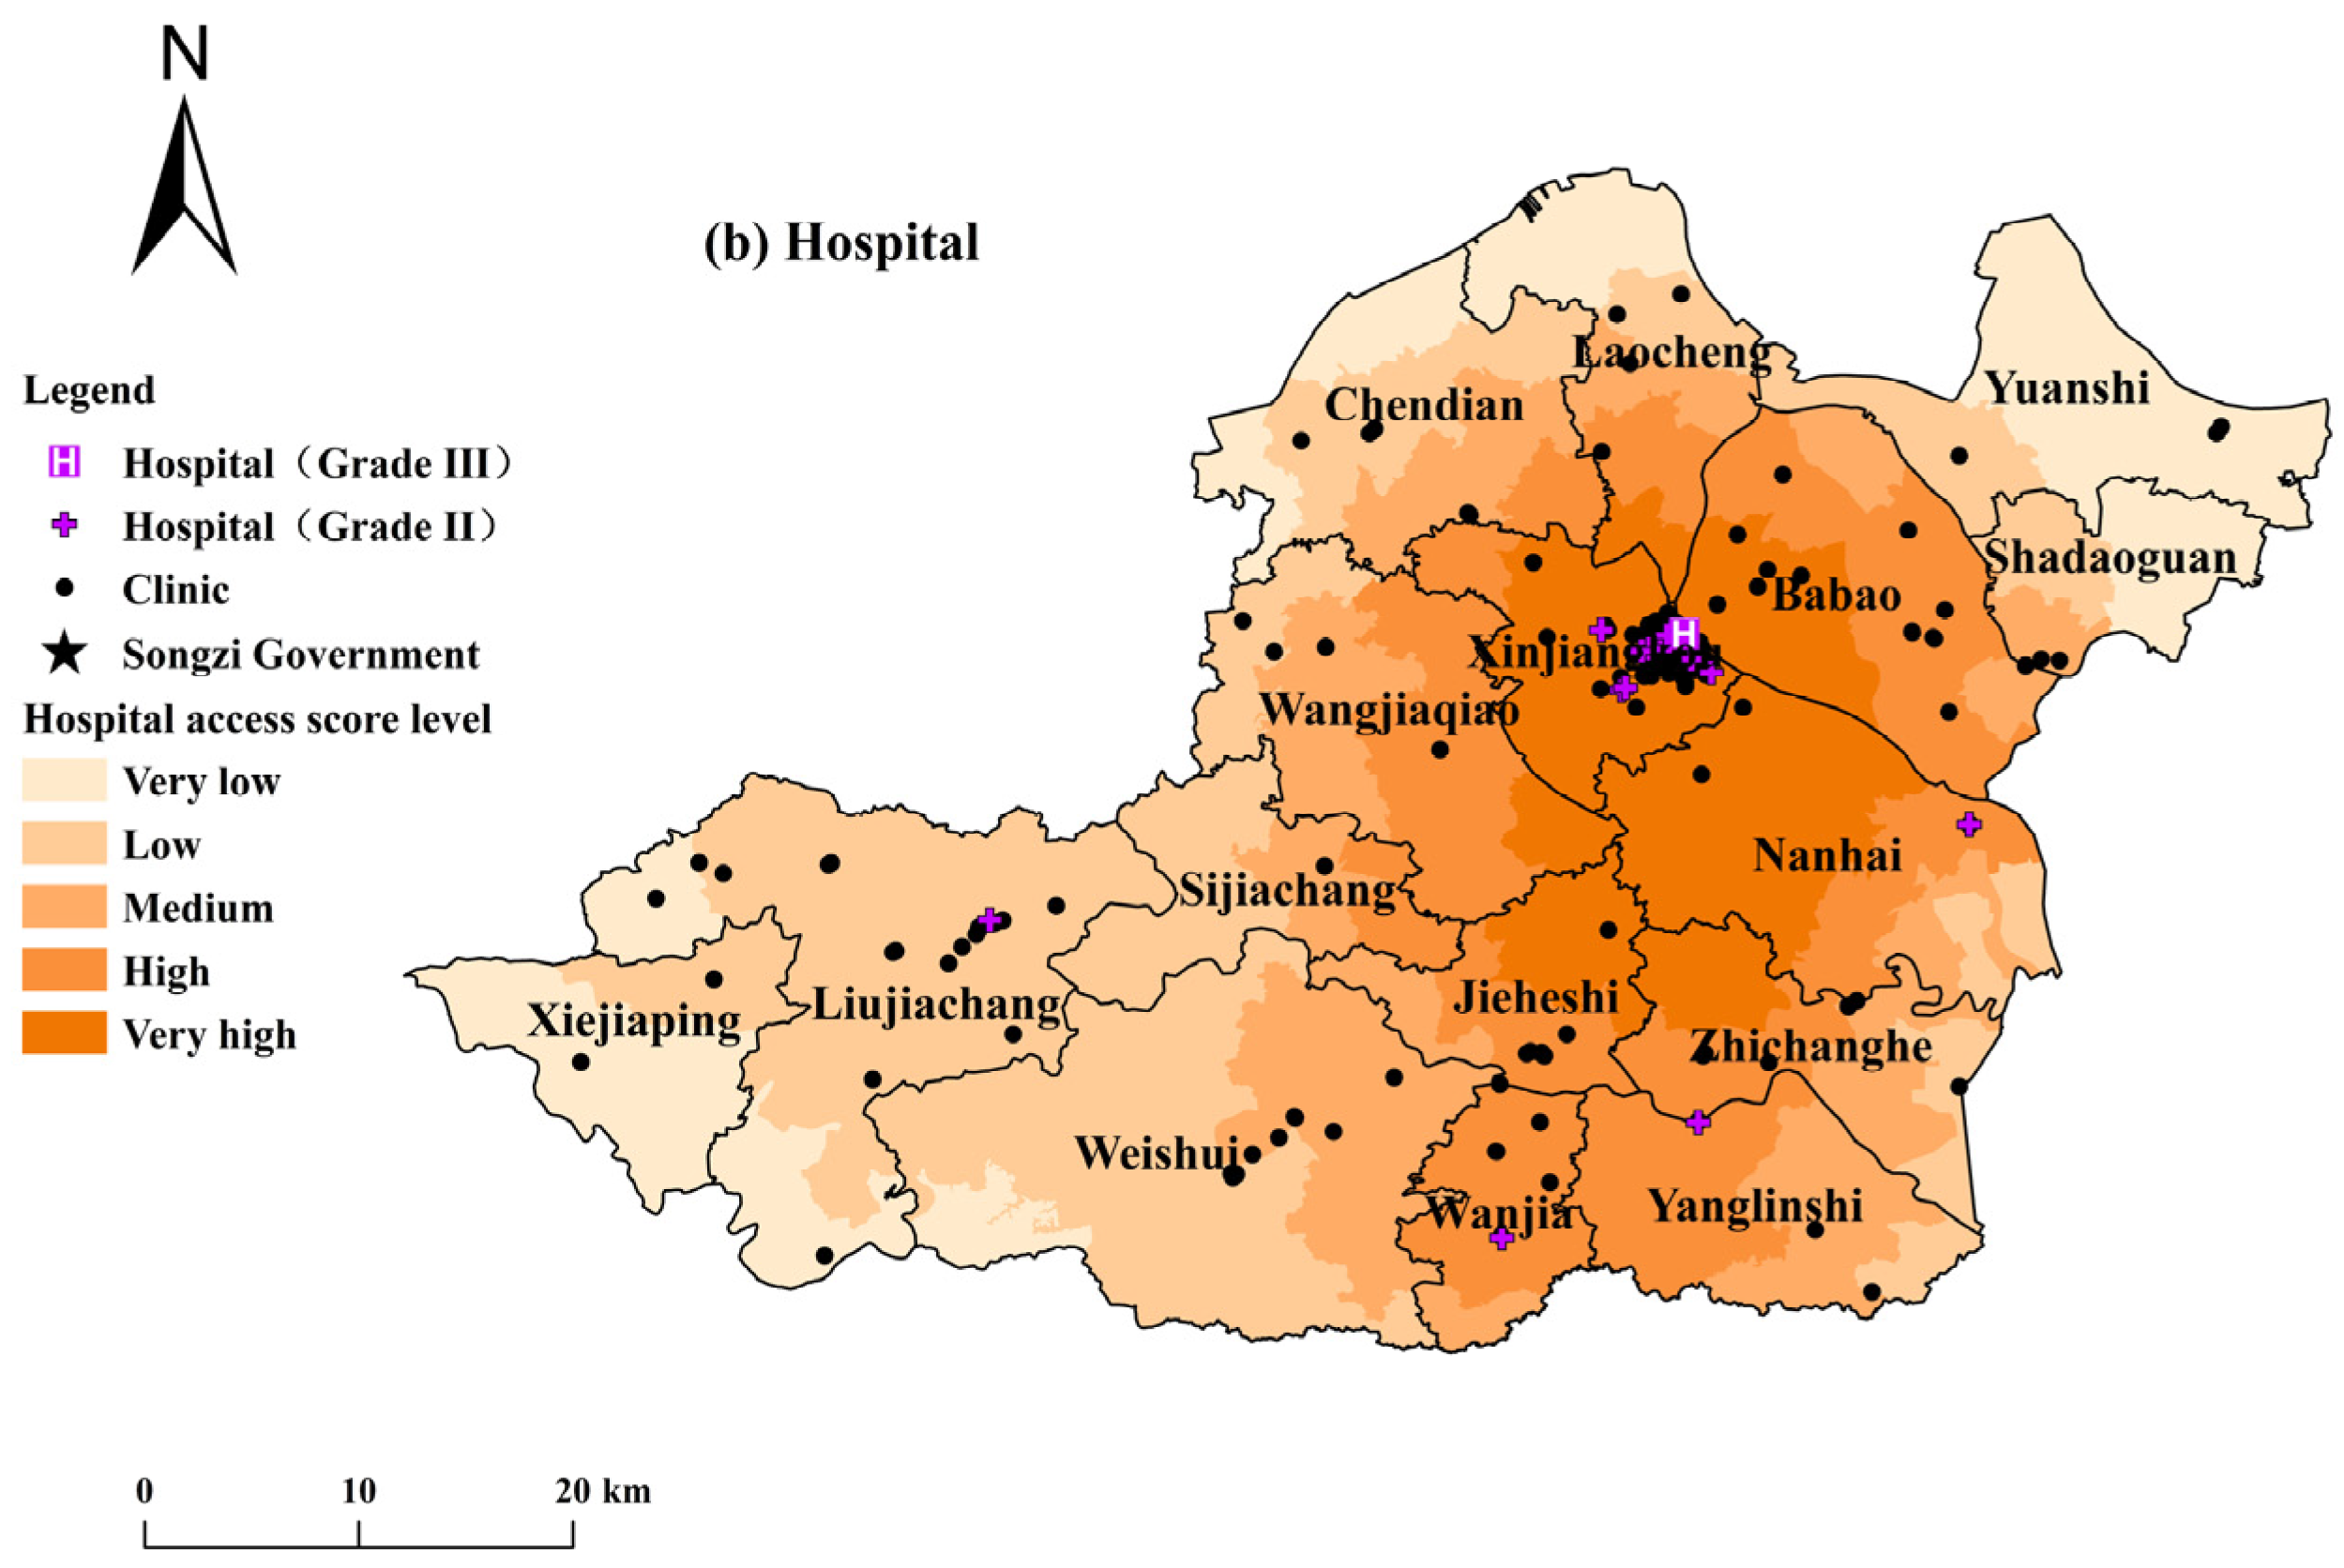
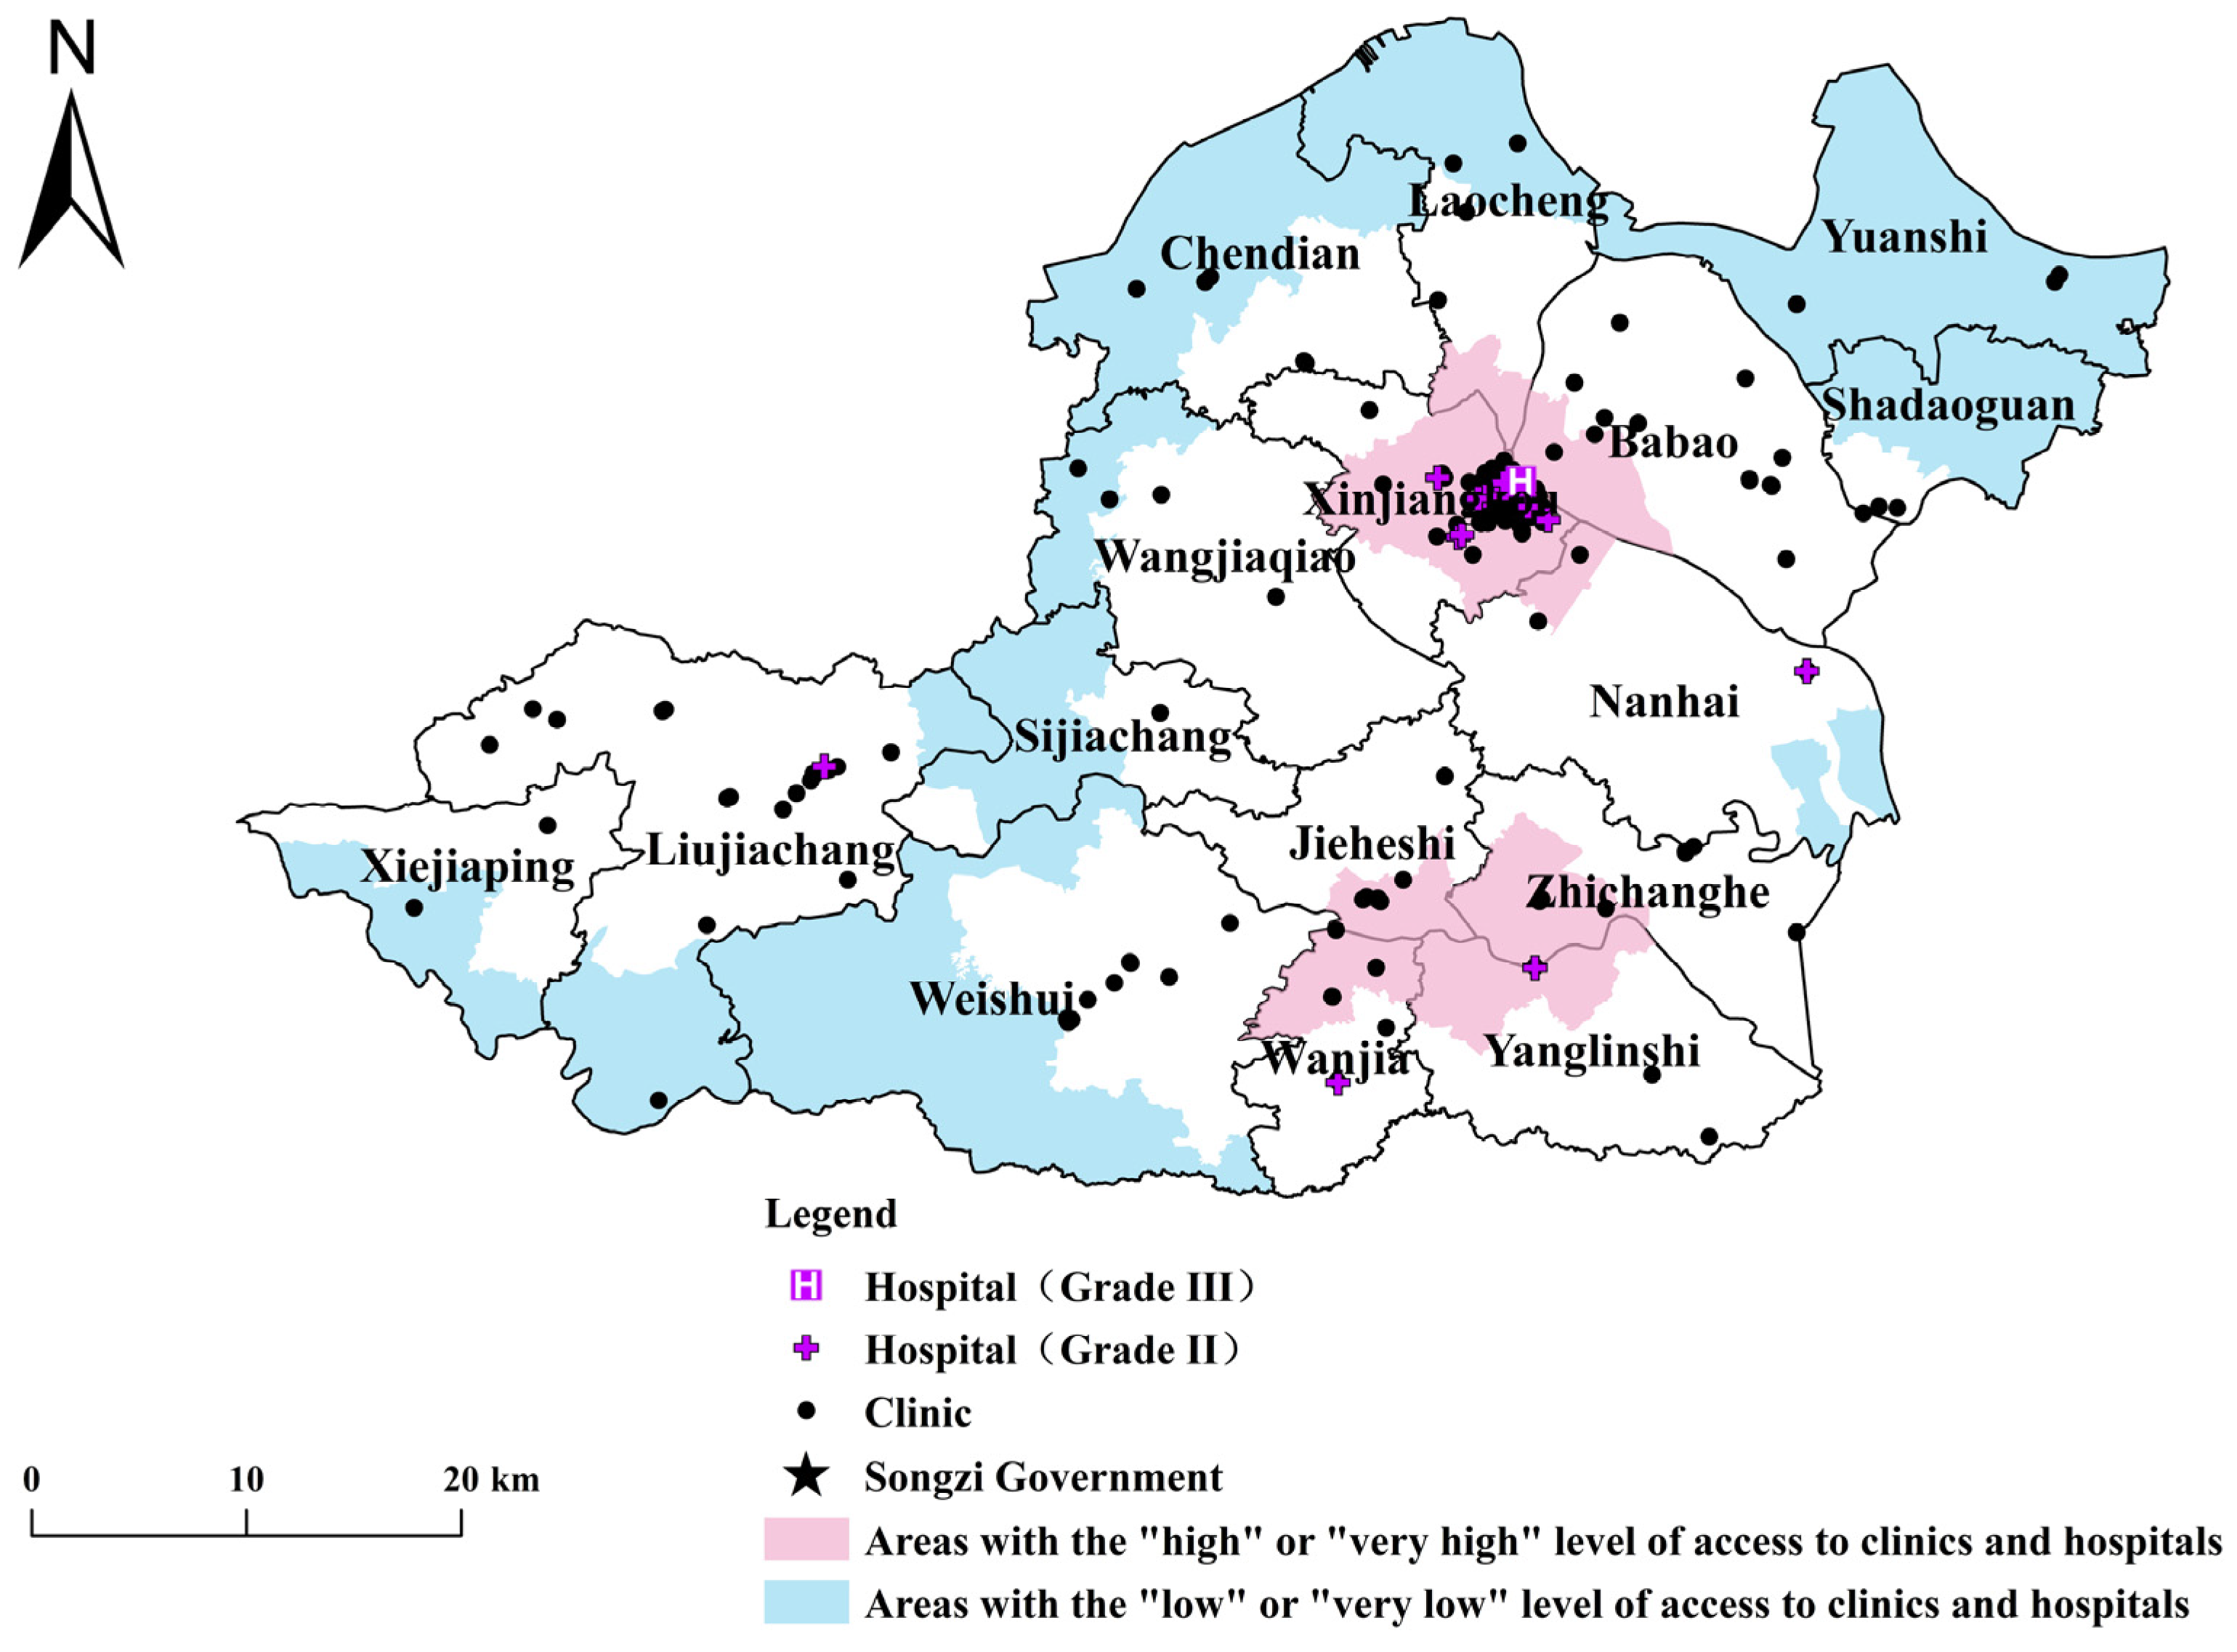
3.1. Spatial Access to Primary Healthcare Services

The variations in standardized G-2SFCA access scores for clinics (Grade I hospitals) and general hospitals (Grade II and III hospitals) are depicted in Figure 3a,b, with a range of values from 0 to 1, respectively. For access to clinics, the average standardized access value is 0.18, and over 85% of the villages have scores under 0.3. The average clinic access score in Liujiayang is the highest among all districts, standing at 0.4 (see Figure 3a). As the township of Songzi, the clinic access score of Xinjiangkou ranks second among all regions at 0.30. However, the lowest clinic access scores among all districts is Wanshi (0.04); thus, local residents have the most difficult-to-reach clinics. Regarding access to general hospitals (see Figure 3b), the standardized scores are relatively high, with 78% of villages having a value score higher than 0.3, with a mean of 0.5. Specifically, the highest mean value of hospital access scores points to Xinjiangkou, with a value of 0.89. The average hospital access score in Nanhai is 0.79, ranking second among all districts (see Figure 3b). However, Xiejiaping and Wanshi districts have the lowest access scores in all regions, at 0.09 and 0.1, showing a severe shortage of hospital services compared to other areas in Songzi (see Figure 3b).
Figure 4a,b show the spatial distribution of access scores relative to clinics and hospitals, respectively. Access scores of villages are classified into five categories (i.e., very high, high, medium, low and very low) using the Natural Breaks method. According to Figure 4a, 44.5% of the villages have a “high” or “very high” level of clinic access. The areas with a “very high” level of clinic access are located in the west area (i.e., the north of Xiejiaping and Liujiachang). Areas around the seat of government (i.e., the township) and the south of Songzi have a “high” level of clinic access. It is worth noting that while the western areas do not have as many clinical medical resources as the township, the lower patient demand resulted in a higher level of access score for clinics. The villages with a “very low” level of clinic access are distributed in the north and the middle area. Figure 4b describes that the spatial distribution of access levels to hospitals exhibits a core-periphery declining pattern, gradually decreasing from the township (i.e., Xinjiangkou) to the peripheral areas. In detail, 52 villages have the “highest” level of hospital access scores, accounting for 18.7% of the total villages, which are distributed in the central part of Songzi. In contrast, those areas with a “very low” level of hospital access are observed at the northeastern, northern, and southwestern peripheries.
Figure 5 highlights that 78 villages have a “low” or “very low” level of access to both clinics and hospitals, accounting for 23.4% of the total villages with 185,137 people. Those villages are distributed in the northern, western and southwestern peripheral areas. Comparatively, 39 villages with 176,799 residents have a “high” or “very high” level of access to both types of facilities, and those areas are mainly distributed around the Xinjiangkou and the south of Songzi. According to the above three figures, inequalities in spatial access to clinics and hospitals clearly exist, and more primary care resources should be allocated in the north and southwest of peripheral areas (i.e., Chendian, Weishui).

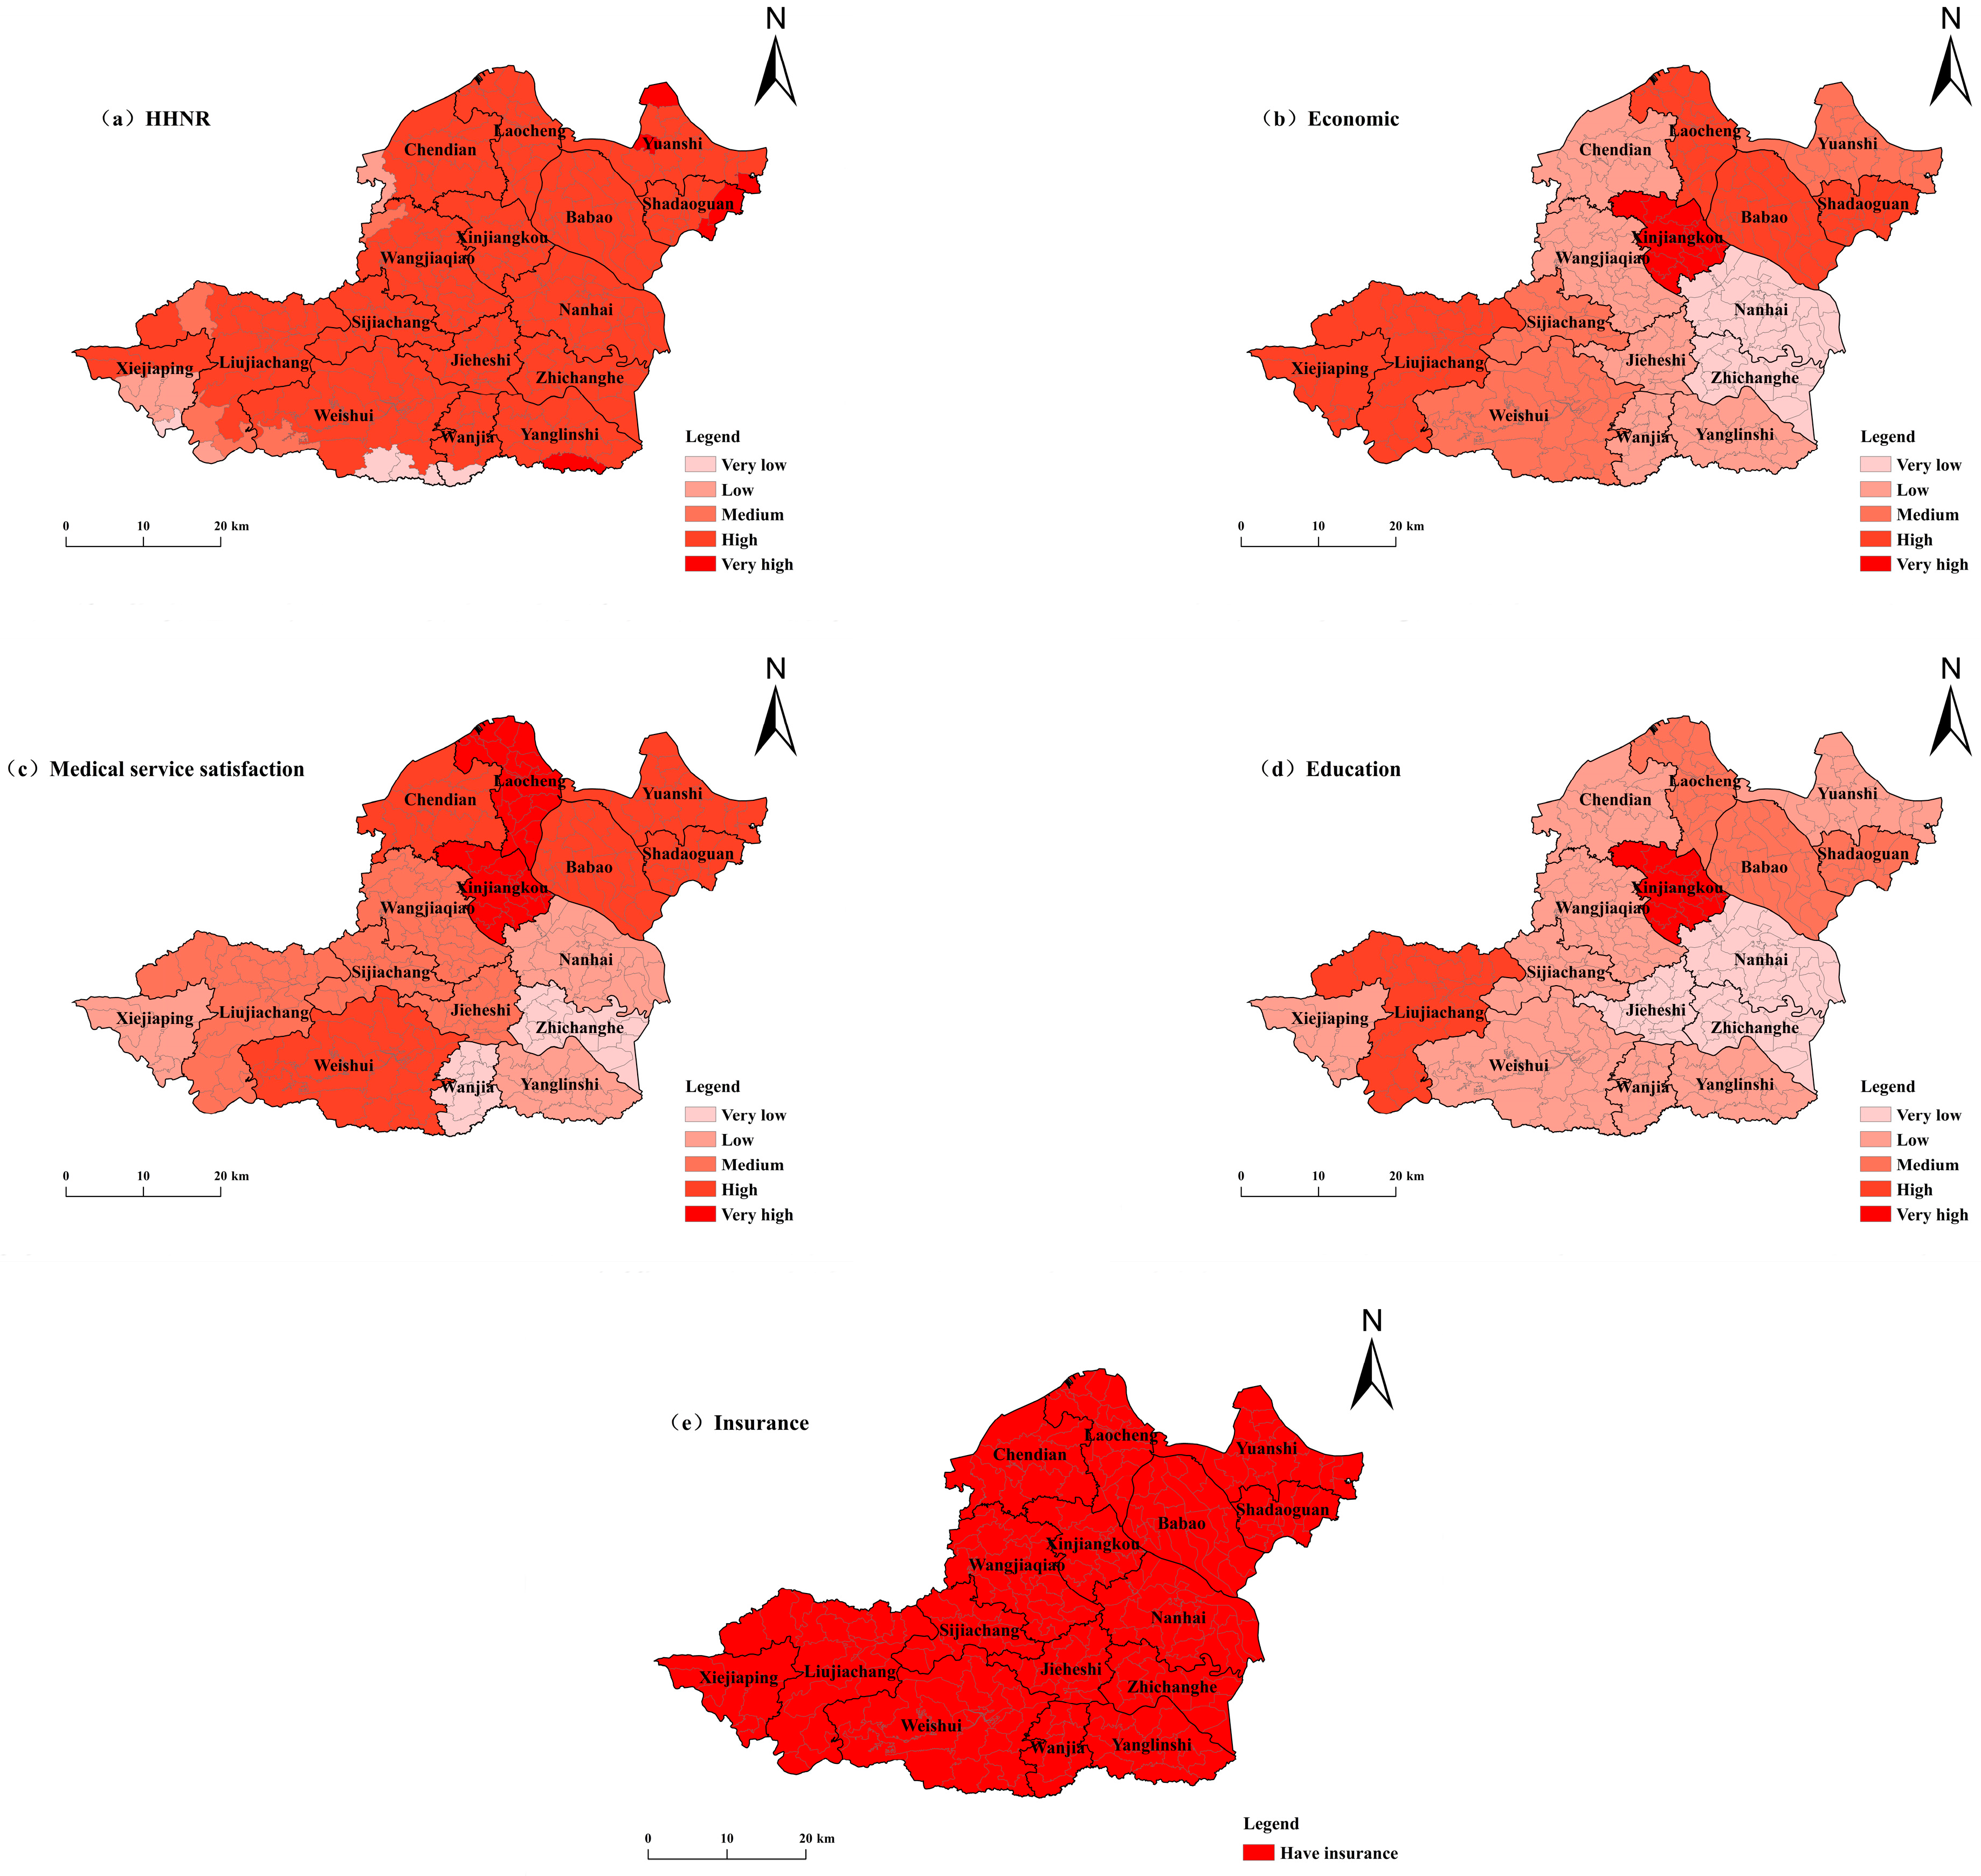
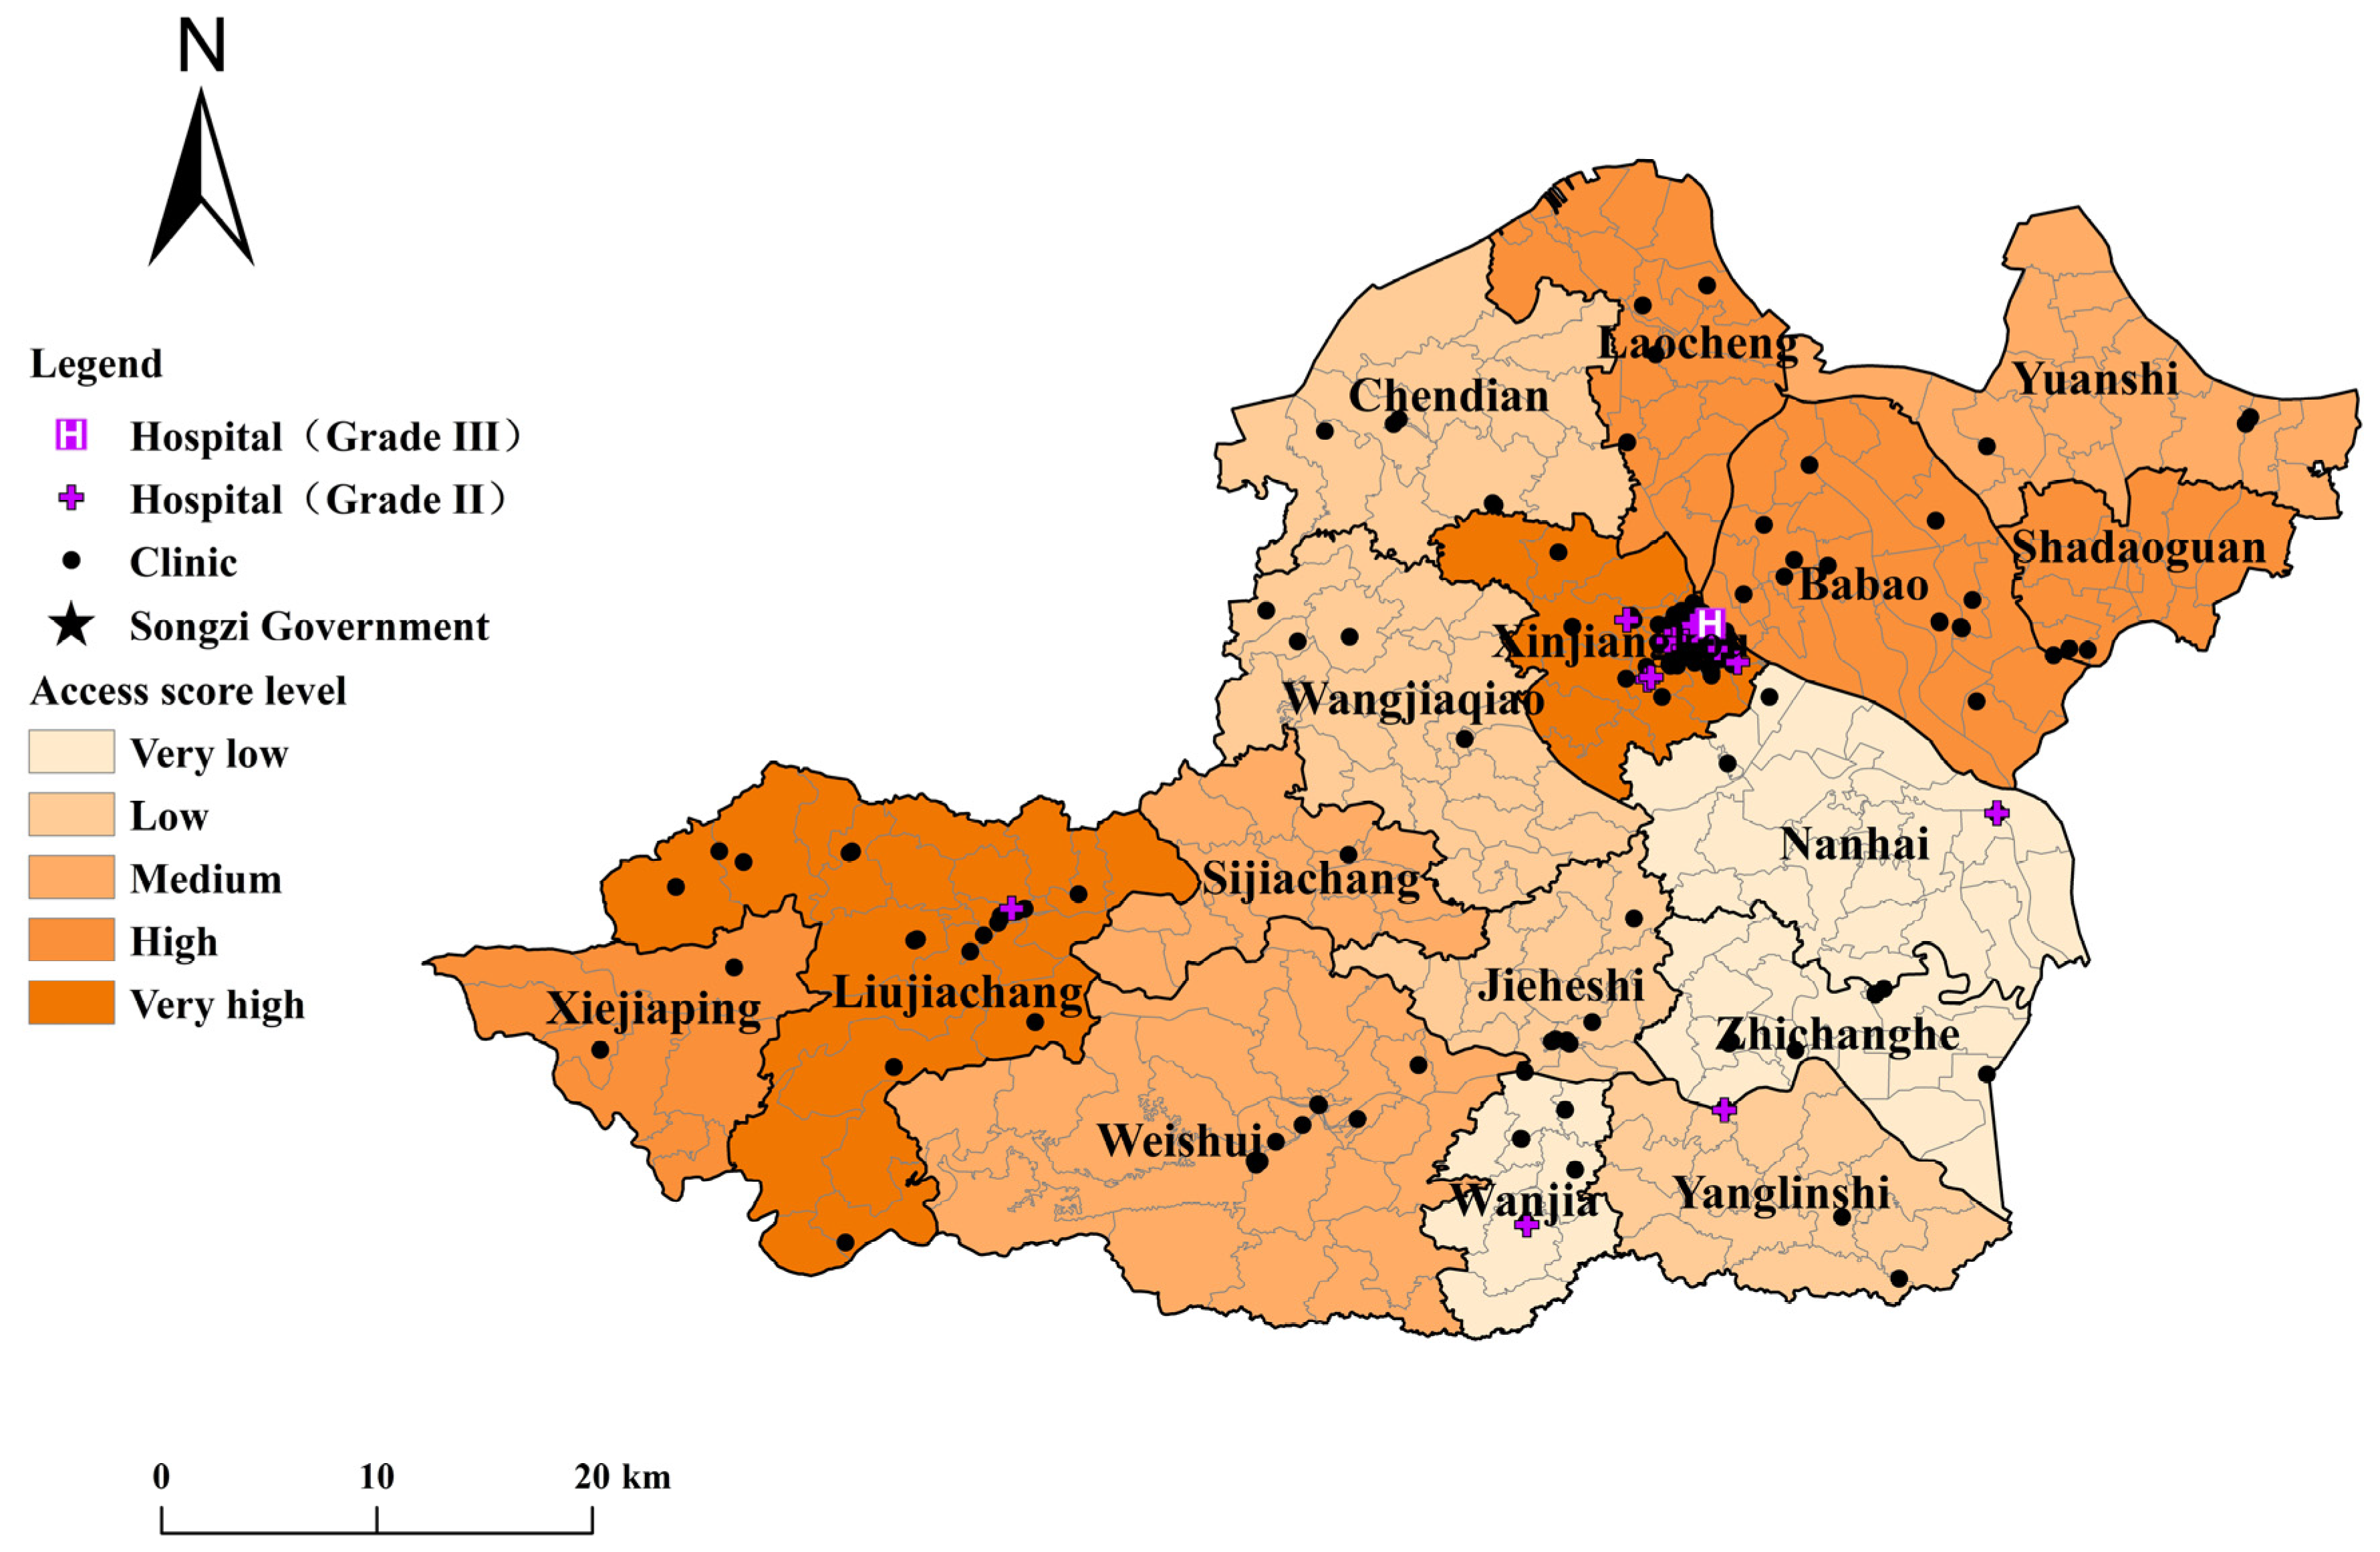
3.2. Integrating Spatial and Non-Spatial Factors

This section aims to compute comprehensive access scores to primary healthcare access using a comprehensive evaluation index with the integration of both spatial and non-spatial factors. Figure 6a–e show distributions of different non-spatial factors based on districts. Their ranks are also classified into five levels, the same as the Section 3.1. In detail, the spatial differences in healthcare insurance and demographic factors are faint (see Figure 6a,c). On the contrary, there are substantial spatial disparities in economic, medical service satisfaction and education levels, as shown in Figure 6b, Figure 6c and Figure 6d, respectively. Table 3 outlines the analysis of information entropy that has yielded valuable information about the weighting of spatial and non-spatial factors influencing primary care access. Specifically, spatial factors make up 36.5% of the total weight, with 23.0% allocated to clinic access and 13.5% to hospital access. Comparatively, the top two non-spatial factors, education level and household income, hold significant weight, contributing 29.0% and 25.5% to the overall total, respectively. Notably, patients’ satisfaction degree is assigned a weight of 7.9%, while demographic factors carry the lowest weight among all factors at just 1.0%.
Figure 7 shows the average value of CASi for each district in Songzi, with a range from 0 to 1. The CASi in Xinjiangkou surpasses all other districts, with a lead of 0.37 points over Liujiayang, which holds the second position. The average CASi in six districts is above 0.3, and there are three districts under 0.1. Nanhai and Zhichanghe have the lowest and second-lowest CASi among all districts. Figure 8 depicts the spatial distribution of CASi classified into five levels by the Natural Breaks method. The spatial disparities in CASi clear; while the districts with “high” or “very high” level of CASi are located in the north part and west parts of Songzi, the areas with “low” or “very low” levels of CASi are located in the middle and the east parts. It is worth noting that good spatial access cannot ensure equally good CASi. For example, the majority of villages in Zhichanghe district have a “high” level of clinic and hospital CASi or above. However, when non-spatial factors are considered, the CASi in those areas decreases remarkably.

4. Discussion

The research results indicate that there are disparities in access to primary healthcare for both spatial and non-spatial factors. Regarding measuring spatial access using the G-2SFCA, clinic access scores in the southern and central areas are much higher than those in the northern and western regions, and the spatial distribution of hospital access has a declining trend from the center to the periphery areas. In total, 78 villages with 185,137 local people had a “low” or “very low” level of spatial access to both clinics and hospitals, but only 39 villages with 176,799 residents had a “good” or “very good” level of spatial access to both facilities. For non-spatial factors, there are significant spatial inequalities in the education level and household income. In general, the eastern areas tend to exhibit poorer socioeconomic status and a lower level of satisfaction with medical services. It is worth noting that the healthcare insurance and population structure exhibit faint spatial variations, with an aging trend. When combining spatial and non-spatial factors using the entropy weight method, it becomes evident that the northern and southwestern areas of Songzi have the highest level of access to primary healthcare services, while the eastern region experiences the lowest access level.
Considering both spatial and non-spatial factors has a notable impact on the evaluation results of access to primary healthcare services and might find different spatial distribution characteristics. This is because areas with a high level of spatial access cannot guarantee equally good levels of non-spatial access such as local socioeconomic status or level of satisfaction with medical services. For example, although the level of spatial access to clinics and hospitals in the east of Songzi (i.e., Nanhai and Zhichanghe districts) is obviously above average, the low levels of socioeconomic status and patients’ satisfaction with medical services result in the lowest comprehensive access scores among all districts. In contrast, an area with a high level of comprehensive access does not mean it has equally good spatial access to primary healthcare services. For instance, Laocheng district, located in the northern part of Songzi and characterized by low spatial access, sees a substantial increase in its comprehensive access score when spatial and non-spatial factors are integrated. Whether a comprehensive consideration of spatial and non-spatial factors is needed depends on health planning priorities and policymakers’ focus areas. Suppose there is a need to establish new primary healthcare facilities in a short period of time (i.e., one year), measuring spatial access can identify underserved areas so that the best locations for new facilities can be found. Conversely, for policymakers aiming to formulate long-term healthcare planning policies (i.e., ten-year planning), a more holistic understanding of the local healthcare landscape necessitates the integration of both spatial and non-spatial factors.
Regarding policy implications, first, the empirical results can aid in making public policies in primary healthcare management and planning. For example, Figure 5 shows that areas around the north and southwest boundaries need to allocate more medical resources in the future due to the poor spatial access to both clinics and general hospitals. Second, spatial optimization models can be further adapted to investigate the optimal spatial configurations of clinics and general hospitals when medical resources are limited so that primary healthcare facilities can cover as many potential patients as possible under the defined travel time constraint (i.e., 10 or 15 min travel time). A similar method can be applied to investigate how to calculate the minimum number of facilities required to serve all demands within a certain time [34]. Accordingly, the spatial layout of medical resources (e.g., physicians or inpatient beds) can be reallocated to more appropriate places so that the equality and efficiency of the healthcare system can be improved [27]. Third, having good spatial access in a place cannot guarantee that the area will be equally good for non-spatial access, and vice versa. To improve non-spatial access, the governments need to provide affordable healthcare services for disadvantaged areas, enhance health literacy among individuals with lower education levels, and offer pre-service and on-the-job training for healthcare professionals. Fourth, a Chinese healthcare insurance system, named the New Rural Cooperative Medical System, has been launched, which offers financial support to rural residents for seeking healthcare services. Benefited by this, most rural residents in China have participated in the New Rural Cooperative Medical System. In this study, all respondents have participated in the insurance systems, which reflects that the policy has been well implemented in rural areas of Hubei Province. In addition, although the empirical research was carried out in Songzi, China, the study could also have implications for the rest of the world. The G-2SFCA model utilized in this study has been widely used in other relevant studies [35]. The input parameters used, which have been validated in various contexts, are not exclusive to Songzi. Non-spatial data can be obtained using a questionnaire survey with similar questions. In the context of profound changes in the current world and rural society, where we are in a risk society, the organizational structure and class of rural areas are also undergoing significant changes. Improving the medical and health conditions of rural residents, as well as the spatial imbalance of education, economy and other factors, is conducive to alleviating social exclusion in rural areas and promoting class identity [36,37].
This study has some limitations that future research should address. First, due to constraints in survey time and funding, the questionnaire survey focused on non-spatial factors was collected at the district level rather than the level of individual villages. This may result in a need for more precision in the spatial distribution of non-spatial access. Thus, a future study is necessary to conduct more refined data collection on the non-spatial dimension to improve the accuracy of results of primary healthcare access, integrating both spatial and non-spatial factors. Second, given the absence of actual medical data, such as mortality or hospital discharge rates, this study is not complex enough to draw definitive findings regarding the genuine influence of spatial and non-spatial access on the health outcomes of local people. In future research, there should be a collaboration with local healthcare authorities to acquire actual medical data and delve deeper into exploring the relationship between various access factors and local residents’ health outcomes. Third, this study only focused on whether the patients had medical insurance but did not pay attention to the type of and difference between medical insurance. Therefore, future research needs to refine the types of medical insurance to achieve a better distinction on healthcare affordability. In addition, only a driving-based travel mode is considered in this study. However, patients might select various modes of transportation to seek healthcare services, such as walking, cycling or public transport, which needs to be considered in further work.

5. Conclusions

Primary healthcare services are essential elements of the rural healthcare system and play an irreplaceable role in protecting people’s health and safety. As a primary indicator to evaluate the efficiency and equality of the primary healthcare system, access has been widely studied in the past few decades. This study contributes to the existing literature by integrating both spatial and non-spatial access with the consideration of first-hand data about patients. The empirical study focused on the primary healthcare services in Songzi, China. According to the results, we found apparent spatial inequalities in primary healthcare access with respect to both spatial and non-spatial dimensions. In addition, good spatial access cannot necessarily guarantee good non-spatial access or comprehensive access, and vice versa. This study calls for policymakers to pay more attention to intra-rural health inequalities. Meanwhile, spatial and non-spatial access should be considered comprehensively when the long-term rural medical support policy is implemented.

Author Contributions

Weicong Luo and Taohua Yang designed the research. Jinpeng Li assisted in the research design. Weicong Luo and Taohua Yang performed the analysis and programming. Lingling Tian oversaw the completion of the study. Weicong Luo and Taohua Yang prepared the first draft of the manuscript. Lingling Tian edited and improved the manuscript. All authors have read and agreed to the published version of the manuscript.

Funding

This research was supported by the National Natural Science Foundation of China (No. 42301225, No. 42271228), and the Fundamental Research Funds for the Central Universities (Grant No.2662023GGQD003).

Institutional Review Board Statement

Not applicable.

Informed Consent Statement

Not applicable.

Acknowledgments

We are grateful for the comments and contributions of the anonymous reviewers and the members of the editorial team.

Conflicts of Interest

The authors declare no conflicts of interests.

References

  1. Graves, B.A. Integrative literature review: A review of literature related to geographical information systems, healthcare access, and health outcomes. Perspect. Health Inf. Manag. AHIMA Am. Health Inf. Manag. Assoc. 2008, 5, 1652–1655. [Google Scholar] [CrossRef]
  2. Caldwell, J.T.; Ford, C.L.; Wallace, S.P.; Wang, M.C.; Takahashi, L.M. Intersection of living in a rural versus urban area and race/ethnicity in explaining access to health care in the United States. Am. J. Public Health 2016, 106, 1463–1469. [Google Scholar] [CrossRef] [PubMed]
  3. Gaffney, A.W.; Hawks, L.; White, A.C.; Woolhandler, S.; Himmelstein, D.; Christiani, D.C.; McCormick, D. Health care disparities across the urban-rural divide: A national study of individuals with COPD. J. Rural Health 2020, 38, 207–216. [Google Scholar] [CrossRef] [PubMed]
  4. Curtis, S.; Riva, M. Health geographies I: Complexity theory and human health. Prog. Hum. Geogr. 2010, 34, 215–223. [Google Scholar] [CrossRef]
  5. Joseph, A.; Bantock, P. Measuring potential physical accessibility to general practitioners in rural areas: A method and case study. Soc. Sci. Med. 1982, 16, 85–90. [Google Scholar] [CrossRef] [PubMed]
  6. Wang, F. Measurement, optimization, and impact of health care accessibility: A methodological review. Ann. Assoc. Am. Geogr. 2012, 102, 1104–1112. [Google Scholar] [CrossRef] [PubMed]
  7. Gulliford, M.; Figueroa-Munoz, J.; Morgan, M.; Hughes, D.; Gibson, B.; Beech, R.; Hudson, M. What does’ access to healthcare mean? J. Health Serv. Res. Policy 2002, 7, 186–188. [Google Scholar] [CrossRef] [PubMed]
  8. Wang, F.; Luo, W. Assessing spatial and nonspatial factors for healthcare access: Towards an integrated approach to defining health professional shortage areas. Health Place 2005, 11, 131–146. [Google Scholar] [CrossRef] [PubMed]
  9. Luo, W.; Wang, F. Measures of spatial accessibility to health care in a GIS environment: Synthesis and a case study in the Chicago region. Environ. Plan. B Plan. Des. 2003, 30, 865–884. [Google Scholar] [CrossRef]
  10. Wang, F.; McLafferty, S.; Escamilla, V.; Luo, L. Late-stage breast cancer diagnosis and health care access in Illinois. Prof. Geogr. 2008, 60, 54–69. [Google Scholar] [CrossRef]
  11. Field, K. Measuring the need for primary health care: An index of relative disadvantage. Appl. Geogr. 2000, 20, 305–332. [Google Scholar] [CrossRef]
  12. Comber, A.J.; Brunsdon, C.; Radburn, R. A spatial analysis of variations in health access: Linking geography, socioeconomic status and access perceptions. Int. J. Health Geogr. 2011, 10, 44. [Google Scholar] [CrossRef] [PubMed]
  13. Guimarães, T.; Lucas, K.; Timms, P. Understanding how low-income communities gain access to healthcare services: A qualitative study in São Paulo, Brazil. J. Transp. Health 2019, 15, 100658. [Google Scholar] [CrossRef]
  14. Wan, N.; Zhan, F.B.; Zou, B.; Chow, E. A relative spatial access assessment approach for analyzing potential spatial access to colorectal cancer services in Texas. Appl. Geogr. 2012, 32, 291–299. [Google Scholar] [CrossRef]
  15. Penchansky, R.; Thomas, J.W. The concept of access: Definition and relationship to consumer satisfaction. Med. Care 1981, 19, 127–140. [Google Scholar] [CrossRef] [PubMed]
  16. Streeter, R.A.; Snyder, J.E.; Kepley, H.; Stahl, A.L.; Li, T.; Washko, M.M. The geographic alignment of primary care Health Professional Shortage Areas with markers for social determinants of health. PLoS ONE 2020, 15, e0231443. [Google Scholar] [CrossRef]
  17. Tanser, F.; Gijsbertsen, B.; Herbst, K. Modelling and understanding primary health care accessibility and utilization in rural South Africa: An exploration using a geographical information system. Soc. Sci. Med. 2006, 63, 691–705. [Google Scholar] [CrossRef]
  18. Dai, D. Black residential segregation, disparities in spatial access to health care facilities, and late-stage breast cancer diagnosis in metropolitan Detroit. Health Place 2010, 16, 1038–1052. [Google Scholar] [CrossRef] [PubMed]
  19. Neutens, T. Accessibility, equity and health care: Review and research directions for transport geographers. J. Transp. Geogr. 2015, 43, 14–27. [Google Scholar] [CrossRef]
  20. Malpas, J. Putting Space in Place: Philosophical Topography and Relational Geography. Environ. Plan. D Soc. Space 2012, 30, 226–242. [Google Scholar] [CrossRef]
  21. Simandan, D. The wise stance in human geography. Trans. Inst. Br. Geogr. 2011, 36, 188–192. [Google Scholar] [CrossRef]
  22. Shah, T.I.; Bell, S.; Wilson, K. Spatial accessibility to health care services: Identifying underserviced neighbourhoods in Canadian urban areas. PLoS ONE 2016, 11, e0168208. [Google Scholar] [CrossRef] [PubMed]
  23. Luo, W.; Yao, J.; Mitchell, R.; Zhang, X. Spatiotemporal access to emergency medical services in Wuhan, China: Accounting for scene and transport time intervals. Int. J. Health Geogr. 2020, 19, 52. [Google Scholar] [CrossRef] [PubMed]
  24. Okuyama, K.; Akai, K.; Kijima, T.; Abe, T.; Isomura, M.; Nabika, T. Effect of geographic accessibility to primary care on treatment status of hypertension. PLoS ONE 2019, 14, e0213098. [Google Scholar] [CrossRef] [PubMed]
  25. Berenbrok, L.A.; Tang, S.; Gabriel, N.; Guo, J.; Sharareh, N.; Patel, N.; Dickson, S.; Hernandez, I. Access to community pharmacies: A nationwide geographic information systems cross-sectional analysis. J. Am. Pharm. Assoc. 2022, 62, 1816–1822. [Google Scholar] [CrossRef] [PubMed]
  26. Amaral, P.V.; Murray, A.T. Equity in regional access to renal dialysis in Brazil. Reg. Sci. Policy Pract. 2016, 8, 27–44. [Google Scholar] [CrossRef]
  27. Luo, W.; Yao, J.; Mitchell, R.; Zhang, X.; Li, W. Locating emergency medical services to reduce urban-rural inequalities. Socio-Econ. Plan. Sci. 2022, 84, 101416. [Google Scholar] [CrossRef]
  28. Ahmed, S.; Adams, A.M.; Islam, R.; Hasan, S.M.; Panciera, R. Impact of traffic variability on geographic accessibility to 24/7 emergency healthcare for the urban poor: A GIS study in Dhaka, Bangladesh. PLoS ONE 2019, 14, e0222488. [Google Scholar] [CrossRef]
  29. Yip, W.; Fu, H.; Chen, A.T.; Zhai, T.; Jian, W.; Xu, R.; Pan, J.; Hu, M.; Zhou, Z.; Chen, Q.; et al. 10 years of healthcare reform in China: Progress and gaps in universal health coverage. Lancet 2019, 394, 1192–1204. [Google Scholar] [CrossRef]
  30. Agbenyo, F.; Nunbogu, A.M.; Dongzagla, A. Accessibility mapping of health facilities in rural Ghana. J. Transp. Health 2017, 6, 73–83. [Google Scholar] [CrossRef]
  31. Songzi Council. Data from the Seventh National Census of Songzi. Available online: http://www.hbsz.gov.cn/content_group/sydd/202106/t20210630_614385.html (accessed on 30 October 2023).
  32. China National Health Commission. Transcript of the Press Conference of the National Health Commission. Available online: http://www.nhc.gov.cn/xcs/s3574/202307/a6cdc063f8074eadac781e84c9dadc7a.shtml (accessed on 30 October 2023).
  33. Cheng, J.M.; Zhang, W.M.; Jin, H. Comprehensive safety evaluation of metallurgical crane based on AHP and entropy weight method. IOP Conf. Ser. Mater. Sci. Eng. 2021, 1043, 042050. [Google Scholar] [CrossRef]
  34. Yao, J.; Zhang, X.; Murray, A.T. Location optimization of urban fire stations: Access and service coverage. Comput. Environ. Urban Syst. 2019, 73, 184–190. [Google Scholar] [CrossRef]
  35. Zhang, F.; Li, D.; Ahrentzen, S.; Zhang, J. Assessing spatial disparities of accessibility to community-based service resources for Chinese older adults based on travel behavior: A city-wide study of Nanjing, China. Habitat Int. 2019, 88, 101984. [Google Scholar] [CrossRef]
  36. Shucksmith, M. Young People and Social Exclusion in Rural Areas. Sociol. Rural. 2004, 44, 43–59. [Google Scholar] [CrossRef]
  37. Walsh, K.C.; Jennings, M.K.; Stoker, L. The Effects of Social Class Identification on Participatory Orientations towards Government. Br. J. Political Sci. 2004, 34, 469–495. [Google Scholar] [CrossRef]
Figure 1. The framework of this study.
Ijgi 13 00142 g001
Figure 2. Location of study area.
Ijgi 13 00142 g002
Figure 3. Boxplots of spatial access scores to primary healthcare services: (a) clinic access; (b) hospital access.
Ijgi 13 00142 g003
Figure 4. Distribution of levels of access to (a) clinics and (b) hospitals.
Ijgi 13 00142 g004aIjgi 13 00142 g004b
Figure 5. Spatial distribution of highlighted areas.
Ijgi 13 00142 g005
Figure 6. Levels of different factors related to non-spatial factors: (a) demographic factor—HHNR; (b) household income; (c) medical service satisfaction; (d) education level; (e) healthcare insurance.
Ijgi 13 00142 g006
Figure 7. Average comprehensive (overall) access scores for each district in Songzi.
Ijgi 13 00142 g007
Figure 8. Distribution of levels of average comprehensive access.
Ijgi 13 00142 g008
Table 1. Economic and social overview of each district.
DistrictPopulation Density
(People/km2)
Number of VillagesPer Capita Annual Income (RMB yuan)Number of HospitalsNumber of Clinics
Xinjiangkou15871088201083
Shadaoguan4606514902
Wanshi35217410603
Babao436175400014
Laocheng36817489204
Chendian23412325305
Nanhai31621289616
Weishui223254040013
Liujiachang225216500120
Jieheshi441143345010
Wangjiaqiao26621355705
Sijiachang27913389501
Wanjia3588308515
Zhichanghe32112254818
Yanglinshi33713335002
Xiejiaping1338480002
Table 2. Non-spatial factors related to access to primary healthcare services.
Non-Spatial FactorsCollected WayQuestionRankIndicator Character
AgeWorldpop DatasetNoneNone-
IncomeQuestionnaireWhat is your annual income range?1: Above 10 k;
2: 10–30 k;
3: 30–50 k;
4: 50–80 k;
5: 80–150 k;
6: Above 150 k (Unit: RMB)
+
Education levelQuestionnaireWhat is your highest educational degree?1: Primary school or Below;
2: Junior high school;
3: Senior high school;
4: Junior College;
5: University degree or Above
+
Health InsuranceQuestionnaireDo you have a health insurance?1: Yes; 0: No+
Satisfaction levelQuestionnaireHow satisfied you are with local medical services1: Great dissatisfaction;
2: Dissatisfaction;
3: Not bad;
4: Satisfaction;
5: Great satisfaction
+
Table 3. Weights of spatial and non-spatial factors related to primary healthcare access.
IndicatorsIndicator CharacterWeightRemark
Spatial factorsAccessibility of clinic Positive0.2298Clinic’s G-2SFCA scores
Accessibility of hospitalPositive0.1354Hospital’s G-2SFCA scores
Non spatial
factors
AgeNegative0.0102HHNR (children aged 0–5, women aged 15–44, and elderly people aged 65 and above) to the total population
household incomePositive0.2545Per capita annual income of residents
Medical service satisfactionPositive0.0792Residents’ satisfaction with medical facilities and services
Healthcare insurancePositive0.0000Whether residents have health insurance (1—Yes; 0—No)
EducationPositive0.2908Education level of residents (1–5 indicates education level from low to high)
Disclaimer/Publisher’s Note: The statements, opinions and data contained in all publications are solely those of the individual author(s) and contributor(s) and not of MDPI and/or the editor(s). MDPI and/or the editor(s) disclaim responsibility for any injury to people or property resulting from any ideas, methods, instructions or products referred to in the content.

