
A Descriptive-Predictive–Prescriptive Framework for the Social-Media–Cryptocurrencies Relationship

1
Academy of Romanian Scientists, Ilfov 3, 050044 Bucharest, Romania
2
Department of Economic Informatics and Cybernetics, Bucharest University of Economic Studies, No. 6 Piaţa Romană, 010374 Bucharest, Romania
*
Author to whom correspondence should be addressed.
Electronics 2024, 13(7), 1277; https://0-doi-org.brum.beds.ac.uk/10.3390/electronics13071277
Submission received: 13 February 2024
/
Revised: 18 March 2024
/
Accepted: 25 March 2024
/
Published: 29 March 2024
(This article belongs to the Special Issue Big Data and Blockchain Technologies: Explorations, Solutions and Applications)
Abstract
:The research presented in this paper is the first to introduce a thorough Descriptive-Predictive–Prescriptive (DPP) Framework for comprehending the interaction between social media and cryptocurrencies. Recognizing the underexplored domain of the social-media–cryptocurrency interaction, we delve into its many aspects, better understanding present dynamics, forecasting potential future trajectories, and prescribing best solutions for stakeholders. We evaluate social media speech and behavior connected to cryptocurrencies using big data analytics, translating raw data into meaningful insights using Natural Language Processing (NLP) techniques like sentiment analysis. When applied to an experimental dataset, the DPP nets superior results compared to the baseline approach, displaying an improvement of 3.44% of the Root Mean Square Error (RMSE) metric and 4.59% of the Mean Absolute Error (MAE) metric. The unique DPP framework enables a more in-depth assessment of social media’s influence on cryptocurrency trends, and lays the path for strategic decision-making in this nascent but rapidly developing field of study.
1. Introduction
The emergence of Bitcoin in 2009 [1] signified the commencement of a novel time in the field of financial systems. The event in question encompassed not only the introduction of a new form of currency, but also the establishment of a fully decentralized and digital financial ecosystem. More than ten years have passed, and the cryptocurrency industry has witnessed the emergence of numerous digital currencies, resulting in a collective market capitalization that surpasses trillions. Consequently, the cryptocurrency industry has evolved from its initial stages to now hold a prominent position within the global financial arena.
The rapid and significant increase in the popularity and value of cryptocurrencies, led by Bitcoin, has brought about a fundamental change in the conventional financial system. The decentralized nature and potential for disintermediation of digital assets, supported by blockchain technology, provide a challenge to traditional monetary systems. Nevertheless, the inherent instability associated with cryptocurrencies, particularly Bitcoin, presents substantial challenges for investors, governments, and regulators alike. Predicting the price of such assets is widely recognized as a challenging task, primarily because of their speculative nature, absence of inherent worth, and susceptibility to various market moods, which are frequently magnified through social media platforms. The volatile nature of price swings poses challenges for investment decision-making and the development of regulatory frameworks that balance stakeholder protection with the promotion of innovation. Therefore, the correlation between social media trends and cryptocurrency prices has become a significant subject of research, necessitating a comprehensive descriptive, predictive, and prescriptive analytical framework to leverage this connection for well-informed decision-making in the era of digital technology.
The cryptocurrency market, unlike traditional markets, lacks established parameters and indicators that can reliably guide investment decisions. This inherent volatility poses significant challenges in accurately predicting the trajectory of cryptocurrency investments. Cryptocurrency possesses distinct characteristics within the field of finance due to its decentralized nature, lack of physical asset support, and vulnerability to social and geopolitical factors. The rapid and significant growth of social media platforms has added further complexity to this domain. Social media platforms such as Twitter, Reddit, and Discord have emerged as prominent hubs for the exchange of ideas and opinions regarding cryptocurrencies. Within these digital spaces, influential individuals, passionate supporters, and skeptics actively participate in shaping the prevailing discourse. Consequently, it is plausible that these discussions may have an impact on the volatility in asset prices. Significant fluctuations can be induced by major announcements, speculations, or even unverified rumors, thereby intensifying the precarious nature of the investment landscape.
The reciprocal relationship between social media discourse and the cryptocurrency markets, which has been previously studied [2], underscores the necessity for a comprehensive analytical instrument. Conventional financial analysis tools frequently prove inadequate in capturing the intricacies and swift fluctuations that are inherent to the field of cryptocurrencies. The present study introduces a Descriptive-Predictive–Prescriptive (DPP) framework to address this disparity. By integrating data science methodologies with socio-economic analysis, the objective of this paper is to develop an instrument that not only provides a comprehensive depiction and forecast of market trends, but also offers practical recommendations for stakeholders. To our knowledge, this is the first such effort that seeks to implement a plethora of information (blockchain, price, social media) to facilitate a functional decision making instrument, the DPP framework.
The complex interaction between the dynamics of social media and the highly fluctuating cryptocurrency markets constitutes a sophisticated symbiotic relationship that significantly influences the vitality of the digital economy. Conventional financial analysis models are inadequate in interpreting the enigmatic dynamics of cryptocurrency markets due to their inability to effectively adapt to the fast-paced and unpredictable nature of this domain. The DPP framework is designed to effectively analyze the intricate nature of Bitcoin, or any other cryptocurrency, price fluctuations that have been historically challenging to comprehend. By integrating advanced data science approaches with comprehensive socio-economic insights, the study goes beyond simple analysis. It offers an innovative tool for clarification, prediction, and advice. The trifecta approach shown in this study offers a comprehensive analysis of market behavior in the realm of cryptocurrencies. It not only provides a highly accurate mapping of this field but also generates practical tactics that can be used by investors, regulators, and other stakeholders. This method has the potential to revolutionize decision-making processes in the field. The work presented in this paper makes a significant contribution to the field of predictive analytics by providing valuable insights and guidance for navigating the realm of Bitcoin investment with foresight and confidence. Moreover, the widespread influence and decentralized structure of both social media and cryptocurrencies bring an additional level of intricacy. The crypto market can be influenced by various international events, such as regulatory changes in major economies and technological breakthroughs, which have the potential to create significant impact. Given the borderless nature of digital assets, it is imperative to comprehend this global perspective.
Regarding frameworks in the context of crypto markets, the literature is still in its infancy. There are studies that propose a framework for identifying the main drivers for cryptocurrency investment [3]. The fuzzy Full Consistency Method-Bonferroni (FUCOM-F’B) model is used in this paper to analyze the key reasons for investing in cryptocurrencies. The 23 drivers were classified into five categories: functionality, finance, legal infrastructure, technology, and security. According to the survey, the most crucial elements in picking a cryptocurrency are strong electronic encryption and the use of digital signatures. The research validates the suggested model’s dependability, applicability, and stability while also taking ambiguities and subjectivity into account in the decision-making process. Finally, the study serves as a decision-making tool for regulators, politicians, practitioners, and cryptocurrency investors.
Another paper introduces a framework for systemic cryptocurrency risk sharing in the COVID-19 crisis [4]. The Conditional Value-at-Risk (CoVaR) model is used in this article to create a systemic contagion index (SCI) for cryptocurrencies, with the goal of analyzing their spillover effects. During the COVID-19 timeframe, the SCI reached a peak, indicating the presence of pandemic-induced contagion pathways. Furthermore, the increased interconnections in cryptocurrency systemic networks during the epidemic highlighted an increase in the number of these contagion pathways. This study gives practical insights to investors, assisting them in understanding the systemic vulnerability of specific cryptocurrencies and making educated judgments in both crisis and non-crisis situations.
Park et al. introduced a digital forensic framework for investigating offenses related to cryptocurrencies [5]. This study aims to fill a gap in the existing literature by presenting a systematic three-phase methodology for conducting forensic analysis on cryptocurrency wallets. The proposed approach includes the following stages: Forensic Readiness, Acquisition, and Investigation. The objective of this methodology is to offer researchers a standardized approach for conducting investigations related to cryptocurrencies. The robust applicability of this framework as a foundational model for cryptocurrency forensics is suggested by its validation, which was carried out through tests on three prominent cryptocurrency wallets.
As can be seen, even if some efforts have been made in the field, some gaps are still present. These frameworks focus on niche areas: investment drivers (functionality, finance, legal infrastructure, technology, security), systemic risk during crises, and digital forensics. The DPP Framework aims to provide a comprehensive understanding of the relationship between social media and cryptocurrencies. It leverages big data analytics and natural language processing to analyze social media speech and behavior related to cryptocurrencies, intending to inform strategic decision-making in this volatile market. As such, existing frameworks concentrate on specific cryptocurrency market aspects, while the DPP Framework aims to explore the broad interaction between social media and cryptocurrency movements. This represents a novel approach by integrating social media analytics into the understanding of cryptocurrency dynamics. The DPP Framework’s use of big data analytics and NLP for analyzing unstructured social media data presents a methodological advancement over the more focused or traditional approaches seen in the literature. While the current frameworks provide valuable insights into investment decision-making, systemic risk, and forensic analysis, the DPP Framework seeks to offer a broader utility by aiding in strategic decision-making through the predictive and prescriptive analysis of social media’s impact on cryptocurrency.
The rise of cryptocurrencies as an innovative financial system has attracted considerable attention, primarily due to the utilization of cryptocurrency mining devices (CMDs) by miners for transaction validation. Hajipour et al. [6] studied how the profitability associated with mining activities has prompted numerous individuals within the electrical industry to exploit renewable energy sources for the purpose of cryptocurrency mining. Within this context, owners of microgrids (MGs) may choose to allocate their excess power towards the process of digital currency mining, as opposed to exporting it to the primary grid. This study explores the effects of this emerging enterprise on the operations of distribution networks. In this study, an innovative energy management (EM) model is introduced that is designed specifically for mining loads. To evaluate the financial performance of mining operations in the face of prevailing uncertainties, the Monte Carlo simulation technique is used to estimate the annual profits. Following financial metrics assist MG owners in determining the most suitable type and quantity of CMD. The study further emphasizes the potential influence of existing electricity pricing systems in different countries on the inclination of microgrids (MGs) to engage in mining activities. The results of the study draw attention to a hypothetical situation in which microgrids transition into passive energy systems, primarily relying on imported power for the purpose of cryptocurrency mining. In essence, the decrease in mining installations in response to rising electricity prices necessitates a more proactive involvement of microgrids (MGs) in the generation of electricity.
A study by Brauneis and Mestel [7] utilizes the Markowitz mean-variance framework to assess the risk-return trade-offs associated with portfolios consisting of cryptocurrencies. By employing daily data from the top 500 cryptocurrencies during the period from 1 January 2015 to 31 December 2017, the authors compare the risk and returns associated with different mean-variance portfolio strategies in comparison to individual investments in cryptocurrencies, a diversely allocated portfolio without much consideration, and the CRIX benchmark. The out-of-sample analysis conducted in this study incorporates transaction costs and indicates that the integration of cryptocurrencies presents a broader selection of investment opportunities with reduced risk within the cryptocurrency market. It is worth mentioning that when considering the Sharpe ratio and certainty equivalent returns, the equally distributed (1/N) portfolio outperforms the individual performances of cryptocurrencies and achieves superior results compared to 75% of portfolios optimized using the mean-variance approach.
The research done by Hu et al. [8] undertakes a reassessment of the Efficient Market Hypothesis (EMH) by conducting an analysis of 31 prominent cryptocurrencies with high market capitalization. The analysis is carried out using a set of panel tests. The preliminary examinations of cross-sectional dependence among these cryptocurrencies lay the groundwork for subsequent tests of non-stationarity. By utilizing panel unit root/stationarity tests that consider potential cross-sectional dependence and structural breaks, the authors collectively examine the efficiency of the cryptocurrency market. The aggregated panel data suggests a lack of empirical support for the Efficient Market Hypothesis (EMH), indicating the presence of inherent market inefficiencies within the domain of cryptocurrencies.
However, most efforts to develop frameworks for cryptocurrencies appear in a legislative context [9], where various institutions such as the European Commission try to frame these financial instruments in a legal framework. Thus, the field of knowledge is still in its infancy and that a significant contribution can be made. The framework proposed in this report is thus one of the first frameworks to address the cryptocurrency domain and is the first, to our knowledge, to address on-chain metrics, social media sentiment, and artificial intelligence in the context of cryptocurrencies. This is a gap that has not yet been filled in the existing literature, which the present paper seeks to address.
On the broader field of Bitcoin or cryptocurrencies price prediction, extensive research has been conducted. Koo and Kim [10] introduced a new method named Centralized Clusters Distribution (CCD) to enhance Bitcoin price predictions, particularly at the distribution tails where accuracy often diminishes. This approach, combined with a specialized loss function called Weighted Empirical Stretching (WES), effectively mitigates Bitcoin’s price bimodality. The integration of CCD and WES with Long Short-Term Memory (LSTM) models and Singular Spectrum Analysis (SSA) significantly reduces prediction errors, outperforming traditional models by up to 22.5% in extreme cases.
Another study [11] investigates the characteristics of financial asset prices that influence Bitcoin’s return distributions through quantile regressions and past realized moments of various assets. It finds that Bitcoin’s own past volatility is a strong predictor of its returns, underscoring its nature as a risk asset, while its past kurtosis also contributes to predicting recent trends. Other assets show limited predictive ability, highlighting Bitcoin’s distinctive price dynamics. Lasso quantile regression models further validate the predictive strength of Bitcoin’s lagged indicators during the COVID-19 era.
Zou and Herremans [12] examine the potential of using Twitter data, beyond simple sentiment analysis, to predict Bitcoin’s extreme price movements, attributed in part to influential figures’ tweets. A novel multimodal deep learning approach is introduced, which integrates candlestick patterns, correlated asset prices, technical indicators, and Twitter content. The study utilizes a new dataset called PreBit, consisting of daily tweets from 2015 to 2021, to train a hybrid model that combines a SVM using price data with a text-based CNN using FinBERT embeddings. An ablation study assesses the impact of incorporating social media data on the model’s predictive capabilities, and a devised trading strategy based on the model’s output demonstrates potential profitability against traditional strategies.
Rajabi et al. [13] tackles the challenge of Bitcoin price prediction by proposing a novel method called Learnable Window Size (LWS) which dynamically determines the optimal number of past days to consider for next-day price forecasting. Utilizing a two-stage deep neural network, the model first predicts the best window size based on Bitcoin’s recent price trends and volatility, and then predicts the next day’s price within this window. Tested on a dataset incorporating Google trends, blockchain information, and Bitcoin market data, the method demonstrates superior accuracy over traditional models like Support Vector Regression and ARIMA, as evidenced by the newly introduced Prediction Hardship Factor (PHF).
The paper of Koo and Kim [14] delves into the field of Bitcoin price prediction, highlighting that while machine learning techniques are widely used to forecast financial indices, few studies explore the manipulation of original distribution for enhanced performance. The authors introduce a Flattening Distribution Strategy (FDS) based on copula theory to artificially adjust the distribution of Bitcoin price return data, which typically clusters near zero. By applying this strategy to various neural network architectures, multilayer perceptron (MLP), recurrent neural networks (RNN), and LSTM, the study demonstrates a notable improvement in the accuracy of predicting Bitcoin price returns.
The study by Yan et al. [15] addresses the challenge of integrating cryptocurrencies into everyday economic activities by proposing a user benefit-maximizing approach for predicting transaction bidding prices using dynamic game theory. The model considers not only historical data, but also the potential future impact of transactions, providing a detailed interaction analysis between them. It introduces a user satisfaction metric and establishes a user benefit model to ensure transactions are successfully executed within a desirable pricing range. Comparative results show that this novel approach outperforms conventional machine learning algorithms, particularly for users not new to trading and in scenarios with smaller datasets, offering higher prediction accuracy and sensitivity with reduced computational complexity.
The research of Rothore et al. [16] presents an alternative approach to cryptocurrency price prediction, addressing the limitations of traditional models such as LSTM and ARIMA. The study critiques LSTMs for their complexity and opaque nature, requiring extensive hyperparameter tuning, and highlights ARIMA’s shortcomings in adapting to the fast-changing patterns and seasonality of cryptocurrency data. In response, the paper proposes the use of the Fbprophet model, which is deemed more functional and better suited to the unpredictable cryptocurrency market. The Fbprophet model’s ability to account for seasonality and its robustness in scenarios with limited historical data make it a promising tool for traders. The study emphasizes that the model’s predictive accuracy is superior to its counterparts, offering a methodology that relies less on past data and more on understanding underlying trends, which is crucial for the volatile crypto market.
Another paper of interest by Cavalli and Amoretti [17] presents a novel method for predicting Bitcoin trends using a One-Dimensional Convolutional Neural Network (1D CNN). It describes a unique data assembly approach that incorporates social media, blockchain transactions, and financial indicators. Leveraging a cloud-based system for efficient data gathering the study claims to be the first to apply 1D CNN to Bitcoin prediction. The simplicity of 1D CNN allows for cost-effective implementation, and it reportedly surpasses LSTM models in accuracy. Additionally, a simulated trading strategy based on the model demonstrates its potential to enhance profits in bullish markets and minimize losses in bearish ones.
Yi et al. [18] investigated the impact of incorporating information from other cryptocurrency markets to improve Bitcoin’s realized volatility (RV) forecasting. It uses six different multivariate predictive models, highlighting that the scaled principal component analysis (SPCA) approach consistently enhances the performance of the conventional heterogeneous autoregressive (HAR) model. This improvement is confirmed with the model confidence set (MCS) and Diebold–Mariano (DM) tests, using three established loss functions. The improved forecasting performance is also resilient across various robustness checks. Additionally, it’s found that an investment strategy based on the HAR-SPCA model forecasts yields consistent economic benefits. The research underscores the statistical and economic significance of external cryptocurrency market information in predicting Bitcoin’s RV.
Jaquart et al. [19] evaluates the predictability of Bitcoin prices within 1-to-60 min intervals using various machine learning techniques. The analysis reveals that recurrent neural networks and gradient boosting classifiers perform best, with technical indicators being the most critical predictive features. While predictability improves with longer time horizons, a trading strategy based on these predictions yields high returns only before considering transaction costs, which ultimately negate profits due to short holding periods.
The research of Chen et al. [20] addresses the challenge of predicting Bitcoin prices by applying machine learning techniques to different types of data: daily prices with high-dimensional features and high-frequency prices with basic trading features. For daily price prediction, simpler statistical methods like Logistic Regression and Linear Discriminant Analysis surprisingly outperform complex algorithms, achieving 66% accuracy. For 5 min interval predictions, machine learning models such as Random Forest and XGBoost surpass statistical methods with an accuracy of 67.2%. This study serves as a preliminary exploration into the impact of data structure and dimensionality on the effectiveness of various predictive models in forecasting Bitcoin prices.
Another study by Chen et al. [21] presents a novel two-stage approach to predict the Bitcoin exchange rate, focusing on economic and technological determinants rather than historical exchange rate data. Initially, an artificial neural network and random forest models are utilized for nonlinear feature selection to identify the most impactful economic and technology factors. In the second stage, these selected predictors are fed into a LSTM model to forecast Bitcoin’s future value. The results indicate that the LSTM model, informed by the identified determinants, outperforms traditional models that rely on past exchange rates, such as the autoregressive integrated moving average and support vector regression. The study concludes that economic and technology determinants offer a more valuable predictive capability for Bitcoin exchange rates than merely using historical pricing data.
The study of Shu and Zhu [22] evaluates the use of the log-periodic power law singularity (LPPLS) model for identifying bubbles in Bitcoin prices, finding that while daily data is not sufficient for predictions, a refined approach using 1 h and 30 min intervals improves bubble detection and crash forecasting. This adaptive multilevel time series methodology is more responsive to price fluctuations and can offer real-time insights into bubble dynamics, potentially benefiting broader financial market analysis.
Mtiraoui et al. [23] introduces a hybrid model combining ARFIMA, EW transform, and LLWNN to predict Bitcoin prices, capitalizing on the strengths of each component for improved forecasting accuracy. The optimized ARFIMA-EWLLWNN model surpasses classic forecasting models, offering precise long-term predictions and reduced error rates, thus standing out as an effective tool for Bitcoin market analysis.
Feng and Zhang [24] found that Bitcoin prices can predict traditional currency exchange rates both in the short and long term. This predictive power is attributed to Bitcoin’s ability to reflect expectations about future exchange rates and their underlying economic factors. By using Bitcoin prices in autoregressive distributed lag (ADL) and error correction models, the study demonstrates that these forecasts can outdo several benchmark predictions, especially in daily trading. Moreover, Bitcoin-based forex trading strategies can yield higher Sharpe ratios than the US risk-free rate and carry trade, suggesting Bitcoin’s returns carry additional insights into future interest rate differences beyond past exchange rate movements. This discovery offers promising perspectives for currency market traders who often grapple with the challenge of forecasting exchange rates.
Basher and Sadorsky [25] use machine learning and econometric models to forecast Bitcoin and gold prices, finding that random forests provide more accurate predictions than traditional models. Technical indicators emerge as critical predictors, suggesting possible market inefficiencies. The study also finds that while Bitcoin serves to diversify against oil price volatility, gold is more affected by inflation, highlighting their distinct roles as investment assets.
Hajek et al. [26] introduces a novel framework for forecasting Bitcoin prices by using the Bitcoin Misery Index as an indicator of investor attitude. The model utilizes real-world trading data and implements a methodology known as bagged support vector regression (BSVR). A study conducted between March 2018 and May 2022 demonstrates that the use of the sentiment index significantly enhances the predictive accuracy of the BSVR. The model that has been modified with an autonomous feature selection demonstrates superior performance compared to other advanced methodologies in predicting bitcoin prices over a 30-day period.
As such, this section stands testament to the heterogenous nature of the cryptocurrencies price prediction field. Great research has been done up to this point and considerable advancements have been made, but a consistent structure has not been established yet. The analyzed literature presents a varied landscape of cryptocurrency research, focusing on mining sustainability, portfolio risk-return assessments, market efficiency, and predictive modeling, among others. The gap identified is the limited exploration of frameworks that integrate social media sentiment, on-chain metrics, and artificial intelligence for cryptocurrency analysis. While existing studies offer insights into specific aspects of cryptocurrencies, such as legal frameworks or investment strategies, there’s a notable absence of comprehensive models that leverage digital sentiment alongside traditional metrics. The existing body of research on cryptocurrency dynamics has primarily focused on specific aspects like investment drivers, systemic risk, and digital forensics, yet there is a noticeable gap in comprehensive frameworks that integrate social media analytics for predictive and prescriptive analysis. This paper introduces the Descriptive-Predictive–Prescriptive framework, a novel approach designed to bridge this gap by leveraging data science and socio-economic analysis to offer a multifaceted understanding of cryptocurrency market trends and their relationship with social media discourse. Unlike existing models, the DPP framework aims to provide actionable insights for stakeholders by analyzing a wide array of data sources, including blockchain data, price fluctuations, and social media sentiment, to navigate the volatile cryptocurrency market.
While the cryptocurrency market’s growth and its impact on the global financial landscape are undeniable, there remains a critical need for analytical models that can effectively interpret the nuanced interplay between digital currencies and social media trends. The literature review reveals efforts in various niche areas, but lacks a comprehensive framework that addresses the multifaceted nature of cryptocurrency dynamics. By introducing the DPP framework, this study seeks to fill this gap, offering a methodological advancement in the predictive and prescriptive analysis of cryptocurrencies. The DPP framework addresses this by proposing a holistic approach to understanding cryptocurrency dynamics, filling a critical gap in current research by blending advanced analytics with socio-economic factors, a perspective less explored in the literature. As such, the framework introduced in this paper aims to address this issue and become a cornerstone for the field of study and for interested stakeholders. The DPP framework’s integration of big data analytics and natural language processing to analyze unstructured social media data represents a significant contribution to the field, potentially revolutionizing decision-making processes for investors, regulators, and other stakeholders.
2. Materials and Methods
2.1. Framework Overview
The development of a Descriptive-Predictive–Prescriptive framework for the social media-cryptocurrency relationship has substantial academic and industrial importance. From an academic standpoint, this framework offers a structured way to understand and model a complicated task, with prospects for additional inquiry and development. This adds to the body of knowledge and establishes the groundwork for future research. The development of the framework was motivated by the increasing prominence of cryptocurrencies within the financial ecosystem and the notable influence of social media on public perception of these digital assets. The recognition of the limitations of conventional financial metrics in comprehending the dynamics of the cryptocurrency market grew progressively apparent. Traditional financial metrics often fall short in capturing the dynamic and multifaceted nature of the cryptocurrency market, a gap the DPP framework aims to fill. The complex and multifaceted nature of the cryptocurrency industry, which has been enhanced by the emergence of decentralized finance, tokenomics, and widespread global involvement, has called for a comprehensive and all-encompassing approach. The purpose of this framework is two-fold: Scientific Exploration, and Practical Implications. The aim of this study is to establish a systematic approach for researchers to effectively navigate the intricate terrain of the cryptocurrency market. The framework seeks to establish a systematic procedure, with a series of sequential steps, to bring uniformity to the investigation of this emerging discipline and provide a model that can be reproduced in subsequent research endeavors. In addition to its application in academic research, this framework has been designed with consideration for financial analysts, individuals interested in cryptocurrency, and prospective investors. The primary objective of its design is to provide practical and applicable insights, thereby facilitating well-informed decision-making within a frequently unpredictable market environment. The framework facilitates the connection between raw data and insightful analysis by incorporating data analytics tools. The purpose of this instrument is to act as a medium through which large quantities of unorganized data from diverse origins are converted into a structured format, thereby establishing the foundation for subsequent comprehensive analysis. The following sections will provide a more detailed analysis of each pillar and step of the framework, explaining the methodologies utilized, the reasoning behind each choice, and the consequences of the findings obtained. The establishment of a precise mathematical framework for describing each component enables the attainment of consistency, repeatability, and clarity in the processing and analysis of various data sets. The purpose of this framework is to effectively manage the intricacies of data, providing a structured approach to convert unprocessed information into valuable strategic insights. While the framework was developed with a sequential nature, in a practical scenario multiple steps could be run in parallel. Emphasizing flexibility, the DPP framework is designed to adapt to the fast-evolving landscape of the cryptocurrency market. It transcends a purely sequential approach, allowing for parallel processes that can adjust in real-time to new information and market trends. For instance, a continuous data pipeline can facilitate the real-time collection and analysis of data, while adaptive modeling techniques ensure the application of the most effective predictive models. This adaptability underscores the framework’s practical utility, enabling users to derive prescriptive analysis on-demand.
To better visualize the DPP Framework, Figure 1 presents a high-level perspective of the proposed approach.
2.2. Data Collection and Preprocessing
The fundamental essence of any analytical framework resides in the caliber and quality of the data it analyzes. In the context of the ever-evolving relationship between social media and cryptocurrencies, the acquisition of precise, thorough, and current data assumes utmost importance. There are multiple data sources the framework accounts for: Historical Price Records, On-chain data, and Social Media Sentiment. By utilizing publicly accessible databases such as CoinMarketCap, CryptoCompare, and proprietary financial data platforms, the framework acquires comprehensive historical price data. The dataset encompasses the opening, closing, high, low prices, and trading volume, which are fundamental components for comprehending the historical volatility and market trends. On-chain metrics, such as transaction volumes, active addresses, and token circulation, offer insights into the internal mechanisms of a blockchain. Platforms such as Glassnode and Nansen have emerged as highly valuable resources for accessing on-chain data, which enables the identification of various patterns including the activities of large-scale investors or trends related to token accumulation or disposal, among others. By integrating on-chain data, the framework seeks to account for the specific complexities of the cryptocurrency field, further increasing its robustness and predictive capabilities. Furthermore, the framework examines content sourced from prominent social media platforms such as X (ex-Twitter), Reddit, and specialized forums like Bitcointalk, to gain insights into the sentiments and opinions prevalent within the cryptocurrency community. The framework assesses the dominant sentiment and potential market-influencing narratives by analyzing the frequency, sentiment, and engagement metrics of discussions pertaining to cryptocurrencies of interest. In the following sections, an abstraction of the DPP framework will be presented. While the presented methods can produce an oversimplification of the complex nature of the cryptocurrency dynamics, it serves as a starting point to deconstruct and better understand the complex phenomenon that drive these assets. The value of such a process should not be underestimated, as it serves the purpose of simplifying a complex process, with the aim to gain a better understating and develop robust systems that can better explain said systems. As such, the mathematical formalization for data collection is the following:
Let D = {D1, D2, …, Dn} be a collection of data sources, where each Di can represent a source such as social media sentiment, historical price data, or on-chain metrics.
For data preprocessing, several steps are taken: Cleaning, excluding any atypical data points, outliers, or erroneous entries that may introduce bias into the analysis; Normalization, the process of standardizing the data to achieve a consistent scale for all metrics, which is imperative for the optimal functioning of machine learning models; Time-Series Decomposition, the process of extracting seasonal components, particularly in the data related to prices and social media engagement, is beneficial for separating authentic trends from recurring fluctuations; and Sentiment Analysis, preprocessing of unstructured social media content encompasses various tasks such as tokenization, removal of stop words, and stemming. This process facilitates the transformation of textual data into a format that enables more precise application of sentiment analysis. The framework guarantees a rigorous methodology for gathering and preparing data, thereby establishing a strong basis for subsequent stages of analysis that are characterized by precision and depth of understanding. The mathematical formalizations for data preprocessing are the following:
Given raw data Di, preprocessing is a composite function Fp:
where: fc is the cleaning function, fn is the normalization function, and ft is the transformation function. For a time-series dataset T, the descriptive analytics function Ad extracts patterns P:
Sentiment analysis is applied to social media data SM to derive sentiment scores C using the function SA:
2.3. Exploratory Data Analysis
Exploratory Data Analysis (EDA) serves as a fundamental stage within the analytical process, facilitating the transition from unprocessed data to valuable insights. The preliminary analysis offers an initial comprehension of the characteristics of the data and establishes the foundation for subsequent study. Within the framework of the interplay between social media and cryptocurrencies, EDA serves as a valuable tool for identifying and understanding the fundamental patterns and structures that have the potential to impact the dynamics of cryptocurrency prices.
Two main approaches are employed in the framework: Univariate Analysis, and Multivariate Analysis. For Univariate Analysis, each variable within the dataset is evaluated independently, including price fluctuations, sentiment scores, and on-chain metrics. This aids in comprehending the distribution of the data, identifying any deviation from symmetry, and recognizing possible extreme values that could impact the outcomes. For Multivariate Analysis, it represents gaining a comprehensive understanding of the relationships between variables. Through the process of comparing, such as examining the relationship between social media sentiment scores and price fluctuations, it is possible to identify whether a significant correlation exists.
To conduct EDA, data visualization is employed. Two main techniques are used, Time-Series Plots and Heatmaps. Through the graphical representation of the price of a cryptocurrency in conjunction with notable occurrences or fluctuations in social media sentiment, it becomes possible to visually discern potential correlations. Heatmaps can be employed as a visual tool to effectively depict the correlation matrix, facilitating the prompt identification of variables that exert the greatest influence on cryptocurrency prices. As such, the correlation matrix assumes a central role in the proposed framework. Nevertheless, it is important to note that correlation does not necessarily indicate causation. Although the matrix can provide indications of relationships, additional testing such as Granger causality tests can be employed to determine whether one variable truly precedes and potentially exerts influence on another.
Univariate analysis involves examining the distribution and summary statistics of individual variables. This can include calculations of central tendency (mean, median, mode) and dispersion (variance, standard deviation, range, interquartile range). For a variable X, the univariate analysis may also include skewness and kurtosis assessments:
Histograms, box plots, and density plots are common visualizations used to represent the distribution of X.
Multivariate analysis examines the relationships between multiple variables simultaneously. This includes the following techniques: Principal Component Analysis (PCA), Cluster Analysis, and Multivariate Regression. PCA is technique used to reduce the dimensionality of the data set by transforming to a new set of variables (principal components) that are uncorrelated and which capture the maximum amount of variance. Cluster Analysis is a method that groups a set of objects in such a way that objects in the same group (called a cluster) are more similar to each other than to those in other groups (clusters). Multivariate Regression is an extension of linear regression that models the linear relationship between a dependent variable and multiple independent variables. For example, in PCA, the first principal component is given by the linear combination of variables that maximizes variance:
where wi are the weights obtained from the eigenvectors of the covariance matrix of X. In multivariate regression, the model is:
where Y is the dependent variable, Xi are the independent variables, βi are the coefficients, and ε is the error term.
One of the notable advantages of EDA is its ability to facilitate comprehension of the data, while also serving as a catalyst for the development of novel features that may possess greater relevance for predictive models. For example, if there exists a consistent temporal delay between an upsurge in sentiment on social media and a subsequent change in price, it is possible to develop a novel attribute that captures this delay. Upon the conclusion of the EDA phase, the framework attains a comprehensive comprehension of the dataset’s structure, potential deficiencies, and the fundamental interconnections among variables. By ensuring that subsequent modeling and analysis are conducted using comprehensively understood and appropriately processed data, the likelihood of obtaining valuable insights is greatly increased. The mathematical formalizations for statistical measures and visualization are the following:
Define µX and σX as the mean and standard deviation of a variable X, respectively. The Z-score for an observation x is given by:
Correlation matrix visualization is defined as:
where ρ calculates the Pearson correlation coefficients between variables.
2.4. Predictive Modeling
Predictive modeling utilizes statistical methodologies to make projections about future occurrences. Within the established framework, the objective is to make predictions about forthcoming cryptocurrency prices. To achieve this, various input variables are considered such as social media sentiment, historical price data, and on-chain metrics. The ability to make precise predictions has the potential to enhance investment decision-making and deepen the comprehension of the complex relationship between social media dynamics and cryptocurrency markets.
Before modeling, some considerations must be considered. This step is concerned with the segmentation of data. First, the Feature Selection step is put in place. Not all features or variables within a dataset possess equal value. The presence of redundant or irrelevant features has the potential to introduce noise into the data. Methods such as recursive feature elimination, mutual information scores, and correlation matrices can be employed to discern and retain solely those features that make the greatest contribution to predictive accuracy. After the important features have been selected, the data must be split for the model training step. To effectively assess the performance of the model, it is necessary to partition the data into distinct sets for training, validation, and testing purposes. The training set facilitates the acquisition of knowledge by the model, the validation set aids in the optimization of hyperparameters, and the test set provides a comprehensive assessment of the model’s performance. Feature selection is denoted with ϕ, which maps the full feature set F to a reduced set Fimp to maximize model performance:
Regarding the model selection, there are plenty of options that must be accounted for: Time-Series Forecasting Models, considering the dynamic nature of cryptocurrency prices, it is advantageous to employ models such as ARIMA and Prophet, due to their suitability in this context; Regression Models, linear regression, ridge regression, and lasso regression are commonly employed techniques for examining the association between independent variables and the dependent variable representing cryptocurrency prices; Tree-Based Models, decision trees, random forests, and gradient-boosted trees are machine learning algorithms that are effective in capturing complex and non-linear relationships as well as intricate patterns within datasets; Neural Networks, particularly deep architectures, can be investigated due to their capacity to represent intricate relationships. For the proposed framework, an LSTM model is recommended, which is a Deep Neural Network that has displayed increased performance in Time-Series Forecasting tasks, as presented in the Literature Review section. Future iterations of the framework can explore the use of other models. A predictive model M is selected from a set of candidate models Mpred based on a scoring function σ that assesses predictive accuracy on a validation set V:
After the model selection step, the hyperparameter tuning step must be considered. Models frequently possess parameters that require adjustment to achieve optimal performance. GridSearch and RandomSearch are two systematic methodologies used to explore and evaluate different combinations of parameters. The first iteration of the framework employs GridSearch, but to achieve further optimization, it is possible to utilize more advanced techniques such as Bayesian optimization or genetic algorithms, as these methods have demonstrated superior efficiency in converging towards optimal parameter values. The learning function L is used to fit the model M on the training set T using the selected features Fimp:
To rigorously assess model performance and ensure the robustness and reliability of predictions, implementing a comprehensive evaluation framework is crucial. The efficacy of the DPP Framework, especially within the complex interplay between social media and cryptocurrencies, necessitates robust metrics that accurately capture the nuances of predictive model performance. Consequently, Root Mean Square Error (RMSE), Mean Absolute Error (MAE), and Mean Absolute Percentage Error (MAPE) have been selected as evaluation metrics, based on their widespread recognition and proven effectiveness in predictive modeling, rather than their specific applicability to the cryptocurrency domain. These metrics provide a multifaceted perspective on error measurement, allowing for an in-depth understanding of model performance. RMSE quantifies the average magnitude of prediction errors, placing greater penalties on larger discrepancies, thereby offering insight into the overall error magnitude. MAE presents an intuitive measure of the average absolute disparity between predicted outcomes and actual values. In contrast, MAPE expresses errors as a percentage of actual values, facilitating a comparison of performance across different data scales by providing a relative measure of error.
To affirm the validity and reliability of predictive models, the implications of these metrics for model performance are thoroughly examined. Lower values indicate predictions are in closer alignment with actual outcomes, signaling higher model quality. Acknowledging the limitations and potential biases of relying solely on one metric, a composite evaluation of all three metrics is advocated. This holistic approach ensures a thorough assessment of model performance, considering various error types and their impacts on prediction quality. Such a strategy underscores the importance of a balanced evaluation to guide the selection of the best-performing model.
Going forward, researchers are encouraged to either explore alternative metrics or develop new ones specifically tailored to the dynamics of social media and cryptocurrency interactions. This pursuit could refine the understanding of model performance in this domain, potentially revealing deeper insights into predictive dynamics.
By anchoring the evaluation in these metrics, the analysis not only adheres to established methodological standards, but also contributes to the discourse on predictive model reliability and accuracy in the fast-evolving cryptocurrency research field. The values presented by these metrics will be used to guide the selection of the best performing model, with smaller values representing better performance. The formulas for RMSE (13), MAE (14), and MAPE (15) are presented below.
where yi are the actual values and are the predicted values.
The field of predictive modeling is not devoid of its inherent challenges. Overfitting is a prevalent issue in machine learning, characterized by a model exhibiting exceptional performance on the training data but performing poorly on unseen data. The implementation of appropriate evaluation techniques and the adoption of model simplicity can effectively address this issue. Additionally, the dynamic characteristics of financial data, which entail the alteration of statistical properties over time, can present difficulties. Regular retraining of models may be necessary to maintain their relevance. Predictive modeling plays a central role in this framework by converting raw data and insights obtained from EDA into practical predictions regarding future cryptocurrency prices. The efficacy and precision of this step have a direct impact on the prescriptive recommendations formulated in the following stages.
2.5. Prescriptive Analysis and Decision Making
Prescriptive analysis represents the final stage of the framework, where insights obtained from the descriptive and predictive phases are combined to produce practical recommendations. The provided framework presents a strategic guide for stakeholders to make well-informed decisions through the evaluation of potential outcomes associated with different strategies, utilizing projected data trends. For a successful prescriptive analysis, three main components are integrated: Scenario Analysis, Optimization Strategies, and Risk Assessment.
By employing the results of the predictive model to simulate a range of future scenarios, one can formulate hypotheses regarding potential outcomes. For example, one could anticipate the consequences of an abrupt increase in unfavorable sentiment expressed on social media towards a specific cryptocurrency and evaluate its potential effects on the market value in the upcoming days. This action represents the Scenario Analysis. For Optimization Strategies, algorithms are utilized to identify the optimal course of action. Considering specific forecasts, what course of action would be most advantageous for an investor? What is the recommended course of action for individuals regarding purchasing, selling, or retaining a specific cryptocurrency? These strategies can also be employed to optimize timing. Lastly, for Risk Assessment, it is crucial to comprehend the potential risks linked to each decision. Investors can make decisions in accordance with their risk tolerance by assessing potential drawbacks and uncertainties associated with predictions. For formalization purposes, given a set of possible future states S, scenario analysis Σ generates potential outcomes O:
Optimization of investment strategies A is a function Ω that maximizes expected return R while minimizing risk ρ:
Expanding the knowledge provided in the previous step, the framework looks to also integrate external knowledge. The invaluable nature of qualitative insights provided by experienced experts in the cryptocurrency market is widely recognized. These professionals possess the ability to provide contextual information to data, particularly in situations where historical patterns may not accurately forecast future outcomes. Additionally, cryptocurrency operates within a constantly evolving regulatory framework. Therefore, it is imperative for any prescriptive analysis to consider and incorporate potential regulatory modifications. For formalization purposes, the risk quantification function R maps a strategy A to its associated risk profile Rp:
where Dhist represents historical data that is used for risk quantification.
One crucial element of prescriptive analysis involves the incorporation of feedback loops. It is essential to incorporate the feedback derived from the implementation of recommendations back into the model. The utilization of an iterative process facilitates the ongoing enhancement of strategies through the analysis of empirical outcomes, thereby ensuring the model’s pertinence and ability to adjust to evolving market dynamics. The framework provides two practices for an effective feedback process: Performance Tracking and Iterative Refinement. For Performance Tracking, after making a decision, it becomes crucial to track the outcomes. The effectiveness of the framework can be assessed by evaluating the accuracy of the predictions and the extent to which the prescribed strategies produced the desired outcomes. Regarding Iterative Refinement, by incorporating feedback from real-world results, the framework can be continuously refined to improve its accuracy and applicability. The performance tracking and iterative refinement process is formalized as a feedback function Ψ:
where Θ is the iterative refinement based on new data Dnew.
As such, by implementing all the steps presented up to this point, the DPP framework enables the implementation of Real-time Contextual Decision-making. This feat can be achieved by establishing real-time Data Streams and developing Automated Trading Bots. The inherent volatility exhibited by cryptocurrency markets necessitates the utilization of real-time data as an essential component. The utilization of the framework in near real-time scenarios has the potential to enhance decision-making processes by enabling more prompt and efficient outcomes. Therefore, the direct integration of the prescriptive phase with automated trading systems could potentially yield advantages for high-frequency traders. According to the guidelines provided by the framework, these automated systems have the capability to carry out purchase and sale transactions, with the aim of maximizing financial gains.
However, there are some challenges and limitations that Prescriptive Analysis encounters. The nature of a highly dynamic environment that is attributable to the cryptocurrency market exhibits high levels of volatility and is subject to the influence of various external factors, ranging from regulatory modifications to macroeconomic occurrences. To combat this volatility, regular updates are necessary. Another shortcoming is represented with Bias and Over-reliance. An excessive dependence on prescriptive analytics could develop, thereby neglecting the incorporation of human intuition and expertise. It is imperative to maintain a harmonious equilibrium between recommendations generated by machines and the discernment of experts.
Prescriptive analysis is the stage at which practical implementation takes place. The process converts acquired knowledge and forecasts into practical measures with the objective of attaining specific objectives, such as maximizing profits, minimizing risks, or a combination of both. The key to achieving success in the dynamic field of cryptocurrency investments lies in the assurance of actionable, realistic, and consistently updated prescriptions, which are responsive to real-world feedback. The prescriptive analysis phase is of utmost significance as it serves as the intermediary that links theoretical insights with practical actions. The framework can become an invaluable asset for cryptocurrency investors by adopting a continuously refined and multi-dimensional approach that accounts for external inputs, regulatory intricacies, and real-time data.
Therefore, it can be observed that the DPP framework can be a powerful decision-making tool for industry practitioners, particularly those interested in cryptocurrency investments. Stakeholders can acquire priceless insights into market patterns, accurately predict future market movements, and design robust plans by leveraging social media sentiment, historical price data, on-chain data, and other data sources. The framework’s ability to drive strategic decisions emphasizes its practical utility in a fast-paced and changing digital economy. The framework formalization presented in this section offers a comprehensive summary for the systematic analysis of data, facilitating a comprehension of underlying patterns and relationships. The essence of a data-driven strategy is encapsulated by systematically traveling through the steps of collecting, preprocessing, analytics, predictive modeling, and concluding in prescriptive analysis and decision-making. The use of this systematic approach facilitates the process of making well-informed decisions, allowing stakeholders to effectively utilize their data resources and adjust flexibly in a constantly evolving data environment.
2.6. Potential Improvements
Although the existing framework offers a comprehensive and methodical approach to examining the complex correlation between social media sentiment and cryptocurrency trends, there is still potential for further enhancement. The field of data science is characterized by its rapid evolution, consistently introducing novel techniques and methodologies that have the potential to improve prediction accuracy and facilitate more profound insights. Recognizing the necessity to evolve beyond conventional analytics and embrace a more nuanced and adaptable approach, several enhancements are proposed to address the intricacies of predictive modeling and the framework’s flexibility. This section provides further details on potential enhancements and advanced methodologies that can be integrated into the framework.
To mitigate the risk of oversimplification and enhance the framework’s depth, integrating diverse data sources such as real-time news and specialized cryptocurrency communities is essential. Going forward, the framework could incorporate alternative data sources, like News or Cryptocurrency Communities. The utilization of real-time news data has the potential to provide valuable insights into abrupt fluctuations within the market. The utilization of Natural Language Processing in the automated analysis of news articles can offer a supplementary dimension of sentiment analysis. Online platforms such as Bitcointalk have the potential to serve as valuable sources of user sentiment and speculative discourse, potentially exerting an influence on price fluctuations. These additions will allow for a more dynamic reflection of market shifts and sentiments, addressing potential biases inherent in social media data.
Beyond the additional data sources, the model complexity could be enhanced. Ensemble methods, as opposed to relying solely on a singular model, employ the aggregation of predictions from multiple models to enhance accuracy. Various techniques such as boosting, bagging, and stacking may be considered. Additionally, transfer learning is a technique that can be employed when there is a scarcity of data for a particular cryptocurrency. It involves the utilization of models that have been trained on data from one cryptocurrency to be further refined and adapted for another cryptocurrency. This approach takes advantage of the common patterns and similarities that exist between different cryptocurrencies. Regarding the Neural Networks, Attention mechanisms have been found to be particularly effective for sequence data, such as time series. By enabling models to selectively focus on the most influential parts of the input data, attention mechanisms have the potential to enhance predictive accuracy.
To address concerns regarding the quality and reliability of input data, advanced hyperparameter tuning methods like Bayesian Optimization and Neural Architecture Search (NAS) can optimize model performance efficiently. Regarding Hyperparameter tuning and model selection, superior techniques could be employed. In addition to GridSearch and RandomSearch, Bayesian Optimization offers a more efficient approach to searching for optimal hyperparameters by constructing a probabilistic model of the objective function. With the existence of numerous potential architectures, NAS has the capability to identify models that are specifically customized to the dataset under consideration. These methods provide a systematic approach to selecting the most effective model architectures and parameters, reducing the risk of overfitting through intelligent model selection and regularization strategies.
Acknowledging the critical role of human expertise in interpreting model outcomes, advancements could also be brought to the prescriptive analysis step. These improvements could focus on expanding on Feedback Mechanisms. Within the domain of decision-making, Reinforcement Learning (RL) can be employed to acquire optimal strategies through active engagement with the environment. For example, an RL agent can be trained to engage in buying and selling actions by utilizing reward signals derived from investment outcomes. Additionally, active learning techniques can be employed to selectively query the most informative data points, thereby enhancing the efficiency of model refinement as new data becomes accessible. These techniques allow the model to learn from interactions with the market and adapt strategies based on investment outcomes, enhancing decision-making processes with a focus on achieving optimal results. To ensure the framework’s practical applicability, it is paramount to incorporate considerations for regulatory changes and legal risks into the prescriptive analysis. This can be achieved by designing the model to be flexible and responsive to regulatory updates, ensuring that predictive and prescriptive outputs remain aligned with current legal standards and market conditions.
While these enhancements promise to elevate the framework’s capabilities, it is crucial to balance advanced techniques with computational efficiency and model simplicity. If the framework is to be employed as an end-to-end system, some considerations must be accounted for. Certain advanced techniques, such as NAS or deep ensemble methods, can impose a significant computational burden and necessitate substantial hardware resources. Another risk that must be considered is overfitting, which increases as the complexity of the model increases. The implementation of robust validation techniques and the regularization of models are of utmost importance. Strategies to mitigate overfitting and ensure robust validation are essential, maintaining the framework’s relevance and applicability in real-world scenarios.
While the initial DPP framework provides a fundamental approach to comprehending the interplay between social media and cryptocurrencies, these advanced techniques signify the forthcoming frontier. By consistently incorporating these advancements, the framework can sustain its position at the forefront of the field, providing more refined observations and enhanced predictive capabilities.
3. Results
While not in its entirety, an incipient iteration of the framework has been implemented to forecast the spot market electricity price in a disruptive economic and geopolitical context [27]. The study investigates the application of a LSTM model within a Recurrent Neural Network framework for the purpose of short-term Electricity Price Forecasting (EPF). In this paper, the authors present a novel algorithm that carefully selects input variables and optimizes hyperparameters, comparing the proposed model with the well-established eXtreme Gradient Boosting (XGB) method. The analysis specifically focuses on the fluctuations in prices during significant periods, namely the COVID-19 pandemic and the Ukrainian conflict. In contrast to previous studies that have primarily focused on well-established Western and Nordic electricity Day Ahead Markets (DAM), the present study specifically examines the electricity market in Romania, which closely adheres to the electricity DAM protocols set forth by the European Union. The research involves the curation of an extensive dataset covering the period from January 2019 to August 2022. Additionally, the authors have developed a novel algorithm that is specifically designed to identify the most suitable stacked LSTM architecture for complex short-term Event-Related Potentials (ERPs). The algorithm in question identifies significant variables by applying correlation thresholds and combines three crucial parameters-hidden layer size, dropout, and learning rate-to produce enhanced EPF results.
The novel approach proposed by this article is a previous version of the DPP framework introduced in the present paper, which was not yet fully developed. However, its implementation proved an increased performance over an established technique, XGB, and displayed promising results for further development. For the various experiments run in the paper, the proposed approach reported a MAE between 0.0155–0.0509, with a maximum of up to 243% improvement over XGB for the hourly dataset. As such, a previous version of the DPP model has already been employed, and it has displayed improvements over popular techniques.
To demonstrate the proficiency of the DPP framework, an example experiment was conducted for this paper. A dataset of 365 daily observations, from 1 July 2021 to 30 June 2022, composed of Bitcoin price, on-chain data, and Twitter data was constructed. The sample, both the period and size, are not highly relevant. The dataset was selected just to provide an example of the expected improvements of DPP framework. The data was collected from CoinMarketCap for Bitcoin price information, Glassnode for on-chain data, and X (formerly known as Twitter) for social media data. The sentiment of the tweets was extracted using a Logistic Regression classifier model with a reported f1-score of 0.79 on a public twitter dataset from Kaggle. All the data and code used to conduct the experiment are hosted on a public repository at: https://github.com/Emposes/DPP_Framework (accessed on 12 February 2024).
After the dataset was constructed, data preprocessing and analysis were performed. The dataset is clean, with no missing data. All the data are numerical, and they were scaled using the z-score method. For univariate analysis, various methods were employed, like plotting the distribution and the boxplots for the variables. An example is given in Figure 2.
For the example in Figure 2, the variables under investigation, namely Price, Active Addresses, Tweets Volume, and Tweets Sentiment, were represented graphically through histograms and boxplots to gain insights into their distribution patterns and measures of central tendency. The histogram representing the distribution of Price exhibits a predominantly normal pattern, with a minor leftward skewness suggesting a clustering of values below the mean. The boxplot demonstrates a median that is roughly aligned with the zero mark, indicating a central tendency. The box margins are symmetrical, suggesting a uniform distribution of data around the median. Additionally, there are many outliers on the higher end, indicating the presence of a few occurrences with much higher prices.
The distribution of Active Addresses, as depicted by the histogram, exhibits characteristics of a nearly normal distribution with a minor right skew. The boxplot does not provide information regarding the existence of outliers. It does, however, display a median somewhat greater than zero, suggesting that most of the data points are concentrated around the mean, exhibiting a symmetrical distribution on both sides. The histogram representing the volume of tweets exhibits a distribution that is skewed to the right, indicating that most of the data are clustered towards the lower values, while a smaller proportion of the data is spread out towards the higher values. The boxplot provides support for this claim by displaying a median value that is below zero, as well as the presence of outliers that suggest sporadic instances of high tweet volumes. The portrayal of sentiment in tweets is also represented by a histogram that has a right-skewed distribution, indicating a higher frequency of lower sentiment ratings. The boxplot displays a median value that is slightly positive, and the existence of outliers at both ends indicates infrequent occurrences of extreme feelings throughout the dataset. Next, the multivariate analysis was conducted by computing the correlation matrix and generating a heatmap, shown in Figure 3.
The correlation study was performed to investigate the linear associations among a diverse range of factors relevant to the dynamics of cryptocurrencies. The heatmap visually represents the differing degrees of correlation observed across distinct pairs of variables. It must be noted that the correlations identified prior do not conclude the existence of causality. As previously mentioned, causality tests could be employed to further study the relationship between data. This section is given as example to the potential insights that the DPP framework could provide to future users.
The relationship between market sentiment and social media activity suggests a favorable association between the volume of tweets and various indices of market activity, including active addresses, sending addresses, and receiving addresses. This implies that there may be a correlation between higher social media engagement and heightened transactional activity on the platform. Metrics pertaining to the movement of assets across exchanges, such as Exchange Inflow Volume and Exchange Outflow Volume, have significant associations with market capitalization and price, suggesting the potential impact of exchange dynamics on market valuation.
There exists a notable association between variables such as Bitcoin Fund Holdings and Purpose Bitcoin ETF Holdings, and market value indicators such as Market Cap. This suggests that institutional investments have a substantial influence on overall market capitalization. The relationship between network health and mining can be observed through the Hash Rate, which serves as a measure of the network’s computational capacity. This metric exhibits correlations with block metrics, implying a connection between network security and mining activity. The presence of certain metrics, such as Supply Last Active 1+ Year Ago, which indicate long-term holding, demonstrates a negative association with various volatility indicators. This suggests that long-term holding has a stabilizing impact on market volatility.
The analysis conducted yielded noteworthy correlations between bitcoin price and other elements, highlighting the interrelationships between these factors and price fluctuations. The market capitalization exhibits a strong positive correlation (r = 0.999841) with the price, indicating that when the market capitalization increases, the price tends to closely follow suit. This relationship is in line with expectations, as market capitalization is influenced by both price and circulating supply. The MVRV (Market Value to Realized Value) metric exhibits a robust positive association (r = 0.945733), implying that elevated MVRV ratios, indicative of market premiums, frequently coincide with upward movements in prices. The connection between the Market Cap to Thermocap Ratio and price is highly significant (r = 0.928591), indicating a strong positive relationship. This ratio is commonly employed to detect market highs and lows, as it exhibits parallel movements with price, hence potentially indicating instances of over- or undervaluation.
The Net Unrealized Profit/Loss (NUPL) metric demonstrates a significant positive correlation (r = 0.899086), indicating a close alignment between the extent of unrealized profit or loss in the market and price fluctuations. The findings indicate that there exists a moderate positive connection (r = 0.654808 and r = 0.570188) between inter-exchange transfers and Bitcoin fund holdings, suggesting that an increase in asset transfers between exchanges and accumulation by funds may be linked to the appreciation of Bitcoin’s price. The metrics pertaining to on-chain activities, such as SOPR, address activity (Active Addresses, Receiving Addresses), and New Addresses, exhibit moderate to low positive correlations (with correlation coefficients ranging from 0.513680 to 0.238624). These correlations suggest a connection between network activity and price, although the strength of this relationship is weaker compared to the financial indicators.
The analysis of Tweets Sentiment reveals a significantly weak negative correlation (r = −0.019029), indicating that there is minimal to no linear association between the overall sentiment expressed on social media regarding the cryptocurrency and its price. The analysis of MSOL and Transfer Volume Metrics reveals mild negative correlations (ranging from r = −0.098113 to r = −0.119308). These findings suggest that there is no statistically significant linear link between these supply and transfer volume metrics and price changes. Several factors exhibited weak or negligible associations with price.
There are some elements that exhibit significant negative correlations with price, which may be of particular significance in comprehending market dynamics. It is worth mentioning that there exists a significant negative correlation (r = −0.655136) between the increase in Supply Last Active 1+ Years Ago and price. This implies that retaining assets for a longer period may be linked to lower prices. This observation could potentially indicate reduced market liquidity or selling pressure. The data reveal a significant negative correlation (r = −0.515925) between the number of addresses above 10,000 and the block height. Similarly, a substantial negative correlation (r = −0.476777) is shown between blockchain growth milestones and price losses. These findings suggest that specific thresholds of address concentration or significant advancements in blockchain development may align with decreases in cryptocurrency prices. The Supply Dynamics study reveals that there is a large negative association between the Supply Last Active 3+ Years Ago (r = −0.532824) and UTXO Total (r = −0.573622) variables with price. This indicates that during periods of lower prices, there is a higher prevalence of increased supply age and unspent transaction outputs.
The magnitude and orientation of these correlations offer valuable information that may be of interest to investors, traders, and researchers seeking to comprehend the determinants that impact price fluctuations within the bitcoin market. After the EDA step, a Logistic Regression baseline model was trained. To assess the performance of the model, the data were split into a train set and a test set. The test set serves as out of sample data, to benchmark the performance on never-before-seen data. A standard 80–20 split was used, selecting the first 80% datapoints for training and the remaining 20% for testing. The baseline model used only price data, predicting next day price and only using today’s price. RMSE and MAE were used as metrics. The performance of the baseline model is the following: RMSE, 1352.25, and MAE, 1011.78. The RMSE value represents the standard deviation of the residuals, which are the prediction errors. A lower RMSE value is preferable, as it indicates a closer fit to the data. In the context of the baseline model, it provides a starting point for model refinement. Unlike the RMSE, the MAE provides a linear score that averages the absolute differences between predicted and actual values. This gives a direct interpretation of how much, on average, the predictions deviate from the actual prices. The performance achieved by both approaches is presented in Table 1.
For this example, a simple model was used to improve the baseline. While a LSTM model is recommended, for the purpose of this example the Ridge Regression was selected to be applied within the DPP framework, as hyperparameter tuning can be performed on the ‘alpha’ parameter, GridSearch can be performed, and its simplicity can better demonstrate the efficiency of the DPP. This hyperparameter tuning technique will be applied for this experiment. No other enhancements were performed on the model. For a simplified approach, such as the one presented in this paper, similar to a proof of concept with few datapoints, a simple regression will suffice. However, for a real-world example where hundreds of thousands or even millions of data points can be collected to construct a dataset, a simple regression approach could prove limiting. These limitations are especially true given the non-linear relationships that are present in the data. As such, a deep learning model, like the LSTM, is recommended for the real-world application of the DPP framework, as it would generate a better performing predictor. The Pearson Correlation thresholds used ranged from 0.95 to 0.4, with a step of 0.05. The threshold serves as a feature importance proxy, using only a slice of the variables to train the model. The same data set split of 80–20 was applied to construct the train and test data sets, to correctly assess the performance of the model and limit overfitting as much as possible. The reported performance of the improved model is the following: RMSE, 1305.73, and MAE, 965.30. The RMSE reduction by 46.52 units indicates a more accurate fit to the observed data, suggesting that the enhancements made to the model were effective in capturing the underlying price movements more precisely. The MAE score is lower than the baseline model’s MAE by 46.5 units. This improvement further confirms that the average magnitude of the errors in price predictions has been reduced, hence enhancing the model’s reliability. The Residual vs. Actual Figures for both models are presented below in Figure 4 and Figure 5.
The observed enhancements in the RMSE and MAE of the proposed model indicate that the modifications and optimizations implemented to the predictive variables and algorithmic methodology have yielded a favorable outcome. The improvements have resulted in a model that not only exhibits a higher degree of conformity with the historical data, but also diminishes the mean discrepancy in the prognostications. This is of great importance for stakeholders who rely on precise forecasts to inform their decision-making processes.
4. Discussion
To continue the example and provide insight on how the DPP Framework could be applied, assume a stakeholder is tasked with overseeing an investment portfolio, with the objective of maximizing returns on bitcoin assets while effectively mitigating risk exposure. Based on the outcomes generated by the enhanced predictive model, it is projected that the value of a specific cryptocurrency will likely see an upward trend. This projection is mostly based on the observed concurrent rise in active addresses.
Prescriptive analysis refers to the analytical process that utilizes data and statistical models to provide recommendations and guidance for decision-making. Based on the provided forecast, the prescriptive analysis would entail the execution of the following sequential procedures: Investment Allocation Risk Mitigation, and Liquidity Analysis.
Investment Allocation seeks to enhance the investment allocation towards the cryptocurrency projected to see appreciation. The rationale behind this decision is derived from the model’s forecast of a rise in prices, indicating a possibly advantageous prospect for financial gain. To manage risk, it may be advisable to employ a stop-loss order at a price marginally lower than the prevailing market price, thereby safeguarding the investment against unforeseen declines. The model recommends assessing liquidity parameters, such as quantities of inflows and outflows in exchanges, to ascertain the ability to promptly liquidate any augmented investments in response to potential shifts in market conditions.
The diversification strategy could also propose the diversification of the recently modified Bitcoin portfolio among various assets that exhibit negative correlation, as evidenced by the correlation heatmap. This approach would facilitate the dispersion of risk. Beyond the Prescriptive Analysis, the decision-making process refers to the cognitive and evaluative steps individuals take when faced with a choice or problem. It involves a systematic approach to gathering and analyzing information, including four major steps.
- Data Evaluation, which aims to assess the prediction output of the model and its underlying assumptions. The stakeholder should verify that the signals exhibit robust strength, and demonstrate a high degree of consistency with recent patterns.
- Strategic Planning, which aims to determine the percentage increase in investment allocation is contingent upon the confidence level of the model and the calculated prospective return on investment (ROI) within the context of strategic planning.
- Execution, which represents the implementation of investment allocation and risk reduction methods will be carried out. This process includes acquiring the coin and establishing stop-loss orders as advised.
- Monitoring, which seeks to maintain a continuous monitoring of the market to detect any alterations in the factors that have been identified as significant by the model and modify the investment plan accordingly in response to any alterations in the model’s projections resulting from the incorporation of fresh data.
4.1. DPP Example
The purpose of this performance assessment is to evaluate the success of prescriptive analysis by comparing the actual outcomes with the expected outcomes during the execution period. This assessment aims to refine future decision-making processes based on the findings. Ideally, the decision to modify investment strategies based on the predictive model should yield a positive ROI, assuming the accuracy of the projections. If the market deviates from the anticipated behavior, it is important to employ risk mitigation measures that aim to limit potential losses. To better illustrate the DPP framework in action, let us consider a hypothetical scenario, an example that illustrates how the framework can be applied in practice by researchers, financial analysts or investors, presented in Table 2.
This example demonstrates the power of the DPP framework to not only predict market trends, but to also turn these predictions into actionable investment strategies that manage risk and capitalize on opportunities in the cryptocurrency market.
In summary, the integration of data analysis and predictive modeling possesses the capacity to exert a substantial influence on the decision-making process in the bitcoin market. Subsequent investigations should prioritize the enhancement of these models and delve into the underlying causal connections suggested by the observed correlations to fully exploit the predictive analytics capabilities within this field, as previously mentioned in the Potential Improvements section.
4.2. Limitations
First, a limitation not of the DPP framework but of this paper is that it assumes a certain level of knowledge for key concepts related to cryptocurrencies, machine learning, or predictive modeling. As such, the thorough explanation of concepts like hyperparameter tuning algorithms or loss metrics falls outside the scope of this paper.
The use of EDA in the scope of this paper must also be acknowledged. The concerns regarding the subjective nature of feature selection in Exploratory Data Analysis and its limitations in establishing causality, handling noisy data, and assuming linear relationships are valid. However, EDA is an invaluable first step in data analysis, offering a preliminary understanding that guides further, more rigorous analyses. It identifies patterns, outliers, and relationships that inform model selection and hypothesis generation. While recognizing EDA’s limitations, including its focus on quantitative data and potential biases in sentiment analysis, its main role in the scope of this paper is to provide a foundational analysis from which to apply more targeted, advanced statistical methods to address these challenges. These methods can be explored and expanded in future iterations of the DPP Framework.
Besides EDA, the predictive modeling is also simplified. Predictive modeling is exposed, especially in the context of the cryptocurrency field, to data volatility, the risk of overfitting, the limitations of evaluation metrics, potential over-reliance on algorithms, regulatory dynamics, and the inherent market volatility of cryptocurrencies. These challenges highlight the complex nature of predictive modeling in cryptocurrency markets. While this paper focuses on introducing the DPP framework, addressing these concerns through refined methodologies, incorporating evolving regulatory insights, and enhancing model adaptability represents a crucial direction for future work. This will allow for a more comprehensive and nuanced understanding and application of the framework in real-world scenarios.
Another potential limitation is the robustness of the DPP framework in a real-world context. While the framework could be implemented as a real time application that could facilitate the decision-making process, the shortcomings must be highlighted. Constant back testing should be implemented, to assess the true performance of the predictive model and to detect when changes are in order. This step is especially important in the context of a highly volatile market like the cryptocurrency one. Besides back testing, early warning systems should be put in place, to highlight swings that could negatively affect the framework. Expert opinion should also be constantly present in the loop, to improve performance and limit failure.
While simple to implement as an experiment, the DPP framework could prove challenging to implement as a real-time robust application. Considerable computational resources would be needed to collect and store the data, process it, develop complex models that would need to infer every second and aid the decision-making process of hundreds or thousands of users. As such, it is recommended to first implement the DPP framework as a small-scale application before scaling it to fully robust solution.
The dismissal of the highly changing regulatory landscape is also a shortcoming of this iteration of the DPP framework. The integration of changing regulations, or requirements such as Anti-Money Laundering or Know Your Customer, fall outside the scope of this iteration of the framework. However, they could be implemented in future instances, either through a methodological approach or by automating the change process with the help of state-of-the-art Large Language Models.
While the proposed sentiment analysis solution is an improvement over other solutions presented in the literature, it is not without faults. It is still a simple approach that can easily fall into certain traps, like misinterpreting biases or nuances of the human language. A more advanced sentiment extraction technique is recommended.
4.3. Future Improvements
While this paper seeks to introduce the DPP framework and extensive work has been conducted to present a robust first iterations, improvements can be made, as highlighted in the limitations section. Future versions of the DPP framework can seek to expand on the hyperparameter tuning algorithms by better exploring the ones already presented or introducing new ones. An analysis of the best performing algorithms for the cryptocurrency field could be conducted.
To ensure the robustness of the DPP framework, future work can be conducted to apply the framework on different datasets under different market conditions. This could lead to a better generalization of the framework and improve its applicability in practice. Future developments can also seek to implement the framework in a practical manner by developing a real time application that would fully test the capability of the DPP Framework.
In the exploration of the DPP Framework’s application to social media and cryptocurrency dynamics, the adoption of advanced model validation techniques, such as cross-validation and bootstrap methods, is crucial for affirming the models’ robustness and the reliability of their predictions. Conducting a sensitivity analysis further enriches this research by identifying how variations in input variables and model parameters influence outcomes, shedding light on the most impactful factors and enhancing the models’ resilience against data variability. Future investigations are encouraged to delve into alternative data sources and employ more sophisticated predictive models or apply the framework in varied contexts, expanding the understanding and applicability of the findings. Moreover, the significance of data quality, especially in analyses reliant on social media data, cannot be overstated, with a need to address the challenges posed by data noise, missing values, and outliers to bolster the credibility and usefulness of the predictive insights generated.
5. Conclusions
Within the dynamic field of cryptocurrencies and their relationship with social media platforms, the framework presented in this paper offers a systematic and academic methodology for deciphering, comprehending, and maneuvering through these intricacies. This study effectively addresses the disparity between the abundance of unstructured data and the practical utilization of valuable insights by providing a comprehensive approach that encompasses the entire process, from data collection to prescriptive decision-making.
The significance of incorporating social media sentiment, historical price data, and on-chain metrics is of greatest importance in an era when online opinions possess the potential to swiftly influence market dynamics. The framework’s adaptability, reliability, and precision are ensured through the implementation of rigorous methodologies and the utilization of advanced machine learning and deep learning techniques. Besides the previously mentioned advancements the framework could undergo and present limitations, there are areas where the DPP framework could see improvements, such as: Real-time Adaptability, Interdisciplinary Collaborations, Ethical and Regulatory Considerations, and Integration with Blockchain, among others.
The advent of cryptocurrencies has brought about unparalleled instability and potential within the field of finance. To harness this potential, it is necessary to utilize advanced tools, methodologies, and insights. The proposed DPP framework represents a substantial advancement in this aspect, and is the first of its kind, to our knowledge. The adaptability, rigorous methodology, and comprehensive nature of this instrument render it indispensable for researchers, investors, and policymakers alike. The global community finds itself at the precipice of a significant technological transformation. This conceptual framework serves as a foundation for effectively leveraging the vast array of potential benefits that await, while simultaneously recognizing and making provisions for the obstacles that may arise.
Author Contributions
Conceptualization, A.-C.B.; methodology, A.-C.B.; software, A.-C.B.; validation, A.-C.B. and A.B.; data curation, A.-C.B.; writing—original draft preparation, A.-C.B.; writing—review and editing, A.B.; visualization, A.-C.B. and A.B.; supervision, A.B.; project administration, A.B.; funding acquisition, A.B. All authors have read and agreed to the published version of the manuscript.
Funding
This paper was funded by Academy of Romanian Scientists, Ilfov 3, 050044 Bucharest, Romania, project title: “Soluții informatice pentru analiza impactului rețelelor de social media asupra instrumentelor investiționale cu grad ridicat de risc: cryptomonede și bursă”.
Data Availability Statement
The data used in this paper can be accessed at: https://github.com/Emposes/DPP_Framework (accessed on 13 February 2024).
Conflicts of Interest
The authors declare no conflicts of interest.
References
- Nakamoto, S. Bitcoin: A Peer-to-Peer Electronic Cash System. Available online: https://bitcoin.org/bitcoin.pdf (accessed on 11 July 2022).
- Baroiu, A.C.; Dobrita Ene, G. Twitter Sentiment and Bitcoin Price–Is there a connection? In Proceedings of the 2022 26th International Conference on System Theory, Control and Computing (ICSTCC), Sinaia, Romania, 19–21 October 2022. [Google Scholar]
- Böyükaslan, A.; Ecer, F. Determination of drivers for investing in cryptocurrencies through a fuzzy full consistency method-Bonferroni (FUCOM-F’B) framework. Technol. Soc. 2021, 67, 101745. [Google Scholar] [CrossRef]
- Akhtaruzzaman; Boubaker, S.; Nguyen, D.K.; Rahman, M.R. Systemic risk-sharing framework of cryptocurrencies in the COVID–19 crisis. Finance Res. Lett. 2022, 47, 102787. [Google Scholar] [CrossRef] [PubMed]
- Park, A.-H.; Ryu, H.; Park, W.; Jeong, D. Forensic investigation framework for cryptocurrency wallet in the end device. Comput. Secur. 2023, 133, 103392. [Google Scholar] [CrossRef]
- Hajipour, E.; Khavari, F.; Hajiaghapour-Moghimi, M.; Hosseini, K.A.; Vakilian, M. An economic evaluation framework for cryptocurrency mining operation in microgrids. Int. J. Electr. Power Energy Syst. 2022, 142, 108329. [Google Scholar] [CrossRef]
- Brauneis, A.; Mestel, R. Cryptocurrency-portfolios in a mean-variance framework. Financ. Res. Lett. 2019, 28, 259–264. [Google Scholar] [CrossRef]
- Hu, Y.; Valera, H.G.A.; Oxley, L. Market efficiency of the top market-cap cryptocurrencies: Further evidence from a panel framework. Financ. Res. Lett. 2019, 31, 138–145. [Google Scholar] [CrossRef]
- European Comission. Financial Services—EU Regulatory Framework for Crypto-Assets. Available online: https://ec.europa.eu/info/law/better-regulation/have-your-say/initiatives/12089-Financial-services-EU-regulatory-framework-for-crypto-assets_en (accessed on 18 May 2023).
- Koo, E.; Kim, G. Centralized decomposition approach in LSTM for Bitcoin price prediction. Expert Syst. Appl. 2024, 237, 121401. [Google Scholar] [CrossRef]
- Kawakami, T. Quantile prediction for Bitcoin returns using financial assets’ realized measures. Financ. Res. Lett. 2023, 55, 103843. [Google Scholar] [CrossRef]
- Zou, Y.; Herremans, D. PreBit—A multimodal model with Twitter FinBERT embeddings for extreme price movement prediction of Bitcoin. Expert Syst. Appl. 2023, 233, 120838. [Google Scholar] [CrossRef]
- Rajabi, S.; Roozkhosh, P.; Farimani, N.M. MLP-based Learnable Window Size for Bitcoin price prediction. Appl. Soft Comput. 2022, 129, 109584. [Google Scholar] [CrossRef]
- Koo, E.; Kim, G. Prediction of Bitcoin price based on manipulating distribution strategy. Appl. Soft Comput. 2021, 110, 107738. [Google Scholar] [CrossRef]
- Yan, G.; Wang, S.; Li, S.; Lu, B. Multi-player dynamic game model for Bitcoin transaction bidding prediction. N. Am. J. Econ. Financ. 2022, 60, 101631. [Google Scholar] [CrossRef]
- Rathore, R.K.; Mishra, D.; Mehra, P.S.; Pal, O.; Hashim, A.S.; Shapi’I, A.; Ciano, T.; Shutaywi, M. Real-world model for bitcoin price prediction. Inf. Process. Manag. 2022, 59, 102968. [Google Scholar] [CrossRef]
- Cavalli, S.; Amoretti, M. CNN-based multivariate data analysis for bitcoin trend prediction. Appl. Soft Comput. 2021, 101, 107065. [Google Scholar] [CrossRef]
- Yi, Y.; He, M.; Zhang, Y. Out-of-sample prediction of Bitcoin realized volatility: Do other cryptocurrencies help? N. Am. J. Econ. Financ. 2022, 62, 101731. [Google Scholar] [CrossRef]
- Jaquart, P.; Dann, D.; Weinhardt, C. Short-term bitcoin market prediction via machine learning. J. Financ. Data Sci. 2021, 7, 45–66. [Google Scholar] [CrossRef]
- Chen, Z.; Li, C.; Sun, W. Bitcoin price prediction using machine learning: An approach to sample dimension engineering. J. Comput. Appl. Math. 2020, 365, 112395. [Google Scholar] [CrossRef]
- Chen, W.; Xu, H.; Jia, L.; Gao, Y. Machine learning model for Bitcoin exchange rate prediction using economic and tech-nology determinants. Int. J. Forecast. 2021, 37, 28–43. [Google Scholar] [CrossRef]
- Shu, M.; Zhu, W. Real-time prediction of Bitcoin bubble crashes. Phys. A Stat. Mech. Appl. 2020, 548, 124477. [Google Scholar] [CrossRef]
- Mtiraoui, A.; Boubaker, H.; BelKacem, L. A hybrid approach for forecasting bitcoin series. Res. Int. Bus. Financ. 2023, 66, 102011. [Google Scholar] [CrossRef]
- Feng, W.; Zhang, Z. Currency exchange rate predictability: The new power of Bitcoin prices. J. Int. Money Financ. 2023, 132, 102811. [Google Scholar] [CrossRef]
- Basher, S.; Sadorsky, P. Forecasting Bitcoin price direction with random forests: How important are interest rates, inflation, and market volatility? Mach. Learn. Appl. 2022, 9, 100355. [Google Scholar]
- Hajek, P.; Hikkerova, L.; Sahut, J.-M. How well do investor sentiment and ensemble learning predict Bitcoin prices? Res. Int. Bus. Financ. 2023, 64, 101836. [Google Scholar] [CrossRef]
- Bâra, A.; Oprea, S.-V.; Băroiu, A.-C. Forecasting the Spot Market Electricity Price with a Long Short-Term Memory Model Architecture in a Disruptive Economic and Geopolitical Context. Int. J. Comput. Intell. Syst. 2023, 16, 130. [Google Scholar] [CrossRef]
Figure 1.
Descriptive-predictive-prescriptive framework for the Social-Media–Cryptocurrency relationship.
Figure 1.
Descriptive-predictive-prescriptive framework for the Social-Media–Cryptocurrency relationship.

Figure 2.
Univariate Analysis Example.

Figure 3.
Correlation Heatmap.

Figure 4.
Baseline Model Performance.

Figure 5.
Improved Model Performance.


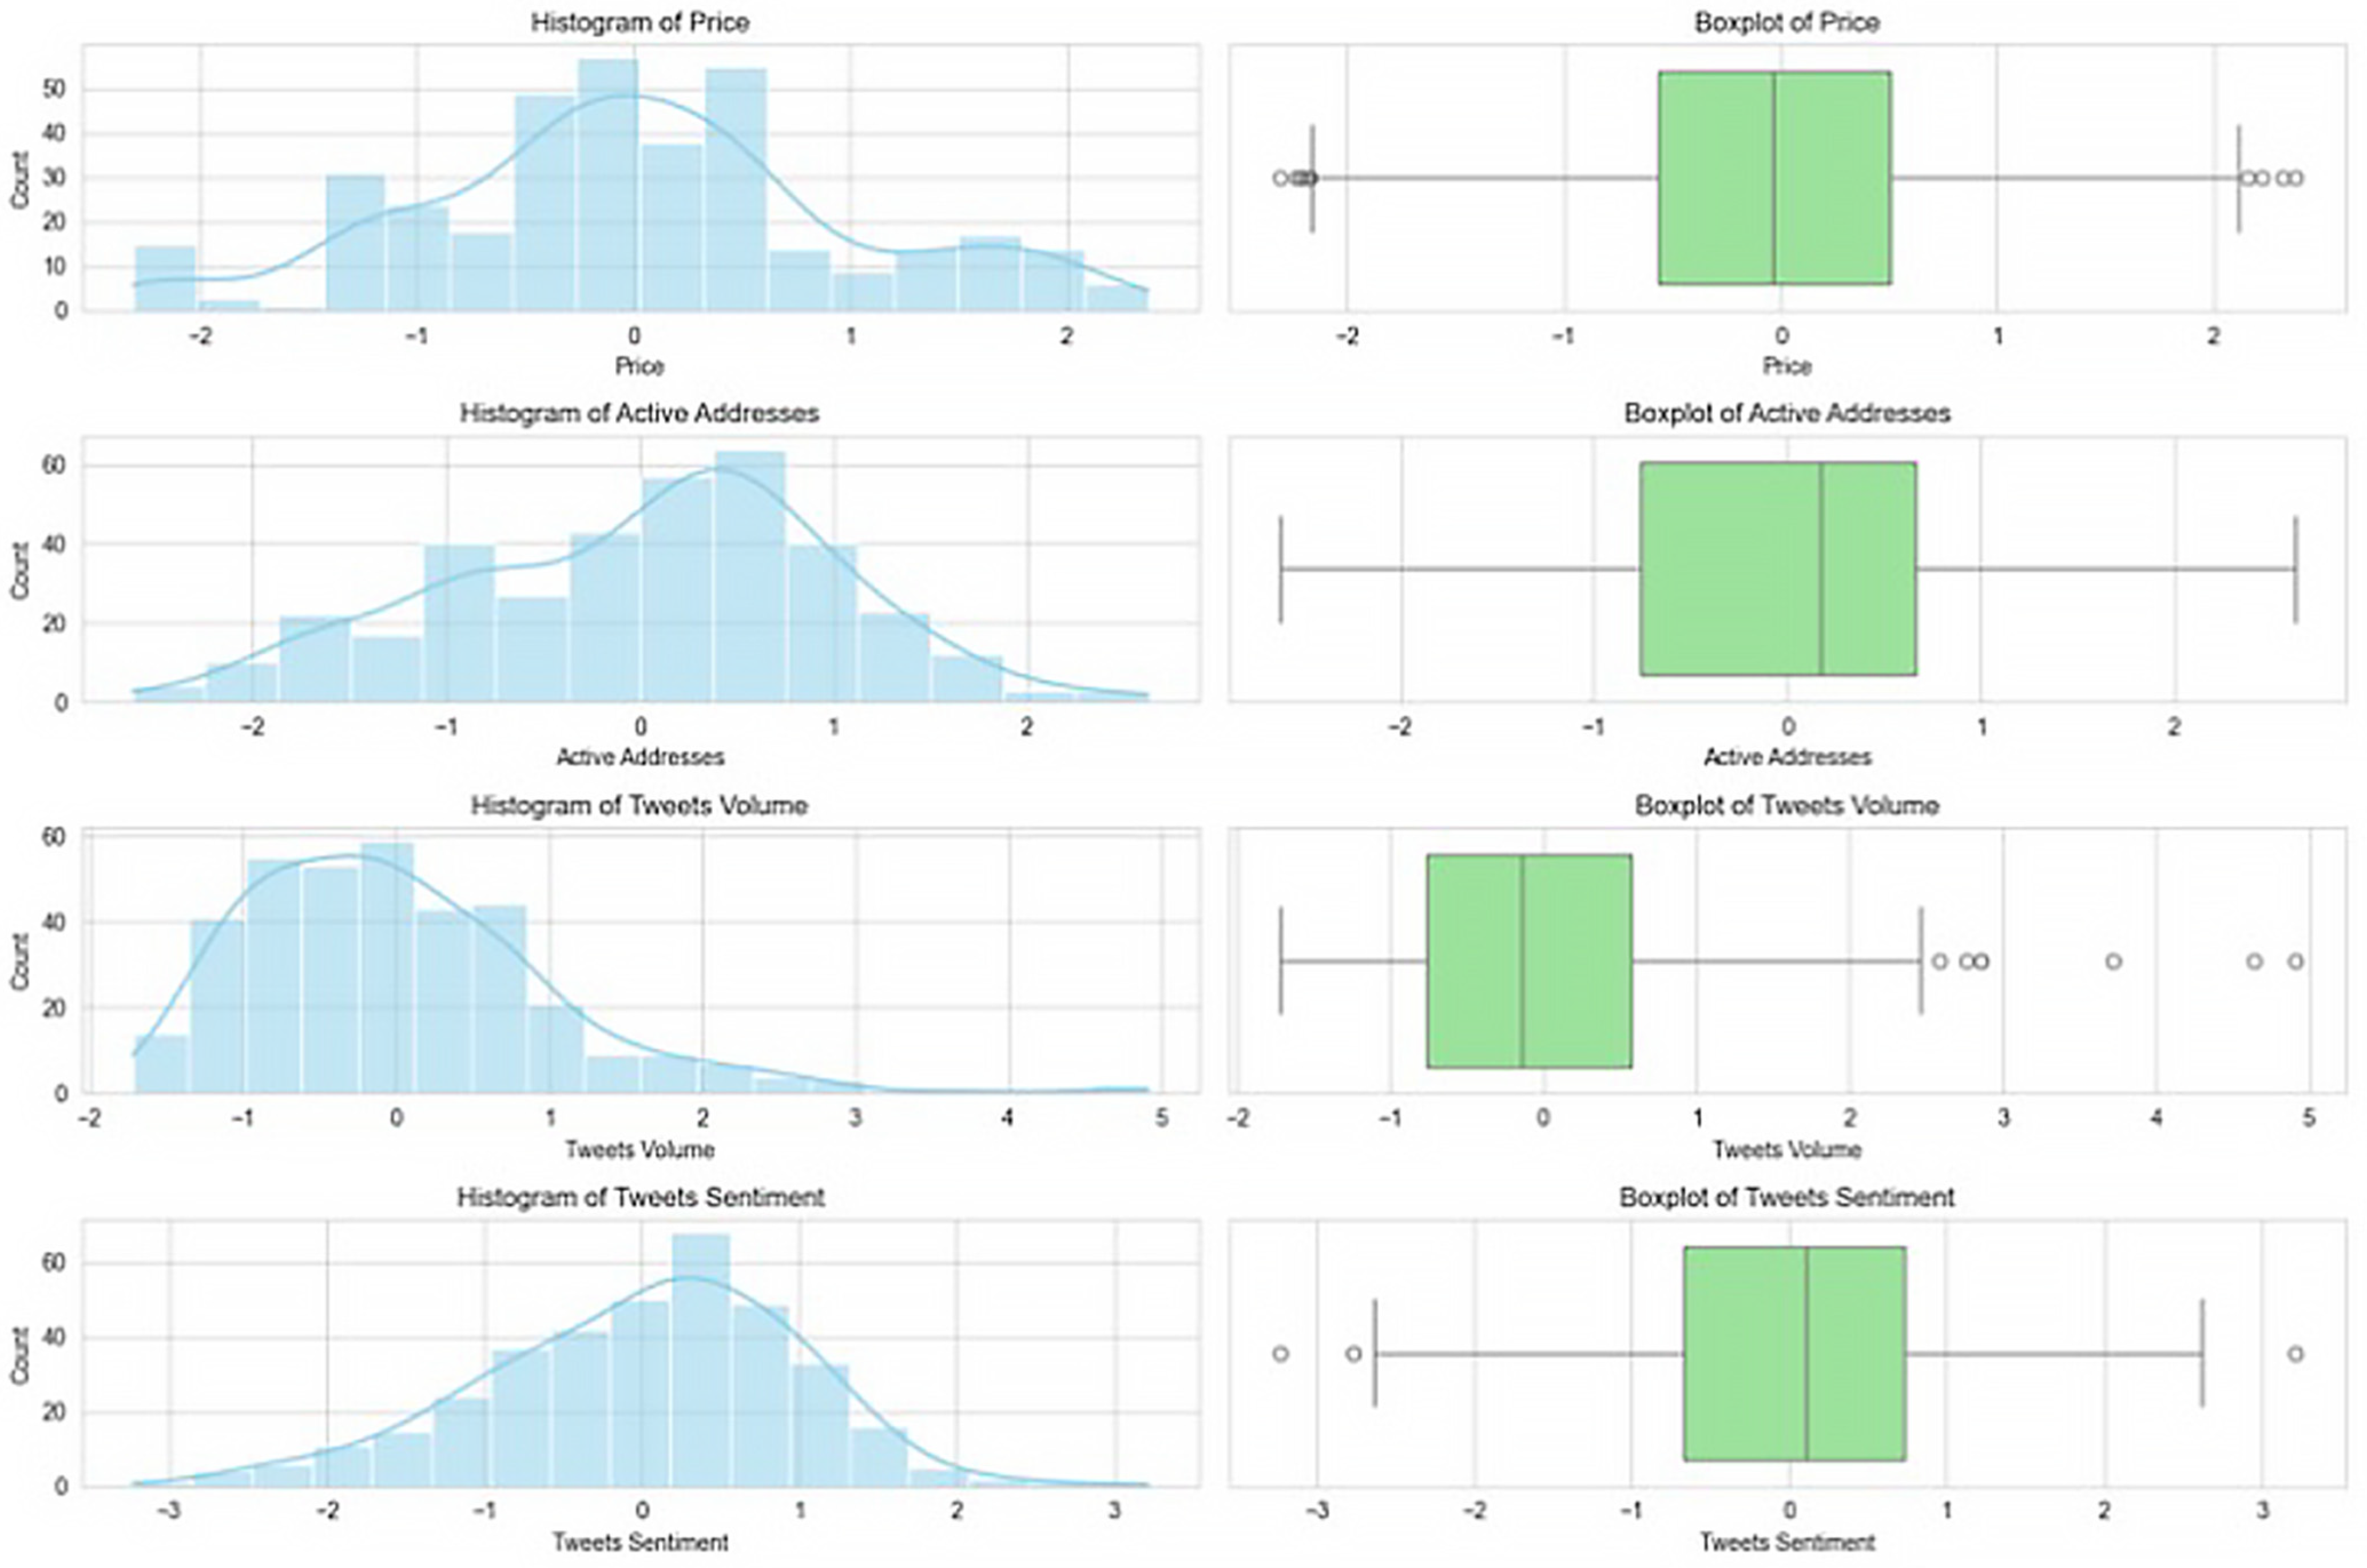
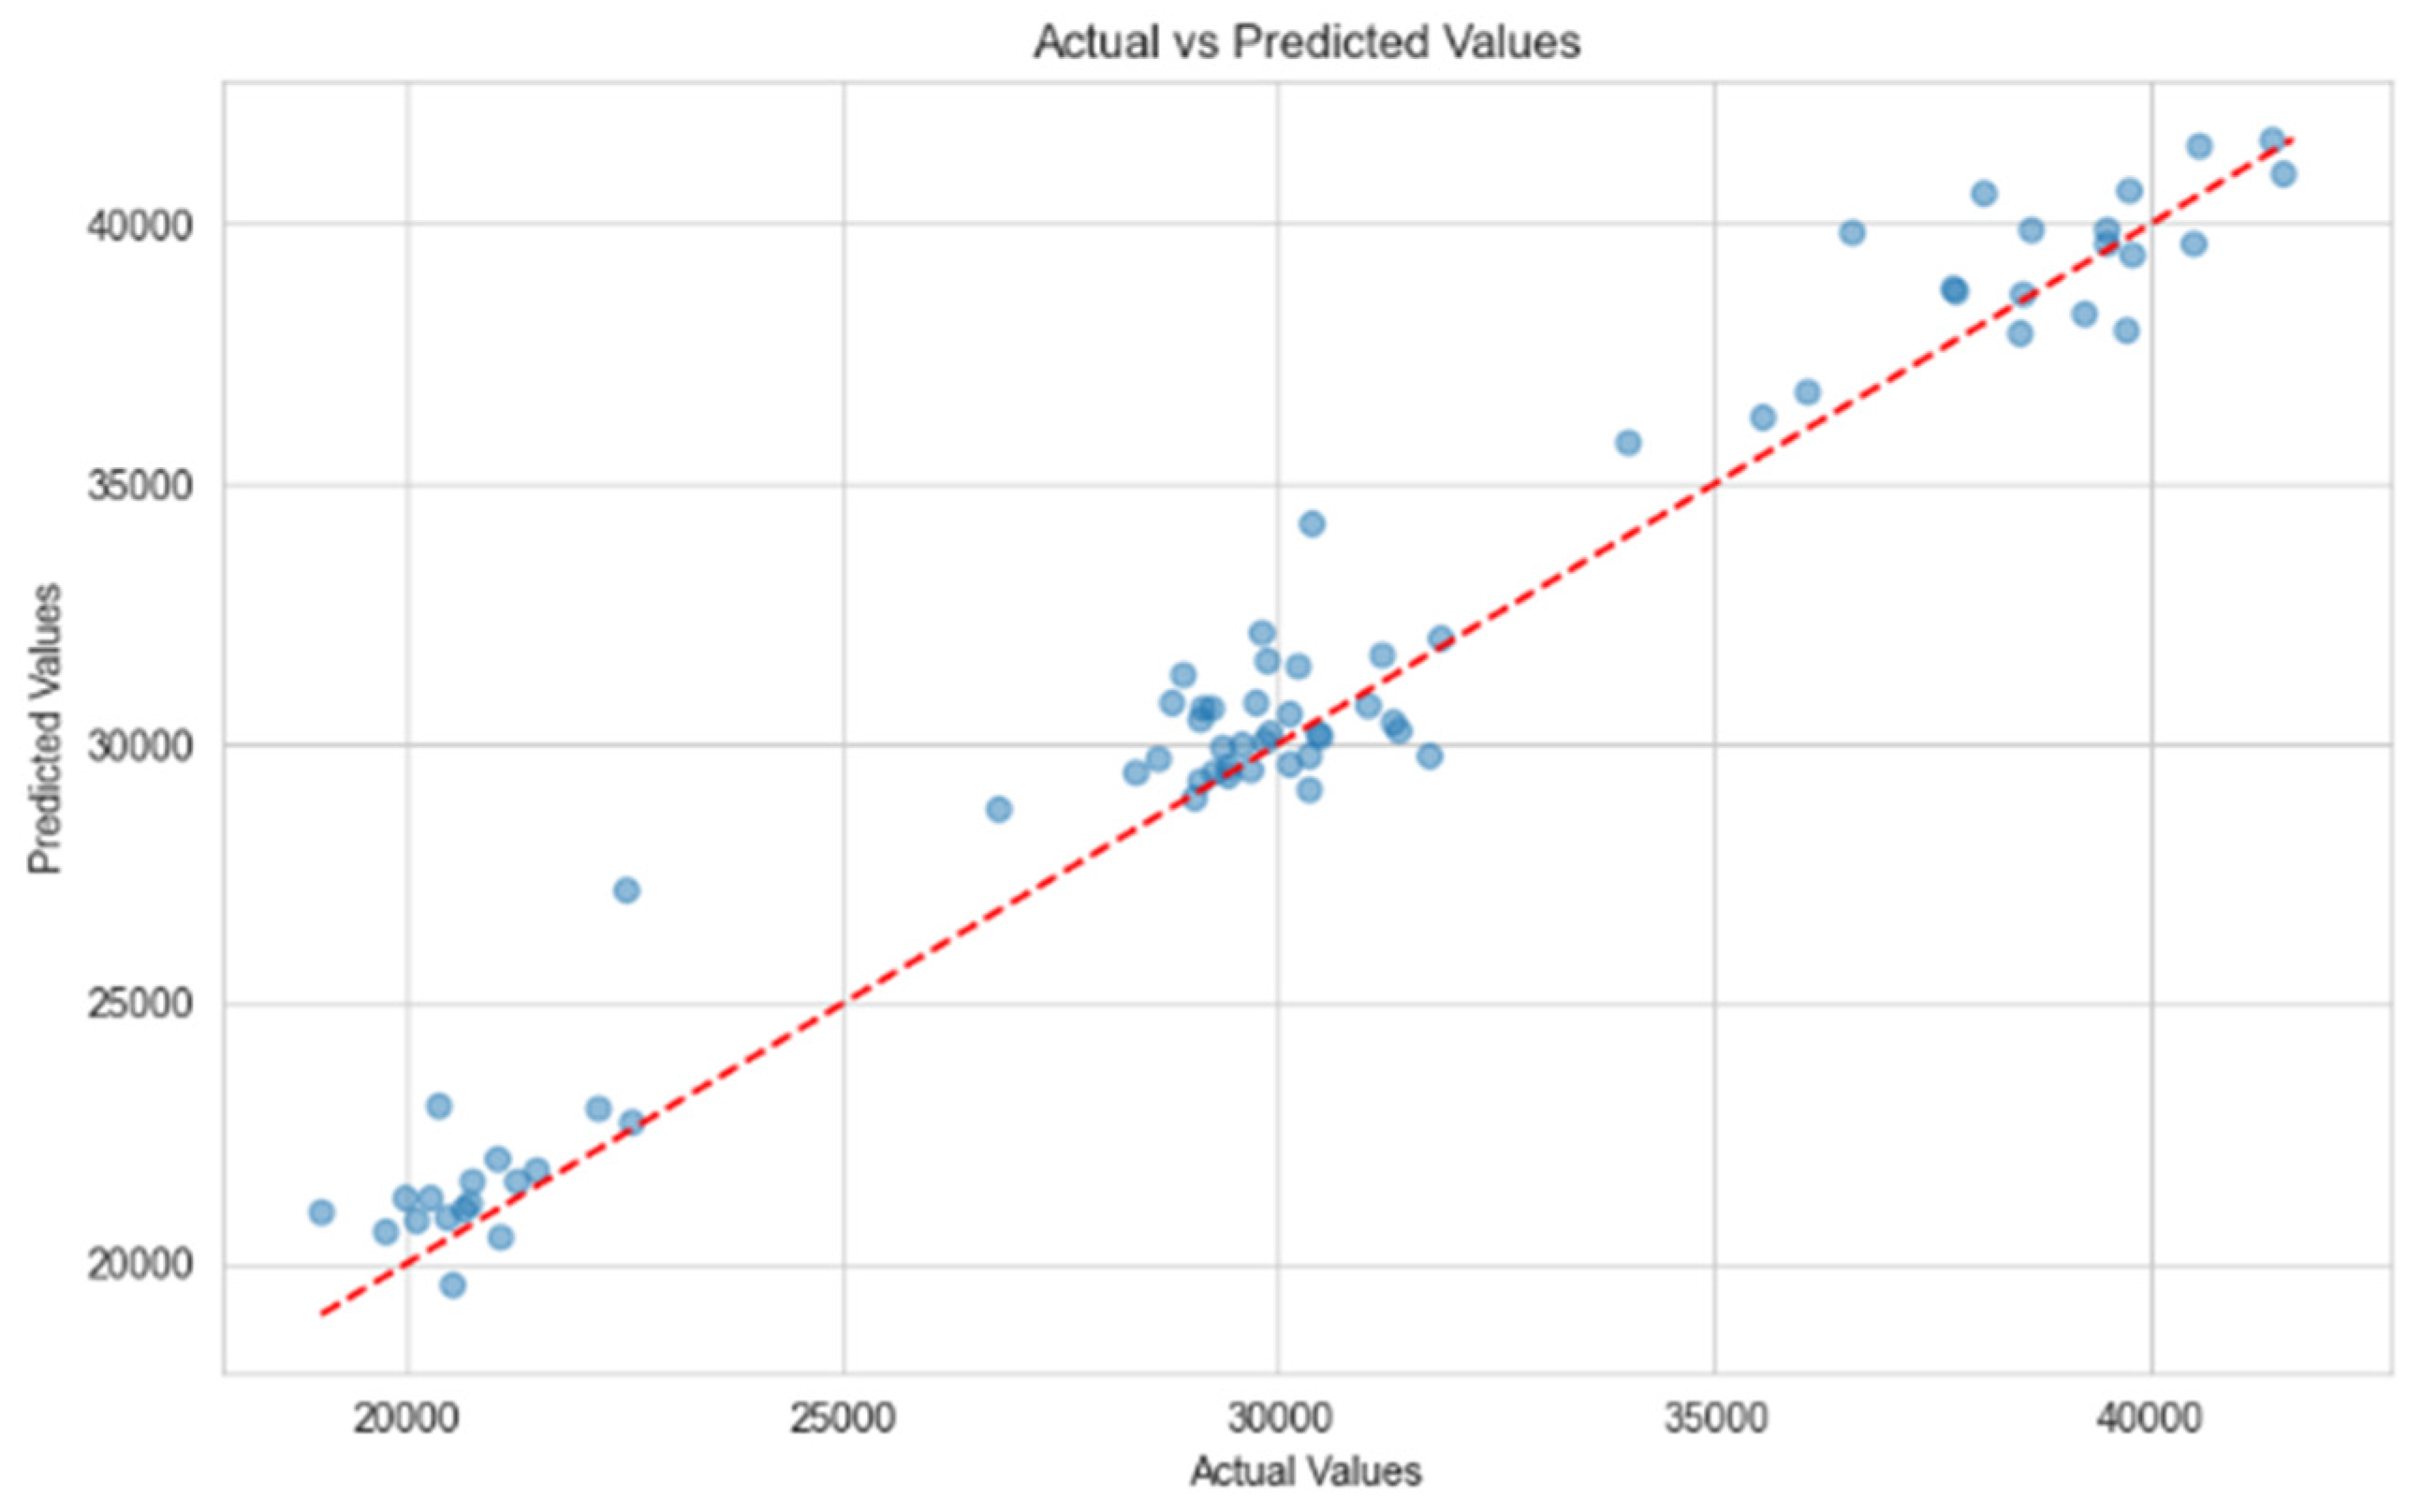
Table 1.
Performance Metrics–Baseline vs. DPP.
| Approach | RMSE | MAE |
|---|---|---|
| Baseline | 1352.25 | 1011.78 |
| DPP | 1305.73 | 965.3 |
Table 2.
Prescriptive Analysis Example.
| Prescriptive Analysis Component | Details |
|---|---|
| Baseline | 1352.25 |
| Predictive Model Forecast | Forecasted a 10% increase in Bitcoin’s price over the next quarter. |
| Descriptive Analysis Output | Current Bitcoin Price: $30,000 Predicted Price (Next Quarter): $33,000 Social Media Sentiment Index: +0.75 Current Market Volatility: High |
| Investment Allocation | Current Bitcoin holding: 2 BTC ($60,000) Additional investment: 10% of the portfolio value New Bitcoin purchase: 0.2 BTC ($6000) |
| Risk Mitigation | Stop-Loss Order set at 5% below the current market price ($28,500) |
| Liquidity Analysis | Average daily trading volume: 350,000 BTC High liquidity, easy liquidation |
| Diversification Strategy | Correlation with Gold: −0.6 Investment into Gold: 30% of the additional investment |
| Strategic Planning and Execution | Confidence Level of the Model: 85% Increase in Investment Allocation: 10% Allocation to Gold for diversification |
| Monitoring and Performance Assessment | Bitcoin reached predicted $33,000 by quarter-end Gold appreciated by 2% |
| Outcome Analysis | Bitcoin holding value at quarter-end: $72,600 Gold Investment value at quarter-end: $1836 Total Portfolio Value at quarter-end: $74,436 ROI: 12.78% |
| Conclusion | The DPP framework provided a successful investment strategy, yielding a positive ROI and effectively managing risk through diversification and stop-loss orders. |
Disclaimer/Publisher’s Note: The statements, opinions and data contained in all publications are solely those of the individual author(s) and contributor(s) and not of MDPI and/or the editor(s). MDPI and/or the editor(s) disclaim responsibility for any injury to people or property resulting from any ideas, methods, instructions or products referred to in the content. |
© 2024 by the authors. Licensee MDPI, Basel, Switzerland. This article is an open access article distributed under the terms and conditions of the Creative Commons Attribution (CC BY) license (https://creativecommons.org/licenses/by/4.0/).
Share and Cite
MDPI and ACS Style
Băroiu, A.-C.; Bâra, A. A Descriptive-Predictive–Prescriptive Framework for the Social-Media–Cryptocurrencies Relationship. Electronics 2024, 13, 1277. https://0-doi-org.brum.beds.ac.uk/10.3390/electronics13071277
AMA Style
Băroiu A-C, Bâra A. A Descriptive-Predictive–Prescriptive Framework for the Social-Media–Cryptocurrencies Relationship. Electronics. 2024; 13(7):1277. https://0-doi-org.brum.beds.ac.uk/10.3390/electronics13071277
Chicago/Turabian StyleBăroiu, Alexandru-Costin, and Adela Bâra. 2024. "A Descriptive-Predictive–Prescriptive Framework for the Social-Media–Cryptocurrencies Relationship" Electronics 13, no. 7: 1277. https://0-doi-org.brum.beds.ac.uk/10.3390/electronics13071277
Note that from the first issue of 2016, this journal uses article numbers instead of page numbers. See further details here.