1. Introduction
Fiber-reinforced composites are now firmly at the forefront of advanced materials and are used in an increasing number of applications, from fishing rods to satellites. Today, the largest use of high-performance composites is in civilian applications, but initially they were mainly used in the military and, in particular, in aerospace structures. The reason for the use of these materials is due to weight savings [
1].
The present work consisted of the in-plane characterization of a Kevlar
® material preimpregnated with phenolic resin with polyvinyl butyral on both sides. As the first stage of this study, our aim was to determine the mechanical properties of the in-plane interweaving through tensile tests based on a standard method using a universal testing system to acquire the elastic moduli and strengths. The elastic constants obtained from this study will be used for a subsequent improvement study of an antifragment helmet using the finite element method. In the literature, there are studies that can be classified according to the geometry under study, either focused on military helmets or on rectangular geometries subjected to a ballistic impact using computational tools such as LS-DYNA
® or ABAQUS
® (
Table 1). The mechanical properties used in this type of research come from the study carried out by van Hoof et al. in –2001 [
2,
3], who was a pioneer of the use of numerical simulations of ballistic impact on reinforcement laminates of Kevlar
® 29/phenolic material. Hoof [
2] simulated a rectangular-geometry piece of laminate that was impacted by a projectile fragment; in his numerical simulation he took the mechanical properties of Kevlar
® from Guoqi et al. [
4], who in turn characterized the Kevlar
® 29/polyester material through quasi-static and dynamic tests in 1981 [
4]. From the validation, van Hoof observed that there was no correlation between the numerical simulation and the ballistic test, therefore a “calibration” of the mechanical properties (strengths) was carried out to force a correlation. From this work, the parameters of the Kevlar
® material were obtained, which are still used today for ballistic studies on combat helmets [
5,
6,
7,
8,
9,
10,
11,
12], as shown in
Table 1.
The methodology used by Guoqi et al. [
4] to obtain the elastic moduli in the warp and weft directions was through the use of coupons with interleaved layers at [0°, 90°], obtaining an elastic modulus of 18.5 GPa for both orthotropy directions; therefore, no distinction was made between the principal directions of the material. In addition, the way in which the shear modulus was characterized is not recommended, since it generates undesirable deformations at the ends of the coupons. Therefore, our work proposes a methodology based on symmetrical laminates with straight coupons at [+45°, −45°]
s that can be used to obtain the shear modulus
GLT to prevent the coupons from generating moments in the universal testing system grips.
In the research presented by Nunes et al. [
13], a Kevlar
® 29/epoxy composite was intensively characterized in the plane through tensile, compression, V-notch rail shear and short beam tests. Also, Scazzosi et al. [
14] determined the mechanical properties of a Kevlar
® 29/epoxy composite in the plane by tensile tests. In the research by Gower et al. [
15], Kevlar
® 129 was characterized through a tensile test, but neither the thermoforming conditions nor the coupon’s dimensions were exposed.
Shim et al. [
16] analyzed the Twaron CT 716 through dynamic tests using a Hopkinson tension bar machine to study the viscoelasticity effect; the tests were performed at strain rates of 280–550 s
−1. Quasi-static tests were also performed with a universal testing system at strain rates from 10
−3 to 1 s
−1. At high strain rates, the material behaves more rigidly, but it fails at very small strains. While this work is ideal for the study of dynamically loaded materials, not all laboratories have the necessary equipment, such as the Hopkinson tension bar.
There are a limited number of works in the literature that characterize a Kevlar
® material embedded in thermosetting resin [
17]. Even though Kevlar
® 29/phenolic resin with polyvinyl butyral is not a novel material [
2,
3,
18], the intention of our work is to provide a methodology to characterize the material in the plane using quasi-static tensile tests in each of the orthotropic directions of the Kevlar
® composite. Subsequently, the goal is to characterize the material in terms of its thickness and build a finite element model of an antifragment helmet considering different orientations of the layers within the laminate in order to protect against the impact of a fragment simulating a projectile. Finally, the model will be validated with an impact test. For all of this, it is necessary to be certain of the mechanical properties of the material under study to avoid discrepancies between the numerical simulation and the experimental validation.
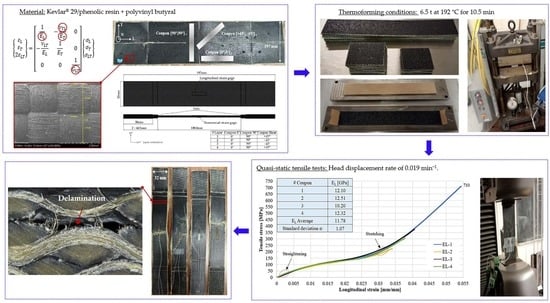
A woven fabric can be studied as an orthotropic material with nine elastic constants represented in a matrix of compliances, as shown in Equation (1) [
19]. The matrix considers the elastic moduli (
EL,
ET,
EN), shear moduli (
GLT,
GTN,
GLN) and Poisson’s ratio (
νTL,
νNL,
νNT). The subscripts
L,
T and
N represent the orthotropic directions of a woven fabric as shown in
Figure 1. The aim of this work is to characterize the Kevlar
® material in the L-T plane.
In brief:
, where
ε represents the vector of strains,
C is the matrix of the compliances in the orthotropic direction and
σ is the vector of stresses. According to symmetry:
,
,
. The principal material directions of the individual layers within the laminate will not necessarily coincide with the global laminate axis. The stiffness
R′ and compliance
C′ matrix for each layer must be expressed within the global material axis of the laminate using the following transformations given in Equations (2) and (3).
where
Oσ and
Oε represent the rotation matrices used to obtain the compliance matrix in the global axis system, according to Equation (4) and Equation (5), respectively.
where
c = cos
θ and
s = sin
θ. Finally, the vectors of stresses
σ′ and strains
ε′ in the global axis system are determined by Equation (6) and Equation (7), respectively.
For a plane stresses study, Equation (1) becomes Equation (8). In the first stage of this work, the composite material was characterized in the plane using tensile tests. The matrix of compliances in Equation (8) is required to determine the elastic moduli (
EL and
ET), shear modulus (
GLT), Poisson’s ratio (
νTL) and strengths (
XT,
YT and
S).
2. Materials and Methods
Figure 2a shows one sheet of Kevlar
® 29/phenolic resin with polyvinyl butyral used for the production of antifragment helmets. This material is preimpregnated with resin on both sides. As shown in the image, the material has horizontal and vertical cuts, as it has been prepared for use in the manufacture of helmets; these cuts limited the extraction of the coupons. For the development of this in-plane testing program, straight geometries based on the ASTM D3039/D3039M standard [
20] were implemented to determine elastic moduli (
EL,
ET), shear modulus (
GLT), Poisson’s ratio (
νLT) and strengths (
XT,
YT,
S) through tensile tests. Straight coupons are beneficial when a water-jet cutting machine is not available, facilitating the cutting process of each layer by using sheet-metal-cutting scissors. A Hitachi
® scanning electron microscope model SU3500 was used to identify the orthotropic directions (
Figure 2b); a repetitive unit size of 3 mm was observed, with the yarn width being greater in the longitudinal direction than in the transversal direction. The orthotropic directions of each sheet were identified in order to produce coupons with the properly identified directions.
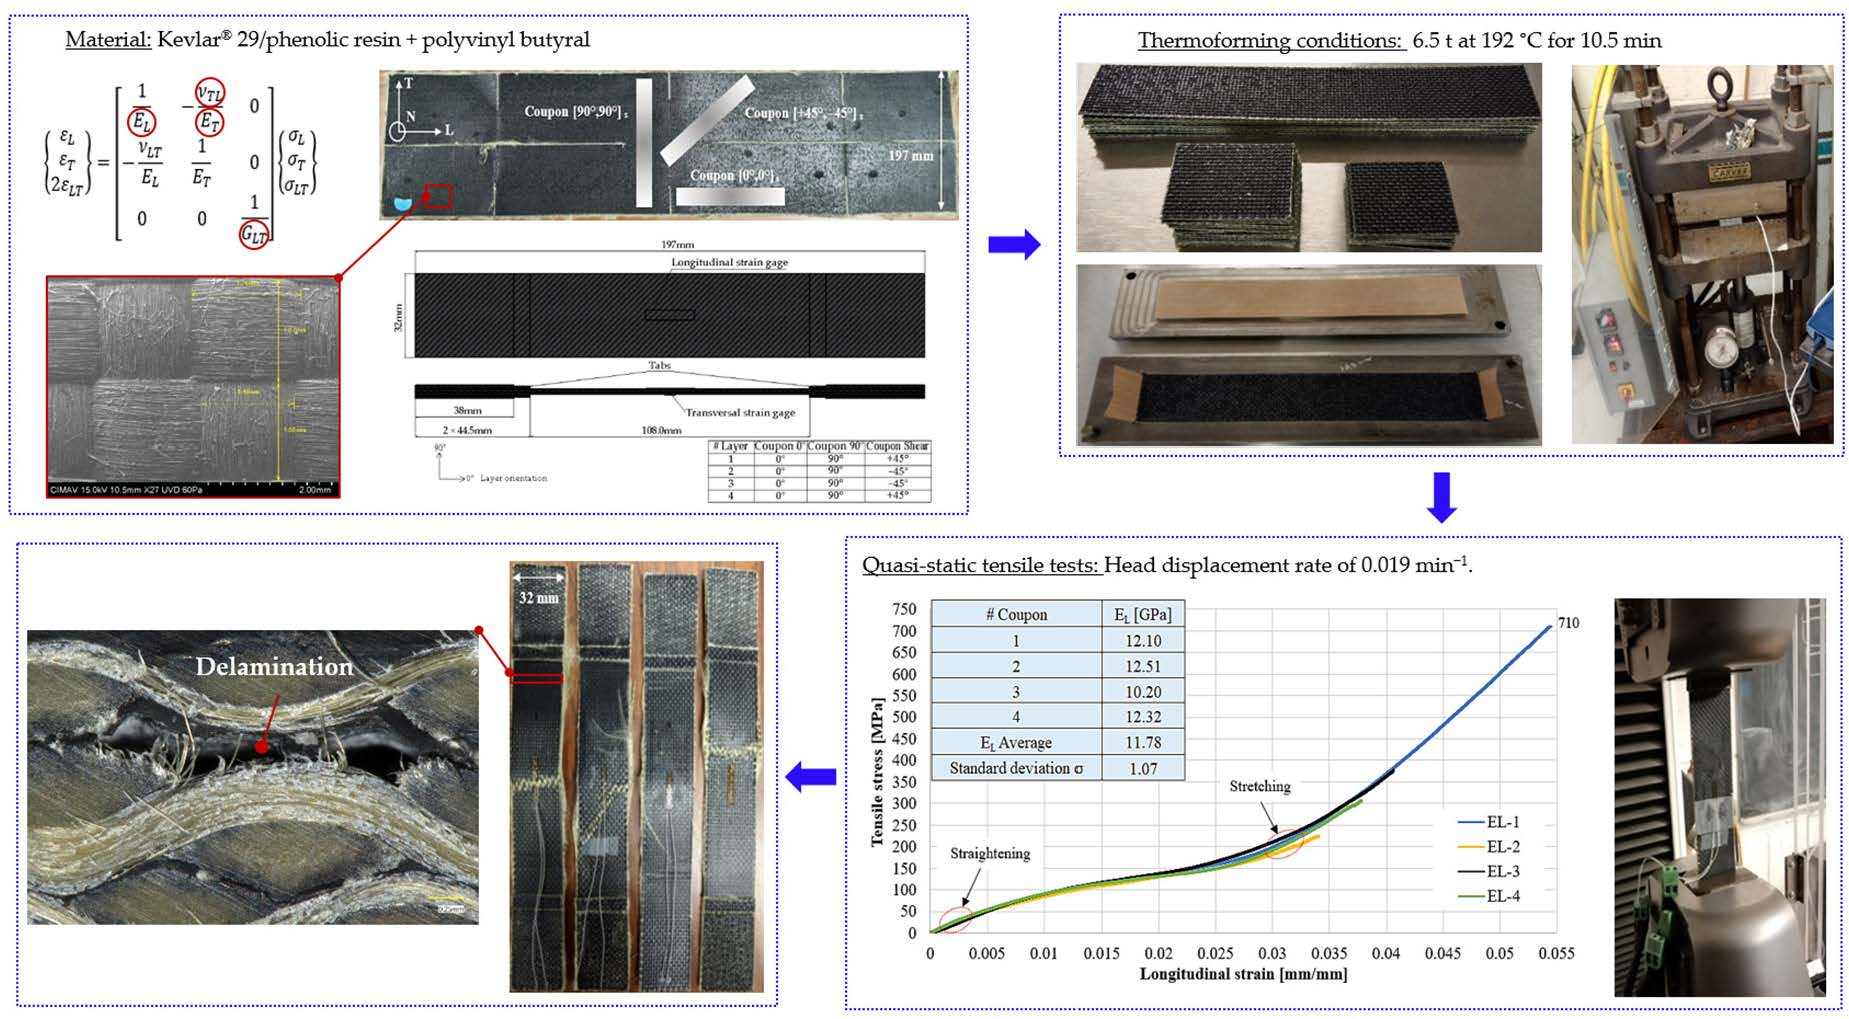
Figure 3 shows the coupon geometry, as well as the dimensions and number of locally thermoformed tabs at the coupons’ ends, which were used to protect the material from the universal machine grips and ensure the coupon breakage occurred away from the grips. A coupon width of 32 mm was considered, taking into account that, to obtain the Poisson’s ratio
νLT, a strain gage has to be positioned transversely to the coupon. The material was cut according to the orthotropic directions, as shown in
Figure 1. The coupon length used was 197 mm, which represents the maximum length that it was possible to obtain from the as-received material. For the tabs, it was proposed that we should make a smooth transition in the thickness of the coupons and thus avoid a pronounced concentration of stresses.
The grid length in the longitudinal direction of the gage is 12.7 mm, which is large enough to cover 4.2 repeat units of the woven fabric and thus to obtain a correct measurement of the Poisson’s ratio νTL. During the tensile test, large strains were expected, so EP-08-500GB-120 gages (Micro-Measurements, Raleigh, NC, USA) were selected, which can be used for applications of up to ±20%; these gages have a resistance of 120 Ω, which the equipment can read.
A mold and cover were designed and fabricated from 6.35 cm × 25.4 cm × 1.27 cm AISI 1018 steel plates. The thickness of 1.27 cm was chosen to avoid buckling in the middle of the plate during the manufacturing of the mold.
Figure 4a shows the stacking of resin–preimpregnated Kevlar
® layers; the use of Teflon
® paper was necessary to prevent the sample from sticking to the mold.
Figure 4b shows the closed mold and
Figure 4c shows a Carver
® 4122 Manual Heated Press (10 t) where the coupon thermoforming process was performed. The thermoforming conditions were 192 °C with a compression load of 6.5 t for 10.5 min, which were based on the manufacturing conditions of the antifragment helmets. The compression load and time conditions applied to the tabs were reduced to 2 t and 3 min, respectively, to avoid a local reduction in the thickness of the coupons’ ends.
For the tensile test, an Instron
® 3382 universal testing system was used (
Figure 5). A head displacement rate of 2 mm/min (0.019 min
−1) was used, according to the ASTM D3039/D3039M standard [
20]. Mechanical wedge-action grips type 2716-003 were used.
Jones [
21] proposed determining the shear modulus
GLT using a tensile test instead of using the Iosipescu method, which requires special grips that are not available in most laboratories. To perform this test, the layers are required to be oriented at 45° and, using Equation (9), it is possible to determine the shear modulus in the
GLT plane;
Ex is the elastic modulus with the material oriented at 45°. Jones’ method generates angular strains at the end of the coupon’s edges when the ends of the laminate are free to deform, as shown on the left side of
Figure 6. However, if the ends of the coupon are clamped, this causes the coupon to twist and generate moments at gripping points, as shown on the right side of
Figure 6.
An alternative procedure to the Jones’ equation is presented below, which can be used to obtain the shear modulus
GLT using straight coupons at [+45°, −45°]
s by performing tensile tests using a universal testing system, as shown in
Figure 3. This methodology avoids deformations such as those shown in
Figure 6.
In the case of a laminate, the total force and moment resultants can be obtained by adding the effects of all layers in a single-layer element, as shown in
Figure 7.
The force–deformation relationship and the moment–deformation relationship are described by Equation (10) and Equation (11), respectively [
19]:
where
Nx,
Ny are the normal forces per unit length,
Ns is the shear force per unit length,
Mx and
My are the bending moments per unit length and
Ms is the twisting moment per unit length [
19].
Equations (10) and (11) can be combined into one general expression that briefly relates the in-plane forces and moments to the reference plane strains and curvatures, as indicated by Equation (12):
The above relationships are expressed in terms of three laminate stiffness matrices, [
A], [
B] and [
D], which are functions of the thickness, material properties and stacking sequence of the individual layers. [
A] is the extensional stiffness matrix expressed by Equation (13), which relates in-plane forces to in-plane strains; [
B] is the coupling stiffness matrix expressed by Equation (14), which relates in-plane forces to curvatures and moments to in-plane strains. [
D] is the bending laminate stiffness matrix expressed by Equation (15), which relates moments to curvatures [
19].
where
ei represents the vector of thickness for each layer and
is the matrix of compliances in the global system. As in symmetric laminates,
B = 0; therefore, there is no coupling between in-plane loading and out-of-plane deformation (curvatures) and between bending and twisting moments and in-plane deformation. These laminates exhibit no distortion or warpage after fabrication and are easier to analyze. Therefore, Equation (10) and Equation (11) become Equation (16) and Equation (17), respectively:
When an axial load
NX is applied through a universal testing system to a coupon with a configuration of four layers [+45°, −45°]
s, according to Equation (16),
Ny =
Ns = 0 and
γs = 0 (the edges remain straight), and
εx and
εy are different of zero. Inverting matrix A from Equation (16) yields Equation (18) which can be used to obtain
εx.
where e is the thickness of each layer considering/in this case/that each layer has the same thickness.
represents the average stress across all of the layers because the stress changes from layer to layer and
, thus obtaining the shear modulus
GLT (Equation (19)).
If
EL =
ET, Equation (19) becomes Equation (20).
3. Results and Discussion
Figure 8 shows the tensile stress–strain curves of four coupons tested at 0° (longitudinal direction). It is worth mentioning that three of them (EL-2, EL-3, EL-4) did not reach the strength or strain of coupon EL-1 due to the debonding of their tabs; however, the four coupons performed similarly in the 0–2% strain range, which was adequate to calculate the longitudinal elastic modulus (
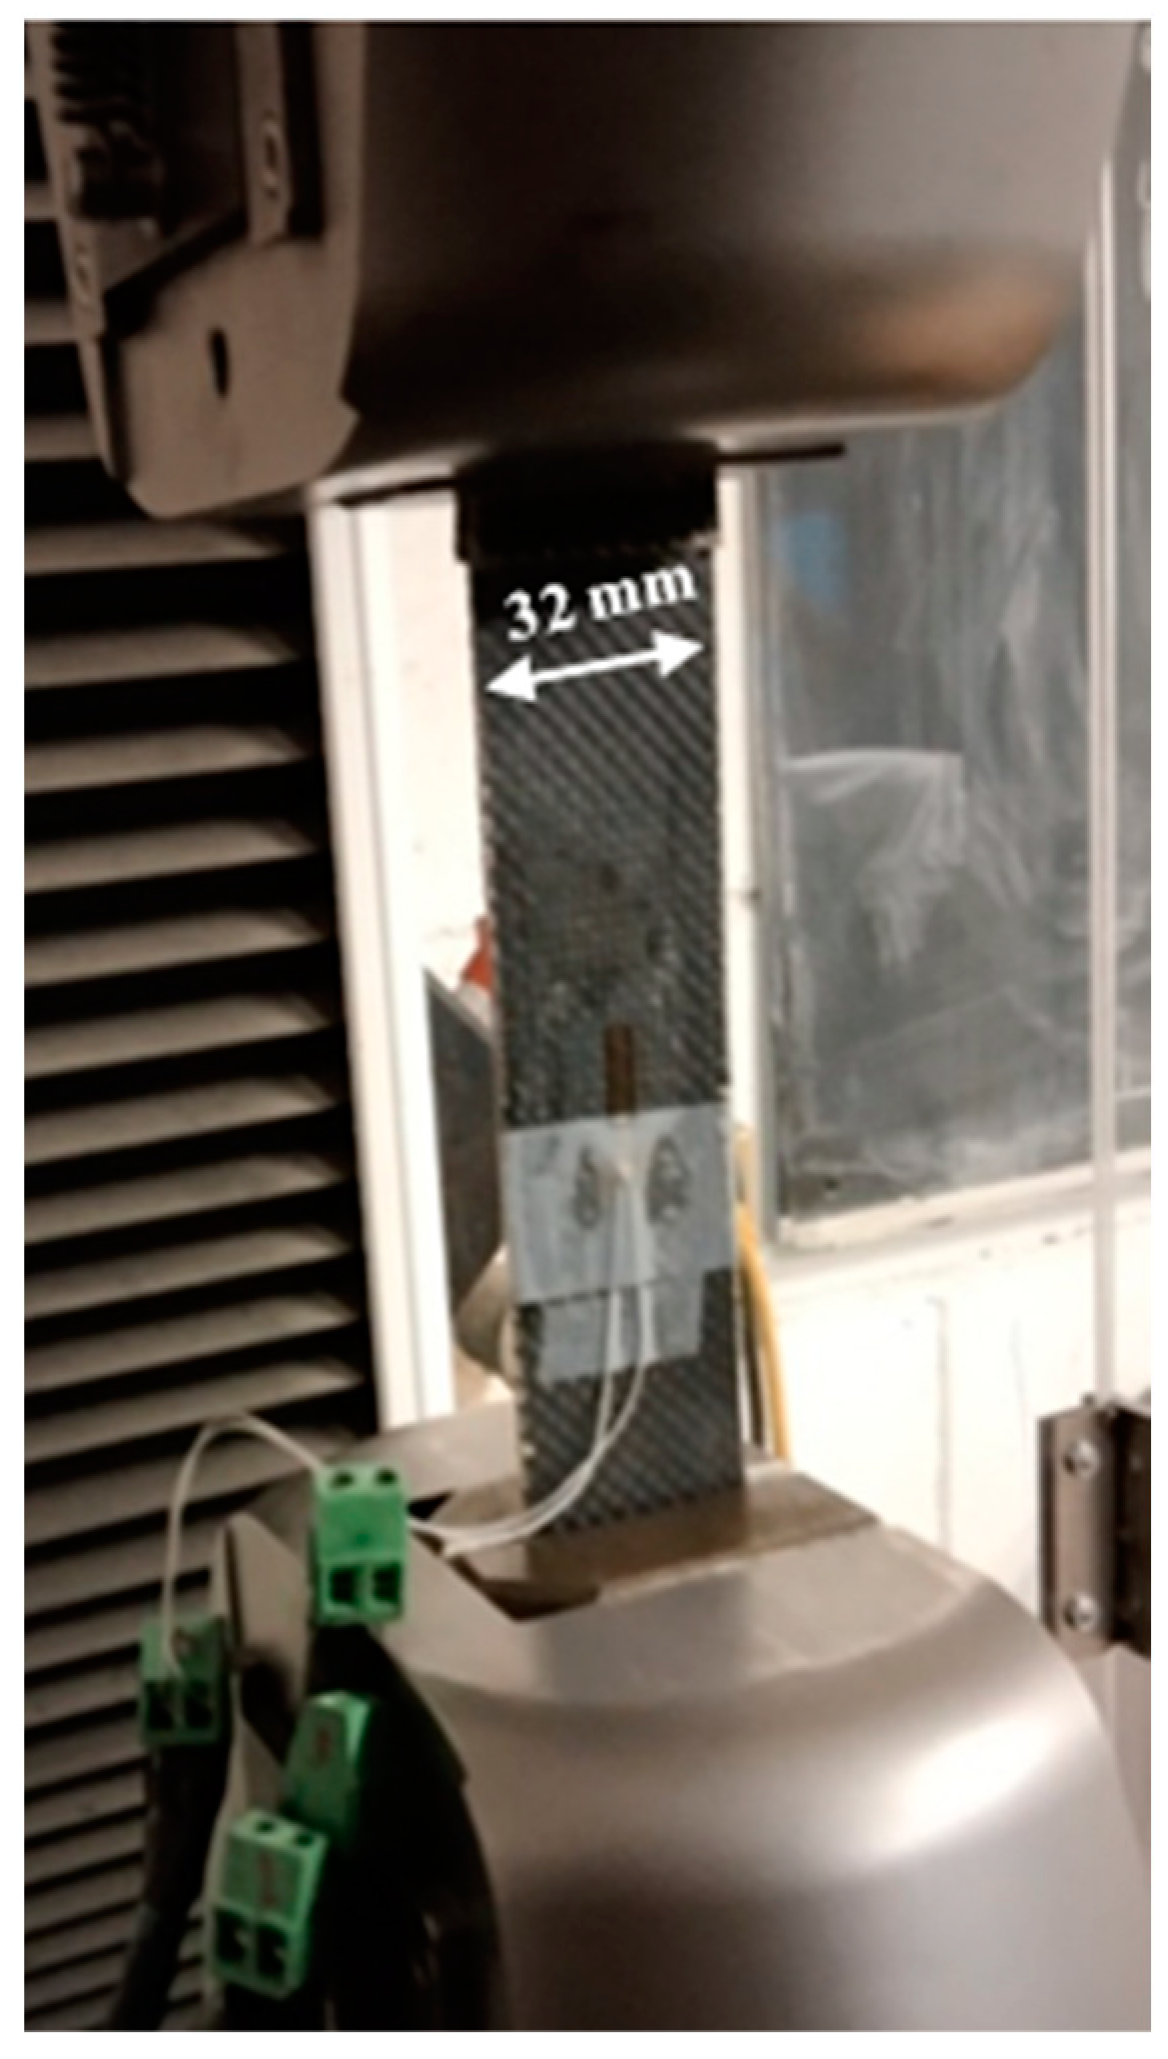
EL = 11.78 ± 1.07 GPa). Two additional coupons (EL-5, EL-6) with no strain gage instrumentation were tested to determine a suitable strength (
XT = 648.33 ± 56.31 MPa) (
Figure 9).
Figure 10 shows the longitudinal strain–transversal strain curves of the coupons tested under tension at 0°, from which the Poisson’s ratio (
νLT = 0.29 ± 0.06) was calculated.
Figure 11 shows the coupons’ appearances after these tensile tests.
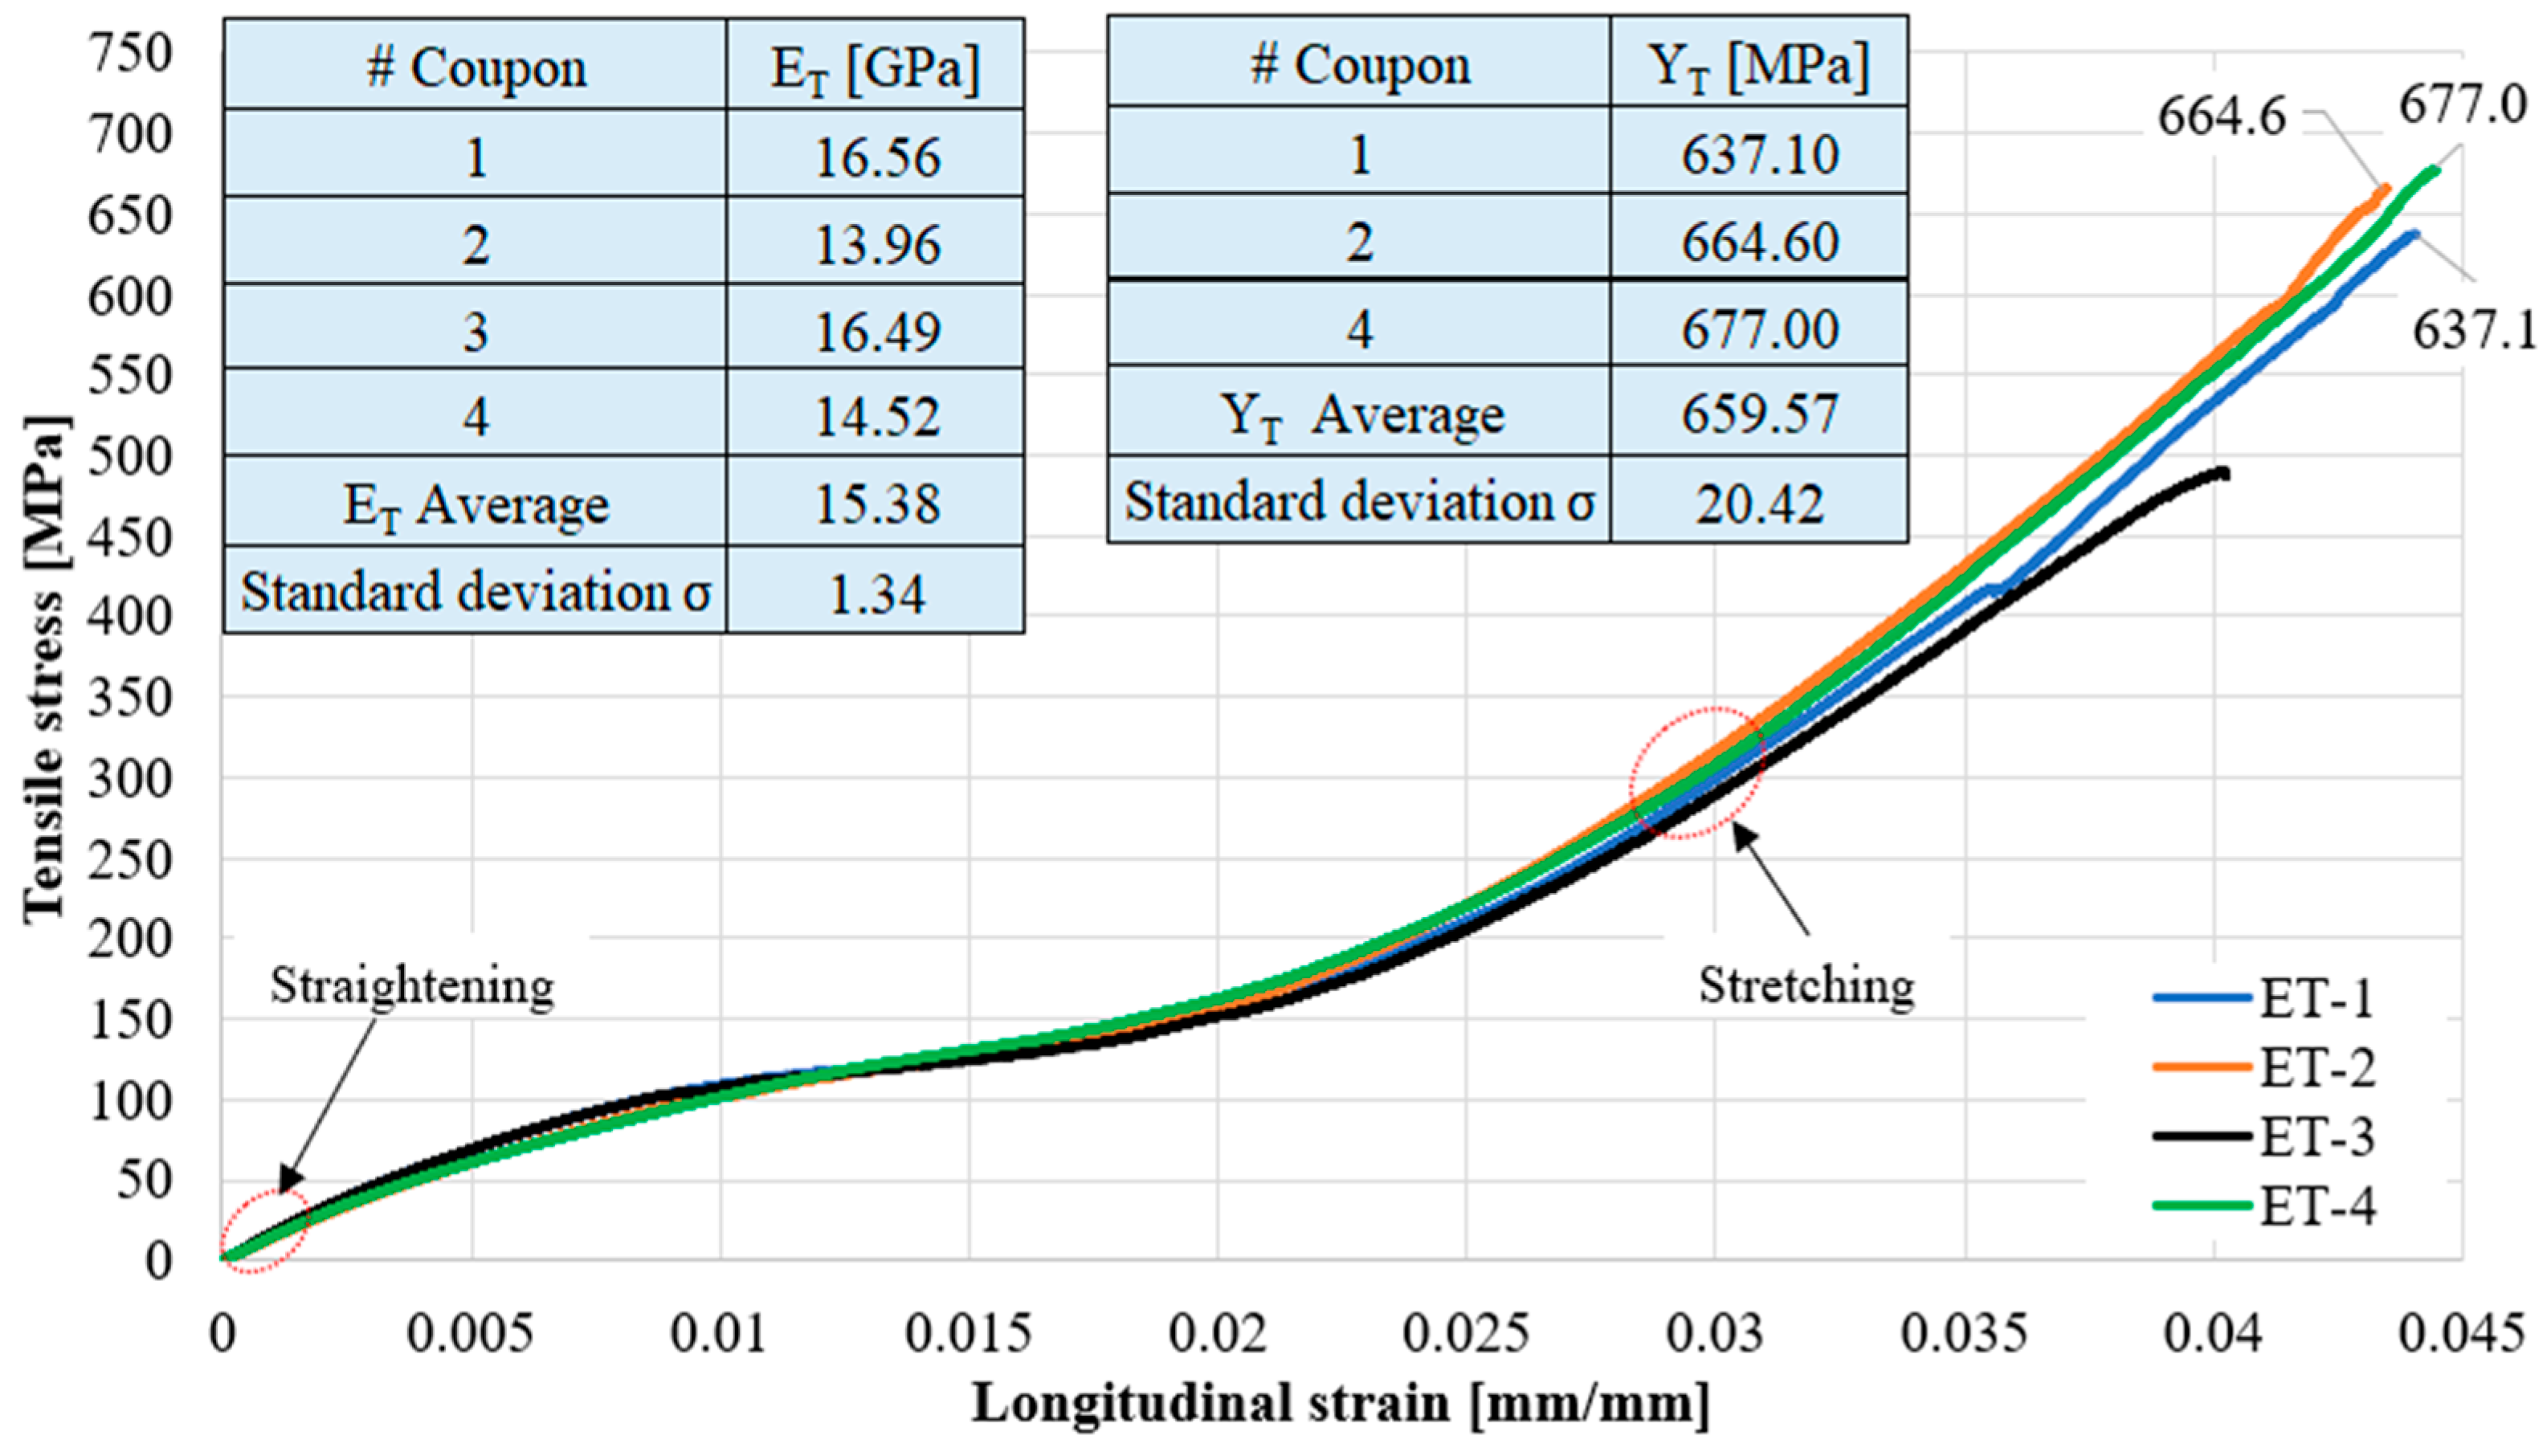
Figure 12 shows the tensile stress–strain curves of four coupons tested at 90° (transversal direction). Due to the debonding of one of the tabs on coupon ET-3, it did not reach the strength and deformation of the other three coupons; however, the four coupons performed similarly in the 0–2% strain range, which was adequate to calculate the transversal elastic modulus (
ET = 15.38 ± 1.34 GPa). The strength calculation (
YT = 659.57 ± 20.42 MPa) was made excluding coupon ET-3.
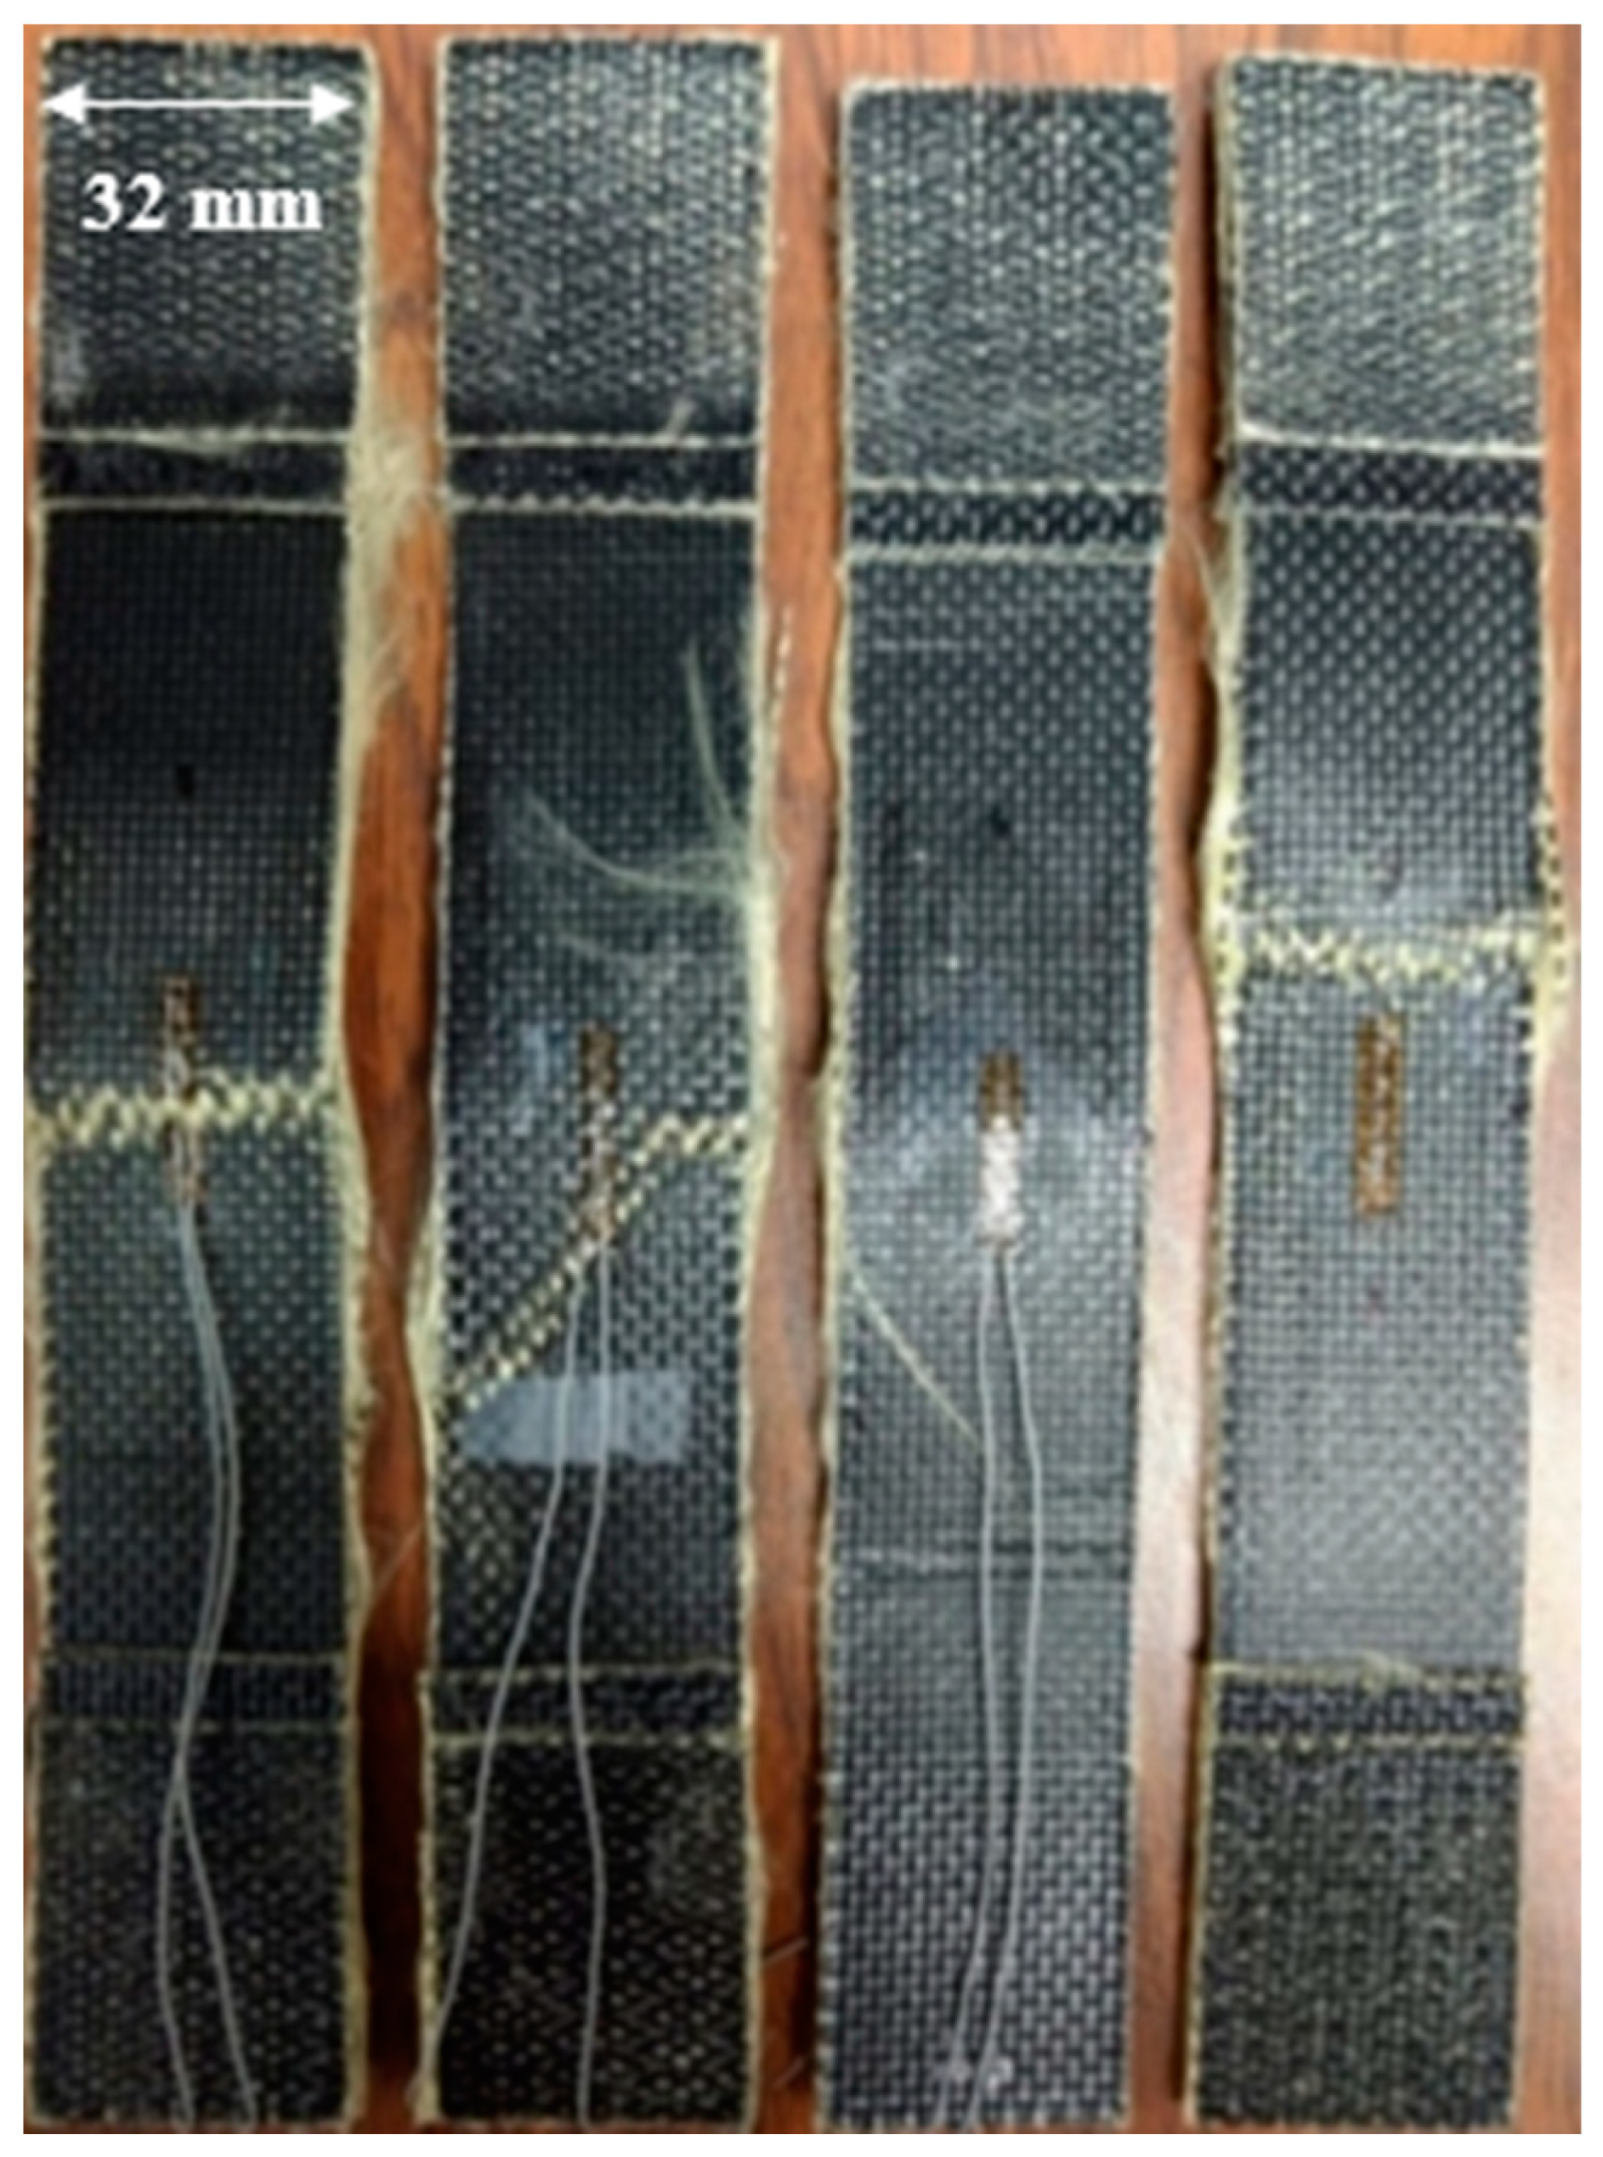
Figure 13 shows the coupons’ appearances after these tensile tests.
Experimental characterization of the stress–strain behavior of the coupons in the 0° and 90° directions revealed two distinct slopes (see
Figure 8 and
Figure 12). The first slope corresponds to the straightening and the second to the stretching of the yarns until the rupture; this behavior was also noted by Gower et al. [
15].
According to our study, the interwoven material is stiffer in the transversal direction than in the longitudinal direction because the former corresponds to the warp direction of the woven fabric; the orthotropic directions of the material were defined in
Figure 2. This difference between
EL and
ET was reported by Ito, who attributed it to the tension control during the weaving manufacturing process [
22]. Indeed, they observed that the yarns in the warp direction were almost straight, while in the weft direction the yarns weaved above and below the warp yarns, giving rise to a small slope or elastic modulus due to the straightening of the yarns.
Figure 14 shows the tensile stress–strain curve of coupons oriented at [+45°, −45°]
s. It was not possible to determine the shear strength of the material from these curves because the tabs of all coupons were debonded. Despite this, it was feasible to calculate the elastic modulus in this direction (
= 2.82 ± 0.21 GPa), as shown in
Figure 15.
Figure 16 shows the coupons’ appearances after these tensile tests. As can be seen, the end edges of the coupons remained straight because symmetry was used in the laminate, which avoided twisting the coupons (right side of
Figure 6). A high longitudinal strain of about 38% (
Figure 14) was calculated because the laminate with the material oriented at 45° had the lowest stiffness, as can be seen graphically in
Figure 17. Once
EL,
ET,
and
νLT were obtained, it was possible to calculate the shear modulus through Equation (19), which gave a value of
GLT = 0.717 GPa. Tsai–Hill failure criterion was used in Equation (21) to determine the shear strength considering a minimum longitudinal strength of 80 MPa (
Figure 14). The Tsai–Hill criterion compares the stresses on the orthotropy system with their corresponding strength direction. The stresses in the orthotropy direction are calculated with the theory of classical laminate model applying loads in the global system (
Figure 7). The minimum shear strength obtained was
S = 40 MPa [
21,
23].
Figure 18 presents a micrography of a damaged coupon far from the rupture region but close to the tab obtained with a VHX-7000 model Keyence
® digital microscope. As can be seen, there is evidence of delamination.
Table 2 summarizes the mechanical properties obtained in the present study, which are compared with other results found in the literature. As can be seen, the elastic moduli, shear modulus and strengths obtained in our work are of the same order of magnitude of those in the literature.


 ,
, 


