Article

Photocatalytic Activities of Methylene Blue Using ZrO2 Thin Films at Different Annealing Temperatures

by
Yuliana de Jesús Acosta-Silva
1,*,
Salvador Gallardo-Hernández
2,
Sandra Rivas
1,
Fabricio Espejel-Ayala
3 and
Arturo Méndez-López
1,*
1
Research and Postgraduate Division, Faculty of Engineering, Autonomous University of Queretaro (UAQ), Queretaro 76010, Queretaro, Mexico
2
Department of Physics, Center for Research and Advanced Studies of the National Polytechnic Institute, P.O. Box 14-740, Av. IPN 2508, Mexico City 07360, Mexico
3
Center of Research and Technological Development in Electrochemistry, Parque Tecnologico Queretaro, S/n, Pedro Escobedo 76703, Queretaro, Mexico
*
Authors to whom correspondence should be addressed.
Submission received: 31 March 2024 / Revised: 17 April 2024 / Accepted: 22 April 2024 / Published: 26 April 2024
(This article belongs to the Special Issue New Advances in Novel Optical Materials and Devices)

Abstract

:
Tetragonal ZrO2, synthesized by the sol–gel method and dip-coating technique, was found to be photocatalytically active for the degradation of methylene blue. The ZrO2 thin films were characterized by X-ray diffraction (XRD), Raman spectroscopy, Fourier transform infrared spectroscopy (FTIR), scanning electron microscopy (SEM), and UV-vis spectroscopy. The photocatalytic degradation of methylene blue was carried out with this material. We identified the tetragonal phase in ZrO2 thin film at different annealing temperatures from 400 °C to 550 °C. The XRD study indicated that the films were monocrystalline in nature with preferred grain orientation along (011) plane and exhibited a tetragonal crystal structure. The crystallite size of the films increased with increasing annealing temperature. FTIR explained the bonding nature and confirmed the formation of the composite. UV-Vis showed the optical absorbance was high in the visible region and the optical band gap value increased with annealing temperature. The photocatalytic experimental results revealed that ZrO2 thin films degraded MB by 20%, 24%, 29%, and 36%, with annealing temperatures of 400 °C at 550 °C for 10 h, respectively. Our results provide useful insights into the development of photocatalytic materials and degradation of methylene blue.

1. Introduction

According to data from the World Bank, 3.6 billion people are unable to obtain proper sanitary facilities, and around 2 billion cannot obtain safe drinking water [1]. Over 80% of wastewater from human activity is thrown untreated into rivers and seas, and 30% of individuals lack access to safe drinking water. Various factors such as population growth, intensive use of water, rainfall variability, and pollution put the availability of drinking water at risk and, thus, economic growth, poverty eradication, and sustainable development; for these reasons, ensuring access to water and its sanitation is the sixth objective of the 2023 UN agenda to achieve sustainable development [2].
Dyes are a major pollutant in water, with over 100,000 commercially available. Ten percent of these are used in textiles, but they are also used in food, paper, and pharmaceuticals [3]. Methylene blue (MB) is a widely used dye for cotton, paper, wood, and silk [4]. Although MB is used in medical treatment within safe limits [5,6,7,8,9,10], it is not controlled when disposed of in water, making it hazardous. MB has been reported as toxic, carcinogenic, and can cause respiratory, digestive, skin, and eye irritation, anemia, and blindness [4,11,12].
Textile effluents can be treated using physical, chemical, or biological methods, or a combination of these. Physical methods like absorption are commonly used, as well as sedimentation, screening, nanofiltration, reverse osmosis, electrolysis, ion exchange, irradiation, coagulation, and flocculation [3,12]. Biodegradation and biocatalytic degradation are common biological methods, but their effectiveness can be influenced by substances like heavy metals, pesticides, herbicides, and textile effluent metal complexes. Chemical methods include chemical precipitation, electrokinetic coagulation, advanced oxidation processes, photo-Fenton and Fenton’s reagents, photo-assisted methods, and photocatalytic degradation [11,12]. While all methods have their advantages and limitations [13], advanced oxidation processes are suitable for degrading stable and non-biodegradable pollutants like MB.
Hydroxyl radicals (OH-) are generated during advanced oxidation processes (AOPs) that can oxidize organic contaminants in a speed range of 108–1010 M−1·s−1 [14]. Among the different advanced oxidation processes [15,16], photocatalytic degradation is one of the most used to remove MB [11]. When a semiconductor material is exposed to light, a process known as photodegradation occurs. If the photons that are absorbed have an energy that is higher than the gap (Eg) or equivalent, electron–hole pairs are generated, whereby energized electrons attack oxygen and form superoxide radicals (O2) while the holes generate OH- radicals by oxidation of the H2O molecules adsorbed on the surface that also degrade methylene blue [12].
TiO2 is the photocatalyst that has been investigated the most due to its low toxicity, chemical stability, and ease of synthesizing in various morphologies; however, its use is limited to the UV region (λ < 387 nm) [17,18,19,20]. So, the development of photocatalysts has focused on achieving materials capable of operating in the visible light region [16]. Zirconium oxide (ZrO2) is an n-type semiconductor that has gained interest as a photocatalyst to extract organic compounds from water. ZrO2 is resistant to corrosion, and is thermally and chemically stable [21], making it a material of great technological importance that has been used in sensors [22,23,24] and fuel cells [25,26,27] and as a catalyst [28], among other applications. ZrO2 presents different phases: monoclinic, tetragonal, and cubic [21,29]. Each phase has specific characteristics that make it appropriate for certain applications; for instance, the tetragonal phase is more suitable for photocatalytic reactions [30]. TiO2 in visible light range activity has been increased with the application of ZrO2 photocatalysis [31,32], and also can improve the photocatalytic properties of other materials [33] when it is used as a dopant. The band gap is an important factor to determine the efficiency of photocatalysis; ideally, a low band gap means better photocatalytic activity [34]. The ZrO2 band gap is usually reported to be around 5 eV; however, this has been found to be affected by the synthesis method [35]. For instance, Dawoud reported ZrO2 NPs synthesized by an eco-friendly method with a 6 eV band gap and 5.6 eV for ZrO2 doped with silver [36]. Both materials were evaluated as photocatalyst for rhodamine B degradation. Using microwave solvothermal synthesis, band gap values as low as 3.67 eV were achieved for tetragonal ZrO2 NP’s [37]. Oluwabi et al. found band gap values between 5.39 and 5.68 eV for chemical spray pyrolysis-deposited thin films. The band gap reduction was achieved by increasing the deposition and annealing temperatures, which was attributed to the structural changes from the amorphous phase to the crystalline phase [38]. The capacity of ZrO2 nanoparticles to degrade MB has been studied, reaching a degradation of the contaminant greater than 94% [39,40]. Doped ZrO2 has also shown photocatalytic activity using visible light [30,41]. Although ZrO2 can be easily synthesized as nanoparticles, a thin film could be more suitable for water and air treatment [42].
Thin film technology has diverse applications, from decorative to advanced uses in microelectronics, photovoltaic, optics, and biomedical applications [43]. Deposition methods, physical (vacuum evaporation and sputtering) or chemical (gas phase and liquid phase), impact the qualities and attributes of the films. Liquid-phase methods like sol–gel, dip coating, and spin coating are gaining attention due to their simplicity and affordability. Dip coating produces thin uniform layers that are easy to control and scale, with low cost and minimal waste [44]. Sol–gel is a low-temperature and inexpensive technique used to synthesize oxide materials as nanostructures and thin films [45].
In this paper, we describe a facile synthesis of ZrO2 thin films at an annealing temperature (AT) of 400 to 550 °C. Such ZrO2 thin films exhibit good deposition surface, size, and crystallinity. During photocatalytic degradation of methylene blue (MB) under UV irradiation, the ZrO2 at 550 °C samples reveal high photocatalytic activity compared with the sample at 400 °C.

2. Experimental Details

2.1. Substrate Cleaning

The cleaning process of the substrates was carried out according to the procedure of Jothibas et al. [46]. Glass substrates (Corning 2947, Corning, NY, USA) were first treated with a thorough cleaning process using a deionized solution through ultrasonic treatment for several minutes. Following this, they underwent sequential immersion processes: first in a solution of chromic acid (H2CrO4) for 3 h, and after that for a further 1 h at 100 °C in a nitric acid solution. Subsequently, using the dip-coating technique on previously cleaned substrates, ZrO2 thin films were deposited (dipping speed 2 cm/min).

2.2. ZrO2 Thin Films

A precise quantity of nitric acid (HNO3) was added to a 100 mL beaker. Then, 40 milliliters of ethanol was added while being stirred magnetically for 15 min to create the precursor solution, which was essential for the film deposition process. To obtain a translucent yellowish solution, 9 mL of zirconium propoxide was added to the mixture and stirred for an additional hour. Finally, the precursor solution was aged for one day. During the coating process, the substrates were removed at 2 cm/min. Five coats were used to deposit ZrO2 films, and each layer was dried in an open environment oven for three minutes. Once the required number of coatings had been applied, the films were dried at 250 °C for 30 min, before being annealed at 400, 450, 500, and 550 °C; 4 samples were obtained at different temperatures.

2.3. Structural, Optical, and Morphological Characterization of the Films

UV-Vis measurements were carried out using an Evolution 220 UV-Vis spectrophotometer (Thermo Scientific, Waltham, MA, USA). X-ray diffraction experiments were carried out using a Rigaku SmartLab instrument that features a Photon Max high-flux 9 kW rotating anode X-ray source that employed a Cu-Kα radiation with a wavelength of 0.15405 nm in the 20 ≤ 2θ ≤ 80° range. The voltage and current settings were 30 kV and 40 mA, respectively. The samples were continuously scanned with a step size of 0.02° (2θ) and a count time of 1 s per step. Structural properties were also studied using Raman spectroscopy that collected data using a Labram Dilor Raman spectrometer equipped with a He-Ne laser exciting source operating between wavelengths of 150 and 800 nm at ambient temperature (AT). Using a scanning electron microscope (SEM, JEOL JSM-6300, JEOL, Tokyo, Japan), surface pictures were acquired. A Perkin Elmer Spectrum GX spectrometer operating at 4 cm−1 resolution was used to obtain the Fourier transform infrared spectroscopy (FT-IR) (PerkinElmer Inc., Wellesley, MA, USA) spectra in the wavenumber range of 4500–650 cm−1.

2.4. Photocatalytic Activity Evaluation

Methylene blue (MB) discoloration kinetics of solutions under UV light were used to calculate the photocatalytic activity (PA) at room temperature (MT). In this manner, a conventional quartz cell was filled with 3 mL of MB solution. Then, a ZrO2 sample was introduced in the cell with a 2 cm2 area. For every thin film under investigation, five of these were made. The irradiation light was produced by a 15 W lamp that had a length of 254 nm (using a G15T8 germicidal lamp as the stimulating source). The quartz cells and the lamp had 5 cm of separation.

3. Results and Discussion

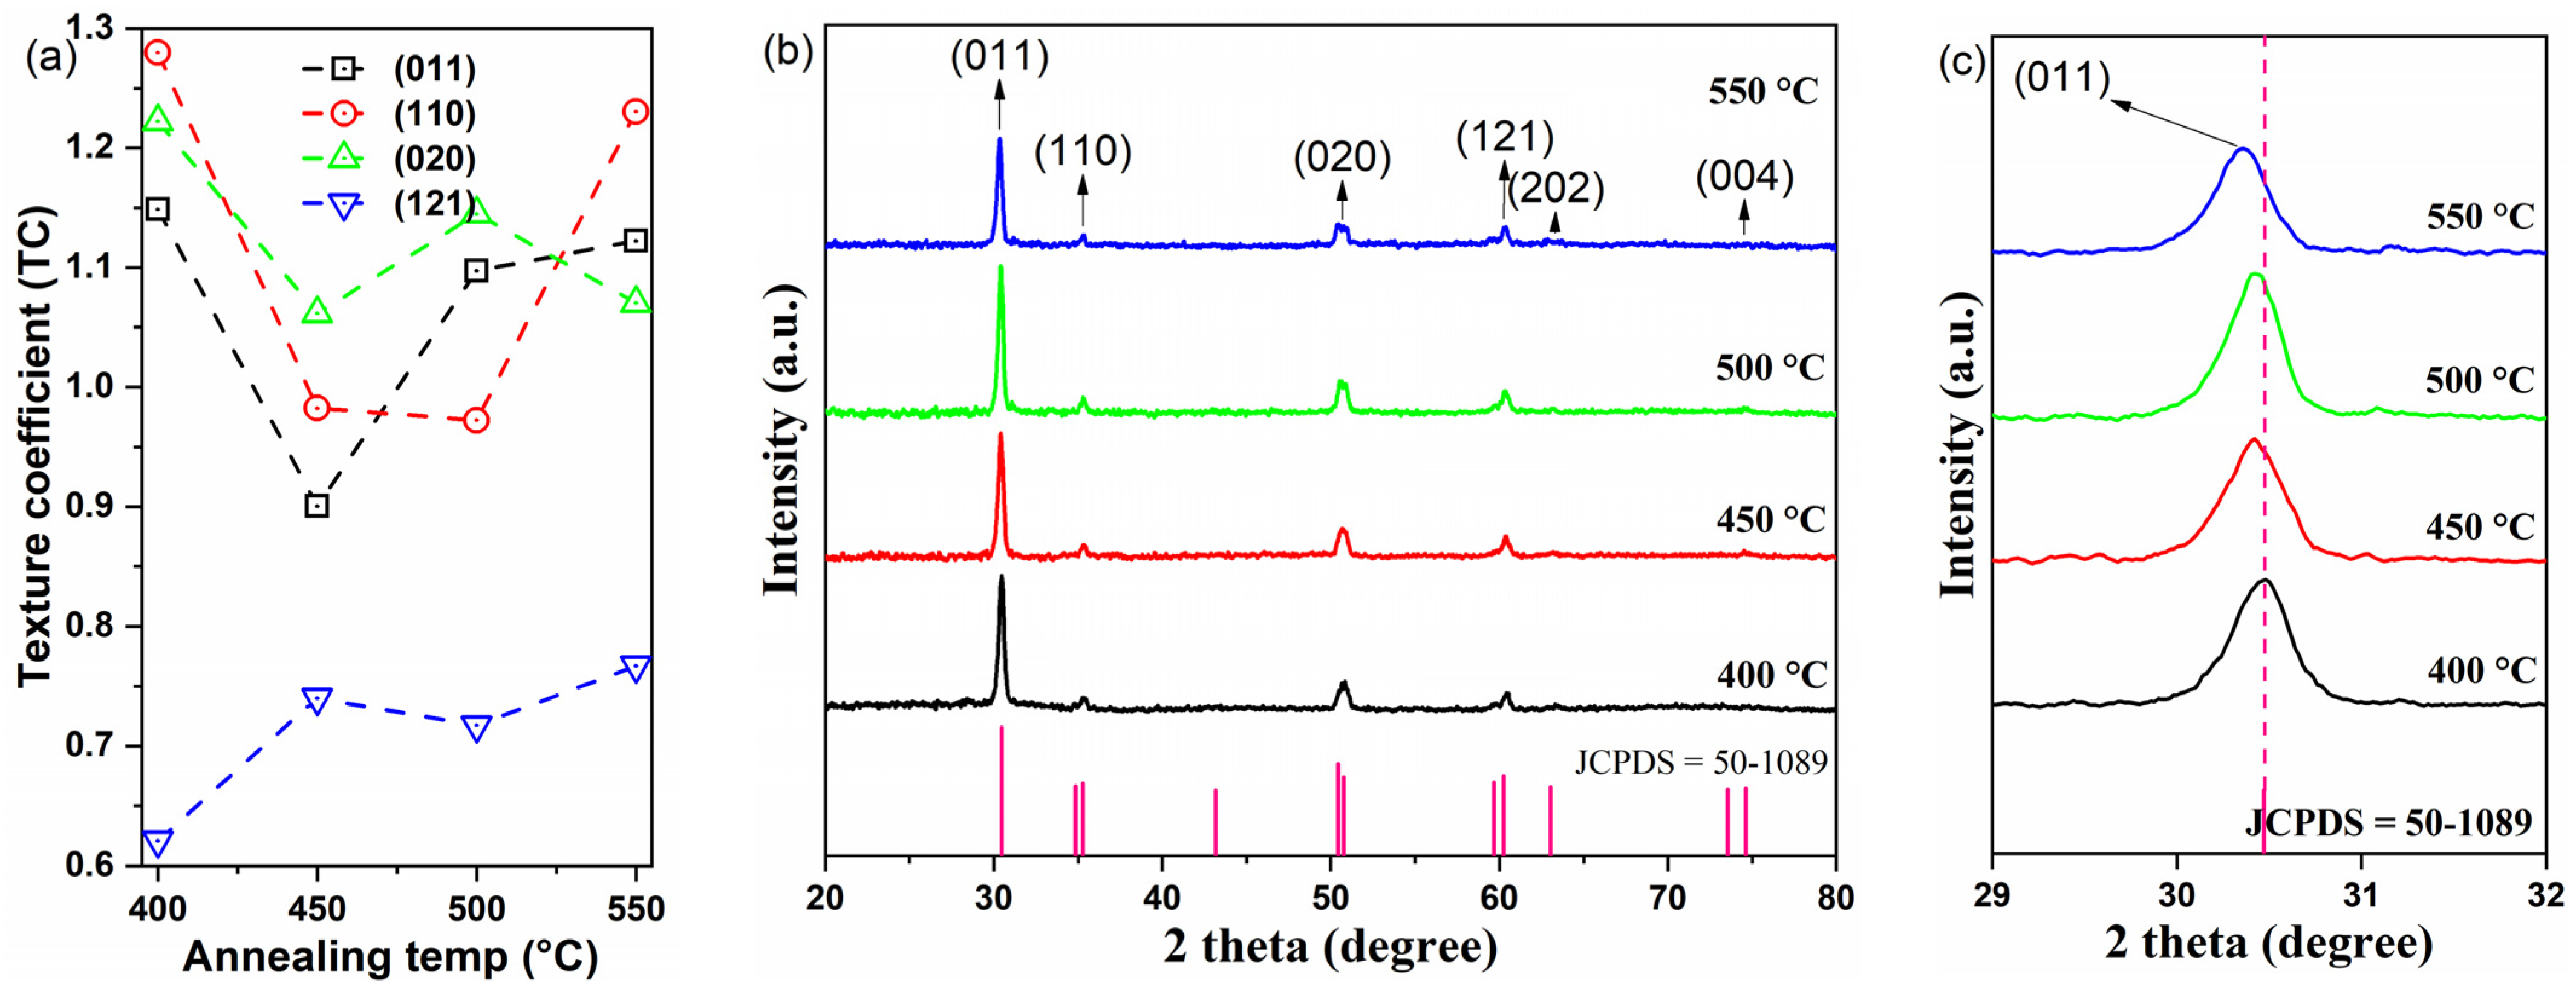
3.1. Texture Coefficient (TC)

Using the intensity data, the ZrO2 thin film texture coefficient (TC) for each crystal plane is determined by applying the following Harris formula [47]:
T C h k l = I ( h k l ) / I 0 ( h k l ) 1 N N I ( h k l ) / I 0 ( h k l )
where N is the number of planes considered, I ( h k l ) represents the intensity of an individual plane, I 0 ( h k l ) represents the reference intensity of the JCPDS data file for each plane (011), (110), (020), and (121). It is thought that the films exhibit random orientation crystallites, comparable to the JCPDS reference data, if TC (hkl) = 1. On the other hand, values larger than one (hkl) indicate the crystal plane’s preferred orientation. For the matching plane (hkl), the majority of particles are missing at 0 < TC (hkl) < 1. The preferential development of grains perpendicular to the hkl plane direction becomes increasingly significant when TC (hkl) shows an increasing trend. The ZrO2 film annealing temperature (AT) is plotted versus TC. Every film displays a different set of traits. AT has a significant impact on the film’s orientation, as shown in Figure 1a. At 400 °C, ZrO2 grows more in the (110) plane and less in the other planes when the sample is annealed. Nevertheless, planes (011) and (020) are outstanding at AT of 450 °C and 500 °C. It is usually preferable to be aware of the film’s orientation when dealing with polycrystalline ZrO2 thin films. AT alters the development of the crystal plane. The (121) plane shows a low TC regardless of the AT.

3.2. X-ray Diffraction

In Figure 1b, the ZrO2 thin-film XRD pattern is shown. The 2θ range of 20–80° is where the samples’ XRD patterns are captured. The image shows that planes (011), (110), (020), (121), (202), and (004) correspond to the most notable peaks of the sample, which are detected at diffraction angle 2θ of 30.37°, 35.34°, 50.53°, 60.34°, 63.13°, and 74.55° of the tetragonal structure of ZrO2. In terms of space group P42/nmc, it agrees well with the crystallographic data card (JCPDS 50-1089) [48]. The spectrum unequivocally demonstrates the absence of any further impurity peaks. The thin film’s good crystalline quality is indicated by the strong diffraction peaks. A lost peak is found in the (004) planes when the ZrO2 samples are annealed. The XRD pattern indicates that uploading the AT from 400 °C to 500 °C significantly improves the film’s crystallinity (001) in the plane, at 550 °C decreased. The phenomena of left shift (towards the lower 2θ angle) of XRD spectral peaks (001) caused by an increase in annealing temperature can be observed in Figure 1c.
The lattice ( a and c ) constants of the thin films can be computed using the formula that follows:
d = a h 2 + k 2 + l 2 a 2 / c 2
where d is the interplanar distance and ( h , k , l ) are the Miller indexes. The equivalent equation is used when the crystal structure is tetragonal and has axes a and c:
sin 2 θ = λ 2 4 a 2 h 2 + k 2 + λ 2 4 c 2 l 2
where λ is wavelength and θ is the diffraction angle.

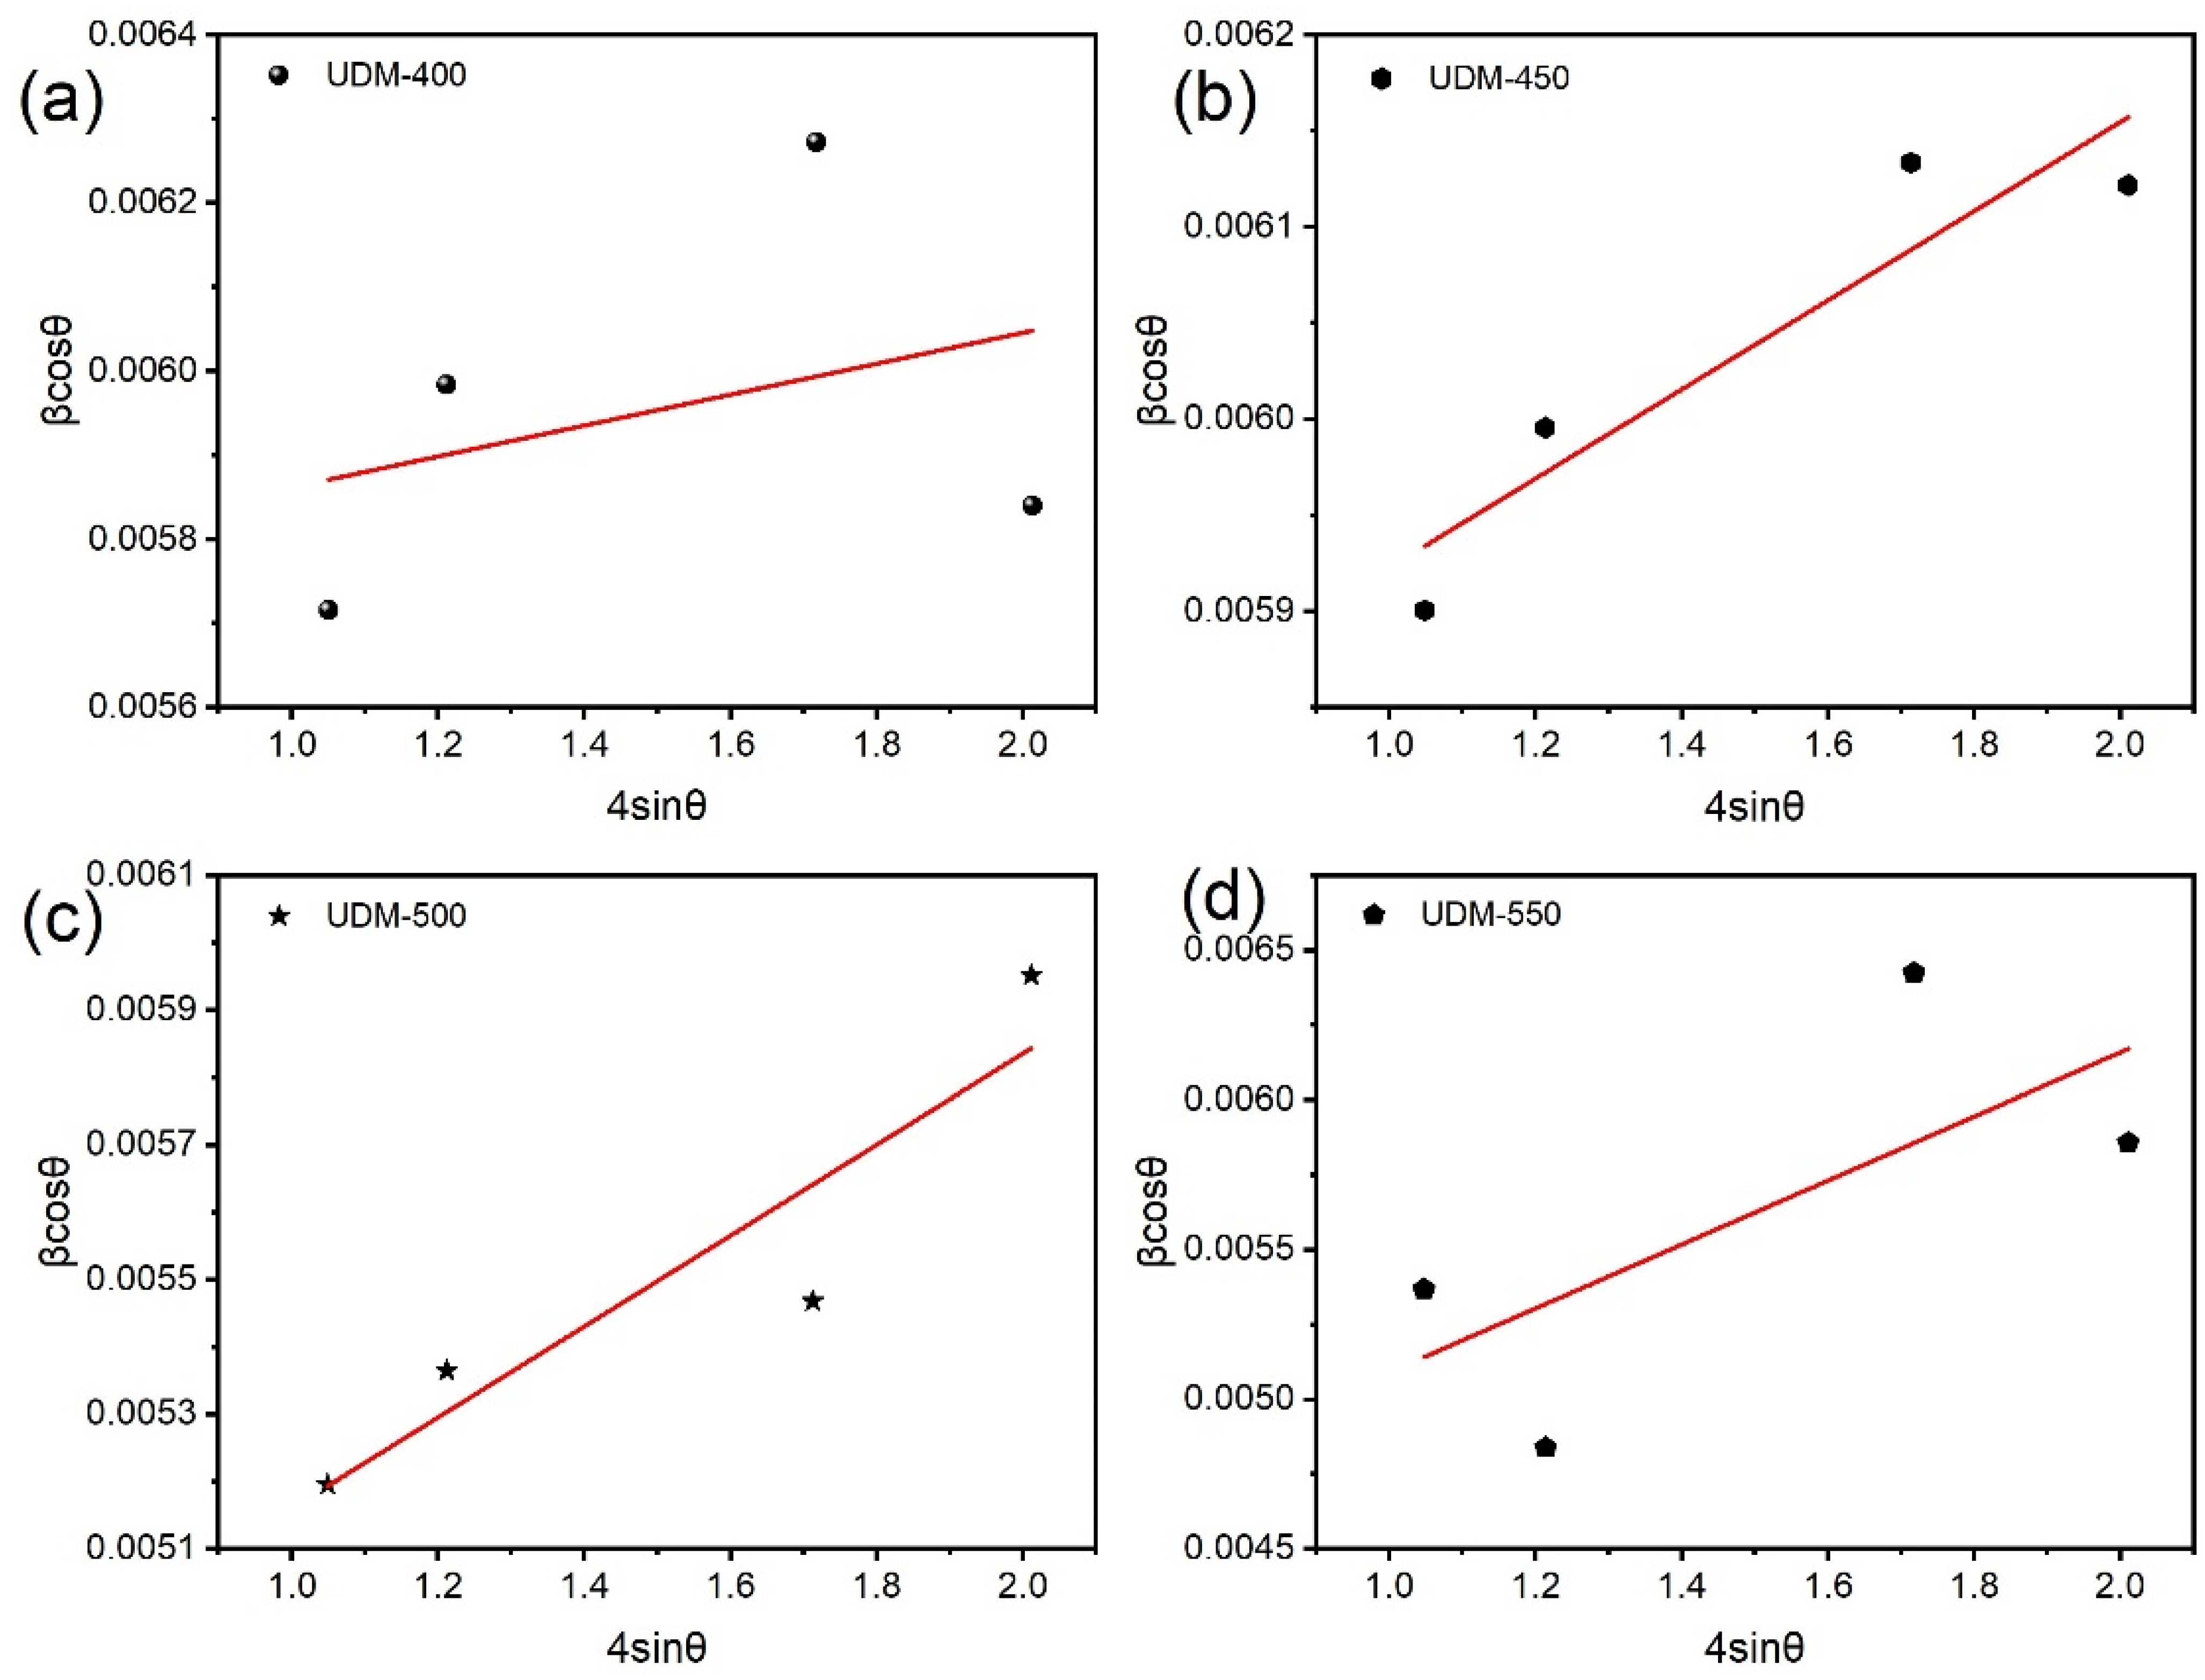
3.3. Calculation of Crystallite Sizes and Microstrain

All the sharp peaks show that each sample is crystalline, as shown in Figure 2a. The films’ crystallite sizes (Equation (4)) are determined using Scherrer’s formula [49]:
D = 0.9 λ β cos θ
where D is crystallite size, λ is wavelength, β is half-width full maxima, and θ is diffraction angle. According to reports, oxygen vacancies cause the crystalline size to decrease, and these vacancies prevent the nanoparticles from growing any larger because of stress [50,51]. To confirm the lattice strain or micro-strain ( ε ) in the films, the Stokes–Wilson formula [52] is used:
        ε = β 4 tan θ
Furthermore, the dislocation density (Formula (6)) of various films under various conditions may also be computed using XRD spectra, which can be performed by utilizing the following formula, where δ represents the dislocation density [53]:
δ = 1 D 2
Lattice strain (ε) is the change in crystalline material’s lattice characteristics. On the other hand, dislocation density ( δ ) is the ratio measuring the number of dislocation lines per unit area of surface and is directly related to crystallite diameter, as shown in Figure 2a. Furthermore, Figure 1c XRD profiles show peak shift and line broadening due to micro-strain in films. On the other hand, using the following formula, as suggested by Williamson and Smallman [54], the dislocation densities ρ are determined while accounting for the micro-strain and crystallite size, as shown in Formula (7):
ρ = 2 3   ε b   D
where b is the Burgers vector. Figure 2 indicates that, while the crystallite size (D) exhibits the opposite trend to the micro-strain ( ε ), dislocation density ( δ ), and dislocation density ( ρ ) of ZrO2 thin films, they all follow the same trend as the AT increases.

Williamson–Hall Method (W-Hm)

The W-Hm approach assumes that both the size effect and the strain effects are responsible for the line broadening β of the diffraction peaks. Therefore, Formula (8) can be used to express the overall line broadening β of the diffraction peaks:
β = β s i z e + β s t r a i n
Here, ZrO2 thin-film data are analyzed using W-Hm under the assumption of the uniform deformation model (UDM). According to UDM, the strain is thought to be isotropic in nature or uniform in all crystallographic orientations [55]. The XRD pattern’s peak broadening is influenced by this intrinsic strain, and this strain-induced peak broadening is represented by Formula (5). Combining Formulas (4) and (5) can obtain the total broadening Formula (8), which can be rewritten as Formula (9):
β = 0.9 λ D cos θ + 4   ε tan θ
After reorganizing Formula (9), we obtain Formula (10):
β cos θ = 0.9 λ D + 4   ε sin θ
Formula (10), often known as UDM, is a straight-line equation that plots βcos θ against 4sin θ. The plot of Figure 3 displays this plot. The crystalline size D is determined using the slope of the plot and the y-intercept of the linearly fitted data. The UDM plot’s slope is found to be positive, indicating lattice expansion and creating intrinsic strain in the nanocrystals as a result. The slope and y-intercept of the linear profile fit of Figure 3a–d are identified as the values of ε and D , respectively.

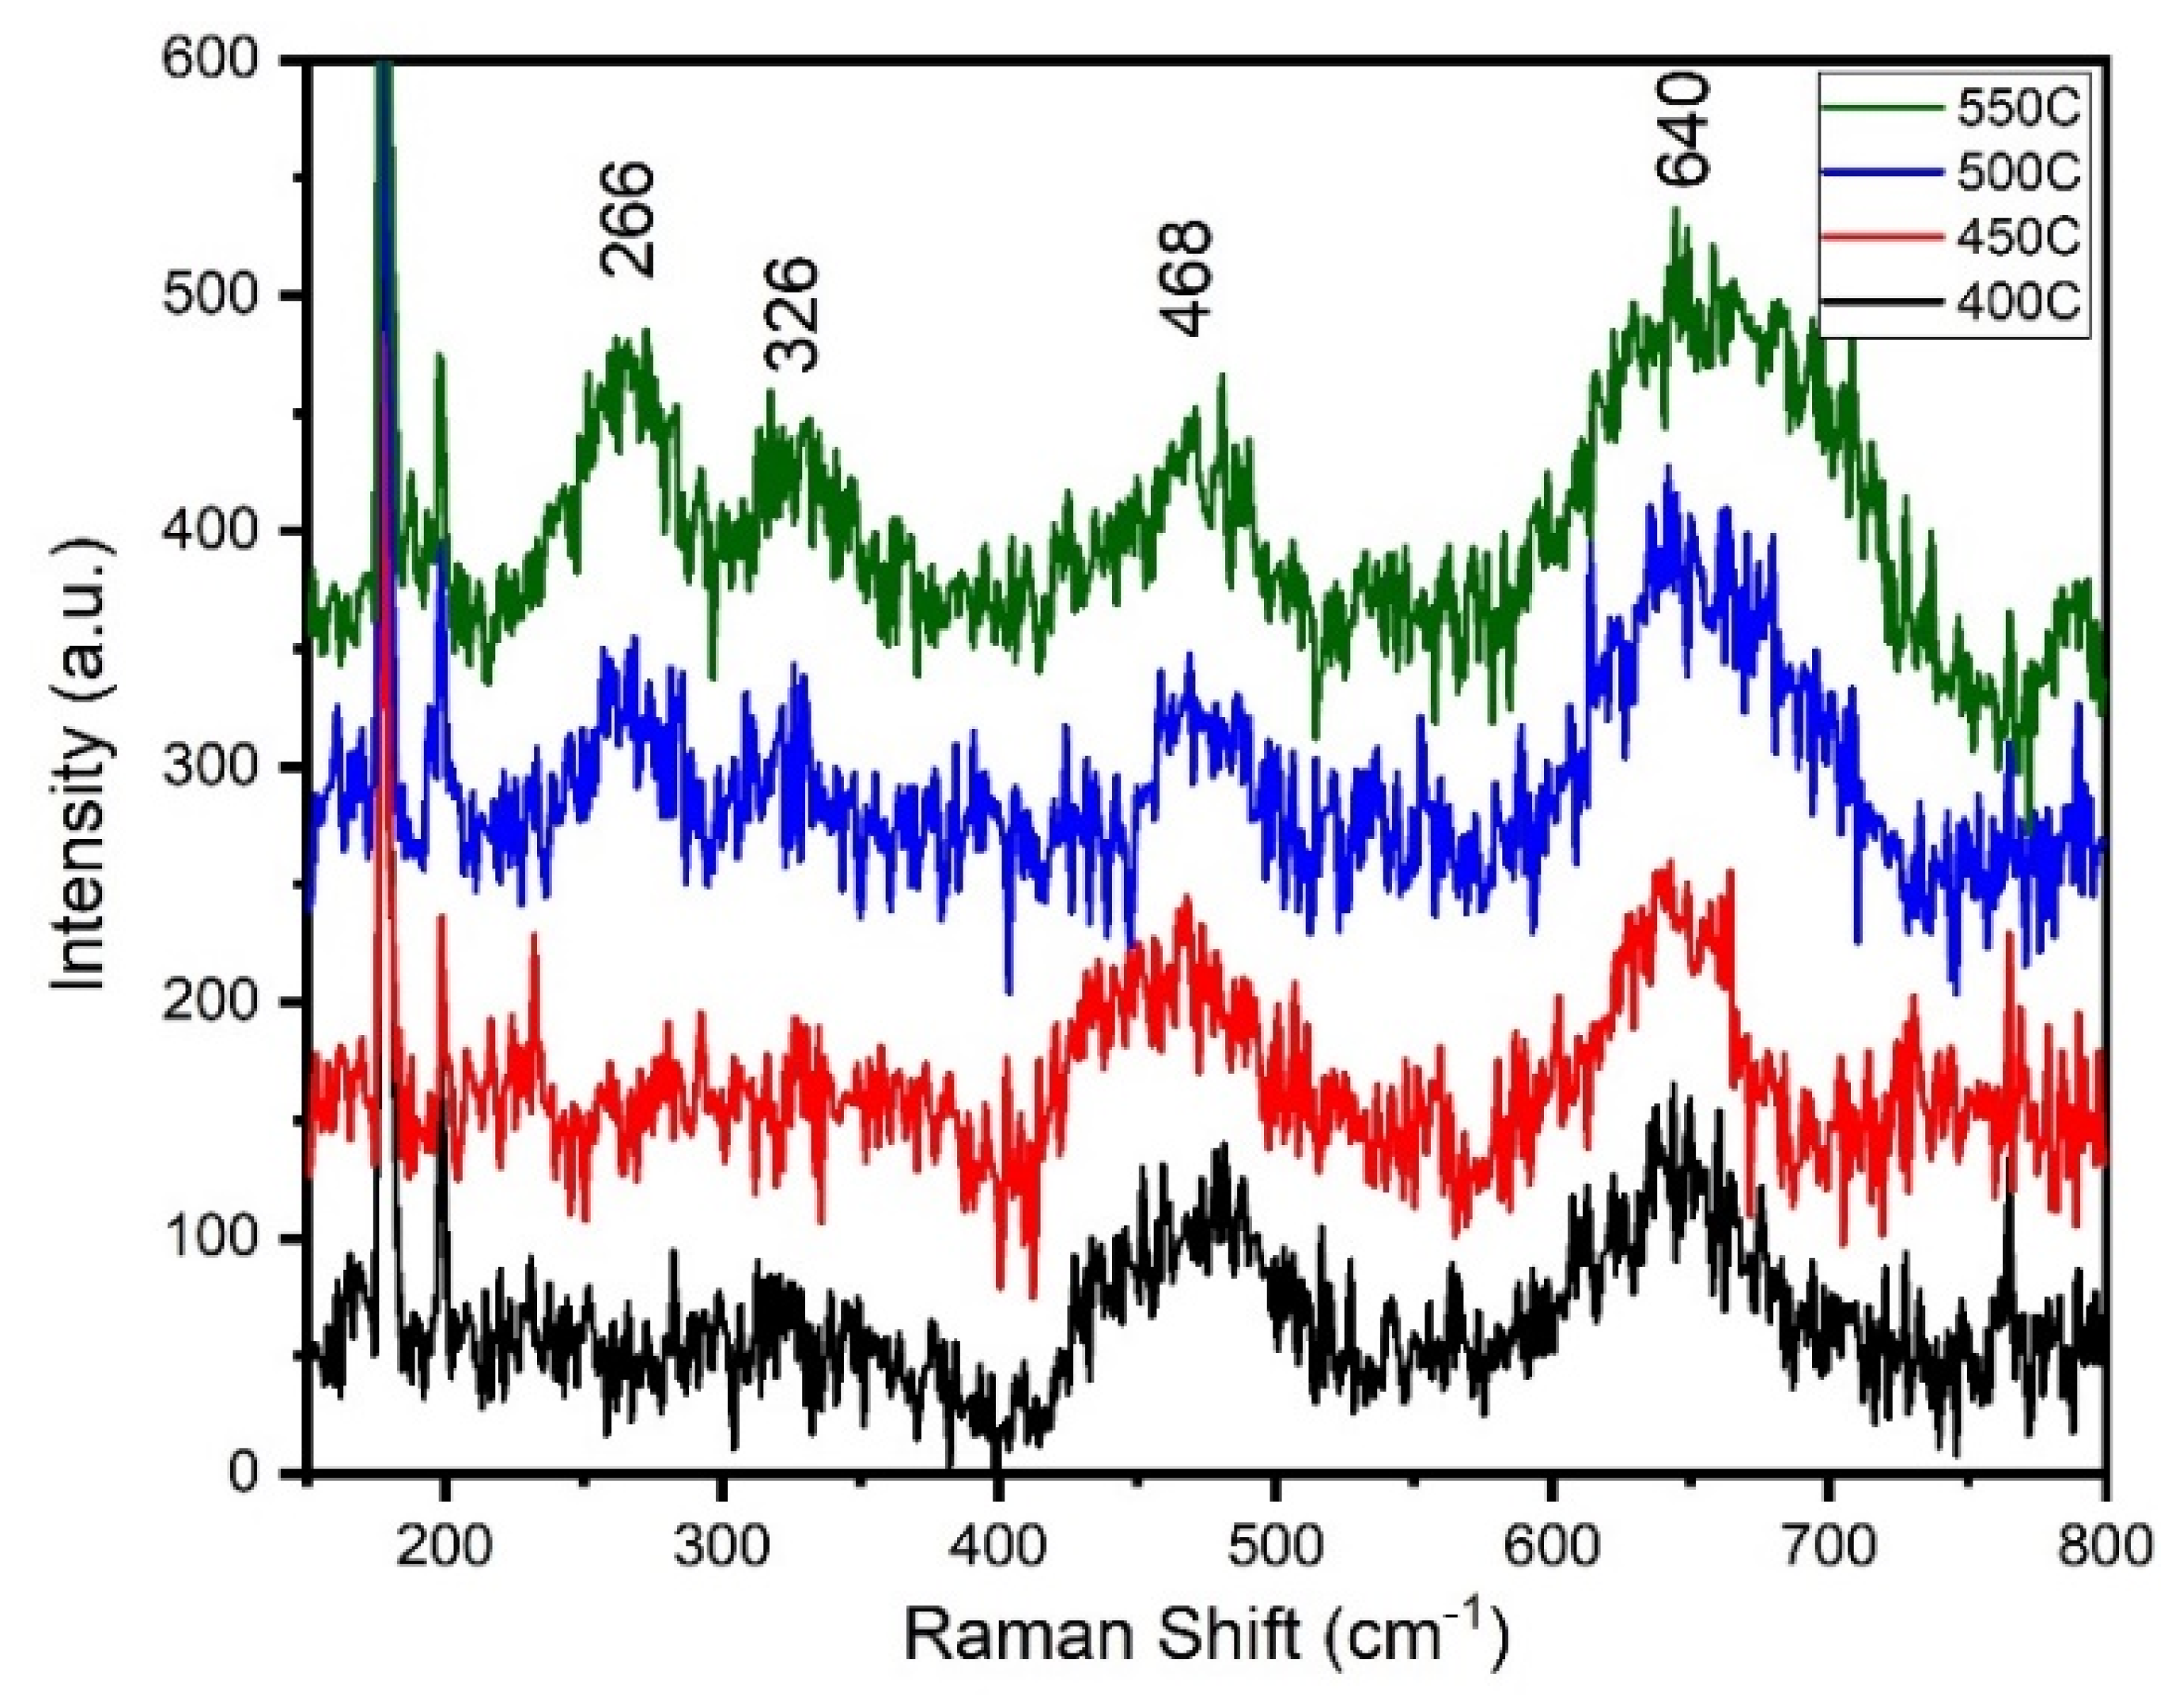
3.4. Raman Spectroscopy

The micro-Raman measurements clearly show one phase of ZrO2 (see Figure 4). The Raman spectra show peaks that correspond to the tetragonal phase in the temperature range of 400 to 550 °C [56]. The spectra of the samples that are heated to 500 °C and above show characteristics of the tetragonal phase; it appears that ZrO2 crystallizes directly to the tetragonal phase. The samples that are annealed at 400 °C and 450 °C only show two peaks at 468 and 640 cm−1. The peaks found at around 266 (Eg1), 326 (B1g), 468 (Eg2), and 640 (Eg3) cm−1 are typical ZrO2 tetragonal phase peaks [57]. The lack of other major peaks of ZrO2 (308 and 539 cm−1) is most likely caused by the tetragonal phase we obtain having more symmetry than other similar works or by overlapping peaks [58]. Ehrhart et al. noted that ZrO2 exhibits a gradual change from a tetragonal to a monoclinic phase, which is typically the stable form at room temperature, between 600 and 1100 °C [56]. At temperatures below 1100 °C, roughly the typical temperature for the transition between monoclinic and tetragonal phases, this tetragonal phase is metastable [59,60].

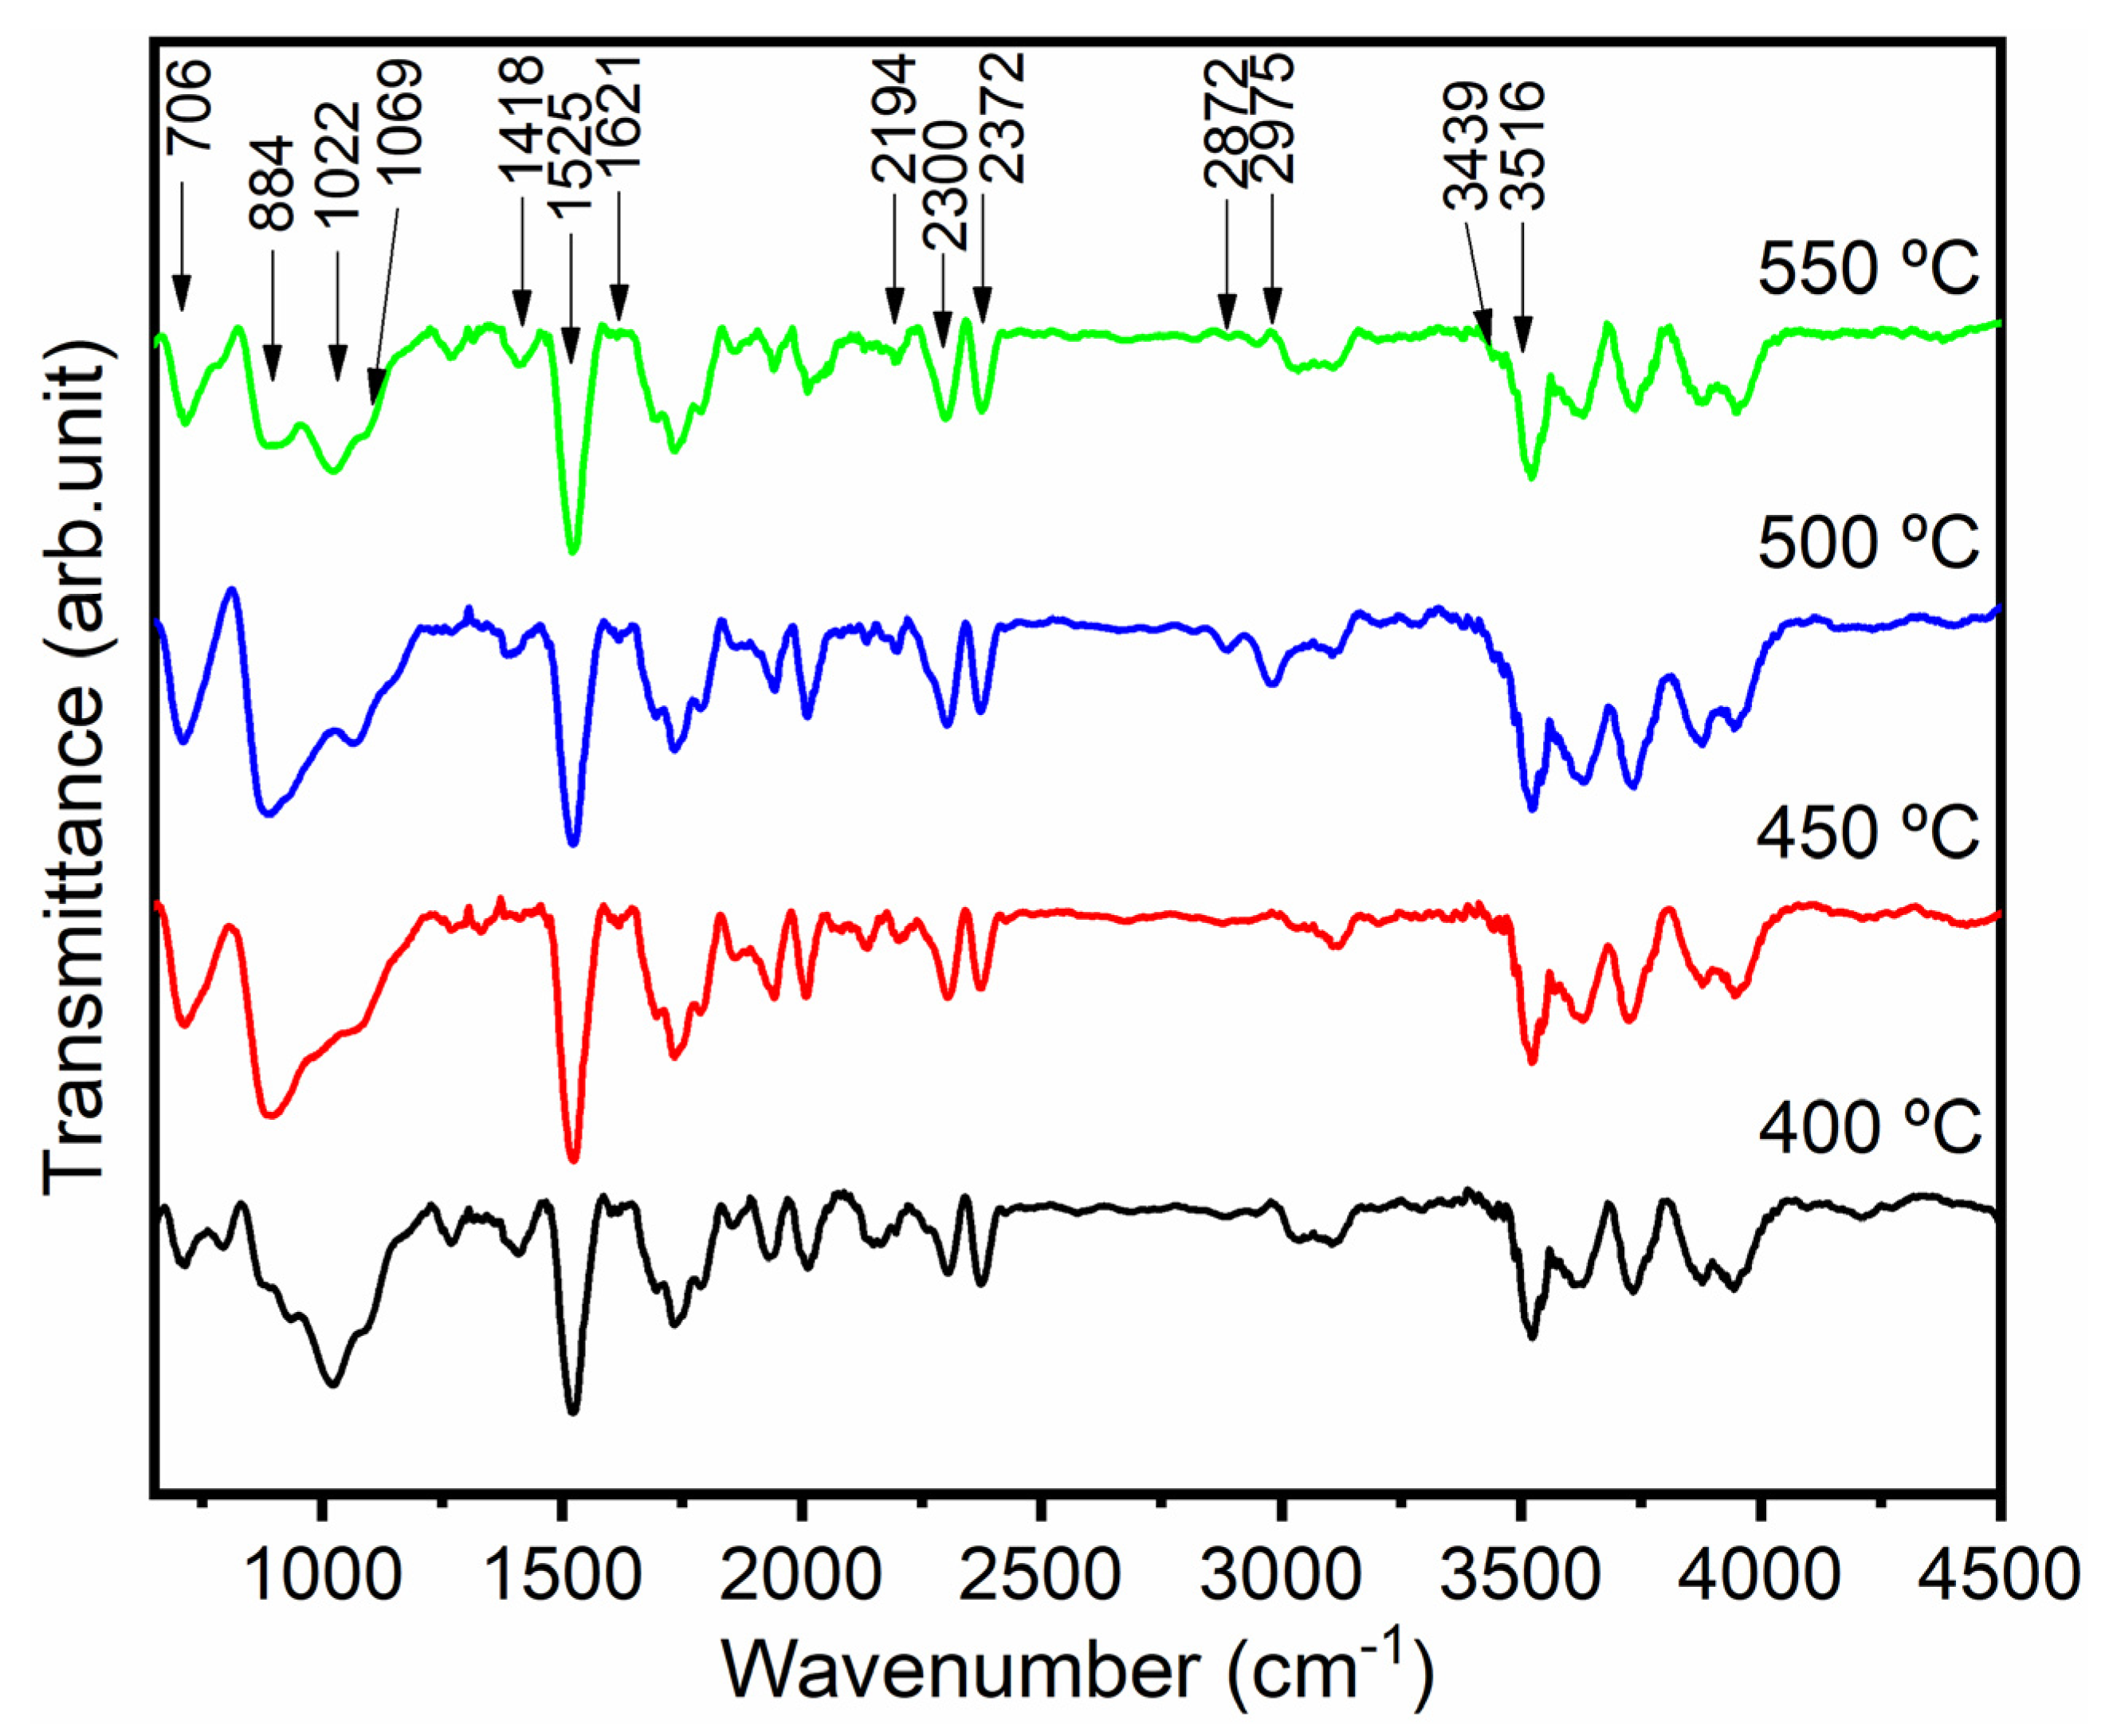
3.5. FTIR Spectroscopic Analysis

Fourier transform infrared (FTIR) spectra have been obtained to investigate the structural properties and the phonon vibration modes of thin films in the range from 650 to 4000 c m 1 . The measured spectra at different ATs (400 °C to 550 °C) are presented in Figure 5. The FTIR spectra of the films show tetragonal phases that can be observed in the region below 1000 cm−1. These spectrums are in accordance with the obtained results from XRD analysis (Figure 1b). The peak speculated at 706 c m 1 is connected to the Zr-O bond stretching mode [61,62]. For the peak found at 884 c m 1 , we take into account Imanova et al., who indicated the presence of a Zr-O bond supported by the tetragonal form of ZrO2 [63]. The peak around 1022 c m 1 belongs to the zirconyl groups [64,65]. The line at 1069 c m 1 is due to the zirconyl bonds (Zr=O) [66]. The peak of the 1418 c m 1 region corresponds to O–H bonding, and the predominant band at 1525 c m 1 might be because of moisture adsorption [67]. The peak of 1621 c m 1 corresponds to bonding vibrations of the water adsorbed [68]. The band observed at 2194 c m 1 is assigned to the various carbonyl groups present in films [69]. The characteristic peaks at 2300 c m 1 and 2372 c m 1 are attributed to the trace of CO2 adsorption on the sample [70]. The band at 2841 c m 1 indicates the asymmetric stretching vibrations of –CH [69]. The absorption bands at 2927 c m 1 and 3439 c m 1 are due to the stretching vibrations of the water molecule OH groups [71]. The peak appearing at 3516 c m 1 is assigned to the hydroxyl group of alcohol [72]. The elimination of residual organic components from the thin films following thermal processing is the reason for the occurrence of well-resolved peaks in the FTIR samples.

3.6. Scanning Electron Microscopy (SEM)

Surface morphological at macroscopic 10 μm scale (SEM) images of ZrO2 thin films at different ATs of 400 °C to 550 °C are given in Figure 6a, b, c, and d, respectively. The thin films demonstrate a compact adherence to the glass substrate. It can be seen that the grain size of the film is quite small, indicating low crystallization. The results of SEM are consistent with the X-ray results. At low temperatures, no cracks appear; however, as the temperature increases, cracks form (Figure 6c,d). The grains or granules that form on the surface of Figure 6a film are seen to have an abundance of sizes and shapes; however, as the annealing temperature increases, the grains become reduced (Figure 6d). The thickness of all ZrO2 samples is very similar since they have the same number of layers; the thickness average of the films is determined ~181 nm from the cross-section SEM images (Figure 6e).

3.7. UV-Vis Analysis

Analysis using UV-Vis spectroscopy (Figure 7) of thin films of ZrO2 deposited on glass substrates at different ATs, such as 400 °C, 450 °C, 500 °C, and 550 °C, reveals significant variations in the optical properties of the films depending on the deposition temperature. At lower temperatures, such as 400 °C, a gradual transition towards the formation of a crystalline structure is observed, reflected in an increase in absorbance in the UV-visible range. As the annealing temperature increases to 450 °C and 500 °C, there is an increase in the intensity of absorption peaks, indicating a higher densification and crystallization of the ZrO2 films. This phenomenon can be associated with the reduction of structural defects and the improvement in the film’s homogeneity. However, at higher temperatures, such as 550 °C, a decrease in absorbance is observed, suggesting the possible formation of secondary phases or the loss of some optically active components.
The spectral transmittance (T) data are used to calculate the absorption coefficient (α) (Formula (11)) [73]. Subsequently, we calculate the optical band gap.
α = 1 t ln 1 T
The film’s thickness is t. The crystalline nature of the films is indicated by the strong absorption edge seen in the picture. The Formula (12) Tauc relation can be used to predict the band gap and the kind of optical transition from the absorption coefficient [74]:
α h v = A h v E g n
where n is an exponent that describes the type of optical transition process, A is the independent energy constant, is the photon energy, and Eg is the band gap energy. The band gap energy of thin films is found to be approximately between 4.018 eV, 4.033 eV, 4.036 eV, and 4.032 eV, depending on the AT. Figure 7b (inset) shows (αhν)2 versus energy plot. In this image, a magnification is made to observe how, at 550 °C, a shift to lower energies is observed, indicating a decrease in its band gap. These results underline the importance of the deposition temperature in the synthesis and annealing temperature of ZrO2 thin films and, therefore, the significant importance for its application.

3.8. Photocatalytic Decolorization of MB

When it comes to eliminating harmful organic pollutants, current wastewater treatment methods, including membrane technology, chemical treatment, and biodegradation, are not always effective. This is due to the fact that they are not made with the intention of eliminating these impurities. On the other hand, photocatalysis has demonstrated significant promise in eliminating harmful contaminants from the environment. The TiO2 catalyst has seen extensive use in water treatment applications throughout the years [75]. MoS2 is a reasonably priced powerful oxidizing agent that is non-toxic and extremely stable. MoS2 can function as a highly effective catalyst for N-TiO2 because of its huge surface area [76]. Given that MoS2 and NT form a heterostructure and this heterostructure has the beneficial effect of enhancing MB adsorption on the catalyst surface, the produced catalyst is a great choice for the effective photocatalysis of toxic pollutants in aqueous solutions.
The degradation of organic contaminants using photocatalysis by a photocatalyst has garnered more interest in recent times [77,78,79,80,81]. One semiconductor material that may be used as a photocatalyst is ZrO2 [82,83]. After the films are calcined at various temperatures, the photocatalytic activity of the ZrO2 thin films is assessed. The degradation of methylene blue (MB), a pollutant model, in the presence of ZrO2 thin films under UV radiation is the subject of this experiment. In a typical procedure, 3 mL of prepared MB solution (10 ppm, pH = 6.7) is exposed to UV light (lamp G15T8) after one sample of ZrO2 is added. A quartz cell serves as the support for the 3 mL of MB and the thin film, and is positioned 5 cm away from the UV lamp. A quartz cell is taken and the absorbance is monitored every two hours. Figure 8 demonstrates the impact of annealing temperature on ZrO2 thin film photocatalyst performance.
It is well known that crystallinity, surface area, and morphology all affect photocatalytic activity. These factors can be enhanced by increasing the quantity of surface-adsorbed reactant species, decreasing the rate at which photogenerated electron–hole pairs recombine, and extending the excitation wavelength to a lower energy range. Generally speaking, photocatalysis starts when photons with a band gap are directly absorbed, creating electron–hole pairs in the semiconductor particles. The next step is the diffusion of the charge carriers to the particle’s surface, where they combine with water molecules to form very reactive species of hydroxyl radical (OH•) and peroxide (O2), which degrade the organic molecules that have been adsorbed. The following is a description of the photocatalytic degradation of methylene blue (MB) over a ZrO2 catalyst. Figure 8a shows the results of UV light photocatalytic activity of MB tests performed on ZrO2 thin films annealing at 400 °C, 450 °C, 500 °C, and 550 °C. The low photocatalytic performance of the film calcined at 400 °C is probably due to the low crystallinity obtained at a low AT. By increasing the calcination temperature to 450 to 550 °C, one may expect an improvement in photocatalytic activity due to increased crystallinity at these temperatures. It is observed in the fourth hour that the three samples have a similar behavior, possibly due to the similarity of their crystallinity. However, as the time increases, the 550 °C sample reaches the maximum degradation. Based on the experimental data, a dynamic curve is created, as seen in Figure 8b. The main use of the Langmuir–Hinshelwood model is to explain the kinetics of various organic compounds’ photocatalytic breakdown in aqueous solutions [84]. Regardless of the sample type, Figure 8b illustrates that −ln(C/C0) exhibits a linear relationship with the reaction time t, indicating that the degradation of MB essentially follows pseudo first-order kinetics. Following computation, Table 1 displays the apparent reaction rate constants for the photocatalytic degradation of MB.
When compared with other samples that are calcined at 400, 450, and 500 °C, the thin films that are calcined at 550 °C achieve almost 36% after 10 h, indicating the best photocatalytic reaction. These findings might further suggest that, in these ideal circumstances, the photochemical degradation response is essential to the ZrO2 thin film degradation process. The oxides may have different electron or hole energy levels, which could enhance charge separation and raise the rates of photocatalytic reactions. It is determined that additional morphological research is required to precisely identify the degradation rate enhancement mechanism. Muersha and Soylu showed in an experiment that ZrO2 calcined at 500 C for 5 h only obtained 22% degradation in 90 min [85]. Anitha et al. studied the effect of annealing on the photocatalytic activity of TiO2, ZrO2-TiO2, and ZrO2 thin films at (a) 500, (b) 800, and (c) 1200 °C with different irradiation times; they had MB removal efficiency (29%) within 120 min to 500 °C [86]. Other authors have reported similar degradation of methylene blue with ZrO2. Das et al. obtained 10.3% degradation in 90 min [87]. The accompanying paragraphs demonstrate that ZrO2 thin films made under experimental conditions demonstrate good performance in the photodegradation of organic dye pollution, in accordance with all results obtained within the scope of the inquiry. Although very little research has been identified in the literature investigating the photocatalytic activity of a single ZrO2 thin film, the results obtained are quite close to some previously reported results. The majority of research has focused on ZrO2-based nanocomposites (powders) in conjunction with other metal oxides; however, relatively few studies have looked at the photocatalytic activity of single ZrO2 thin films. Based on the photocatalytic experimental technique carried out under similar conditions, it has been reported that the ZrO2 nanoparticle generated by optimizing the synthesis conditions has high photocatalytic performance compared with various ZrO2 nanostructures in the literature. Seyrek et al. reported important research on the degradation of methylene blue, and that it is very important to consider changes in the thickness of thin films, annealing temperature, pH, concentrations, and wavelengths of the ultraviolet lamp [88].

4. Conclusions

In conclusion, we identify the tetragonal phase in ZrO2 thin film at different annealing temperatures from 400 °C to 550 °C. The XRD study indicates that the films are monocrystalline in nature with preferred grain orientation along (011) plane and exhibit a tetragonal crystal structure. The crystallite size of the films increases with increasing annealing temperature. Raman study lends support to our conclusion that all ZrO2 thin films essentially consist of one tetragonal crystalline phase. The sphere-like formation is observed from the SEM with increasing temperatures. FTIR explains the bonding nature and confirms the formation of the composite. UV-Vis shows the optical absorbance is high in the visible region and the optical band gap value increases with annealing temperature. The photocatalytic experimental results reveal that ZrO2 thin films degrade MB by 20%, 24%, 29%, and 36%, with annealing temperatures of 400 °C and 550 °C, respectively. Our results suggest a means to improve the structural and optical properties of highly oriented ZrO2 thin films at various annealing temperatures and their photocatalytic applications. Further studies are currently being carried out in our lab.

Author Contributions

Conceptualization, S.R.; Methodology, F.E.-A.; Formal analysis, S.G.-H.; Investigation, Y.d.J.A.-S.; Writing—review & editing, A.M.-L. All authors have read and agreed to the published version of the manuscript.

Funding

This research received no external funding.

Institutional Review Board Statement

Not applicable.

Informed Consent Statement

Not applicable.

Data Availability Statement

Data is contained within this article.

Acknowledgments

We appreciate the support of the “FONDO PARA EL DESARROLLO DEL CONOCIMIENTO (FONDEC-UAQ-2022)” with the project “Fabricación de un aditivo para mejorar las propiedades mecánicas del concreto”. In addition, thanks are due to C. Zuñiga-Romero, and A. Guzmán-Campuzano for their technical assistance. Also, the authors would like to thank especially all members of the Nanotechnology and Photocatalysis Laboratory at Airport Campus of the Autonomous University of Querétaro.

Conflicts of Interest

The authors declare no conflicts of interest.

References

  1. Clean Water and Sanitation, Sustainable Development Goals. Available online: https://www.un.org/sustainabledevelopment/water-and-sanitation (accessed on 12 July 2023).
  2. Water. Available online: https://www.worldbank.org/en/topic/water/overview (accessed on 12 July 2023).
  3. Srivastava, A.; Shukla, S.; Jangid, N.; Srivastava, M.; Vishwakarma, R. Research Anthology on Emerging Techniques in Environmental Remediation; IGI Global: Hershey, PA, USA, 2021. [Google Scholar]
  4. PubChem Compound Summary for CID 6099, Methylene Blue, National Center for Biotechnology Information. Available online: https://pubchem.ncbi.nlm.nih.gov/compound/Methylene-Blue (accessed on 14 July 2023).
  5. Lee, S.W.; Han, H.C. Methylene Blue Application to Lessen Pain: Its Analgesic Effect and Mechanism. Front. Neurosci. 2021, 15, 663650. [Google Scholar] [CrossRef] [PubMed]
  6. Schirmer, R.H.; Coulibaly, B.; Stich, A.; Scheiwein, M.; Merkle, H.; Eubel, J.; Becker, K.; Becher, H.; Müller, O.; Zich, T.; et al. Methylene blue as an antimalarial agent. Redox Rep. 2023, 8, 272–275. [Google Scholar] [CrossRef] [PubMed]
  7. Auchter, A.; Williams, J.; Barksdale, B.; Monfils, M.H.; Gonzalez-Lima, F. Therapeutic Benefits of Methylene Blue on Cognitive Impairment during Chronic Cerebral Hypoperfusion. J. Alzheimer’s Dis. 2014, 42, S525–S535. [Google Scholar] [CrossRef] [PubMed]
  8. Wainwright, M.; Crossley, K.B. Methylene Blue—A Therapeutic Dye for All Seasons? J. Chemother. 2002, 14, 431–443. [Google Scholar] [CrossRef]
  9. Gillman, P.K. CNS toxicity involving methylene blue: The exemplar for understanding and predicting drug interactions that precipitate serotonin toxicity. J. Psychopharmacol. 2011, 25, 429–436. [Google Scholar] [CrossRef]
  10. Garza, F.; Kearney, T.E. Chapter 3–49: Methylene Blue. In Poisoning & Drug Overdose; Olson, K.R., Anderson, I.B., Benowitz, N.L., Blanc, P.D., Clark, R.F., Kearney, T.E., Kim-Katz, S.Y., Wu, A.H.B., Eds.; McGraw-Hill Education: New York, NY, USA, 2018; Available online: https://accessmedicine.mhmedical.com/content.aspx?bookid=2284&sectionid=248385909 (accessed on 21 January 2024).
  11. Khan, I.; Saeed, K.; Zekker, I.; Zhang, B.; Hendi, A.H.; Ahmad, A.; Ahmad, S.; Zada, N.; Ahmad, H.; Shah, L.A.; et al. Review on Methylene Blue: Its Properties, Uses, Toxicity and Photodegradation. Water 2022, 14, 242. [Google Scholar] [CrossRef]
  12. Oladoye, P.O.; Ajiboye, T.O.; Omotola, E.O.; Oyewola, O.J. Methylene blue dye: Toxicity and potential elimination technology from wastewater. Results Eng. 2022, 16, 100678. [Google Scholar] [CrossRef]
  13. Crini, G.; Lichtfouse, E. Advantages and disadvantages of techniques used for wastewater treatment. Environ. Chem. Lett. 2019, 17, 145–155. [Google Scholar] [CrossRef]
  14. Deng, Y.; Zhao, R. Advanced Oxidation Processes (AOPs) in Wastewater Treatment. Curr. Pollut. Rep. 2015, 1, 167–176. [Google Scholar] [CrossRef]
  15. Gopalakrishnan, G.; Jeyakumar, R.B.; Somanathan, A. Challenges and Emerging Trends in Advanced Oxidation Technologies and Integration of Advanced Oxidation Processes with Biological Processes for Wastewater Treatment. Sustainability 2023, 15, 4235. [Google Scholar] [CrossRef]
  16. PPandis, K.; Kalogirou, C.; Kanellou, E.; Vaitsis, C.; Savvidou, M.G.; Sourkouni, G.; Zorpas, A.A.; Argirusis, C. Key Points of Advanced Oxidation Processes (AOPs) for Wastewater, Organic Pollutants and Pharmaceutical Waste Treatment: A Mini Review. ChemEngineering 2022, 6, 8. [Google Scholar] [CrossRef]
  17. García-Fernández, I.; Fernández-Calderero, I.; Polo-López, M.I.; Fernández-Ibáñez, P. Disinfection of urban effluents using solar TiO2 photocatalysis: A study of significance of dissolved oxygen, temperature, type of microorganism and water matrix. Catal. Today 2015, 240, 30–38. [Google Scholar] [CrossRef]
  18. Dharma, H.N.C.; Jaafar, J.; Widiastuti, N.; Matsuyama, H.; Rajabsadeh, S.; Othman, M.H.D.; Rahman, M.A.; Jafri, N.N.M.; Suhaimin, N.S.; Nasir, A.M.; et al. A Review of Titanium Dioxide (TiO2)-Based Photocatalyst for Oilfield-Produced Water Treatment. Membranes 2022, 12, 345. [Google Scholar] [CrossRef] [PubMed]
  19. Schneider, J.; Matsuoka, M.; Takeuchi, M.; Zhang, J.; Horiuchi, Y.; Anpo, M.; Bahnemann, D.W. Understanding TiO2 Photocatalysis: Mechanisms and Materials. Chem. Rev. 2014, 114, 9919–9986. [Google Scholar] [CrossRef] [PubMed]
  20. Xiao, J.; Xie, Y.; Cao, H. Organic pollutants removal in wastewater by heterogeneous photocatalytic ozonation. Chemosphere 2015, 121, 1–17. [Google Scholar] [CrossRef]
  21. Song, X.; Ding, Y.; Zhang, J.; Jiang, C.; Liu, Z.; Lin, C.; Zheng, W.; Zeng, Y. Thermophysical and mechanical properties of cubic, tetragonal and monoclinic ZrO2. J. Mater. Res. Technol. 2023, 23, 648–655. [Google Scholar] [CrossRef]
  22. Häfele, E.; Kaltenmaier, K.; Schönauer, U. Application of the ZrO2 sensor in determination of pollutant gases. Sens. Actuators B Chem. 1991, 4, 525–527. [Google Scholar] [CrossRef]
  23. Pandit, N.A.; Ahmad, T. ZrO2/CeO2-Heterostructured Nanocomposites for Enhanced Carbon Monoxide Gas Sensing. ACS Appl. Nano Mater. 2023, 6, 7299–7309. [Google Scholar] [CrossRef]
  24. Pandiyan, R.; Vinothkumar, V.; Chen, T.W.; Chen, S.M.; Abinaya, M.; Rwei, S.P.; Hsu, H.Y.; Huang, C.W.; Yu, M.C. Synthesis of Ag@ZrO2 nanoparticles: A sensitive electrochemical sensor for determination of antibiotic drug tinidazole. Int. J. Electrochem. Sci. 2022, 17, 220414. [Google Scholar] [CrossRef]
  25. Antolini, E.; Gonzalez, E.R. Ceramic materials as supports for low-temperature fuel cell catalysts. Solid State Ion. 2009, 180, 9–10. [Google Scholar] [CrossRef]
  26. Li, S.; Guo, R.; Li, J.; Chen, Y.; Liu, W. Synthesis of NiO–ZrO2 powders for solid oxide fuel cells. Ceram. Int. 2003, 29, 883–886. [Google Scholar] [CrossRef]
  27. Yamada, T.; Kubota, Y.; Makinose, Y.; Suzuki, N.; Nakata, K.; Terashima, C.; Matsushita, N.; Okada, K.; Fujishima, A.; Katsumata, K.I. Single Crystal ZrO2 Nanosheets Formed by Thermal Transformation for Solid Oxide Fuel Cells and Oxygen Sensors. ACS Appl. Nano Mater. 2019, 2, 6866–6873. [Google Scholar] [CrossRef]
  28. Reddy, B.M.; Patil, M.K. Organic Syntheses and Transformations Catalyzed by Sulfated Zirconia. Chem. Rev. 2009, 109, 2185–2208. [Google Scholar] [CrossRef]
  29. Chen, L.; Mashimo, T.; Omurzak, E.; Okudera, H.; Iwamoto, C.; Yoshiasa, A. Pure Tetragonal ZrO2 Nanoparticles Synthesized by Pulsed Plasma in Liquid. J. Phys. Chem. C 2011, 115, 9370–9375. [Google Scholar] [CrossRef]
  30. Ahmed, W.; Iqbal, J. Co doped ZrO2 nanoparticles: An efficient visible light triggered photocatalyst with enhanced structural, optical and dielectric characteristics. Ceram. Int. 2020, 46, 25833–25844. [Google Scholar] [CrossRef]
  31. Abdi, J.; Yahyanezhad, M.; Sakhaie, S.; Vossoughi, M.; Alemzadeh, I. Synthesis of porous TiO2/ZrO2 photocatalyst derived from zirconium metal organic framework for degradation of organic pollutants under visible light irradiation. J. Environ. Chem. Eng. 2019, 7, 103096. [Google Scholar] [CrossRef]
  32. Zare, M.H.; Mehrabani-Zeinabad, A. Photocatalytic activity of ZrO2/TiO2/Fe3O4 ternary nanocomposite for the degradation of naproxen: Characterization and optimization using response surface methodology. Sci. Rep. 2022, 12, 10388. [Google Scholar] [CrossRef]
  33. Długosz, O.; Szostak, K.; Banach, M. Photocatalytic properties of zirconium oxide–zinc oxide nanoparticles synthesised using microwave irradiation. Appl. Nanosci. 2009, 10, 941–954. [Google Scholar] [CrossRef]
  34. Kumar, A.; Pandey, G. A review on the factors affecting the photocatalytic degradation of hazardous materials. Mater. Sci. Eng. Int. J. 2017, 1, 106–114. [Google Scholar] [CrossRef]
  35. Navío, J.A.; Hidalgo, M.C.; Colón, G.; Botta, S.G.; Litter, M.I. Preparation and Physicochemical Properties of ZrO2 and Fe/ZrO2 Prepared by a Sol-Gel Technique. Langmuir 2001, 17, 202–210. [Google Scholar] [CrossRef]
  36. Dawoud, T.M.S.; Pavitra, V.; Ahmad, P.; Syed, A.; Nagaraju, G. Photocatalytic degradation of an organic dye using Ag doped ZrO2 nanoparticles: Milk powder facilitated eco-friendly synthesis. J. King Saud Univ. Sci. 2020, 32, 1872–1878. [Google Scholar] [CrossRef]
  37. Mishra, S.; Debnath, A.K.; Muthe, K.P.; Das, N.; Parhi, P. Rapid synthesis of tetragonal zirconia nanoparticles by microwave-solvothermal route and its photocatalytic activity towards organic dyes and hexavalent chromium in single and binary component systems. Colloids Surf. A Physicochem. Asp. E 2021, 608, 125551. [Google Scholar] [CrossRef]
  38. Oluwabi, A.T.; Acik, I.O.; Katerski, A.; Mere, A.; Krunks, M. Structural and electrical characterisation of high-k ZrO2 thin films deposited by chemical spray pyrolysis method. Thin Solid Film. 2018, 662, 129–136. [Google Scholar] [CrossRef]
  39. Chelliah, P.; Wabaidur, S.M.; Sharma, H.P.; Majdi, H.S.; Smait, D.A.; Najm, M.A.; Iqbal, A.; Lai, W.C. Photocatalytic Organic Contaminant Degradation of Green Synthesized ZrO2 NPs and Their Antibacterial Activities. Separations 2023, 10, 156. [Google Scholar] [CrossRef]
  40. Renuka, L.; Anantharaju, K.S.; Sharma, S.C.; Nagabhushana, H.; Vidya, Y.S.; Nagaswarupa, H.P.; Prashantha, S.C. A comparative study on the structural, optical, electrochemical and photocatalytic properties of ZrO2 nanooxide synthesized by different routes. J. Alloys Compd. 2017, 695, 382–395. [Google Scholar] [CrossRef]
  41. Keerthana, S.P.; Yuvakkumar, R.; Kumar, P.S.; Ravi, G.; Velauthapillai, D. Nd doped ZrO2 photocatalyst for organic pollutants degradation in wastewater. Environ. Technol. Innov. 2022, 28, 102851. [Google Scholar] [CrossRef]
  42. Shwetharani, R.; Chandan, H.R.; Sakar, M.; Balakrishna, G.R.; Reddy, K.R.; Raghu, A.V. Photocatalytic semiconductor thin films for hydrogen production and environmental applications. Int. J. Hydrogen Energy 2020, 45, 18289–18308. [Google Scholar] [CrossRef]
  43. Acosta, E. Thin Films/Properties and Applications. In Thin Films; IntechOpen: London, UK, 2021. [Google Scholar] [CrossRef]
  44. Grosso, D. How to exploit the full potential of the dip-coating process to better control film formation. J. Mater. Chem. 2011, 21, 17033. [Google Scholar] [CrossRef]
  45. Parashar, M.; Shukla, V.K.; Singh, R. Metal oxides nanoparticles via sol–gel method: A review on synthesis, characterization and applications. J. Mater. Sci. Mater. Electron. 2020, 31, 3729–3749. [Google Scholar] [CrossRef]
  46. Jothibas, M.; Manoharan, C.; Jeyakumar, S.J.; Praveen, P.; Panneerdoss, I.J. Photocatalytic activity of spray deposited ZrO2 nano-thin films on methylene blue decolouration. J. Mater. Sci. Mater. Electron. 2016, 26, 5851–5859. [Google Scholar] [CrossRef]
  47. Xu, X.H.; Shen, X.H.; Li, X.L.; Wang, F.; Jiang, F.X.; Wu, H.S. Texture development and magnetic properties of [ZrO2/CoPt]n/Ag nanocomposite films. Appl. Surf. Sci. 2007, 253, 3382–3386. [Google Scholar] [CrossRef]
  48. Villabona-Leal, E.G.; Diaz-Torres, L.A.; Desirena, H.; Rodríguez-López, J.L.; Pérez, E.; Meza, O. Luminescence and energy transfer properties of Eu3+ and Gd3+ in ZrO2. J. Lumin. 2014, 146, 398–403. [Google Scholar] [CrossRef]
  49. Ruiz-Ortega, R.C.; Esquivel-Mendez, L.A.; Gonzalez-Trujillo, M.A.; Hernandez-Vasquez, C.; Matsumoto, Y.; Albor-Aguilera, M.L. Comprehensive Analysis of CdS Ultrathin Films Modified by the Substrate Position inside the Reactor Container Using the CBD Technique. ACS Omega 2023, 8, 31725–31737. [Google Scholar] [CrossRef] [PubMed]
  50. Zhang, F.; Chan, S.W.; Spanier, J.E.; Apak, E.; Jin, Q.; Robinson, R.D.; Harman, I.P. Cerium oxide nanoparticles: Size-selective formation and structure analysis. Appl. Phys. Lett. 2002, 80, 127–129. [Google Scholar] [CrossRef]
  51. Choudhury, B.; Choudhury, A. Ce3+ and oxygen vacancy mediated tuning of structural and optical properties of CeO2 nanoparticles. Mater. Chem. Phys. 2012, 131, 666–671. [Google Scholar] [CrossRef]
  52. Reddy, C.V.; Babu, B.; Reddy, I.N.; Shim, J. Synthesis and characterization of pure tetragonal ZrO2 nanoparticles with enhanced photocatalytic activity. Ceram. Int. 2018, 44, 6940–6948. [Google Scholar] [CrossRef]
  53. Mastache, J.E.M.; Vargas, O.S.; López, R.; Morales, F.M.; Gómez, K.M.; Lara, A.B.; Coyopol, A.; Jiménez, J.N.; Alcántara, E.G.; Castro, N.C.; et al. Study of the properties of zirconia nanoparticles/zinc oxide films composites: Comparation to thermally treated samples. Results Chem. 2023, 6, 101230. [Google Scholar] [CrossRef]
  54. Mote, V.; Purushotham, Y.; Dole, B. Williamson-hall analysis in estimation of lattice strain in nanometer-sized ZnO particles. J. Theor. Appl. Phys. 2012, 6, 6. [Google Scholar] [CrossRef]
  55. Williamson, G.K.; Hall, W.H. X-ray line broadening from filed aluminium and wolfram. Acta Metall. 1953, 1, 22–31. [Google Scholar] [CrossRef]
  56. Ehrhart, G.; Capoen, B.; Robbe, O.; Boy, P.; Turrell, S.; Bouazaoui, M. Structural and optical properties of n-propoxide sol–gel derived ZrO2 thin films. Thin Solid Film. 2006, 49, 227–233. [Google Scholar] [CrossRef]
  57. Mansilla, Y.; Arce; González-Oliver, C.; Basbus, J.; Troiani, H.; Serquis, A. Characterization of stabilized ZrO2 thin films obtained by sol-gel method. Appl. Surf. Sci. 2021, 569, 150787. [Google Scholar] [CrossRef]
  58. Wang, X.; Wu, G.; Zhou, B.; Shen, J. Effect of crystal structure on optical properties of sol–gel derived zirconia thin films. J. Alloys Compd. 2013, 556, 182–187. [Google Scholar] [CrossRef]
  59. Keramidas, V.G.; White, W.B. Raman Scattering Study of the Crystallization and Phase Transformations of ZrO2. J. Am. Ceram. Soc. 1974, 57, 22–24. [Google Scholar] [CrossRef]
  60. Tani, E.; Yoshimura, M.; Somiya, S. Formation of Ultrafine Tetragonal ZrO2 Powder Under Hydrothermal Conditions. J. Am. Ceram. Soc. 1983, 66, 11–14. [Google Scholar] [CrossRef]
  61. Ghodsi, F.; Tepehan, F.; Tepehan, G. Derivation of the optical constants of spin coated CeO2–TiO2–ZrO2 thin films prepared by sol–gel route. J. Phys. Chem. Solids 2011, 72, 761–767. [Google Scholar] [CrossRef]
  62. Ortiz, A.; Alonso, J.C.; Haro-Poniatowski, E. Spray deposition and characterization of zirconium-oxide thin films. J. Electron. Mater. 2005, 34, 150–155. [Google Scholar] [CrossRef]
  63. Imanova, G.T.; Agayev, T.N.; Jabarov, S.H. Investigation of structural and optical properties of zirconia dioxide nanoparticles by radiation and thermal methods. Mod. Phys. Lett. B 2021, 35, 2150050. [Google Scholar] [CrossRef]
  64. Ibrahim, M.M. Photocatalytic activity of nanostructured ZnO–ZrO2 binary oxide using fluorometric method. Spectrochim. Acta Part A Mol. Biomol. Spectrosc. 2015, 145, 487–492. [Google Scholar] [CrossRef] [PubMed]
  65. Ivanova, T.; Harizanova, A.; Koutzarova, T.; Vertruyen, B. Effect of annealing temperatures on properties of sol-gel grown ZnO-ZrO2 films. Cryst. Res. Technol. 2010, 45, 1154–1160. [Google Scholar] [CrossRef]
  66. Guo, G.Y.; Chen, Y.L. Unusual structural phase transition in nanocrystalline zirconia. Appl. Phys. A 2006, 84, 431–437. [Google Scholar] [CrossRef]
  67. Chau, T.P.; Kandasamy, S.; Chinnathambi, A.; Alahmadi, T.A.; Brindhadevi, K. Synthesis of zirconia nanoparticles using Laurus nobilis for use as an antimicrobial agent. Appl. Nanosci. 2023, 13, 1337–1344. [Google Scholar] [CrossRef]
  68. Sagadevan, S.; Podder, J.; Das, I. Hydrothermal synthesis of zirconium oxide nanoparticles and its characterization. J. Mater. Sci. Mater. Electron. 2016, 27, 5622–5627. [Google Scholar] [CrossRef]
  69. Korde, S.A.; Thombre, P.B.; Dipake, S.S.; Sangshetti, J.N.; Rajbhoj, A.S.; Gaikwad, S.T. Neem gum (Azadirachta indicia) facilitated green synthesis of TiO2 and ZrO2 nanoparticles as antimicrobial agents. Inorg. Chem. Commun. 2023, 153, 110777. [Google Scholar] [CrossRef]
  70. Wang, S.; Pu, J.; Wu, J.; Liu, H.; Xu, H.; Li, X.; Wang, H. SO42–/ZrO2 as a Solid Acid for the Esterification of Palmitic Acid with Methanol: Effects of the Calcination Time and Recycle Method. ACS Omega 2020, 5, 30139–30147. [Google Scholar] [CrossRef] [PubMed]
  71. Uhlmann, D.R.; Zelinski, B.J.J.; Wnek, G.E. The Ceramist as Chemist Opportunities for New Material. MRS Online Proc. Libr. 1984, 32, 59–70. [Google Scholar] [CrossRef]
  72. Kamaraj, C.; Gandhi, P.R.; Elango, G.; Karthi, S.; Chung, I.-M.; Rajakumar, G. Novel and environmental friendly approach; Impact of Neem (Azadirachta indica) gum nano formulation (NGNF) on Helicoverpa armigera (Hub.) and Spodoptera litura (Fab.). Int. J. Biol. Macromol. 2018, 107, 59–69. [Google Scholar] [CrossRef]
  73. Hassanien, A.S.; Sharma, I. Physicochemical, optical, and dielectric studies of physically vapor deposited amorphous thin Cu25-x (ZnGe)25-x Se50+2x films. J. Non-Cryst. Solids 2024, 630, 122887. [Google Scholar] [CrossRef]
  74. Contreras-Rascón, J.; Díaz-Reyes, J.; Flores-Pacheco, A.; Morales, R.L.; Álvarez-Ramos, M.; Balderas-López, J. Structural and optical modifications of CdS properties in CdS-Au thin films prepared by CBD. Results Phys. 2021, 22, 103914. [Google Scholar] [CrossRef]
  75. Pant, B.; Park, M.; Park, S.J. Recent Advances in TiO2 Films Prepared by Sol-Gel Methods for Photocatalytic Degradation of Organic Pollutants and Antibacterial Activities. Coatings 2019, 9, 613. [Google Scholar] [CrossRef]
  76. Su, J.; Yu, S.; Xu, M.; Guo, Y.; Sun, X.; Fan, Y.; Zhang, Z.; Yan, J.; Zhao, W. Enhanced visible light photocatalytic performances of few-layer MoS2@ TiO2 hollow spheres heterostructures. Mater. Res. Bull. 2020, 130, 110936. [Google Scholar] [CrossRef]
  77. Sen, P.; Bhattacharya, P.; Mukherjee, G.; Ganguly, J.; Marik, B.; Thapliyal, D.; Verma, S.; Verros, G.D.; Chauhan, M.S.; Arya, R.K. Advancements in Doping Strategies for Enhanced Photocatalysts and Adsorbents in Environmental Remediation. Technologies 2023, 11, 144. [Google Scholar] [CrossRef]
  78. Zhu, X.; Zhou, Q.; Xia, Y.; Wang, J.; Chen, H.; Xu, Q.; Liu, J.; Chen, W.F.S. Preparation and characterization of Cu-doped TiO2 nanomaterials with anatase/rutile/brookite triphasic structure and their photocatalytic activity. J. Mater. Sci. Mater. Electron. 2021, 32, 21511–21524. [Google Scholar] [CrossRef]
  79. Zhu, X.; Wang, J.; Yang, D.; Liu, J.; He, L.; Tang, M.; Feng, W.; Wu, X. Fabrication, characterization and high photocatalytic activity of Ag–ZnO heterojunctions under UV-visible light. RSC Adv. 2021, 11, 27257–27266. [Google Scholar] [CrossRef]
  80. Cheng, C.; Xu, H.; Ni, M.; Guo, C.; Zhao, Y.; Hu, Y. Interfacial electron interactions governed photoactivity and selectivity evolution of carbon dioxide photoreduction with spinel cobalt oxide based hollow hetero-nanocubes. Appl. Catal. B Environ. Energy 2024, 345, 123705. [Google Scholar] [CrossRef]
  81. Guan, D.; Xu, H.; Zhang, Q.; Huang, Y.; Shi, C.; Chang, Y.; Xu, X.; Tang, J.; Gu, Y.; Pao, C.; et al. Identifying a Universal Activity Descriptor and a Unifying Mechanism Concept on Perovskite Oxides for Green Hydrogen Production. Adv. Mater. 2023, 35, 2305074. [Google Scholar] [CrossRef] [PubMed]
  82. Shu, Z.; Jiao, X.; Chen, D. Synthesis and photocatalytic properties of flower-like zirconia nanostructures. CrystEngComm 2012, 14, 1122–1127. [Google Scholar] [CrossRef]
  83. Shao, G.N.; Imran, S.; Jeon, S.J.; Engole, M.; Abbas, N.; Haider, M.S.; Kang, S.J.; Kim, H.T. Sol–gel synthesis of photoactive zirconia–titania from metal salts and investigation of their photocatalytic properties in the photodegradation of methylene blue. Powder Technol. 2014, 258, 99–109. [Google Scholar] [CrossRef]
  84. Alalm, G.M.; Ookawara, S.; Fukushi, D.; Sato, A.; Tawfik, A. Improved WO3 photocatalytic efficiency using ZrO2 and Ru for the degradation of carbofuran and ampicillin. J. Hazard. Mater. 2016, 302, 225–231. [Google Scholar] [CrossRef]
  85. Muersha, W.; Soylu, G.S.P. Effects of metal oxide semiconductors on the photocatalytic degradation of 4-nitrophenol. J. Mol. Struct. 2018, 1174, 96–102. [Google Scholar] [CrossRef]
  86. Anitha, V.S.; Lekshmy, S.S.; Joy, K. Effect of annealing on the structural, optical, electrical and photocatalytic activity of ZrO2–TiO2 nanocomposite thin films prepared by sol–gel dip coating technique. J. Mater. Sci. Mater. Electron. 2017, 28, 10541–10554. [Google Scholar] [CrossRef]
  87. Das, R.S.; Warkhade, S.K.; Kumar, A.; Wankhade, A.V.A.V. Graphene oxide-based zirconium oxide nanocomposite for enhanced visible light-driven photocatalytic activity. Res. Chem. Intermed. 2019, 45, 1689–1705. [Google Scholar] [CrossRef]
  88. Seyrek, M.; Boran, F.; Okutan, M. Treatment of Automotive Paint Wastewater: Photocatalytic degradation of methylene blue using semi-conductive ZrO2. Int. J. Automot. Sci. Technol. 2023, 7, 316–324. [Google Scholar] [CrossRef]
Figure 1. (a) Texture coefficient of ZrO2 thin films as a function of AT, (b) XRD patterns, and (c) magnified image of prepared films.
Coatings 14 00537 g001
Figure 2. (a) Crystallite size from Scherrer equation and micro-strain from Stokes–Wilson equation, (bd) dislocation density ( δ ), and dislocation density ( ρ ).
Coatings 14 00537 g002
Figure 3. W-Hm linear fitted plot, (a) 400 °C, (b) 450 °C, (c) 500 °C, and (d) 550 °C.
Coatings 14 00537 g003
Figure 4. Raman spectra of ZrO2 thin films deposited on glass and annealing at 400 to 550 °C.
Coatings 14 00537 g004
Figure 5. FTIR spectra of ZrO2 at different annealing temperatures.
Coatings 14 00537 g005
Figure 6. SEM images of ZrO2 thin films deposited on a glass substrate as a function of AT, (a) 400 °C, (b) 450 °C, (c) 500 °C, (d) 550 °C, and (e) the cross-section of ZrO2 thin films.
Coatings 14 00537 g006
Figure 7. (a) Absorption spectra and (b) Tauc plot of ZrO2 thin films.
Coatings 14 00537 g007
Figure 8. (a) Decolorization of MB dye of ZrO2 thin film at various ATs. (b) Kinetics of UV photocatalytic degradation MB with different ATs.
Coatings 14 00537 g008
Table 1. Results of the photodegradation of MB.
Sample k   ( h 1 ) R2Degradation (%)
400 °C0.0390.88320
450 °C0.0520.85224
500 °C0.0510.90329
550 °C0.0310.94836
Disclaimer/Publisher’s Note: The statements, opinions and data contained in all publications are solely those of the individual author(s) and contributor(s) and not of MDPI and/or the editor(s). MDPI and/or the editor(s) disclaim responsibility for any injury to people or property resulting from any ideas, methods, instructions or products referred to in the content.

