Article

Long-Term Evolution of Significant Wave Height in the Eastern Tropical Atlantic between 1940 and 2022 Using the ERA5 Dataset

by
Olorunfemi Omonigbehin
1,*,
Emmanuel OlaOluwa Eresanya
2,3,
Aifeng Tao
4,
Victor Edem Setordjie
4,
Samuel Daramola
4 and
Abiola Adebiyi
5
1
Centre Eau Terre Environnement, Institut National de la Recherche Scientifique, Quebec, QC G1P 4S5, Canada
2
Irish Climate Analysis Research Units (ICARUS), Department of Geography, Maynooth University, W23 F2H6 Maynooth, Ireland
3
Organization of African Academic Doctors (OAAD), Langata, Nairobi P.O. Box 14833-00100, Kenya
4
College of Harbor, Coastal and Offshore Engineering, Hohai University, Nanjing 210098, China
5
Department of Geosciences, Florida Atlantic University, Boca Raton, FL 33431, USA
*
Author to whom correspondence should be addressed.
J. Mar. Sci. Eng. 2024, 12(5), 714; https://0-doi-org.brum.beds.ac.uk/10.3390/jmse12050714
Submission received: 1 April 2024 / Revised: 19 April 2024 / Accepted: 23 April 2024 / Published: 26 April 2024
(This article belongs to the Section Physical Oceanography)

Abstract

:
Studies on the variability in ocean wave climate provide engineers and policy makers with information to plan, develop, and control coastal and offshore activities. Ocean waves bear climatic imprints through which the global climate system can be better understood. Using the recently updated ERA5 dataset, this study evaluated the spatiotemporal distribution and variability in significant wave height (SWH) in the Eastern Tropical Atlantic (ETA). The short-term trends and rates of change were obtained using the Mann–Kendall trend test and the Theil–Sen slope estimator, respectively, and decadal trends were assessed using wavelet transformation. Significant, positive monthly and yearly trends and a prevailing decadal trend were observed across the domain. Observed trends suggest that stronger waves are getting closer to the coast and are modulated by the Southern and Northern Atlantic mid-latitude storm fields. These observations have implications for the increasing coastal erosion rates on the eastern coast of the Tropical Atlantic.

1. Introduction

Waves are a primary concern in most ocean and coastal processes. They significantly impact coastal and offshore infrastructure and enterprises, including the design and operation of structures, vessel routing, coastal hazard assessment and mitigation [1], and sediment transport processes [2]. These applications are relevant to the western coast of Africa in the same way as they are to other oceanic locations, necessitating a continual evaluation of wave characteristics and their evolution over time. Moreover, several countries on the western coast of Africa are oil-producing states with extensive exploration and exploitation activities in coastal and offshore jurisdictions, just as economic expansion in the West Africa region is anticipated to influence a rise in maritime trade and coastal development, including the building of more port facilities [3,4,5]. Consequently, coastal/offshore engineering design and management will benefit from information on the wave regime to actualize sustainable facilities or decide which equipment to use. Therefore, understanding the regional wave climate is advantageous for effective coastal zone management.
The dynamic interaction of the ocean–atmosphere system underscores the context of wave climatology. Waves exist in the ocean as wind seas caused by local winds or swells from distant storms [6]. When the manner of generation is considered, the wind sea and swells are referred to as wind waves, and when the restoring force is considered, the surface gravity waves. Therefore, their combination defines the sea state at any time. Wind velocity, duration, and fetch are critical determinants of and constraints on wave heights in the open sea. By inference, the wind and wind waves are closely related. The relationship is monotonous in a growing sea until the fully developed sea is attained [7].
Wave climatology has attracted considerable interest from various sources. Over time, the data used for such studies were either of coarse resolution or gathered over a short period [8,9,10]. Young (1999) [9] built a global ocean wind and wave climatology using data from satellite remote sensing and model projections over ten years. Their analysis of mean monthly statistics found zonal variations in wind speed and wave height, with the strongest wind and wave conditions occurring in roaring latitudes. Chen et al. (2002) [8] used simultaneous data from satellite scatterometers and altimeter sources to create a global picture of spatial and seasonal patterns of dominant swell and wind wave zones. They identified three well-defined swell-generating zones located in the eastern tropical areas of the Pacific, Atlantic, and Indian Oceans and regions of intensive wave growth in the northwest Pacific, northwest Atlantic, Southern Ocean, and Mediterranean Sea. Young et al. (2011) [10] used a 23-year database of calibrated and validated remotely sensed measurements to investigate global changes in oceanic wind speed and wave height from 1985 to 2003. A global trend of increasing wind speed values and, to a lesser degree, wave height was observed over this period. These studies identified wave growth trends on a coarser spatial scale and shorter temporal span, suggesting that the evolutionary trend of wave height on finer spatial scales and more extended periods needs to be reviewed as more data become available.
In recent years, wave models have been the data of choice for wave climate assessment. Although it can be argued that in situ wave observations remain the most desirable source of wave data, their viability is constrained when larger-scale measurements of wave data (in terms of spatial and temporal scales) are considered. Therefore, more recent research has adopted model predictions and, in some cases, remotely sensed measurements. The results of the Wave Model (WAM) [11] of the NOAA/NCEP and the European Center for Medium-Range Weather Forecast (ECMWF) [12] are widely used to study wind and wave climatology, and the Coupled Model Intercomparison Project (CMIP) has presented a robust platform for evaluating future climate scenarios [13]. These data sources offer improved accuracy, spatial and temporal precision, and global and regional applications. For instance, Semedo et al. (2011) [14] investigated the regional distribution of swell dominance in the Earth’s oceans in terms of wavefield energy balance as well as the statistical relationships between the interannual variability in the wind-sea and swell wave heights observed over the Pacific, Atlantic, and Indian Oceans using the ERA-40 covering 45 years. Owing to improvements in the models, other studies, mainly using the ERA5 dataset, have focused on various oceanic regions and determined the wave climatology of these areas [14,15,16,17,18,19,20,21,22,23].
This study examines the evolution of significant wave height (SWH) in the Eastern Tropical Atlantic region from January 1940 to December 2023 using the ERA5 reanalysis dataset. This 83-year assessment updates the existing results as it identifies long-term trends and variability that shorter datasets might have missed. This is crucial in understanding climate change impacts, as many climatic trends unfold over several decades. Short- and long-term trends were assessed using the classical Theil–Sen slope estimator and wavelet transform. By analyzing the wave climate variability in this region, our research contributes to a broader understanding of wind-wave patterns and their potential teleconnection with other climate drivers.
The remainder of this paper is structured as follows: Section 2 introduces the dataset and methods used to obtain the results presented in Section 3. In Section 4, we discuss our main findings and their implications for the study area, and Section 5 contains the concluding remarks.

2. Study Area, Data and Methods

2.1. Eastern Tropical Atlantic

This regional study covering latitudes (23.5° N to 23.5° S) and longitudes (25° W to 16° E) is conducted over the contiguous sea area west of the tropical latitudes of the African continent (Figure 1). The area extends beyond the Gulf of Guinea to investigate the potential influences of external events on the wave climate within and around it. We refer to our study area as the Eastern Tropical Atlantic (ETA).

2.2. Data

We accessed ERA5 monthly averaged data on single levels from 1940 to the present over the Eastern Tropical Atlantic (ETA). The ERA5 reanalysis data are a product of the European Center for Medium-Range Weather Forecasts (ECMWF) within the Copernicus Climate Change Service (C3S), providing a comprehensive and consistent record of the global atmosphere, land surface, and ocean based on the Integrated Forecasting System (IFS) Cy41r2 [12]. With an improved spatial lat–lon grid resolution of 0.5°, it surpasses its predecessor (ERA-Interim) and is suited for various applications. A recent upgrade in the dataset saw a back extension to 1940, providing over eight decades of consistent data records for the Land, Ocean, and Atmosphere. Several studies have confirmed the superiority of ERA5 over ERA-Interim [21,24,25,26]. The “Significant height of combined wind waves and swell” was used for all trend analyses in this study. This parameter represents the average height of the highest third of surface ocean/sea waves generated by wind and swell. It is computed as four times the square root of the integral over all directions and all frequencies of the two-dimensional wave spectrum [12].
Potential climate teleconnection to the wave climate in the ETA was assessed using the climatic indices data archived at the NOAA’s Climate Prediction Center. The archive provides historical, monthly tabulated indices for all teleconnection pattern amplitudes dating back to 1950 and standardized by the 1981–2010 climatology. Climate teleconnection describes the recurring, persistent large-scale anomalies in atmospheric pressure and circulation that are observable over vast geographic areas like an entire ocean basin, impacting temperature, rainfall, storm tracks, and jet stream dynamics across these extensive areas and can last from several weeks to months, and sometimes years. They are crucial in understanding both interannual and interdecadal variations in atmospheric circulation. We selected nine (9) climatic indices that are considered relevant to our study area (Table 1) for assessing their possible impact on the wave climate therein.

2.3. Methodology

2.3.1. Analysis of Mean Significant Wave Height

The spatial distribution of the mean SWH was computed for each grid point within the study area, from January 1940 to December 2022. In line with the objective of exploring the short- and long-term variabilities, we further computed the average over the months of the year, as shown in Equation (1) below.
X ¯ = 1 n i = 1 n H i
where X ¯ is the mean SWH, n is the number of data points (years/month) over 83 years, and H i is SWH from the ERA5 dataset.

2.3.2. Interannual Trend and Seasonal Trend

The Mann–Kendall (MK) trend test [27,28] was implemented to obtain the interannual and seasonal trends of SWH across the ETA. This classical non-parametric test is favored for analyzing trends in the time series of hydrometeorological variables because of its ability to handle non-homogenous datasets without a specific data distribution requirement. It is characterized and interpreted by the ‘S’ and ‘Z’ statistics and primarily determines the direction of change—positive, negative, or neutral—without quantifying the magnitude of the change. In other words, the ‘S’ statistics determines the direction of change—positive, negative, or neutral—without quantifying the magnitude of the change. For a given time series, the null hypothesis H0 assumes an independently distributed SWH and the alternative hypothesis H1 is that a monotonic trend exists in the series [29]. The S and Z statistics were computed for each grid. The null hypothesis is rejected if |Z| is larger than the theoretical value Z 1 a / 2 , for a two-tailed test. Where a is the statistical significance level being considered (95% in our case).
To quantify the rate of change, we complemented the MK test with the Theil–Sen Approach (TSA), also known as Sen’s slope estimator. This non-parametric method calculates all the slopes between pairs of points from a set of paired observations. By focusing on the median of these slopes rather than the mean, TSA minimizes the influence of outliers and extreme values, which distorts traditional linear regression analyses [30]. Sen’s slope was estimated as the median of the slopes (tjti)/(SHWjSWHi) determined for all pairs of sample points in the two-dimensional dataset (ti, SWHi).
Applying the MK test and TSA to the annual averages of SWH over 83 years and on the monthly data grouped over 83 years allowed us to evaluate the trend and the rate of change across the Eastern Tropical Atlantic. The workflow of the primary analyses in this study is shown in Figure 2.

2.3.3. Spectral Analysis and Teleconnection Assessment

We employed the Continuous Wavelet Transform (CWT) with the Morlet wavelet [31,32,33] to decompose the monthly time series of three grid points into the time-frequency domain, which enabled us to analyze the power variations within the series. The Morlet wavelet creates a balance between time and frequency localization and helps with precisely identifying and analyzing frequency variations and their temporal evolution. By scaling and translating the wavelet annually (12 months), we detect patterns and frequency shifts over time that are not readily visible in the raw data. Furthermore, we analyzed the wavelet power spectrum, which quantitatively measures the strength of the various frequency modes in the time series. This analysis helped identify dominant modes of variability, understand how these modes varied over time, and help us establish the long-term trends within the time series data.
The teleconnection of SWH in the ETA with the nine climatic indices in Table 1 was assessed through the wavelet coherence approach [34]. Wavelet coherence between the time series of the climate index and SWH is computed using data covering the duration for which data are available for both variables. This analysis quantifies the degree of correlation between the two datasets at different frequencies over time. The wavelet coherence, wavelet cross-spectrum, and the period associated with each coherence measure are obtained. However, the mean of the real part of the wavelet coherence is presented in this study. Using this approach to investigate the correlation between the climatic indices and the SWH variability in the ETA allows us to obtain more reliable results as it is unaffected by any non-linearity in the dataset that would ordinarily affect the traditional time-domain methods [35].

3. Results

3.1. Spatial Distribution of the Mean Significant Wave Height in the Eastern Tropical Atlantic

The spatial distribution of SWH over the 83 years under consideration is shown in Figure 3. At first glance, a clear zonal variation was observed in the Northern part of the ETA, and a meridional spatial variation was seen in the area within the Gulf of Guinea and the Southern parts. The highest SWH was observed towards the outside edges, specifically the northern and southern extents of the study domain. Wave activity decreases significantly as one moves towards the equator from the Northern and Southern boundaries. The ETA’s highest average SWH stands at 2.23 m over the 83-year period and was observed around the southeastern boundaries, particularly offshore of Namibia (refer to GoogleMap for country borders). In contrast, the Gulf of Guinea has a relatively calm wave activity with a mean SWH of 1.2 m along its West African coast. The mean SWH distribution in the Eastern Tropical Atlantic (ETA) is mainly influenced by winter storms in the Northern Hemisphere. These storms cause robust waves that propagate into tropical waters from the North Atlantic. At the same time, swells from the Southern Atlantic westerlies also contribute, especially to the southern bounds of the study area.

3.2. Seasonal Distribution of SWH

The seasonal distribution of the SWH over the ETA reflects the alternation of the dominance of primary mid-latitude storms. The imprints of boreal and austral storm climates were observable in the seasonal distribution of waves in this area. Boreal storms largely influence the dry season (DJFM), with large waves from the North Atlantic storm regions propagating southwards into the ETA area, resulting in high SWH values exceeding 2.2 m (Figure 4) in the northwestern quadrant of the study area. In contrast, the southern region had lower SWH values. During the wet season (MJJASO), larger waves were observed in the southern region, whereas lower values were registered in the northwestern region. The transition from boreal to austral influence was distinctly perceivable in April and November, although the most potent waves were observed in July and August. The wet season saw a significant section of the southern regions, recording SWH values exceeding 2.2 m (Figure 4). The Gulf of Guinea (GOG) also experienced an increase in the SWH during this period due to amplified storm activities in the Southern Ocean and the presence of the West African Monsoon (WAM), generating larger waves that propagated into the study domain and reached the West African coasts.
By comparing the differences in mean SWH in the ETA between the wet and dry seasons, up to 30% variation in the northwestern part of the study area near the Cape Verdean islands was observed (Figure 5). A 25% difference was observed near the coast of Equatorial Guinea, whereas a 20% SWH difference was observed along the West African coast. The slightest variations (≤15%) were obtained within latitudes 8° N–8° S and longitudes 24° W–16° W.

3.3. Temporal Trends of SWH in the ETA between 1940 and 2022

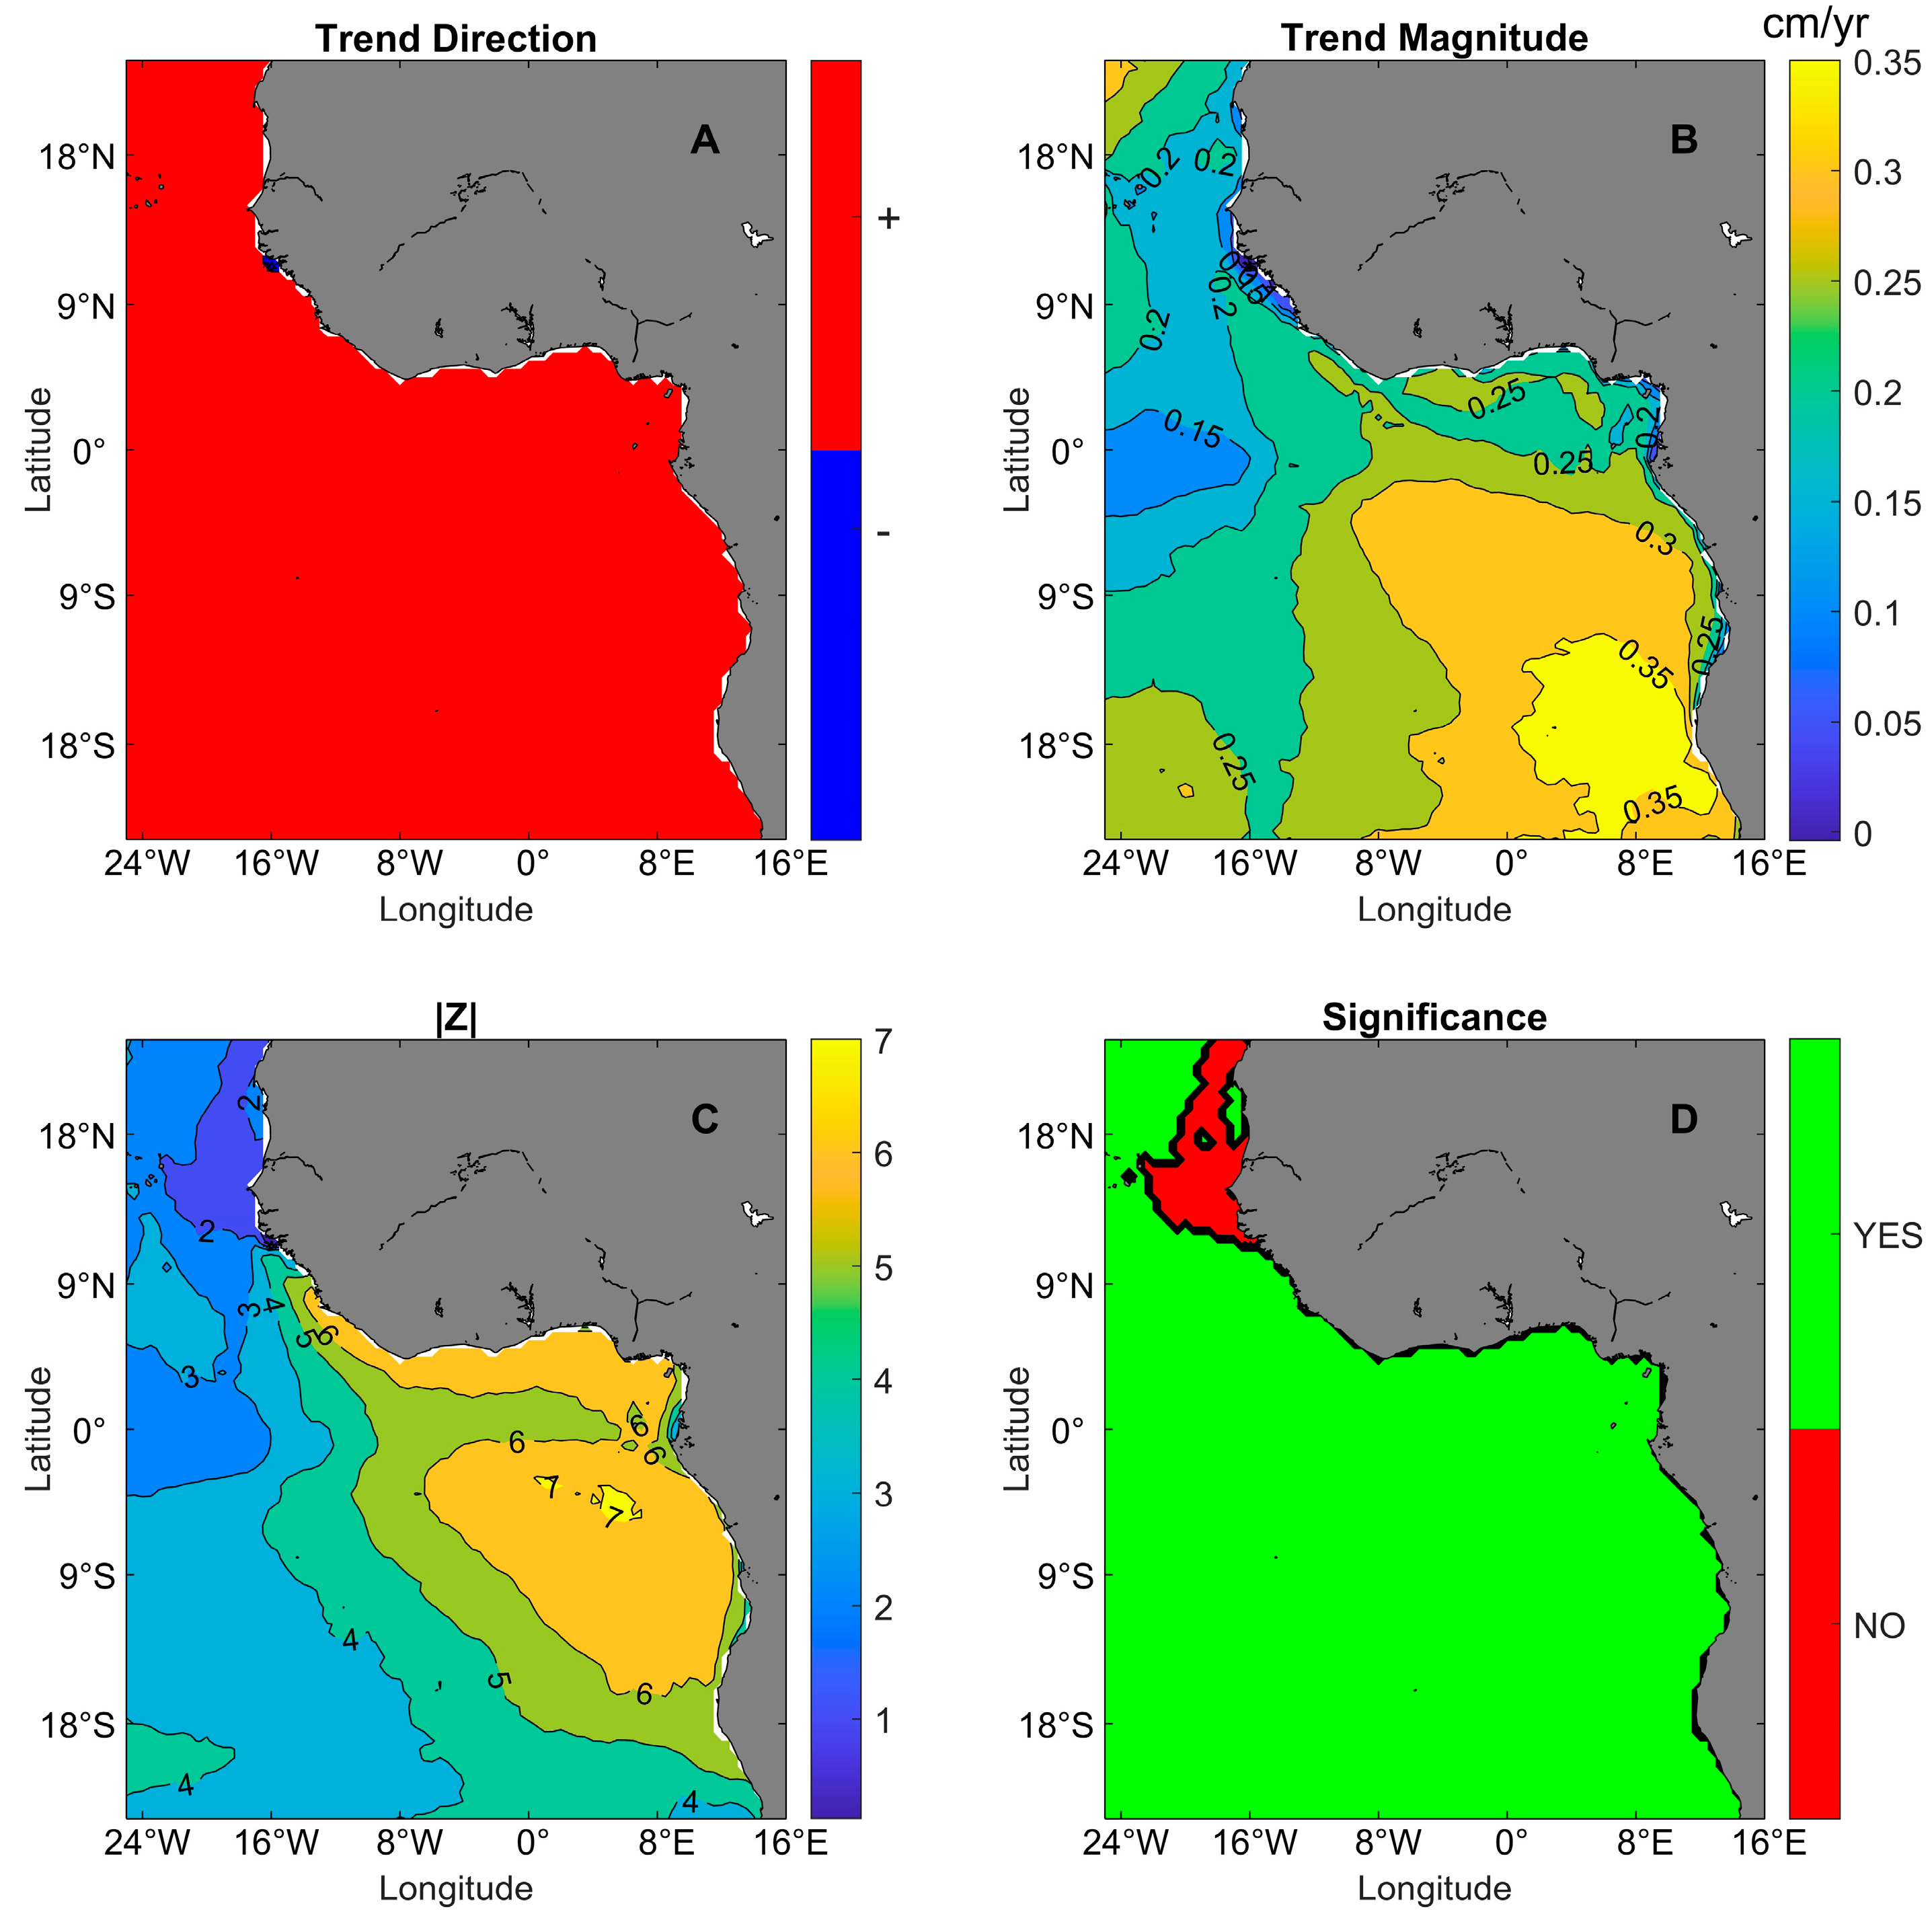
3.3.1. Interannual Trends

The application of the Mann–Kendall trend test to assess the evolution of SWH across the Eastern Tropical Atlantic (ETA) over the analyzed period revealed a predominantly moderate yet discernibly positive trend of SWH variability (Figure 6A). The estimated slope of the trend ranged from −0.0037 cm/yr near Guinea-Bissau to 0.39 cm/yr offshore of Namibia (Figure 6B). Generally, the southern parts of our domain, including the Gulf of Guinea, have the steepest slopes. In contrast, the northwestern region (including the Senegalese and Mauritanian coasts) has witnessed weaker and less significant trends. Comparatively, the western boundaries exhibited a slower rate of change, notably in the equatorial area of the western bound of our domain. Figure 6C,D shows the significance of the trends observed in our analysis. The absolute value of the standardized statistic (|Z|) was obtained for all grid points in our domain and compared to the critical value at the 95% significance level (1.96), and the observed trends are not by chance; hence, we accept the alternative hypothesis. This shows that the observed trend was not merely a chance and could have been influenced by the teleconnection of local and remote climate phenomena. The p-values associated with the Z statistic further confirm the significance of the trend observed in our domain, with areas within the Gulf of Guinea having the highest significance. The binary image of significance (YES p-value < 0.05; NO: p-value ≥ 0.05) is shown in Figure 6D and highlights that only a small portion of the study domain (in the northwestern region) has witnessed trends that can be considered non-significant.

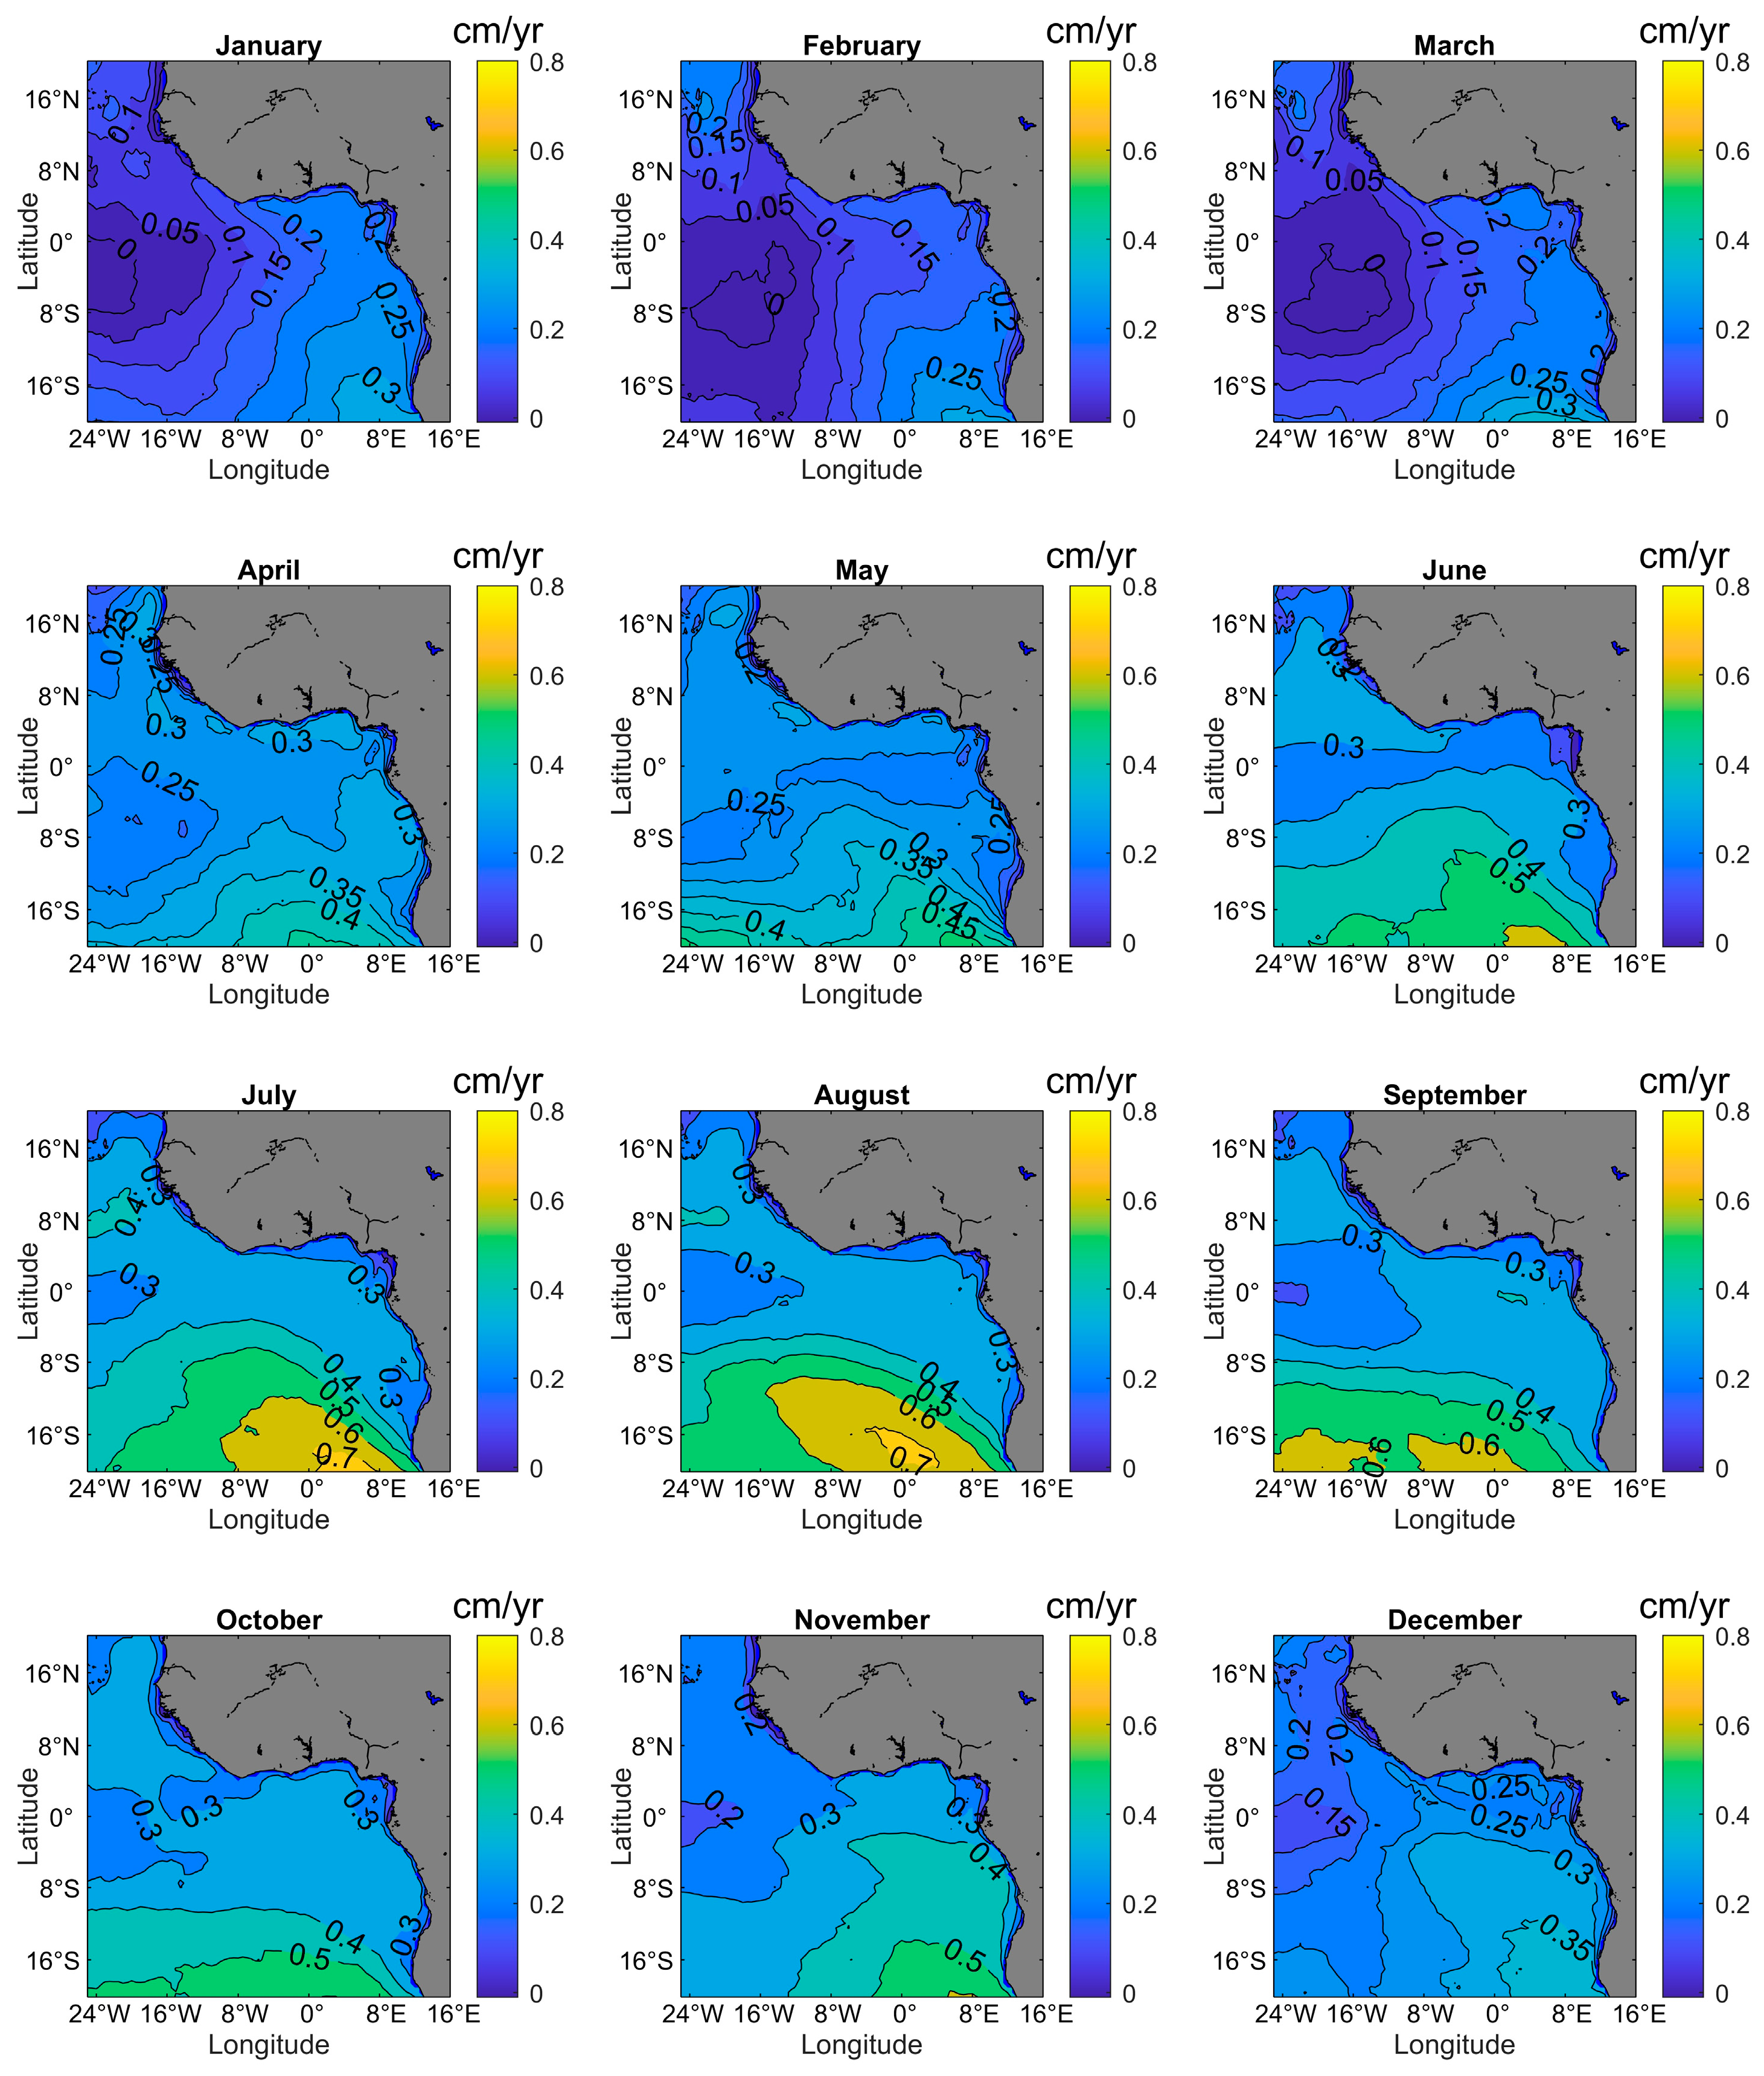
3.3.2. Seasonal Trends

Our analysis showed heterogeneous monthly variations. Mild rates of change emerged during the Boreal winter months (December to March), while the Austral winter months consistently uphold positive moderate-to-high rates of change (Figure 7). The observed trends were mostly stronger than the interannual trends. Particularly noteworthy is the positive and high rate of change within the Gulf of Guinea region, which transcends all seasons. Moreover, the areas west of 8° W latitude predominantly exhibit weaker trends; negative trends are seen around the equator in those western locations. Concerning the rate of change, higher rates (0.2 cm/yr to 0.75 cm/yr) are witnessed during the wet season (May through November), while slower (and negative) trends emerge during the dry season (Boreal winter). The highest positive rates of change (>0.7 cm/yr) were recorded between June and September around the southeastern boundary of the ETA (Figure 7). This further emphasizes the role of Austral winter winds in these regions. The Gulf of Guinea region shows a dominant positive trend, approximately 0.2-0.4 cm/yr, across all seasons. Essentially, the areas west of 8° W longitude experienced a minimal rate of change across all months, specifically during the boreal winter months.

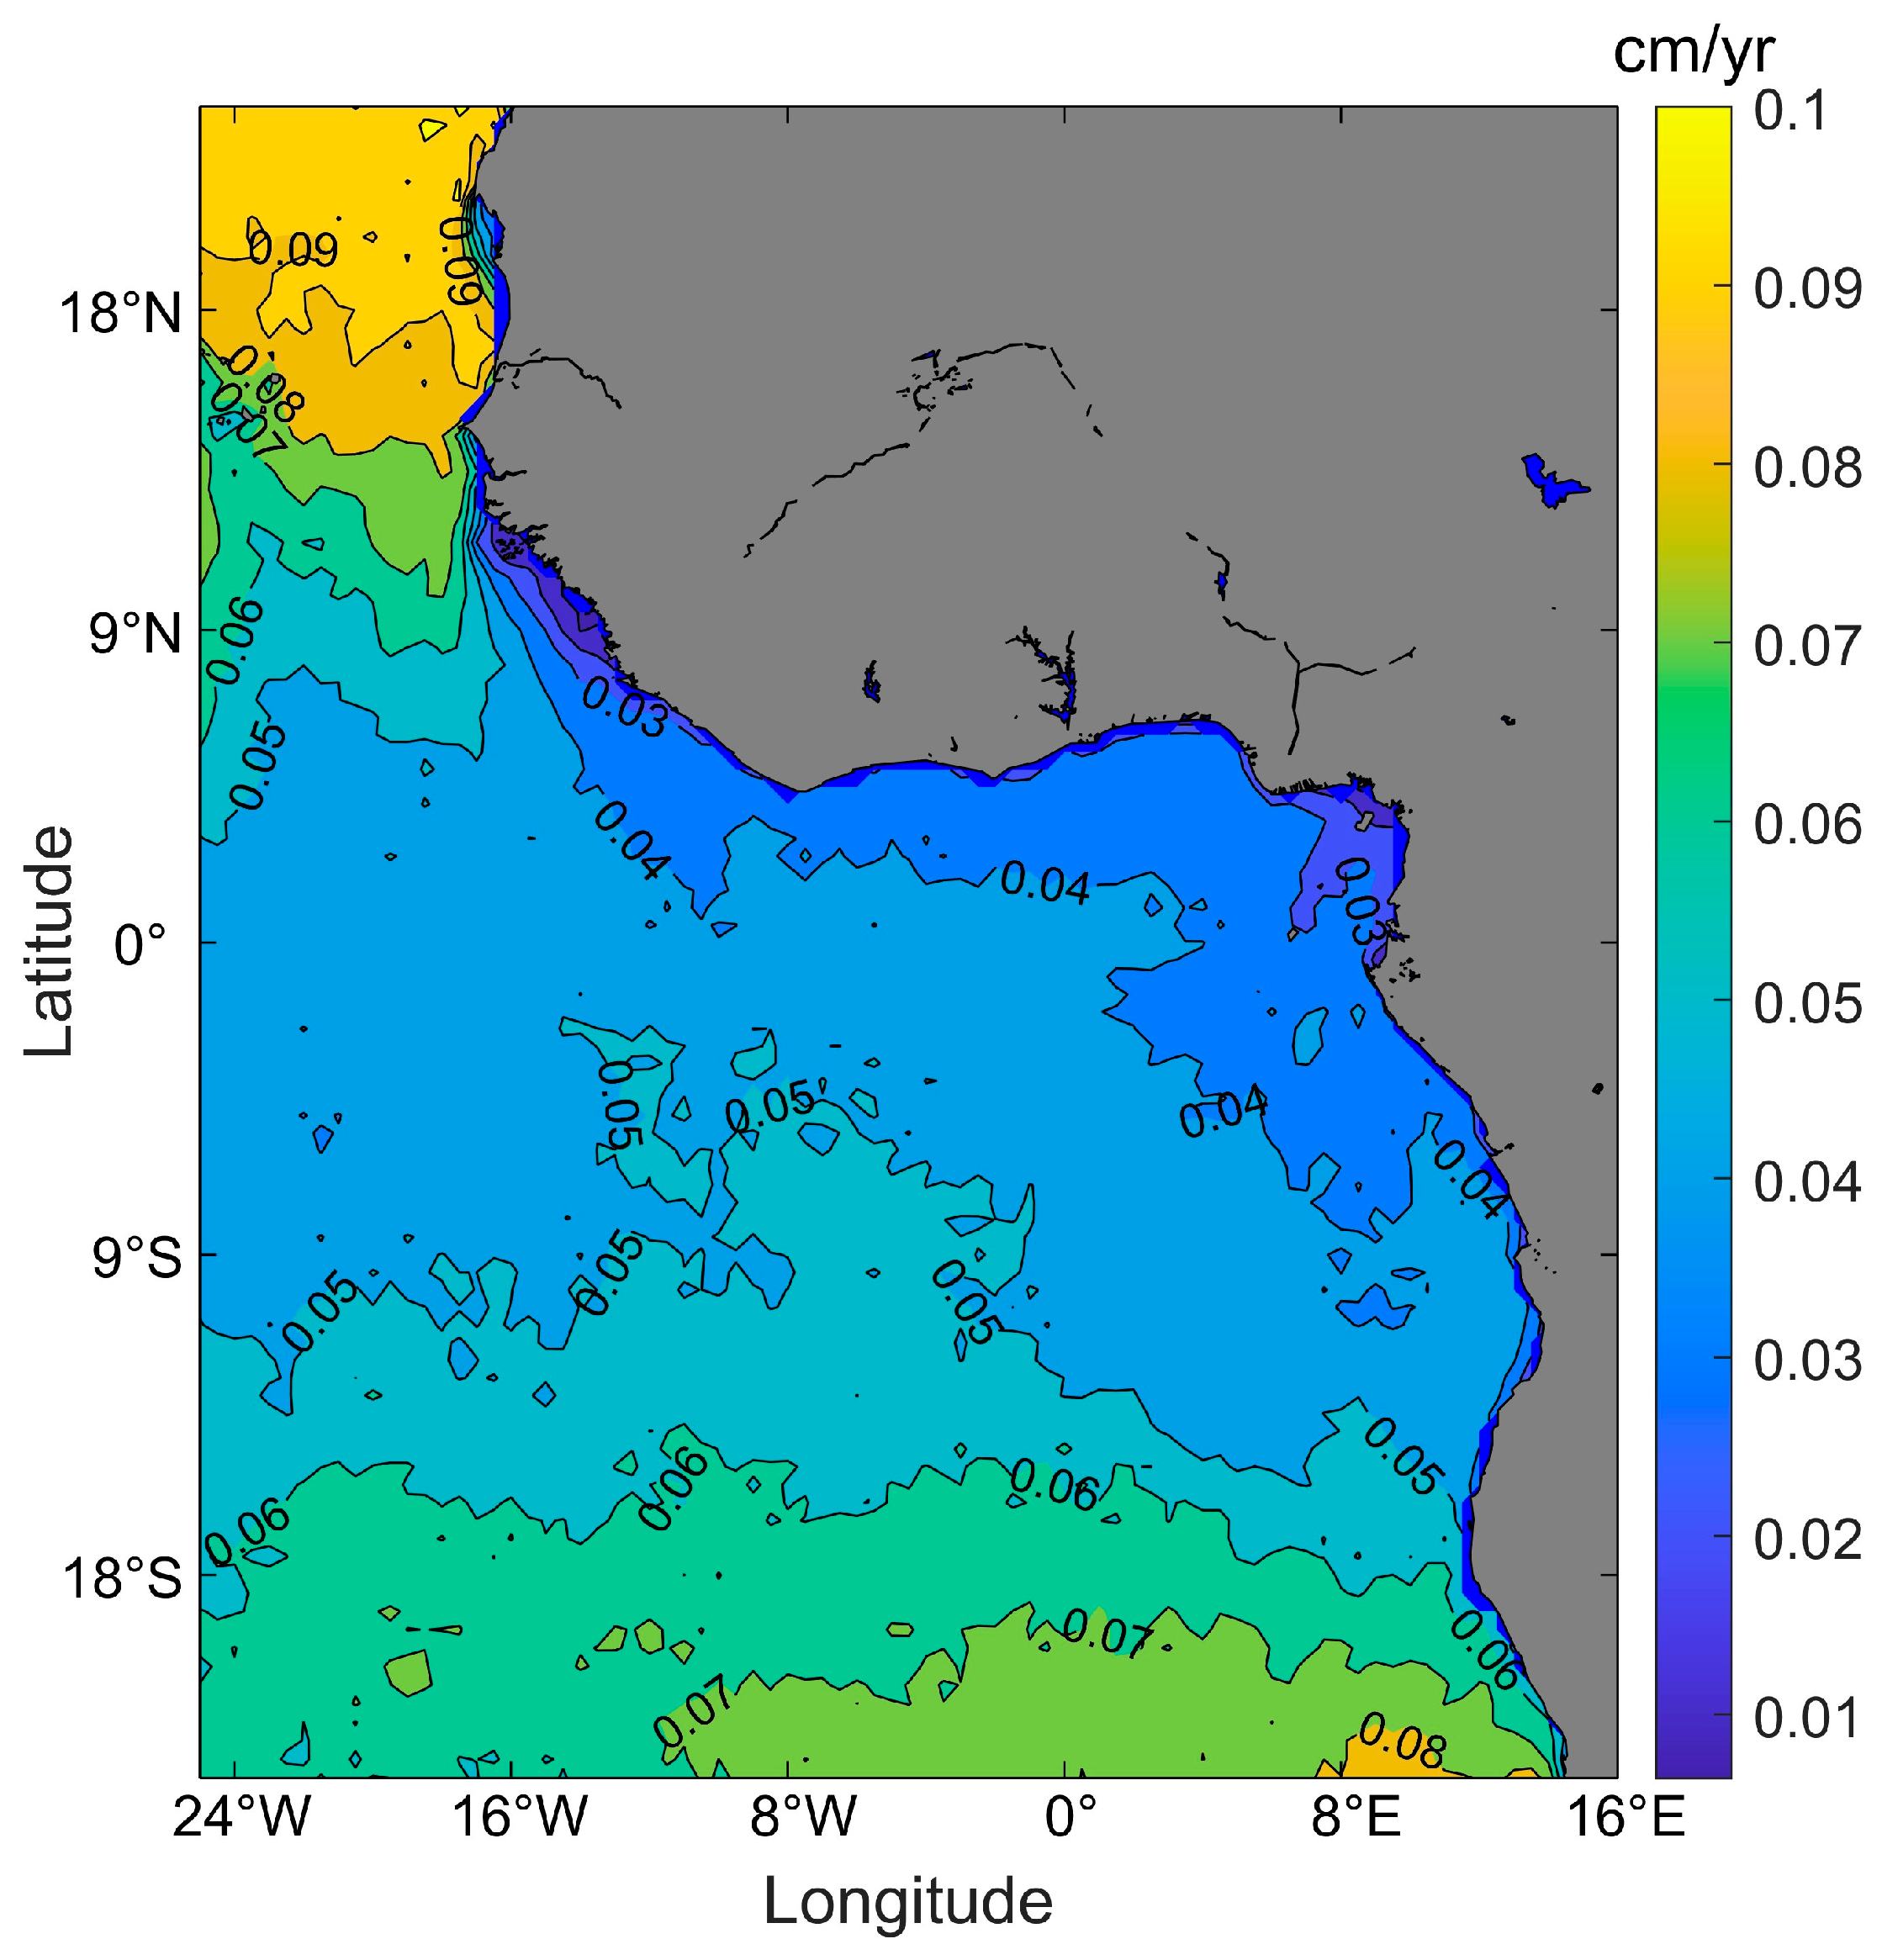
3.3.3. Analysis of Uncertainty

The significance of the observed trends was quantified according to the classical methods used in this study. As noted in Section 3.3.1, the observed interannual trends are statistically significant (Figure 8) over most of the study area. However, non-significant trends were observed for the Boreal winter months, especially at the northwestern boundaries. To quantify the uncertainties related to the TSA-estimated interannual rates of change, we bootstrapped one thousand samples from the annual mean SWH for each grid point, computed the slope for each bootstrapped sample, and calculated the standard errors and 95% confidence intervals. The standard error associated with our slope estimates was in the range of 0.0064 cm/yr around Guinea-Bissau to 0.1024 cm/yr off the coast of Mauritania. Generally, the larger standard errors are associated with the northwestern areas of our study domain, roughly the areas with non-significant trends, and the southeastern areas where the highest rates of change were reported. The standard error becomes relatively minimal as one moves from the northern and southern extremes of the ETA into the Gulf of Guinea and its inner coasts. At the 95% confidence level, the ranges of the lower and upper limits of the calculated rates of change are [−0.0522 cm/yr to 0.3004 cm/yr] and [0.0141 cm/yr to 0.5328 cm/yr], respectively. These uncertainties guide the interpretation of the results reported in this paper, and readers are employed to take note.

3.3.4. Decadal Trends in SWH Variability in the ETA

To assess the long-term trends in SWH in the ETA, we applied the Morlet wavelet (‘amor’ in MATLAB) to the monthly time series of three systematically selected points, as shown in Figure 1. P1 was chosen to represent the northern regions with relatively low rates of interannual change, P2 represents the coast of the Gulf of Guinea, and P3 represents the southern area where high rates of change have been observed on the interannual scale. With a sampling rate of 12, corresponding to the number of months in a year, we computed the continuous wavelet transform for the points and estimated the global wavelet spectrum (Figure 9). The global spectrum (right panels), a measure of the power of the signal at different frequencies averaged over time, shows the period corresponding to the dominant trends indicated by the power spectrum (left panels). Peaks in the global wavelet spectrum indicate frequencies at which the signal has a large amount of power and correspond to periodic components of the signal or to frequencies at which the signal’s behavior changes significantly.
Signals with power densities ranging from 0.05 to 0.3 (m2) were observed for the points. The highest power density was observed at point P1 (0.3 m2), located in the northwestern part of the ETA, and corresponds to 11 years, 7 months, and 20 days. P2 has a power density of 0.22 m2, while P3 has a power density of 0.27 m2, all with the same corresponding period as P1. Weaker signal strengths were also observed, corresponding to periods of approximately 2 years and 8 months (2.7 years) and 5 years and 9 months (5.8 years) for points P2 and P3, respectively. The power of the 2.7-year signal is higher at points P1 and P3 (Northern and Southern area) and relatively lower at point P2.

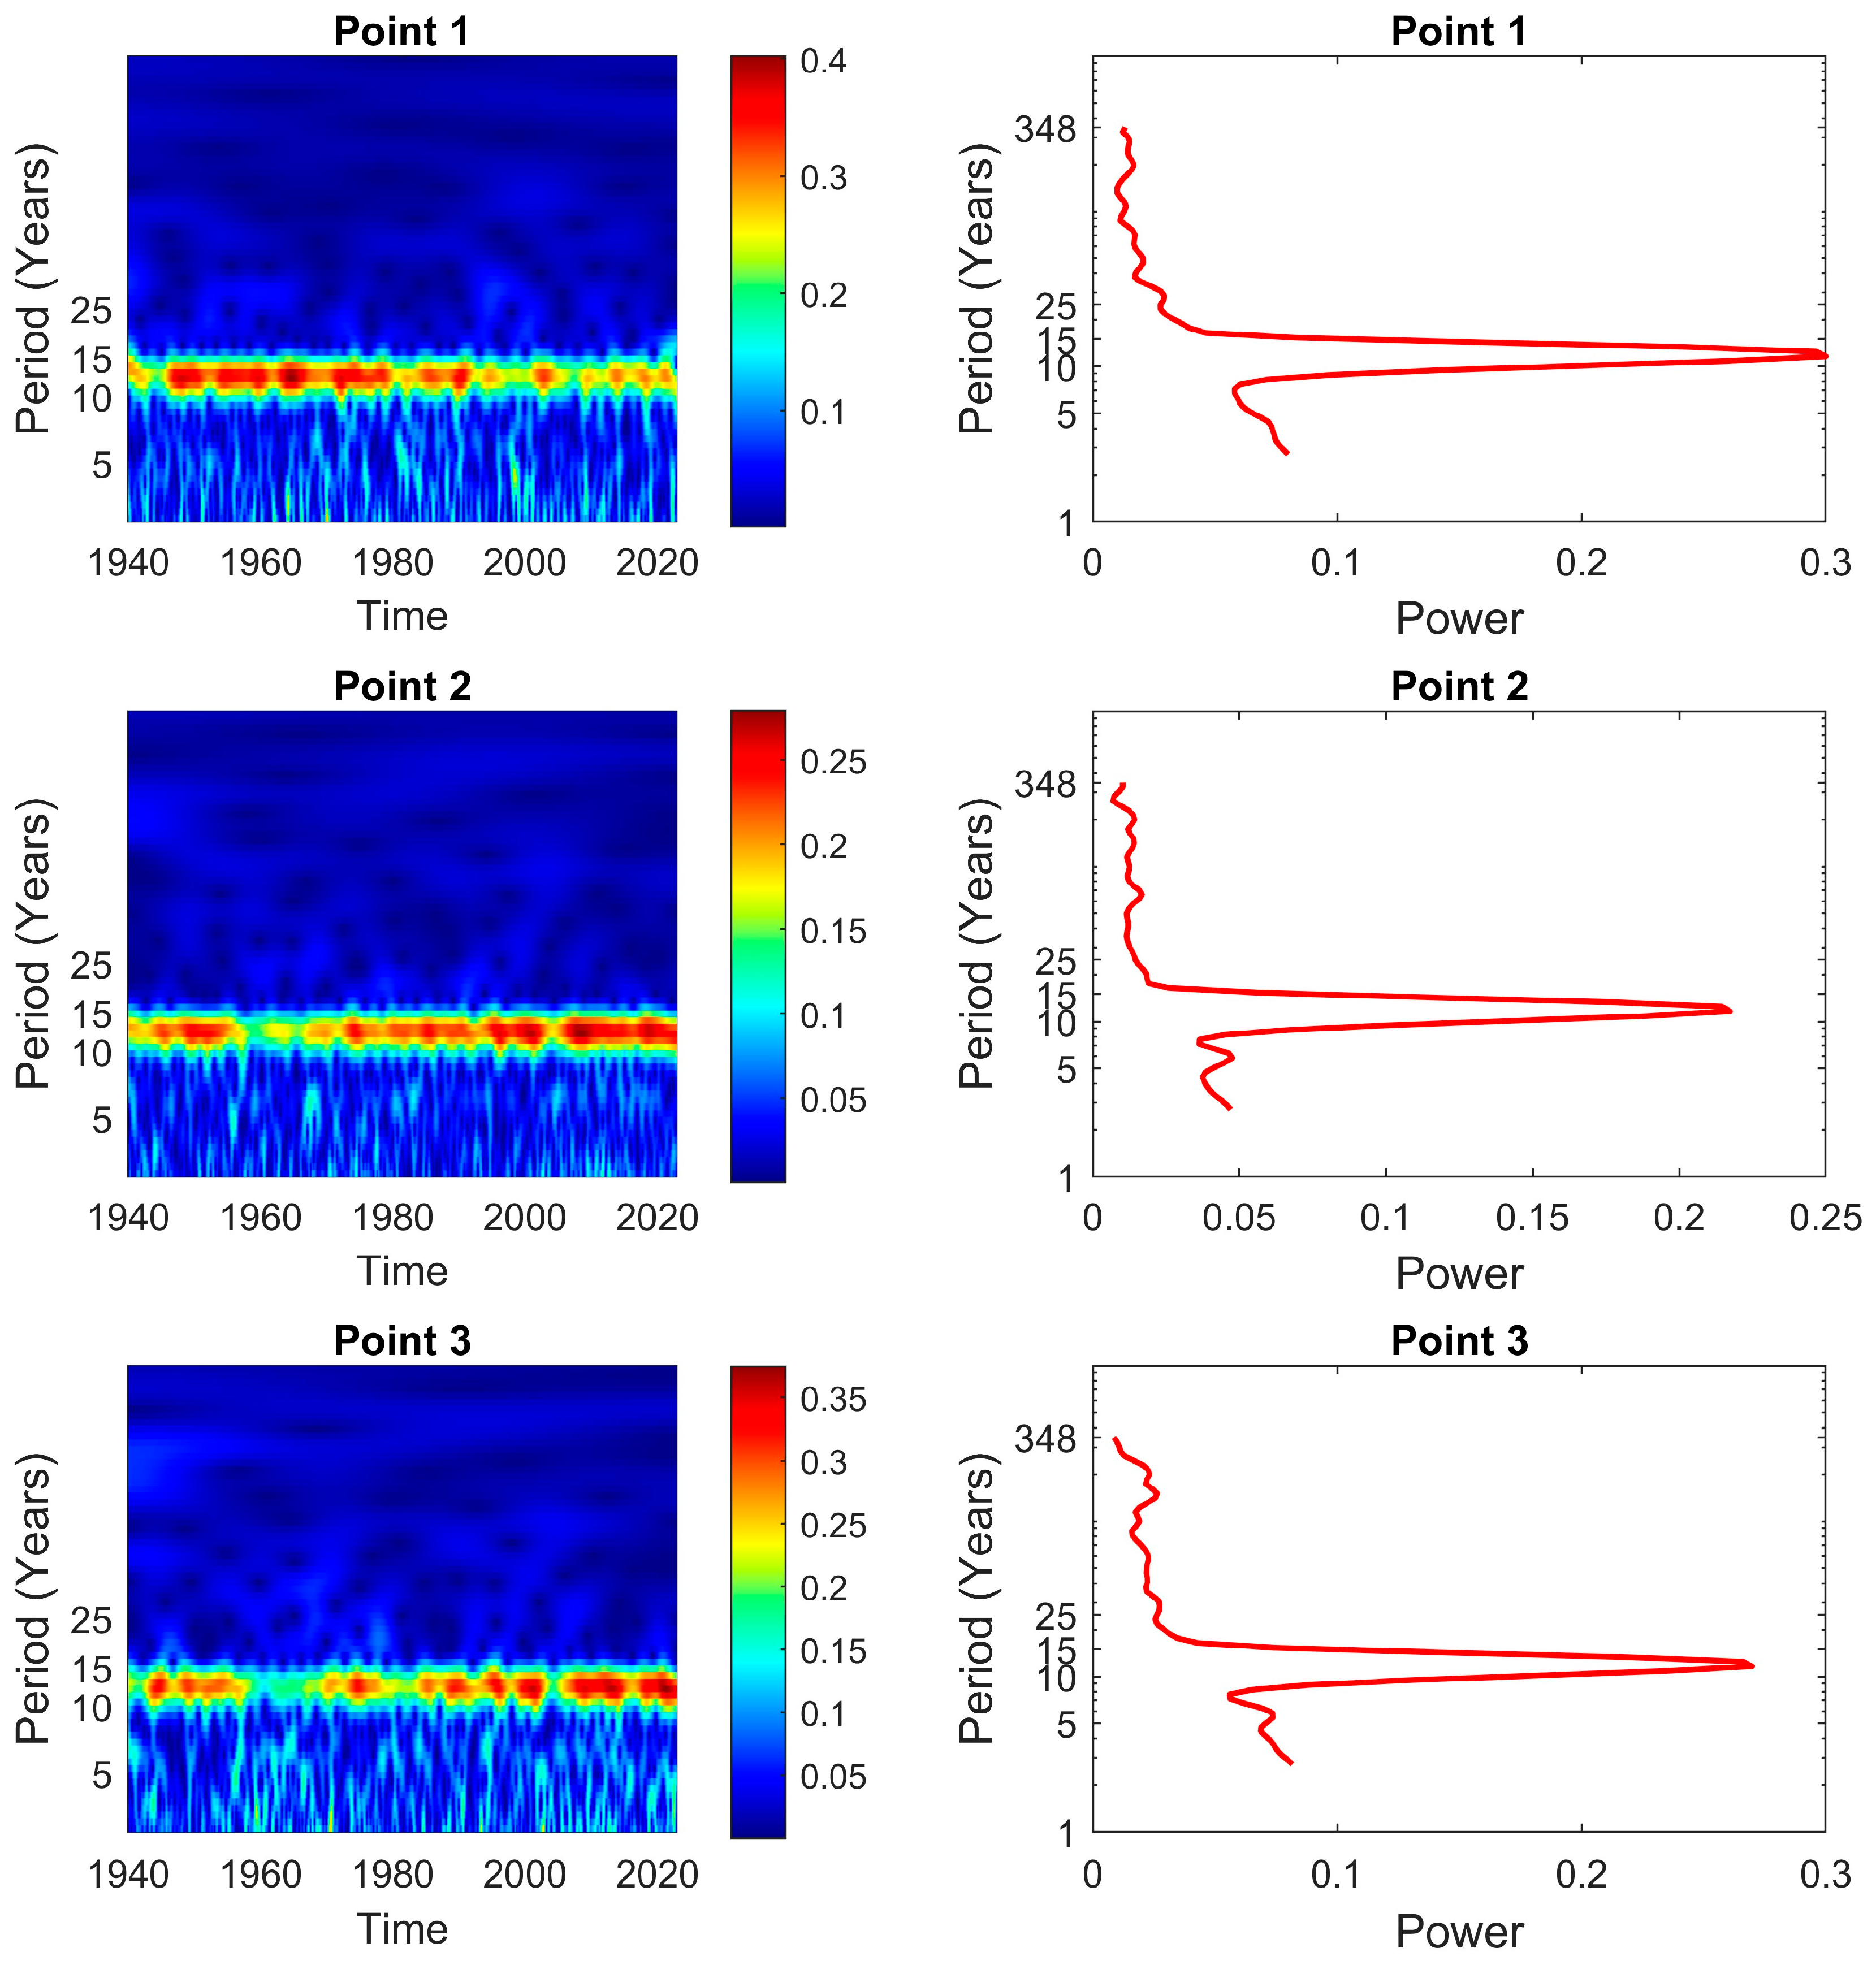
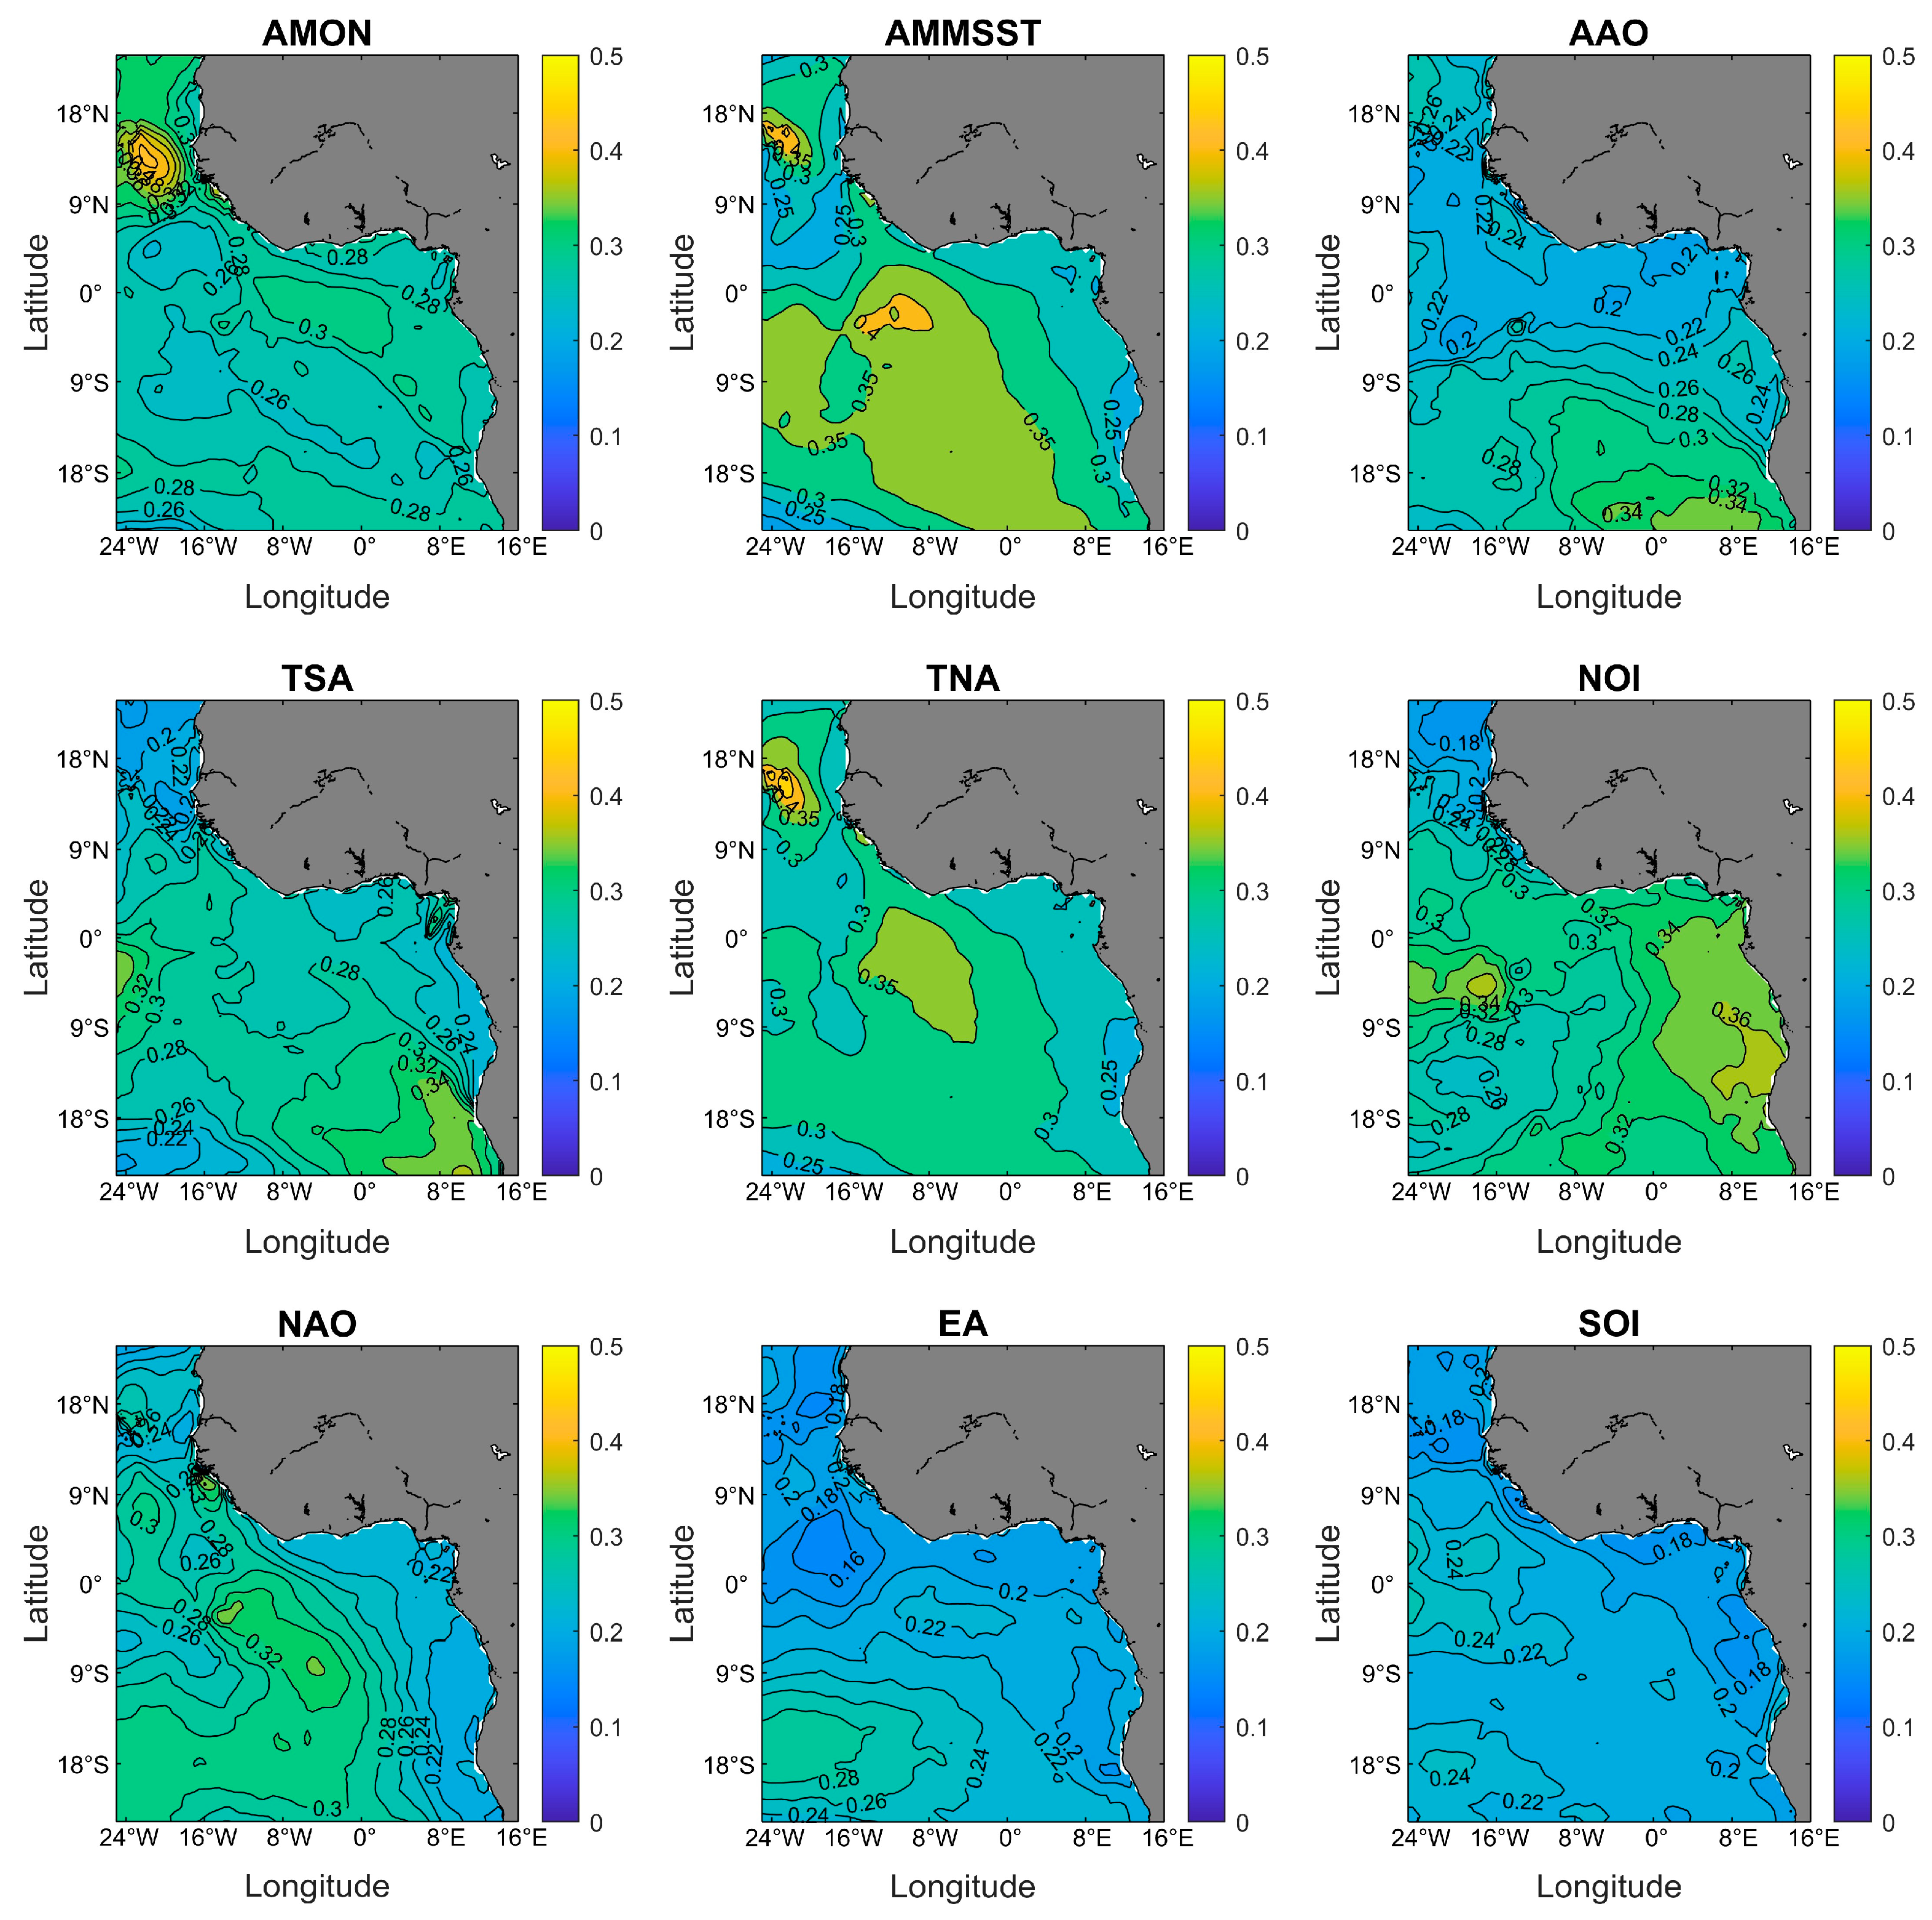
3.4. Climatic Teleconnection with SWH in the ETA

Climate teleconnection describes the recurring, persistent large-scale anomalies in atmospheric pressure and circulation that are observable over vast geographic areas like an entire ocean basin, impacting temperature, rainfall, storm tracks, and jet stream dynamics across these extensive areas and can last from several weeks to months, and sometimes years. They are crucial in understanding both interannual and interdecadal variations in atmospheric circulation and their effect on ocean wave climate and adjoining coastal systems [36,37,38]. For instance, when wind speeds intensify and the locations of storm fields shift, an amplification of the interannual and seasonal trends of SWH in the ETA is anticipated. The effects of these climate indices on ocean waves have been assessed using methods such as linear regression [16] and Principal Component Analysis [14], and they have been shown to correlate with the variability in ocean wave climate.
Here, we assess the coherency of nine climate indices (Table 1) with the SWH distribution over the ETA (Figure 10). We present a measure of the central tendency (mean) of the computed coherence between each climate index and at each grid point. These climate indices differed in their perceived influence on the wave climate in the ETA. Notably, the Atlantic Meridional Mode Sea Surface Temperature (AMMSST), the North Oscillation Index (NOI), and the Tropical South Atlantic Index have relatively higher coherence with the annual mean SWH in the ETA. Nevertheless, positive coherence (usually above 0.2) was observed across all parts of the ETA. Largely, AMMSST has the strongest coherence with SWH in the ETA with up to 0.44 coherence value on the outer boundaries of the Gulf of Guinea. The AMMSST and TNA show similar coherence distributions over the ETA, although AMMSST has a slightly stronger coherence value. On the other hand, the East Atlantic and Southern Oscillation indices are the least coherent with the SWH in the ETA. The NOI is more strongly coherent with the SWH climate along the coast of GOG than the other climate indices considered in this study. In contrast, the TSA is most strongly coherent with the SWH conditions in the southeastern area of the ETA. Moreover, AMON, AMMSST, and TNA show high coherence with SWH around the Cape Verdean islands.

4. Discussion

Our results show that the SWH is higher in the northeastern and southeastern parts of the study domain because of the exposure of these regions to mid-latitude storm fields from which large swells diffuse into the Eastern Tropical Atlantic [14]. The wave height subsides as they travel away from the region of generation (high wind speed) into relatively calmer waters and as they transit into shallow-water regions. These waves travelled away from the storm fields that formed them and underwent a refining process, resulting in more consistent wave regimes. The wave evolves spatially and temporally, potentially impacting adjacent coastal areas. Our results on the seasonal trends validate Semedo et al.’s [14] findings that the wave climate in the ETA shares notable links with the North and South Atlantic wave generation areas and their inherent alternating seasonality. This suggests that the minimal difference between wet and dry season wave climates at approximately 8° N–8° S and longitudes 24° W–16° W (Figure 5) is due to the area’s exposure to both northerly and southerly influences, which sustain stable wave conditions throughout the year regardless of the alternating dominance between boreal and Austral storm fields in other areas. Hence, the assessment of wave climate in the ETA can be used as a proxy for investigating climate patterns from beyond the region. According to IPCC reports [39] a shift and rise in storm track frequency have been observed, and this would continuously influence the ocean surface dynamics, leading to more variability in the wave climate.
Furthermore, our results agree with previous studies that have assessed the trend of SWH in parts of our study area [16] and elsewhere [14]. However, by exploring the trends at the monthly, annual, and decadal scales, more information on the actual variability in SWH over the entire ETA has been made available. Dada et al., 2016 [16] reported a positive trend of mean SWH characterized by a slope of 0.3–0.5 cm/yr in the Niger Delta region, which is in sync with our findings. The consistent 83-year record of SWH provided us with a sufficiently long dataset with which we estimated the rates of change and accounted for the uncertainties in our calculations. This has, therefore, provided a suitable material that could be used to forecast future wave climates and potential hazards related to them. The wavelet transform used to reveal the decadal trend in SWH in the ETA shows the strength and frequency of the decadal variability. The consistency of the decadal trend (11.6 years) opens a new conversation on the drivers of such a trend.

4.1. Causes of the Observed Trends

The measured coherency of SWH with the climate indices shows that the SWH in the ETA bears the imprints of climatic forcings that affect the storm fields from where the swells in the ETA propagate, as it has been noted that the ETA is primarily a swell-dominated region [14]. The mode of impact of the climate indices on the ETA is not entirely understood currently; however, we believe they have a compounding effect on the wave climate therein. For instance, the North Atlantic Oscillation (NAO), the Southern Oscillation index, and many other indices have direct impacts on the paths, intensity, direction, and frequency of westerly winds and storm tracks across the North Atlantic and significantly impact the wave climate and other weather phenomena (hurricanes) therein. In addition, The AMMSST, a measure of the north–south gradient of sea surface temperatures in the Atlantic Ocean, influences the positioning and strength of the Intertropical Convergence Zone (ITCZ), affecting trade winds and wind sea generation in the Tropical and Subtropical Atlantic, hence, high coherence is seen towards the outer boundaries of the Gulf of Guinea. These climate indices modulate air–sea interactions and influence storm intensity and frequency over the Atlantic Ocean [14,16,40]. The positive interannual and seasonal trends of SWH in the ETA can be linked to the increase in wind speeds in both hemispheres [10] and the movements of the storm fields [39] in response to changes in air mass and atmospheric circulation. Such changes in atmospheric mass distribution directly impact the atmospheric pressure patterns at different parts of the Earth and, by extension, the air–sea dynamics through which the waves are generated. For instance, indices like the AMMSST, TSA, and TNA track the long-term changes in sea surface temperatures across the Atlantic Ocean and influence the wave climate by affecting the development of storms and wind patterns, which in turn impact wave generation and behavior in those regions. On the other hand, indices like the NAO, NOI, and AMON reflect pressure variations and anomalies at different locations on the Earth

4.2. Implications of the Observed Trends

The observed rates of change in SWH manifest a translation of ongoing climate change into an ocean wave climate. This could lead to an increase in coastal hazards and vulnerabilities of coastal communities in the near future. Wave climate is one of the major factors upon which a recent assessment of West Africa’s coastal physical vulnerability was based [1]. Increasing wave heights indicate the propagation of more energetic waves into the ETA and an attendant increase in coastal erosion rates. Studies have reported rapid coastal erosion and inundation along the West African coastline in recent decades [41,42], and these elevated erosion rates have been linked to a changing wave climate.
Our analysis showed, with significant confidence, that the trends reported in this study are bound to persist or increase under future climate scenarios. For instance, the Southern Ocean wave climate will witness a 10% increase towards the end of the current century under the most conservative emission scenario [43]. This is because of the increasing storminess and frequency of tropical cyclones in the Tropical Atlantic, driven by the rising sea surface temperature across the global ocean [44]. Such trends lead to higher risks of failure for existing coastal structures and increasing rates of erosion and flooding along the coast [45,46]. Moreover, as climate change continues influencing global climate patterns, areas such as the ETA will experience greater wave climate variability. Therefore, stakeholders across various sectors must be equipped with this knowledge to ensure proactive measures are taken to mitigate the potential adverse impacts. In choosing design parameters for coastal infrastructure meant for this area, coastal engineers and policy makers need to take cognizance of the variability in wave climate in their designs. As build, operate, and transfer (BOT) is a common public-private partnership practice in the West African region, government representatives charged with oversight functions should consider information on wave climate variability in their dealings to ensure that the public does not incur avoidable future costs.

5. Conclusions

Wave climate variability directly impacts the planning, functioning, and maintenance of coastal and offshore infrastructure. Keeping track of changes in wave climate is vital for ensuring the safety of infrastructure and ecosystems in the ETA region, as these changes can modify coastal sediment dynamics, leading to evolving patterns of beach erosion and accretion. We analyzed the short- and long-term trends in SWHs in the Eastern Tropical Atlantic region. Our results demonstrate a significantly heterogeneous distribution of wave height and associated trends across the region. The coast of Guinea Bissau has the lowest height of a mere 0.23 m and the northwestern and southeastern parts with wave heights exceeding 2.1 m. A statistically significant positive trend was observed across the region with varying annual and seasonal changes. The rate of change in the SWH was analyzed from the ECMRWF’s ERA5 dataset, which covers 83 years from 1940 to 2022. In most areas, SWH increased at a rate of more than 0.20 cm/yr while reaching up to 0.39 cm/yr (or 0.7 cm/yr in August) near the coasts of Angola and Namibia. The SWH wave climate portrays a consistent decadal signal with a period of approximately eleven and a half years. SWH in the ETA is moderately coherent with AMMSST, TNA, TSA, NOI and AMON and implies positive teleconnection with global climate dynamics. We recommend future studies to investigate the drivers of the observed decadal trends and the implications of the climatic teleconnection of such trends. Our uncertainty analysis supports our results with the information required for interpretation and application. The attention of policy makers and stakeholders in coastal and offshore management is drawn to the need to update design and management policies based on updated updates.

Author Contributions

Conceptualization, O.O. and A.T.; methodology, O.O. and S.D.; data curation, V.E.S.; writing—original draft preparation, O.O.; writing—review and editing, O.O., E.O.E. and A.A.; supervision, A.T. All authors have read and agreed to the published version of the manuscript.

Funding

This research is supported by the National Key R&D Program of China (2023YFE0126300), the A4 Project (Aigéin, Aeráid, agus athrú Atlantaigh), with the support of the Marine Institute, under the Marine Research Programme, funded by the Irish Government grant no.: PBA/CC/18/01).

Institutional Review Board Statement

Not applicable.

Informed Consent Statement

Not applicable.

Data Availability Statement

The ERA5 [12] dataset was used for the main analysis in this study and downloaded free of charge from the European Center for Medium-Range Weather Forecast’s website. Climate index data were downloaded free of charge from NOAA’s Climate Prediction Center.

Conflicts of Interest

The authors declare no conflicts of interest.

References

  1. Dada, O.A.; Almar, R.; Morand, P. Coastal Vulnerability Assessment of the West African Coast to Flooding and Erosion. Sci. Rep. 2024, 14, 890. [Google Scholar] [CrossRef] [PubMed]
  2. Dahunsi, A.M.; Foli, B.A.K. Assessment of Past and Future Potential of Ocean Wave Power in the Gulf of Guinea. Int. J. Sustain. Eng. 2023, 16, 302–323. [Google Scholar] [CrossRef]
  3. Sirimanne, S.N.; Hoffman, J.; Juan, W.; Asariotis, R.; Assaf, M.; Ayala, G.; Benamara, H.; Chantrel, D.; Hoffmann, J.; Premti, A. Review of Maritime Transport 2019. In Proceedings of the United Nations Conference on Trade and Development, Geneva, Switzerland, 30 October 2019. [Google Scholar]
  4. Amuwo, K. Oil and Gas: National Sovereignty, Foreign Interests and Local Bunkering in the Gulf of Guinea (GoG). Covenant Univ. J. Politics Int. Aff. 2013, 1, 148–178. [Google Scholar]
  5. Nyemah, R.G.M. Economics of Oil Discovery in West Africa: The Nigerian Experience. Reg. Marit. Univ. Res. Consult. 2011. Available online: https://www.ajol.info/index.php/rmuj/article/view/112005 (accessed on 31 March 2024).
  6. Smedman, A.; Högström, U.; Sahlée, E.; Drennan, W.M.; Kahma, K.K.; Pettersson, H.; Zhang, F. Observational Study of Marine Atmospheric Boundary Layer Characteristics during Swell. J. Atmos. Sci. 2009, 66, 2747–2763. [Google Scholar] [CrossRef]
  7. Chen, G.; Ezraty, R.; Fang, C.; Fang, L. A New Look at the Zonal Pattern of the Marine Wind System from TOPEX Measurements. Remote Sens. Environ. 2002, 79, 15–22. [Google Scholar] [CrossRef]
  8. Chen, G.; Chapron, B.; Ezraty, R.; Vandemark, D. A Global View of Swell and Wind Sea Climate in the Ocean by Satellite Altimeter and Scatterometer. J. Atmos. Ocean. Technol. 2002, 19, 1849–1859. [Google Scholar] [CrossRef]
  9. Young, I.R. Seasonal Variability of the Global Ocean Wind and Wave Climate. Int. J. Climatol. 1999, 19, 931–950. [Google Scholar] [CrossRef]
  10. Young, I.R.; Zieger, S.; Babanin, A.V. Global Trends in Wind Speed and Wave Height. Science 2011, 332, 451–455. [Google Scholar] [CrossRef]
  11. Group, T.W. The WAM Model—A Third Generation Ocean Wave Prediction Model. J. Phys. Oceanogr. 1988, 18, 1775–1810. [Google Scholar] [CrossRef]
  12. Hersbach, H.; Bell, B.; Berrisford, P.; Hirahara, S.; Horányi, A.; Muñoz-Sabater, J.; Nicolas, J.; Peubey, C.; Radu, R.; Schepers, D.; et al. The ERA5 Global Reanalysis. Q. J. R. Meteorol. Soc. 2020, 146, 1999–2049. [Google Scholar] [CrossRef]
  13. Meehl, G.A.; Boer, G.J.; Covey, C.; Latif, M.; Stouffer, R.J. The Coupled Model Intercomparison Project (CMIP). Bull. Am. Meteorol. Soc. 2000, 81, 313–318. [Google Scholar] [CrossRef]
  14. Semedo, A.; SušElj, K.; Rutgersson, A.; Sterl, A. A Global View on the Wind Sea and Swell Climate and Variability from ERA-40. J. Clim. 2011, 24, 1461–1479. [Google Scholar] [CrossRef]
  15. Campos, R.M.; Alves, J.H.G.M.; Guedes Soares, C.; Guimaraes, L.G.; Parente, C.E. Extreme Wind-Wave Modeling and Analysis in the South Atlantic Ocean. Ocean Model. 2018, 124, 75–93. [Google Scholar] [CrossRef]
  16. Dada, O.A.; Li, G.; Qiao, L.; Ma, Y.; Ding, D.; Xu, J.; Li, P.; Yang, J. Response of Waves and Coastline Evolution to Climate Variability off the Niger Delta Coast during the Past 110 Years. J. Mar. Syst. 2016, 160, 64–80. [Google Scholar] [CrossRef]
  17. Dahunsi, A.M.; Bonou, F.; Dada, O.A.; Baloïtcha, E. Spatio-Temporal Trend of Past and Future Extreme Wave Climates in the Gulf of Guinea Driven by Climate Change. J. Mar. Sci. Eng. 2022, 10, 1581. [Google Scholar] [CrossRef]
  18. Osinowo, A.A.; Okogbue, E.C.; Eresanya, E.O.; Akande, O.S. Extreme Significant Wave Height Climate in the Gulf of Guinea. Afr. J. Mar. Sci. 2018, 40, 407–421. [Google Scholar] [CrossRef]
  19. Semedo, A.; Vettor, R.; Breivik, Ø.; Sterl, A.; Reistad, M.; Soares, C.G.; Lima, D. The Wind Sea and Swell Waves Climate in the Nordic Seas. Ocean Dyn. 2015, 65, 223–240. [Google Scholar] [CrossRef]
  20. Semedo, A. Seasonal Variability of Wind Sea and Swell Waves Climate along the Canary Current: The Local Wind Effect. J. Mar. Sci. Eng. 2018, 6, 28. [Google Scholar] [CrossRef]
  21. Wang, J.; Dong, C.; He, Y. Wave Climatological Analysis in the East China Sea. Cont. Shelf Res. 2016, 120, 26–40. [Google Scholar] [CrossRef]
  22. Wang, Z.; Wu, K.; Zhou, L.; Wu, L. Wave Characteristics and Extreme Parameters in the Bohai Sea. China Ocean Eng. 2012, 26, 341–350. [Google Scholar] [CrossRef]
  23. Woolf, D.K.; Challenor, P.G.; Cotton, P.D. Variability and Predictability of the North Atlantic Wave Climate. J. Geophys. Res. C Ocean. 2002, 107, 9-1–9-14. [Google Scholar] [CrossRef]
  24. Muhammed Naseef, T.; Sanil Kumar, V. Climatology and Trends of the Indian Ocean Surface Waves Based on 39-Year Long ERA5 Reanalysis Data. Int. J. Climatol. 2020, 40, 979–1006. [Google Scholar] [CrossRef]
  25. Sreelakshmi, S.; Bhaskaran, P.K. Wind-Generated Wave Climate Variability in the Indian Ocean Using ERA-5 Dataset. Ocean Eng. 2020, 209, 107486. [Google Scholar] [CrossRef]
  26. Tarek, M.; Brissette, F.P.; Arsenault, R. Evaluation of the ERA5 Reanalysis as a Potential Reference Dataset for Hydrological Modelling over North America. Hydrol. Earth Syst. Sci. 2020, 24, 2527–2544. [Google Scholar] [CrossRef]
  27. Mann, H.B. Nonparametric Tests against Trend. Econom. J. Econom. Soc. 1945, 13, 245–259. [Google Scholar] [CrossRef]
  28. Kendall, M.G. Rank Correlation Methods; American Psychological Association: Washington, DC, USA, 1948. [Google Scholar]
  29. Wang, F.; Shao, W.; Yu, H.; Kan, G.; He, X.; Zhang, D.; Ren, M.; Wang, G. Re-Evaluation of the Power of the Mann-Kendall Test for Detecting Monotonic Trends in Hydrometeorological Time Series. Front. Earth Sci. 2020, 8, 14. [Google Scholar] [CrossRef]
  30. He, M. Assessing Changes in 21st Century Mean and Extreme Climate of the Sacramento–San Joaquin Delta in California. Climate 2022, 10, 16. [Google Scholar] [CrossRef]
  31. Lilly, J.M.; Olhede, S.C. Higher-Order Properties of Analytic Wavelets. IEEE Trans. Signal Process. 2008, 57, 146–160. [Google Scholar] [CrossRef]
  32. Jiang, Y.; Tang, B.; Qin, Y.; Liu, W. Feature Extraction Method of Wind Turbine Based on Adaptive Morlet Wavelet and SVD. Renew. Energy 2011, 36, 2146–2153. [Google Scholar] [CrossRef]
  33. Torrence, C.; Compo, G.P. A Practical Guide to Wavelet Analysis. Bull. Am. Meteorol. Soc. 1998, 79, 61–78. [Google Scholar] [CrossRef]
  34. Goupillaud, P.; Grossmann, A.; Morlet, J. Cycle-Octave and Related Transforms in Seismic Signal Analysis. Geoexploration 1984, 23, 85–102. [Google Scholar] [CrossRef]
  35. Kirikkaleli, D.; Sowah, J.K. A Wavelet Coherence Analysis: Nexus between Urbanization and Environmental Sustainability. Environ. Sci. Pollut. Res. 2020, 27, 30295–30305. [Google Scholar] [CrossRef] [PubMed]
  36. Le Cozannet, G.; Lecacheux, S.; Delvallee, E.; Desramaut, N.; Oliveros, C.; Pedreros, R. Teleconnection Pattern Influence on Sea-Wave Climate in the Bay of Biscay. J. Clim. 2011, 24, 641–652. [Google Scholar] [CrossRef]
  37. Gutiérrez, O.; Panario, D.; Nagy, G.J.; Bidegain, M.; Montes, C. Climate Teleconnections and Indicators of Coastal Systems Response. Ocean Coast. Manag. 2016, 122, 64–76. [Google Scholar] [CrossRef]
  38. Shimura, T.; Mori, N.; Mase, H. Ocean Waves and Teleconnection Patterns in the Northern Hemisphere. J. Clim. 2013, 26, 8654–8670. [Google Scholar] [CrossRef]
  39. Intergovernmental Panel on Climate Change (IPCC). The Ocean and Cryosphere in a Changing Climate; Cambridge University Press: Cambridge, UK, 2022; ISBN 978-1-00-915796-4. [Google Scholar]
  40. Liu, J.; Meucci, A.; Young, I.R. A Comparison of Multiple Approaches to Study the Modulation of Ocean Waves Due to Climate Variability. J. Geophys. Res. Ocean. 2023, e2023JC019843. [Google Scholar] [CrossRef]
  41. Daramola, S.; Li, H.; Omonigbehin, O.; Faruwa, A.; Gong, Z. Recent Retreat and Flood Dominant Areas along the Muddy Mahin Coastline of Ilaje, Nigeria. Reg. Stud. Mar. Sci. 2022, 52, 102272. [Google Scholar] [CrossRef]
  42. Daramola, S.; Li, H.; Otoo, E.; Idowu, T.; Gong, Z. Coastal Evolution Assessment and Prediction Using Remotely Sensed Front Vegetation Line along the Nigerian Transgressive Mahin Mud Coast. Reg. Stud. Mar. Sci. 2022, 50, 102167. [Google Scholar] [CrossRef]
  43. Hemer, M.A.; Katzfey, J.; Trenham, C.E. Global Dynamical Projections of Surface Ocean Wave Climate for a Future High Greenhouse Gas Emission Scenario. Ocean Model. 2013, 70, 221–245. [Google Scholar] [CrossRef]
  44. Yang, Y.; Wu, L.; Guo, Y.; Gan, B.; Cai, W.; Huang, G.; Li, X.; Geng, T.; Jing, Z.; Li, S. Greenhouse Warming Intensifies North Tropical Atlantic Climate Variability. Sci. Adv. 2021, 7, eabg9690. [Google Scholar] [CrossRef] [PubMed]
  45. Alves, B.; Angnuureng, D.B.; Morand, P.; Almar, R. A Review on Coastal Erosion and Flooding Risks and Best Management Practices in West Africa: What Has Been Done and Should Be Done. J. Coast. Conserv. 2020, 24, 38. [Google Scholar] [CrossRef]
  46. Dada, O.A.; Almar, R.; Oladapo, M.I. Recent Coastal Sea-Level Variations and Flooding Events in the Nigerian Transgressive Mud Coast of Gulf of Guinea. J. Afr. Earth Sci. 2020, 161, 103668. [Google Scholar] [CrossRef]
Figure 1. Map of the Eastern Tropical Atlantic showing the tropical West coast of Africa. The red dots are the locations of the reference points selected for presenting the results of the wavelet transform analysis and decadal trends.
Jmse 12 00714 g001
Figure 2. Illustration of the workflow of primary analyses performed in this study.
Jmse 12 00714 g002
Figure 3. Spatial distribution of mean SWH over the Eastern Tropical Atlantic (1940–2022). Higher waves are observed at the northern and southern boundaries of the ETA. The wave regime is relatively calm towards the inner coasts of the Gulf of Guinea.
Jmse 12 00714 g003
Figure 4. Seasonal distribution of SWH in the ETA. The July and August waves were the strongest, and the alternating influence of the Boreal and Austral storm seasons was apparent.
Jmse 12 00714 g004
Figure 5. Relative difference in SWH between wet and dry seasons over the Eastern Tropical Atlantic.
Jmse 12 00714 g005
Figure 6. Result of the interannual trend between 1940 and 2022 over the ETA as a measure of (A) the direction of the trend), (B) the magnitude of the trend estimated by the TSA, (C) |Z| statistics of the MK test, and (D) the p-value of the Z statistic.
Jmse 12 00714 g006
Figure 7. Monthly rates of change in SWH in the Eastern Tropical Atlantic between 1940 and 2022. The rate of change during the wet season was more pronounced than that of the dry season.
Jmse 12 00714 g007
Figure 8. Standard errors of the interannual rate of change were from one thousand bootstrapped Theil–Sen slope estimates.
Jmse 12 00714 g008
Figure 9. The Scalograms (left panels) and Global wavelet spectra (right panels) for points P1 to P3 showing the presence of decadal and sub-decadal signals.
Jmse 12 00714 g009
Figure 10. Mean wavelet coherence of different climate indices with SWH in the ETA. EA and SOI are, on average, less strongly coherent with the SWH in the ETA.
Jmse 12 00714 g010
Table 1. The climatic indices used for the teleconnection assessment in this study.
S/NClimatic IndicesDuration Used
1.Atmospheric Mass Oscillation (AMON)1951–2022
2.Atlantic Multidecadal Meridional Sea Surface Temperature (AMMSST)1951–2022
3.Antarctic Oscillation (AAO)1979–2022
4.Tropical Southern/(TSA)1948–2022
5.North Oscillation Index (NOI)1948–2022
6.North Atlantic Oscillation (NAO)1951–2022
7.East Atlantic Pattern (EA)1951–2022
8.Southern Oscillation Index (SOI)1951–2022
9.Tropical Northern Atlantic (TNA)1951–2022
Disclaimer/Publisher’s Note: The statements, opinions and data contained in all publications are solely those of the individual author(s) and contributor(s) and not of MDPI and/or the editor(s). MDPI and/or the editor(s) disclaim responsibility for any injury to people or property resulting from any ideas, methods, instructions or products referred to in the content.

