
Intra-Examiner Reliability and Validity of Sagittal Cervical Spine Mensuration Methods Using Deep Convolutional Neural Networks
 ,
,
Abstract
:1. Introduction
2. Materials and Methods
2.1. Radiographic Image Selection Inclusion Criteria
2.2. Radiographic Image Selection Exclusion Criteria
2.3. Intra-Examiner Reliability and Construct Validity Design
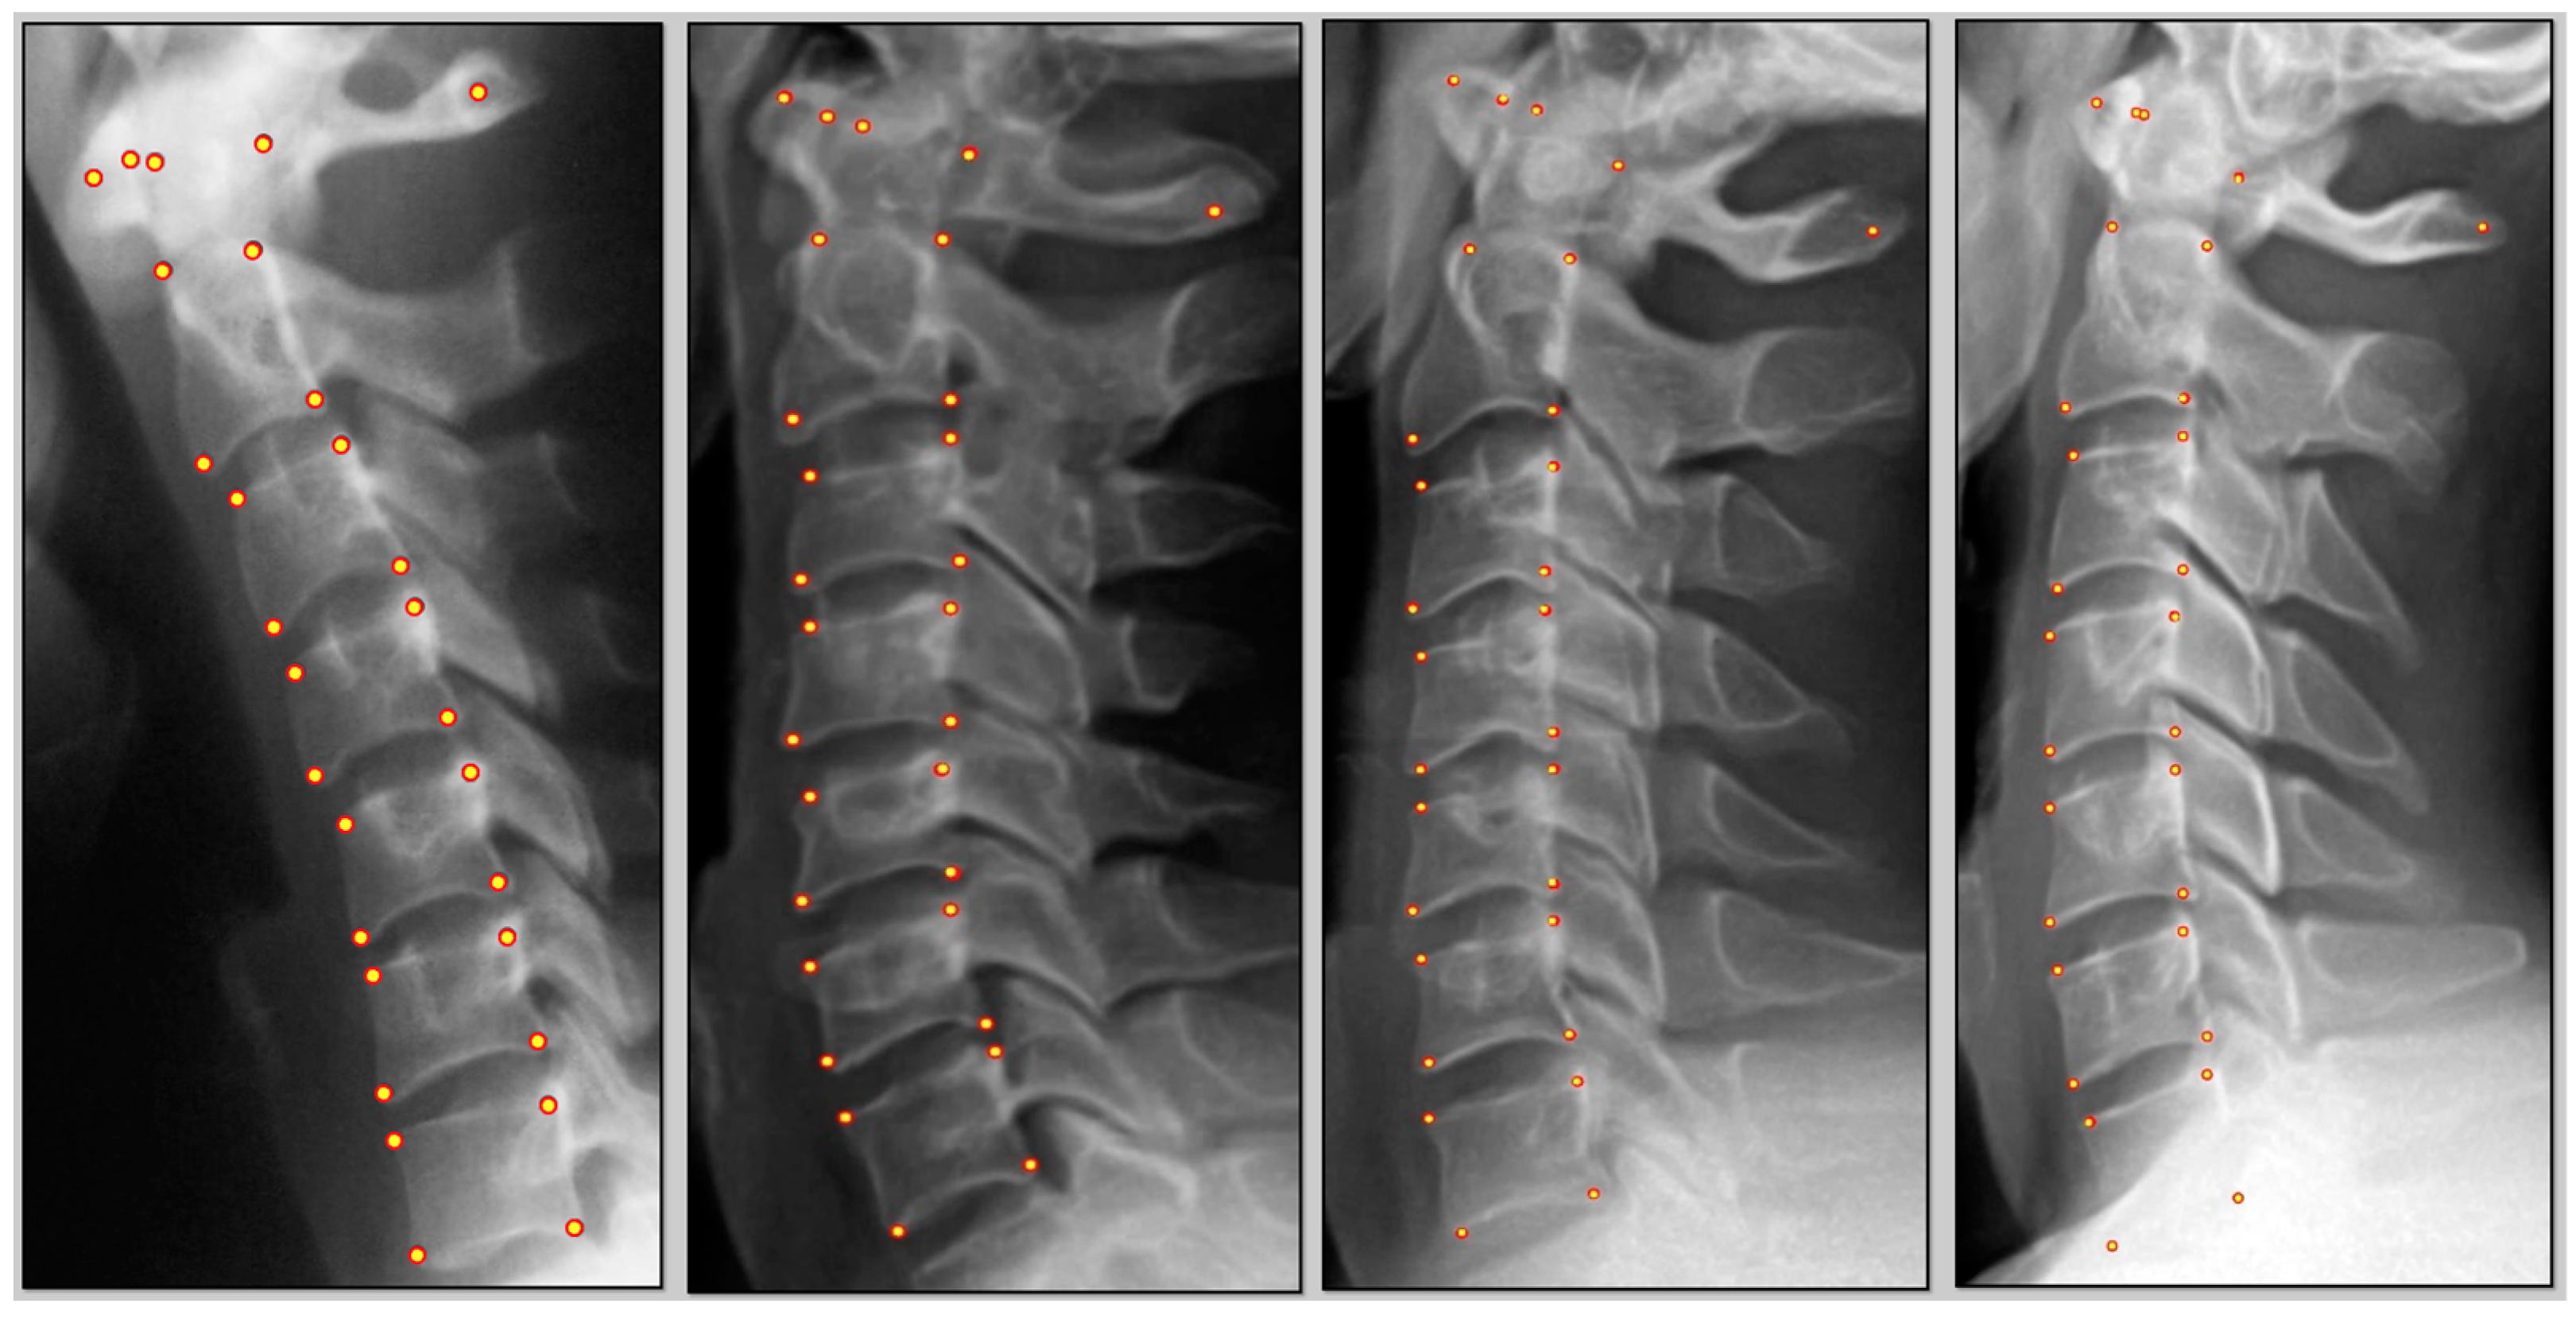
- Three points on C1: anterior tubercle, midpoint C1 at the posterior margin of the dens, and midpoint of the posterior spinal laminar line.
- C2–C7 digitization consisted of four points per vertebra: anterior superior, posterior superior, anterior inferior, and posterior inferior vertebral body margins.
- Atlas plane relative to horizontal;
- Segmental posterior body tangent relative rotational angles (RRAs);
- Cobb analysis using vertebral endplate angles;
- Segmental relative linear translation distances;
- Global posterior tangent absolute rotational angle from C2 to C7;
- Global sagittal horizontal translation alignment of C2 relative to C7.
2.4. Measurement Variables Reported
- ARA (°): Absolute rotational angle refers to the overall curve of the cervical lordosis. It is computed as the angle between the vertebrae C2 and C7. It is the angle between two straight lines, where they intersect each other. The first line passes through the posterior inferior and posterior superior body corners of vertebra C2, and the second line is the line that intersects the posterior inferior and posterior superior vertebral body corners of C7.
- RRA (°): Relative rotational angle is the angle between two consecutive vertebrae. To calculate this angle, we draw the lines passing through the posterior superior and posterior inferior of any vertebral body corners and then calculate the angle where they cross each other. Thus, creating the slope or the first derivative of the curve when expanded across the vertebral column.
- KA (°): This represents endplate cross-sectional angle, where for two adjacent vertebrae, we draw the lines that pass the anterior inferior and posterior inferior body corner of each vertebra body as well as the anterior superior and posterior superior body corner and then calculate the angle of their intersection. This measurement is considered less reliable due to the nature of degenerative change at the endplate, which can make two like points difficult to assess.
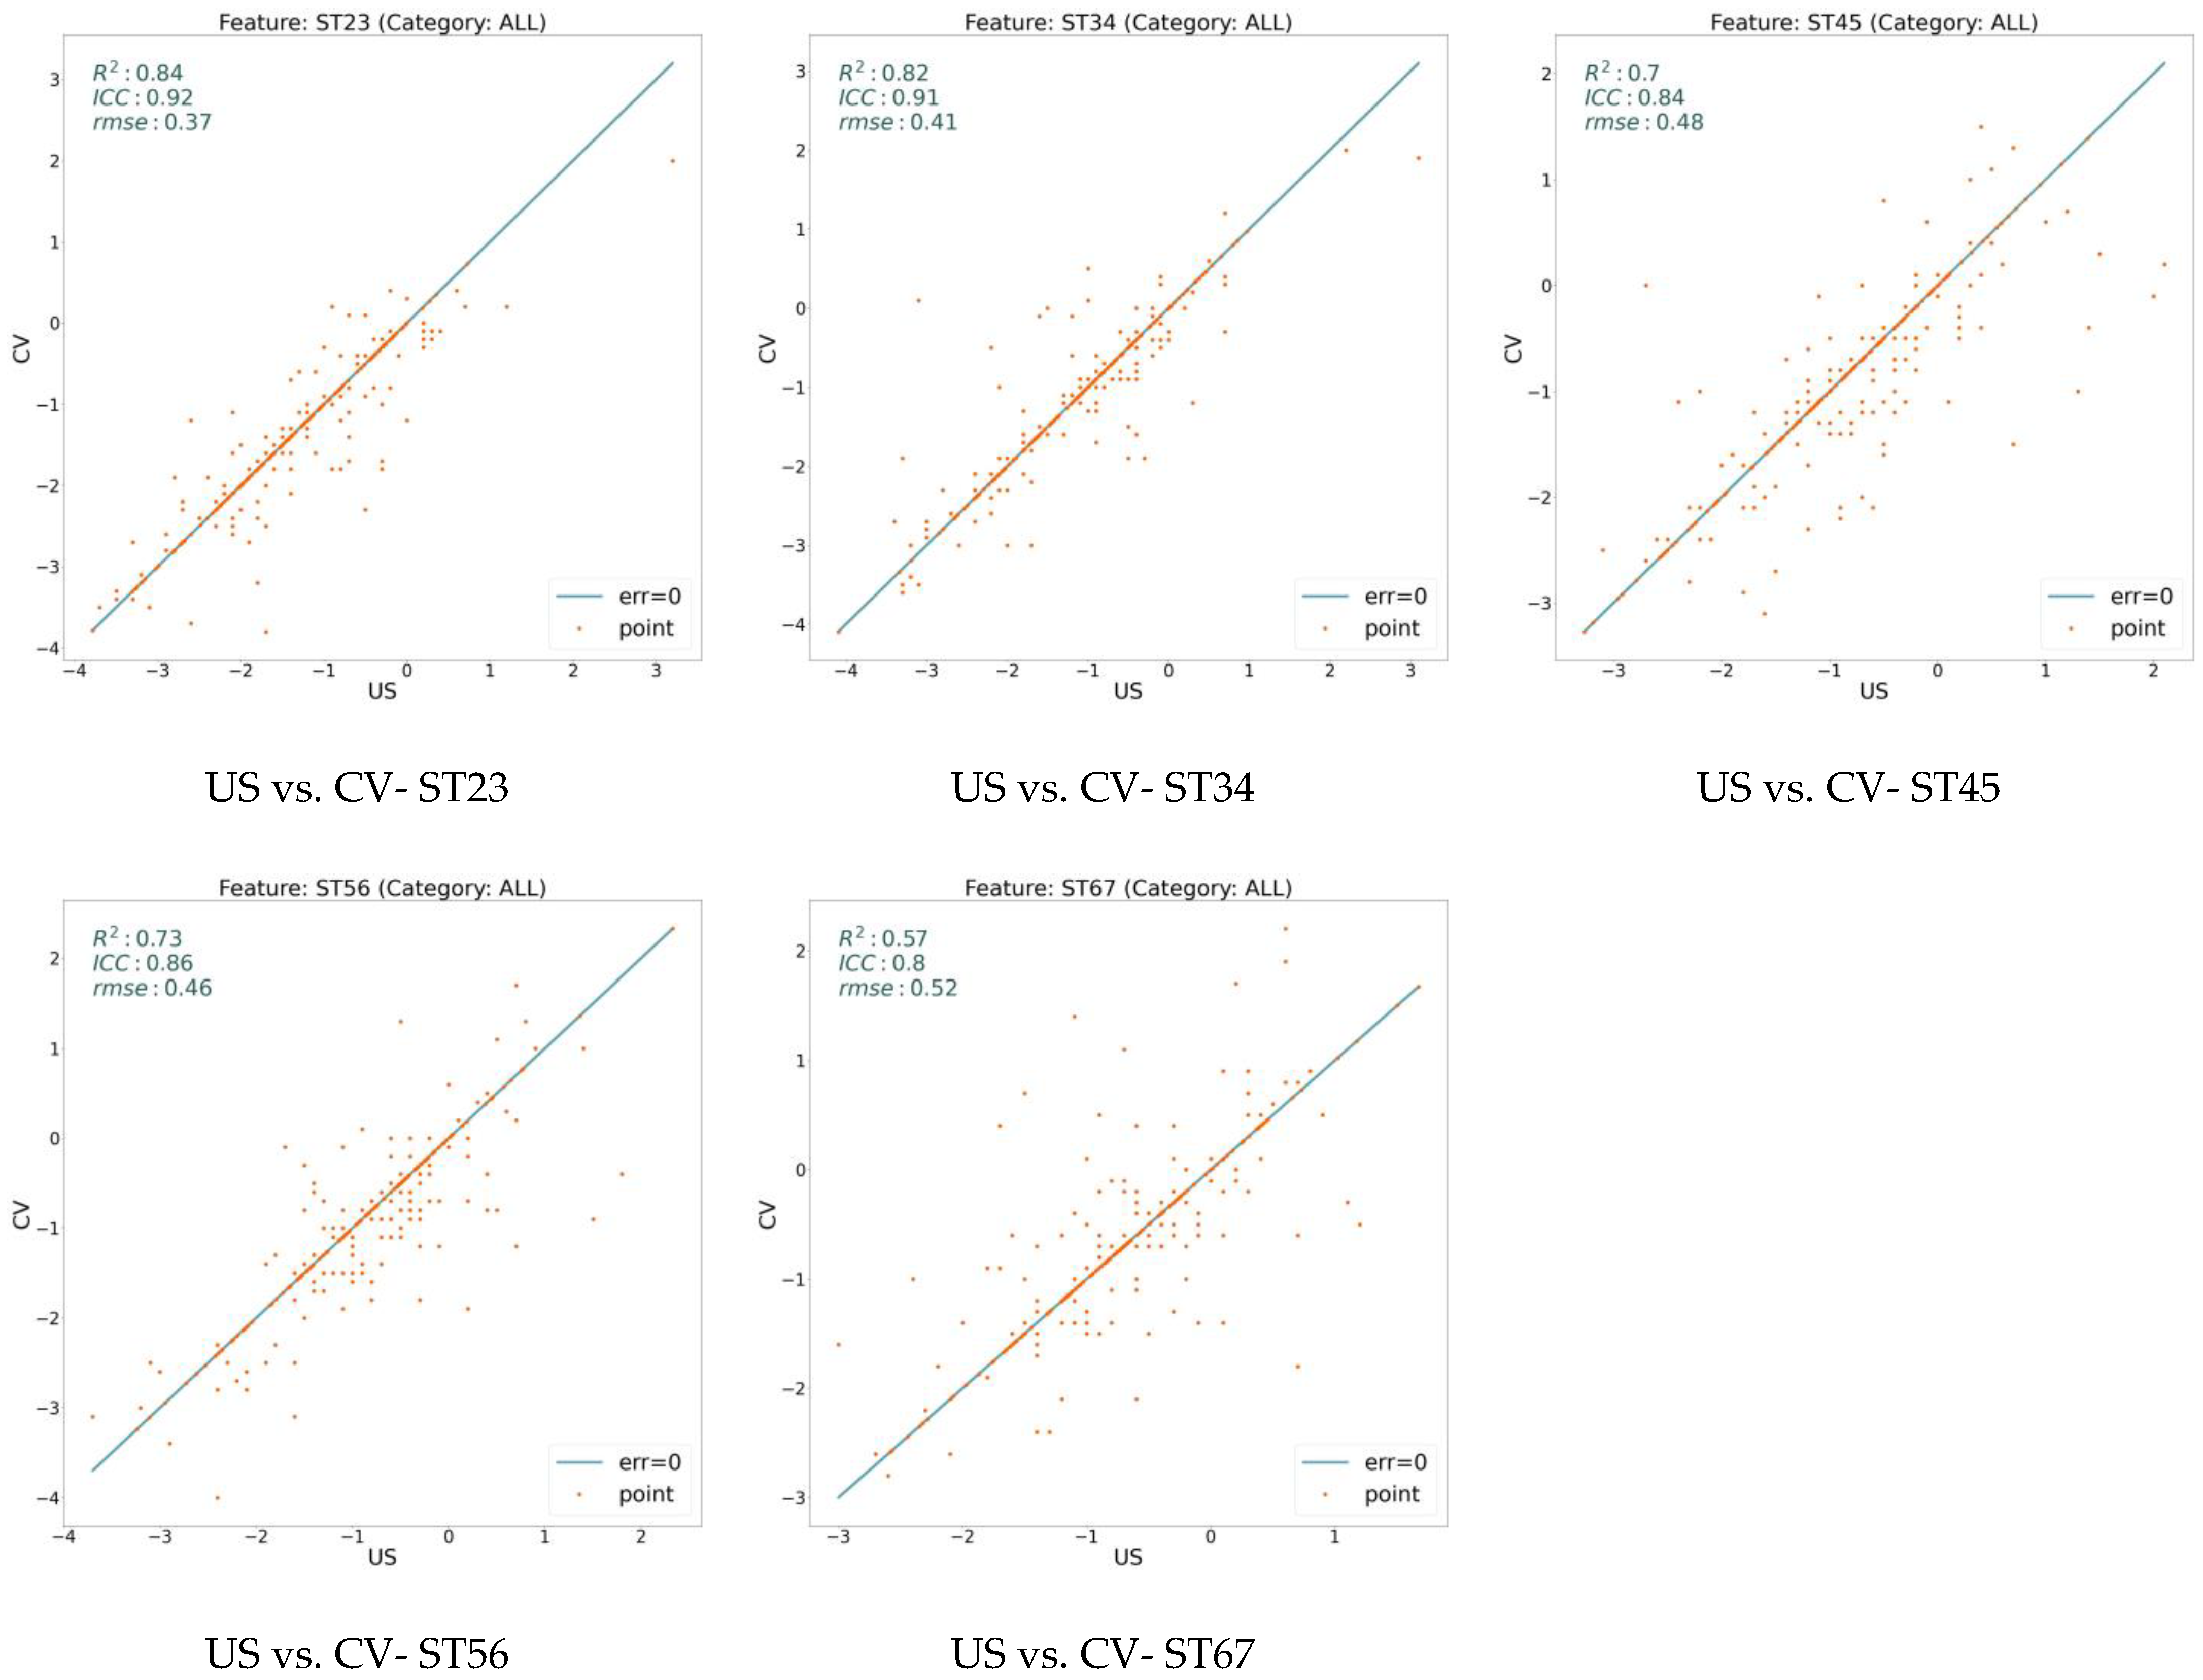
- ST (mm): Denotes segmental translations. Like RR and KA features, it is calculated for any pair of adjacent vertebrae and determines the forward or backward translation along the z-axis between two neighboring vertebrae. Positive value means anterior translation, and a negative value means posterior translation relative to the adjacent segment.
- C1H (°): Demonstrates the atlas plane angle relative to true horizontal and is measured as an angle between a horizontal line and vertebra C1.
- TR (mm): The translational distance of the C2 posterior superior body corner relative to a vertical line drawn superiorly from the C7 posterior inferior body corner is considered as the translation measure in millimeters.
2.5. Statistical Analysis
3. Results
4. Discussion
4.1. Limitations
4.2. Conclusions
Author Contributions
Funding
Institutional Review Board Statement
Informed Consent Statement
Data Availability Statement
Conflicts of Interest
References
- Fatoye, F.; Gebrye, T.; Ryan, C.G.; Useh, U.; Mbada, C. Global and regional estimates of clinical and economic burden of low back pain in high-income countries: A systematic review and meta-analysis. Front. Public Health 2023, 11, 1098100. [Google Scholar] [CrossRef] [PubMed]
- Casiano, V.E.; Sarwan, G.; Dydyk, A.M.; Varacallo, M. Back Pain; StatPearls Publishing: Treasure Island, FL, USA, 2023. [Google Scholar]
- Ferreira, M.L.; de Luca, K.; Haile, L.; Steinmetz, J.; Culbreth, G.; Cross, M.; Kopec, J.; Ferreira, P.H.; Blyth, F.; Buchbinder, R.; et al. Global, regional, and national burden of low back pain, 1990–2020, its attributable risk factors, and projections to 2050: A systematic Analysis of the global burden of disease study 2021. Lancet Rheumatol. 2023, 5, e316–e329. [Google Scholar] [CrossRef]
- Zhu, K.; Devine, A.; Dick, I.M.; Prince, R.L. Association of back pain frequency with mortality, coronary heart events, mobility, and quality of life in elderly women. Spine 2007, 32, 2012–2018. [Google Scholar] [CrossRef] [PubMed]
- Roseen, E.J.; LaValley, M.P.; Li, S.; Saper, R.B.; Felson, D.T.; Fredman, L. Association of back pain with all-cause and cause-specific mortality among older women: A cohort study. J. Gen. Intern. Med. 2019, 34, 90–97. [Google Scholar] [CrossRef] [PubMed]
- Williams, A.; Kamper, S.J.; Wiggers, J.H.; O’brien, K.M.; Lee, H.; Wolfenden, L.; Yoong, S.L.; Robson, E.; McAuley, J.H.; Hartvigsen, J.; et al. Musculoskeletal conditions may increase the risk of chronic disease: A systematic review and meta-analysis of cohort studies. BMC Med. 2018, 16, 167. [Google Scholar] [CrossRef] [PubMed]
- Champain, S.; Benchikh, K.; Nogier, A.; Mazel, C.; Guise, J.; De Skalli, W. Validation of and new clinical quantitative analysis software applicable in spine orthopedic studies. Eur. Spine J. 2006, 15, 981–991. [Google Scholar] [CrossRef] [PubMed]
- Schwartz, J.T.; Cho, B.H.; Tang, P.; Schefflein, J.; Arvind, V.; Kim, J.S.; Doshi, A.H.; Cho, S.K. Deep learning automates measurement of spinopelvic parameters on lateral lumbar radiographs. Spine 2021, 46, E671–E678. [Google Scholar] [CrossRef] [PubMed]
- Yang, S.; Zhong, S.; Fan, Y.; Zhu, Y.; Xu, N.; Liao, Y.; Fan, G.; Liao, X.; He, S. Research hotspots and trends on spinal cord stimulation for pain treatment: A two-decade bibliometric analysis. Front. Neurosci. 2023, 17, 1158712. [Google Scholar] [CrossRef] [PubMed]
- Kristjansson, E.; Leivseth, G.; Brinckmann, P.; Frobin, W. Increased sagittal plane segmental motion in the lower cervical spine in women with chronic whiplash-associated disorders, grades I–II: A case-control study using a new measurement protocol. Spine 2003, 28, 2215–2221. [Google Scholar] [CrossRef]
- Yagi, M.; Yamanouchi, K.; Fujita, N.; Funao, H.; Ebata, S. Revolutionizing spinal care: Current applications and future directions of artificail intelligence and machine learning. J. Clin. Med. 2023, 12, 4188. [Google Scholar] [CrossRef]
- Orhurhu, V.J.; Chu, R.; Gill, J. Failed Back Surgery Syndrome; StatPearls Publishing: Treasure Island, FL, USA, 2023. [Google Scholar]
- Ju, C.I.; Lee, S.M. Complications and Management of Endoscopic Spinal Surgery. Neurospine 2023, 20, 56–77. [Google Scholar] [CrossRef] [PubMed] [PubMed Central]
- Tangsrivimol, J.A.; Schonfeld, E.; Zhang, M.; Veeravagu, A.; Smith, T.R.; Härtl, R.; Lawton, M.T.; El-Sherbini, A.H.; Prevedello, D.M.; Glicksberg, B.S.; et al. Artificial intelligence in neurosurgery: A state-of-the-art review from past to future. Diagnostics 2023, 13, 2429. [Google Scholar] [CrossRef] [PubMed] [PubMed Central]
- Wang, F.; Preininger, A. AI in health: State of the art, challenges and future directions. Yearb. Med. Inform. 2019, 28, 16–26. [Google Scholar] [CrossRef] [PubMed]
- Zhou, S.; Zhou, F.; Sun, Y.; Chen, X.; Diao, Y.; Zhao, Y.; Huang, H.; Fan, X.; Zhang, G.; Li, X. The application of artificial intelligence in spine surgery. Front. Surg. 2022, 9, 885599. [Google Scholar] [CrossRef] [PubMed]
- Fard, A.P.; Ferrantelli, J.; Dupuis, A.-L.; Mahoor, M.H. Sagittal cervical spine landmark point detection in x-ray using deep convoluted neural networks. Sci. Rep. 2021, 11, 7618. [Google Scholar] [CrossRef]
- Moore, D.S.; Notz, W.I.; Flinger, M.A. The Basic Practice of Statistics, 6th ed.; W. H. Freeman and Company: New York, NY, USA, 2013; p. 138. [Google Scholar]
- Shin, D.W.; Shin, J.I.; Koyanagi, A.; Jacob, L.; Smith, L.; Lee, H.; Chang, Y.; Song, T.J. Global, regional, and national neck pain burden in the general population, 1990–2019: An analysis of the global burden of disease study 2019. Front Neurol. 2022, 13, 955367. [Google Scholar] [CrossRef] [PubMed]
- Hush, J.M.; Michaleff, Z.; Maher, C.G.; Refshauge, K. Individual, physical and psychological risk factors for neck pain in Australian office workers: A 1-year longitudinal study. Eur. Spine J. 2009, 18, 1532–1540. [Google Scholar] [CrossRef] [PubMed]
- Ling, F.P.; Chevillotte, T.; Leglise, A.; Thompson, W.; Bouthors, C.; Le Huec, J.C. Which parameters are relevant in sagittal balance analysis of the cervical spine? A literature review. Eur. Spine J. 2018, 27 (Suppl. S1), 8–15. [Google Scholar] [CrossRef] [PubMed]
- Mahmoud, N.F.; Hassan, K.A.; Abdelmajeed, S.F.; Moustafa, I.M.; Silva, A.G. The Relationship between Forward Head Posture and Neck Pain: A Systematic Review and Meta-Analysis. Curr. Rev. Musculoskelet. Med. 2019, 12, 562–577. [Google Scholar] [CrossRef] [PubMed]
- Jackson-Fowl, B.; Hockley, A.; Naessig, S.; Ahmad, W.; Pierce, K.; Smith, J.S.; Ames, C.; Shaffrey, C.; Bennett-Caso, C.; Williamson, T.K.; et al. Adult cervical spine deformity: A state-of-the-art review. Spine Deform. 2024, 12, 3–23. [Google Scholar] [CrossRef]
- Saad, N.; Moustafa, I.M.; Ahbouch, A.; Alsaafin, N.M.; Oakley, P.A.; Harrison, D.E. Are Rotations and Translations of Head Posture Related to Gait and Jump Parameters? J. Clin. Med. 2023, 12, 6211. [Google Scholar] [CrossRef] [PubMed]
- Aafreen, A.; Khan, A.R.; Khan, A.; Ahmad, A.; Alzahrani, A.H.; Alhusayni, A.I.; Alameer, A.H.; Alajam, R.A.; Ganesan, B.B.M.; Shaphe, M.A. Neck Health Metrics and Quality of Life: A Comparative Study in Bike Drivers with and without Neck Pain. J. Multidiscip. Healthc. 2023, 16, 3575–3584. [Google Scholar] [CrossRef] [PubMed]
- Browd, S.R.; Park, C.; Donoho, D.A. Potential Applications of Artificial Intelligence and Machine Learning in Spine Surgery Across the Continuum of Care. Int. J. Spine Surg. 2023, 17 (Suppl. S1), S26–S33. [Google Scholar] [CrossRef]
- Hornung, A.L.; Hornung, C.M.; Mallow, G.M.; Barajas, J.N.; Orías, A.A.E.; Galbusera, F.; Wilke, H.-J.; Colman, M.; Phillips, F.M.; An, H.S.; et al. Artificial intelligence and spine imaging: Limitations, regulatory issues and future direction. Eur. Spine J. 2022, 31, 2007–2021. [Google Scholar] [CrossRef] [PubMed]
- Broida, S.E.; Schrum, M.L.; Yoon, E.; Sweeney, A.P.; Dhruv, N.N.; Gombolay, M.C.; Yoon, S.T. Improving surgical triage in spine clinic: Predicting likelihood of surgery using machine learning. World Neurosurg. 2022, 163, e192–e198. [Google Scholar] [CrossRef]
- Ames, C.P.; Smith, J.S.; Pellisé, F.; Kelly, M.; Alanay, A.; Acaroglu, E.; Pérez-Grueso, F.J.S.; Kleinstück, F.; Obeid, I.; Vila-Casademunt, A.; et al. Artificial intelligence based hierarchical clustering of patient types and intervention categories in adult spinal deformity surgery: Towards a new classification scheme that predicts quality and value. Spine 2019, 44, 915–926. [Google Scholar] [CrossRef] [PubMed]
- Cunha, A.C.; Burke, T.N.; França, F.J.; Marques, A.P. Effect of global posture reeducation and of static stretching on pain, range of motion, and quality of life in women with chronic neck pain: A randomized clinical trial. Clinics 2008, 63, 763–770. [Google Scholar] [CrossRef] [PubMed]
- Falla, D.; Jull, G.; Russell, T.; Vicenzino, B.; Hodges, P. Effect of neck exercise on sitting posture in patients with chronic neck pain. Phys. Ther. 2007, 87, 408–417. [Google Scholar] [CrossRef] [PubMed]
- Özer, K.D.; Toprak, Ç.Ş. Effectiveness of relaxation training in addition to stabilization exercises in chronic neck pain: A randomized clinical trial. Turk. J. Physiother. Rehabil. 2019, 30, 145–153. [Google Scholar] [CrossRef]
- Lwin, N.N.; Myint, T.; Oo, W.M.; San, H.H.; Tun, M.T. Efficacy on pressure-biofeedback guided craniocervical flexion exercise in neck pain: A randomized controlled trial. J. Musculoskelet. Res. 2021. [Google Scholar] [CrossRef]
- Kim, J.Y.; Kwag, K.I. Clinical effects of deep cervical flexor muscle activation in patients with chronic neck pain. J. Phys. Ther. Sci. 2016, 28, 269–273. [Google Scholar] [CrossRef] [PubMed]
- Shah, N.; Gill, M.A.; Singal, S.K.; Payla, M. Effect of core stability exercise in patients with neck pain. Indian. J. Physiother. Occup. Ther. 2020, 14, 102–107. [Google Scholar] [CrossRef]
- Oakley, P.A.; Ehsani, N.N.; Moustafa, I.M.; Harrison, D.E. Restoring cervical lordosis by cervical extension traction meth-ods in the treatment of cervical spine disorders: A systematic review of controlled trials. J. Phys. Ther. Sci. 2021, 33, 784–794. [Google Scholar] [CrossRef] [PubMed]
- Katz, E.A.; Katz, S.B.; Freeman, M.D. Non-surgical management of upper cervical instability via improved cervical lordosis: A case series of adult patients. J. Clin. Med. 2023, 12, 1797. [Google Scholar] [CrossRef] [PubMed]
- Oakley, P.A.; Harrison, D.D.; Harrison, D.E.; Haas, J.W. Evidence-based protocol for structural rehabilitation of the spine and posture: Review of clinical biomechanics of posture (CBP) publications. J. Can. Chiropr. Assoc. 2005, 49, 270–296. [Google Scholar] [PubMed]
- Fortner, M.O.; Oakley, P.A.; Harrison, D.E. Non-surgical improvement of cervical lordosis is possible in advanced spinal osteoarthritis: A CBP® case report. J. Phys. Ther. Sci. 2018, 30, 108–112. [Google Scholar] [CrossRef] [PubMed]
- Oakley, P.A.; Harrison, D.E. Reducing thoracic hyperkyphosis subluxation deformity: A systematic review of chiropractic biophysics® methods employed in its structural improvement. J. Contemp. Chiropr. 2018, 1, 59–66. [Google Scholar]
- Harrison, D.D.; Harrison, D.E.; Janik, T.J.; Cailliet, R.; Ferrantelli, J.R.; Haas, J.W.; Holland, B. Modeling of the sagittal cervical spine as a method to discriminate hypo-lordosis: Results of elliptical and circular modeling in 72 asymptomatic subjects, 52 acute neck pain subjects, and 70 chronic neck pain subjects. Spine 2004, 29, 2485–2492. [Google Scholar] [CrossRef]
- Pivotto, L.R.; Navarro, I.J.R.L.; Candotti, C.T. Radiography and photogrammetry-based methods of assessing cervical spine posture in the sagittal plane: A systematic review with meta-analysis. Gait Posture 2021, 84, 357–367. [Google Scholar] [CrossRef] [PubMed]
- Ferracini, G.N.; Chaves, T.C.; Dach, F.; Bevilaqua-Grossi, D.; Fernández-de-Las-Peñas, C.; Speciali, J.G. Analysis of the cranio-cervical curvatures in subjects with migraine with and without neck pain. Physiotherapy 2017, 103, 392–399. [Google Scholar] [CrossRef]
- Harrison, D.E.; Holland, B.; Harrison, D.D.; Janik, T.J. Further reliability analysis of the Harrison radiographic line-drawing methods: Crossed ICCs for lateral posterior tangents and modified Risser-Ferguson method on AP views. J. Manip. Physiol. Ther. 2002, 25, 93–98. [Google Scholar] [CrossRef] [PubMed]
- Harrison, D.E.; Harrison, D.D.; Cailliet, R.; Troyanovich, S.J.; Janik, T.J.; Holland, B. Cobb method or Harrison posterior tangent method: Which to choose for lateral cervical radiographic analysis. Spine 2000, 25, 2072–2078. [Google Scholar] [CrossRef] [PubMed]
- Rydman, E.; Elkan, P.; Eneqvist, T.; Ekman, P.; Järnbert-Pettersson, H. The significance of cervical sagittal alignment for nonrecovery after whiplash injury. Spine J. 2020, 20, 1229–1238. [Google Scholar] [CrossRef] [PubMed]


| Computer Vision (CV) vs. Expert Human (US) | Expert Human (US) vs. Expert Human (US) | |||||||||
|---|---|---|---|---|---|---|---|---|---|---|
| Mean | Std | RMSE | ICC | R2 | Mean | Std | RMSE | ICC | R2 | |
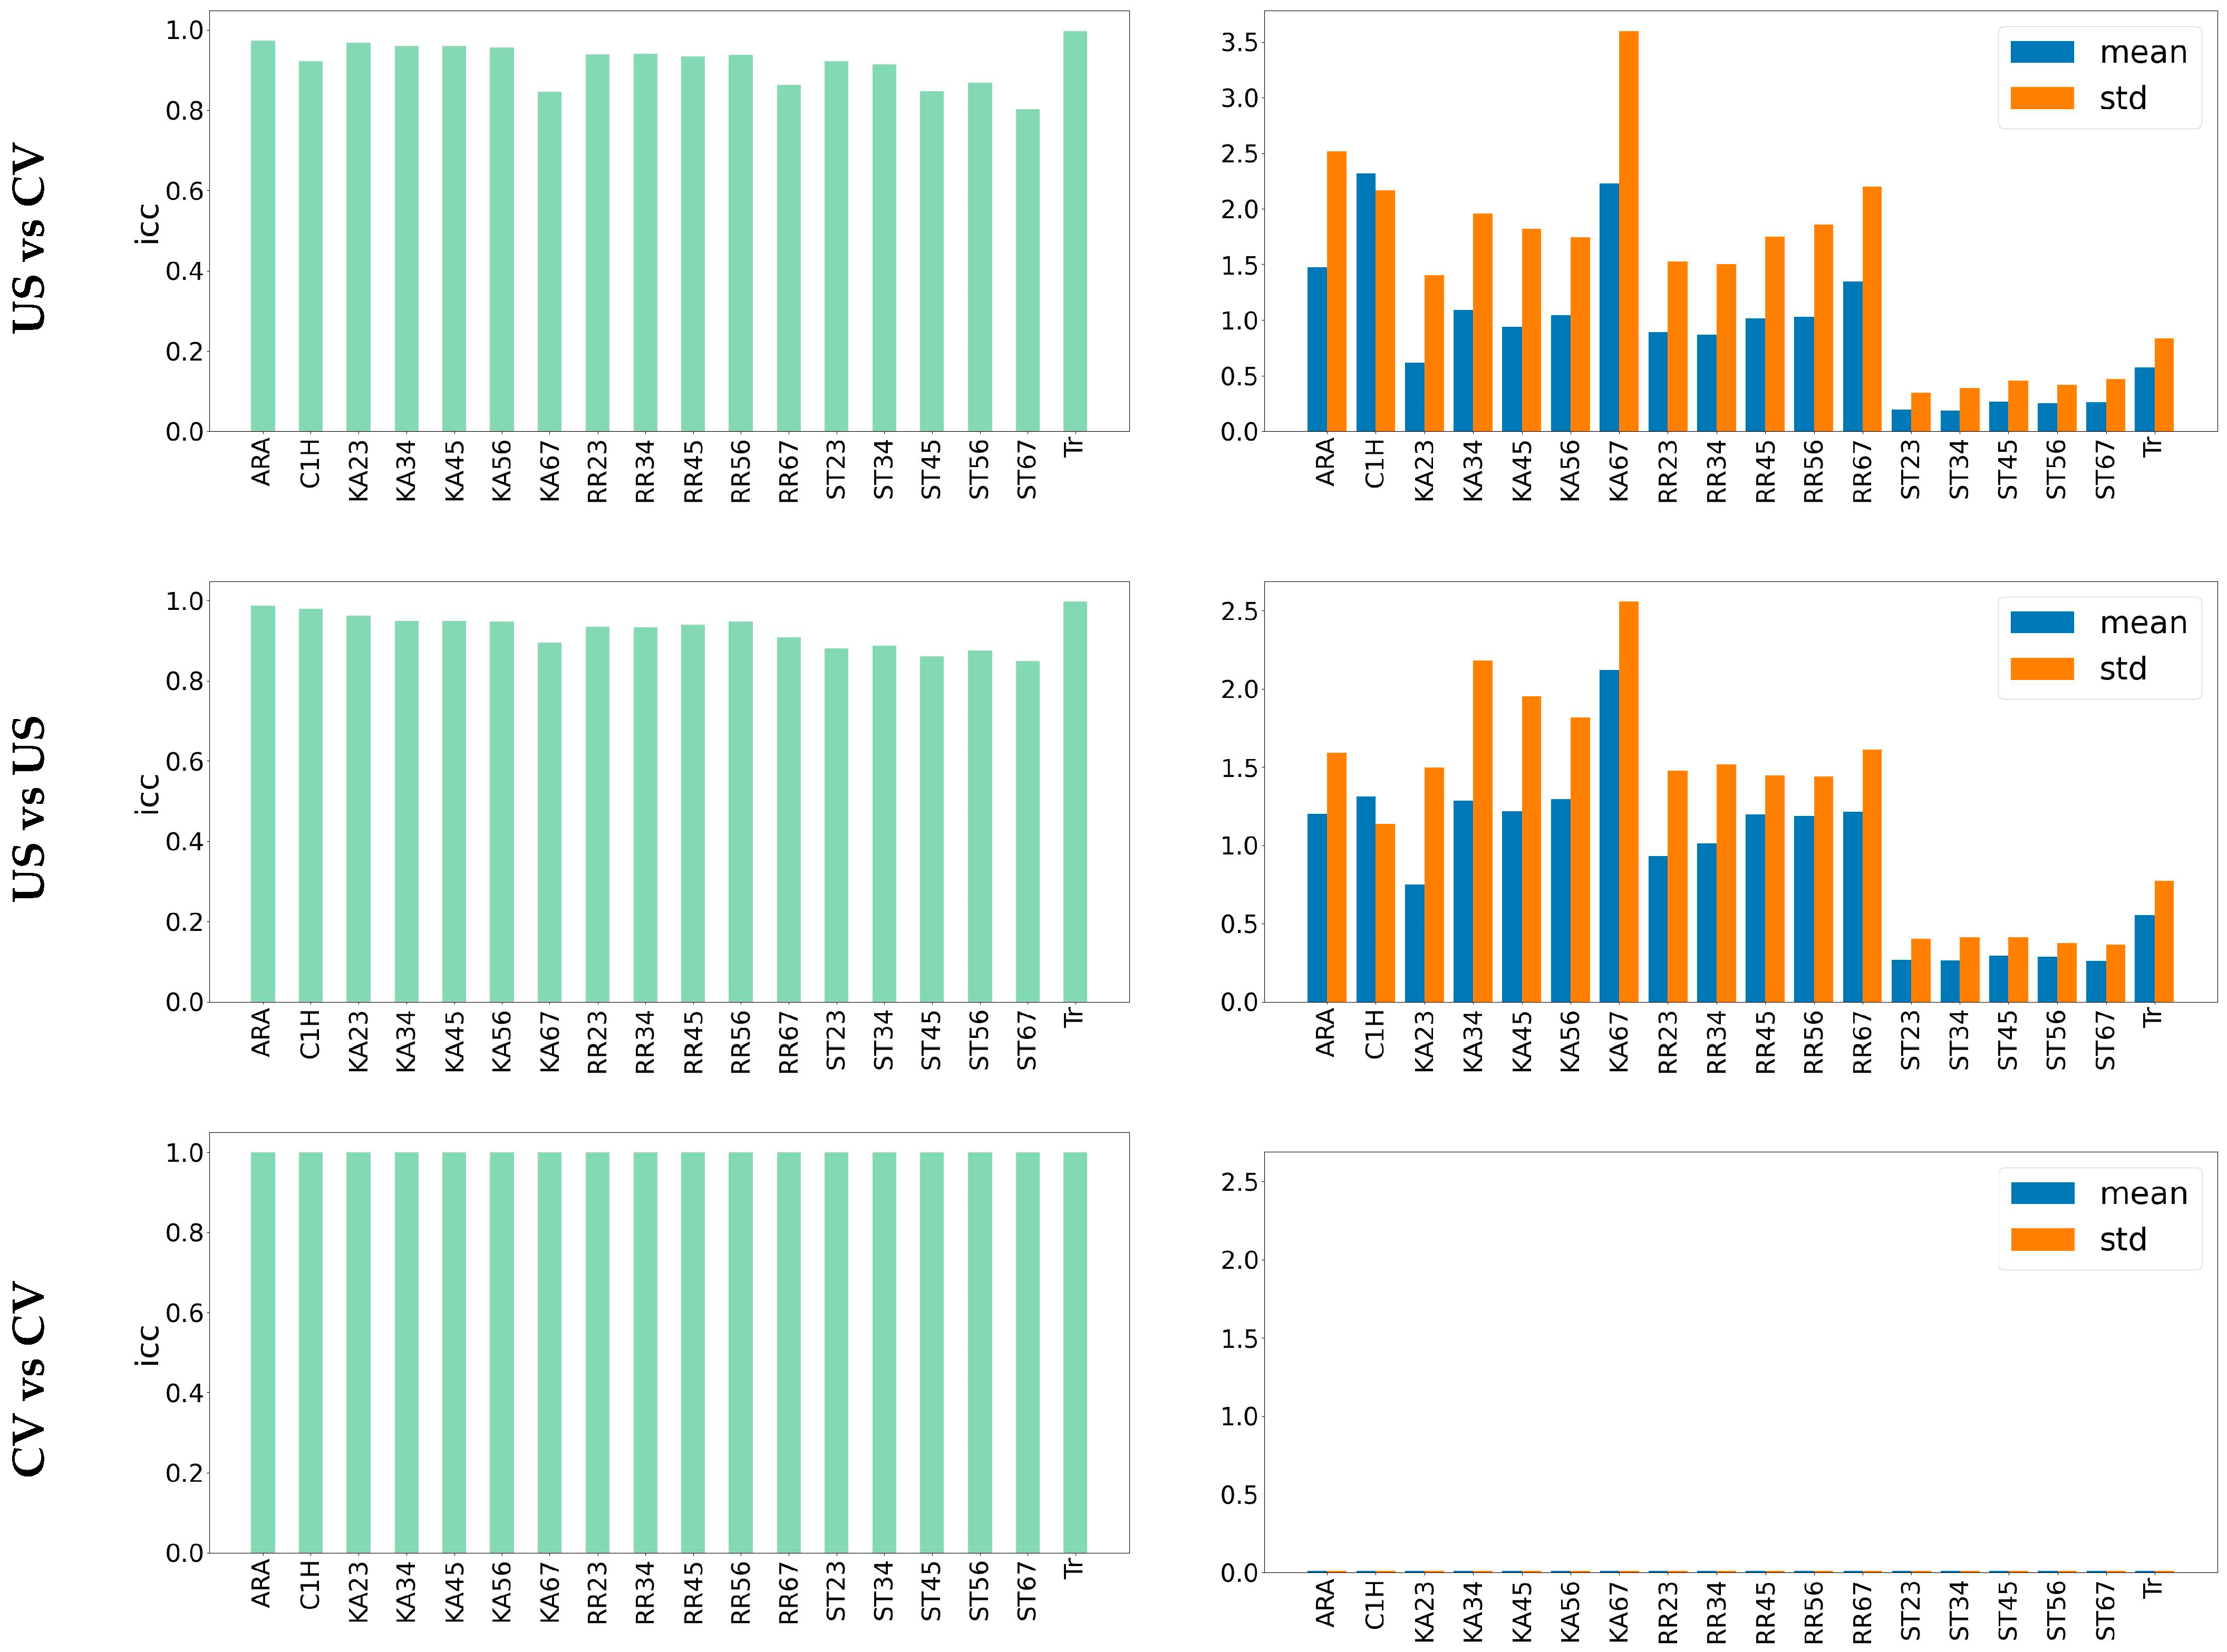
| ARA (°) | 1.13 | 0.014 | 2.89 | 0.97 | 0.94 | 0.89 | 0.009 | 1.97 | 0.98 | 0.97 |
| C1H (°) | 1.48 | 0.018 | 2.48 | 0.92 | 0.86 | 0.93 | 0.012 | 1.66 | 0.97 | 0.95 |
| KA23 (°) | 0.55 | 0.015 | 1.48 | 0.96 | 0.93 | 0.59 | 0.017 | 1.65 | 0.96 | 0.92 |
| KA34 (°) | 0.93 | 0.017 | 2.14 | 0.95 | 0.91 | 1.05 | 0.019 | 2.46 | 0.94 | 0.89 |
| KA45 (°) | 0.80 | 0.017 | 1.99 | 0.95 | 0.91 | 1.00 | 0.019 | 2.25 | 0.94 | 0.89 |
| KA56 (°) | 0.85 | 0.018 | 1.98 | 0.95 | 0.91 | 0.98 | 0.020 | 2.20 | 0.94 | 0.89 |
| KA67 (°) | 1.74 | 0.037 | 4.18 | 0.84 | 0.64 | 1.59 | 0.028 | 3.27 | 0.89 | 0.78 |
| RRA23 (°) | 0.66 | 0.022 | 1.76 | 0.93 | 0.86 | 0.75 | 0.022 | 1.71 | 0.93 | 0.87 |
| RRA34 (°) | 0.72 | 0.021 | 1.69 | 0.94 | 0.88 | 0.83 | 0.021 | 1.76 | 0.93 | 0.86 |
| RRA45 (°) | 0.80 | 0.023 | 2.00 | 0.93 | 0.86 | 0.95 | 0.020 | 1.79 | 0.93 | 0.88 |
| RRA56 (°) | 0.79 | 0.022 | 2.11 | 0.93 | 0.86 | 0.94 | 0.019 | 1.78 | 0.94 | 0.89 |
| RRA67 (°) | 1.09 | 0.033 | 2.53 | 0.86 | 0.70 | 0.97 | 0.025 | 1.93 | 0.90 | 0.82 |
| ST23 (mm) | 0.16 | 0.023 | 0.37 | 0.92 | 0.84 | 0.23 | 0.028 | 0.45 | 0.87 | 0.77 |
| ST34 (mm) | 0.16 | 0.025 | 0.41 | 0.91 | 0.82 | 0.22 | 0.028 | 0.46 | 0.88 | 0.77 |
| ST45 (mm) | 0.24 | 0.031 | 0.48 | 0.84 | 0.70 | 0.24 | 0.031 | 0.49 | 0.86 | 0.72 |
| ST56 (mm) | 0.21 | 0.031 | 0.46 | 0.86 | 0.73 | 0.22 | 0.030 | 0.45 | 0.87 | 0.74 |
| ST67 (mm) | 0.23 | 0.039 | 0.52 | 0.80 | 0.57 | 0.22 | 0.032 | 0.42 | 0.84 | 0.70 |
| TR (mm) | 0.45 | 0.003 | 0.96 | 0.99 | 0.99 | 0.44 | 0.003 | 0.87 | 0.99 | 0.99 |
Disclaimer/Publisher’s Note: The statements, opinions and data contained in all publications are solely those of the individual author(s) and contributor(s) and not of MDPI and/or the editor(s). MDPI and/or the editor(s) disclaim responsibility for any injury to people or property resulting from any ideas, methods, instructions or products referred to in the content. |
© 2024 by the authors. Licensee MDPI, Basel, Switzerland. This article is an open access article distributed under the terms and conditions of the Creative Commons Attribution (CC BY) license (https://creativecommons.org/licenses/by/4.0/).
Share and Cite
Hosseini, M.M.; Mahoor, M.H.; Haas, J.W.; Ferrantelli, J.R.; Dupuis, A.-L.; Jaeger, J.O.; Harrison, D.E. Intra-Examiner Reliability and Validity of Sagittal Cervical Spine Mensuration Methods Using Deep Convolutional Neural Networks. J. Clin. Med. 2024, 13, 2573. https://0-doi-org.brum.beds.ac.uk/10.3390/jcm13092573
Hosseini MM, Mahoor MH, Haas JW, Ferrantelli JR, Dupuis A-L, Jaeger JO, Harrison DE. Intra-Examiner Reliability and Validity of Sagittal Cervical Spine Mensuration Methods Using Deep Convolutional Neural Networks. Journal of Clinical Medicine. 2024; 13(9):2573. https://0-doi-org.brum.beds.ac.uk/10.3390/jcm13092573
Chicago/Turabian StyleHosseini, Mohammad Mehdi, Mohammad H. Mahoor, Jason W. Haas, Joseph R. Ferrantelli, Anne-Lise Dupuis, Jason O. Jaeger, and Deed E. Harrison. 2024. "Intra-Examiner Reliability and Validity of Sagittal Cervical Spine Mensuration Methods Using Deep Convolutional Neural Networks" Journal of Clinical Medicine 13, no. 9: 2573. https://0-doi-org.brum.beds.ac.uk/10.3390/jcm13092573