
Analyzing Delay and CO Emissions: A Simulation Study of the Median U-Turn Method at Intersections


1
School of Energy Science and Engineering, Henan Polytechnic University, Jiaozuo 454000, China
2
School of Resources and Environment, Henan Polytechnic University, Jiaozuo 454000, China
3
Jiaozuo Engineering Research Center of Road Traffic and Transportation, Henan Polytechnic University, Jiaozuo 454000, China
*
Author to whom correspondence should be addressed.
Appl. Sci. 2024, 14(9), 3737; https://0-doi-org.brum.beds.ac.uk/10.3390/app14093737
Submission received: 6 April 2024
/
Revised: 23 April 2024
/
Accepted: 26 April 2024
/
Published: 27 April 2024
(This article belongs to the Special Issue Transportation Planning, Management and Optimization)
Abstract
:To improve traffic efficiency and reduce pollutant emissions at urban road intersections, VISSIM software was used to simulate traffic states to compare the median U-turn method with the direct left-turn method under various traffic volumes and left-turn ratios. Based on the average delay and CO emissions, suitable conditions were identified for using the median U-turn method at intersections. The results show that there are three critical left-turn ratio boundary curves named , , and based on the relatively smaller average delay and there is a critical left-turn ratio boundary curve based on the lower average CO emissions at the intersection when the through traffic volume is in the range of 0–3000 veh/h and the left-turn ratio is in the range of 0–4. The median U-turn method is considered applicable at the intersection when the through traffic volumes are in the range of 0–87 veh/h, 87–400 veh/h, 400–416 veh/h, 416–934 veh/h, and 934–3000 veh/h, respectively, and, accordingly, the left-turn ratios are in the range of 0–, 0– or –4, 0–4, 0–, and . These findings can provide a reference for traffic managers to organize the left-turn traffic at an intersection reasonably.
1. Introduction
An intersection is the throat of urban road networks and the place where traffic jams and traffic accidents occur frequently. Improving its operational efficiency can improve the service level of roads and even road networks [1,2]. In the traffic organization at an intersection, the left-turn movements occupying a separate phase will increase the delay of through traffic at the intersection, and the left-turn traffic using the same phase as the through traffic will increase its conflict with the opposite through traffic. Therefore, the control and management of left-turn traffic is one of the most important problems that needs to be solved at urban road intersections. In order to reduce the signal cycle duration of an intersection, reduce the conflict between left-turn traffic and through traffic inside the intersection, and improve the traffic operation efficiency, the left-turn traffic at the intersection can be handled by using the median U-turn method. Specifically, the median U-turn method at an intersection involves prohibiting traffic from direct left turning inside the intersection so that the left-turning traffic needs to cross the intersection or turn right firstly, then make n U-turn at a crossover in the downstream median of the intersection, and finally turn right or cross the intersection to achieve left turning. This paper only investigates the former case. In the median U-turn design where the U-turn crossovers are placed on the downstream of intersections on the same road. Left-turning traffic on the road has to cross the primary intersection, then make a U-turn, and finally turn right at the intersection.
The median U-turn method for left-turning traffic at an intersection has been extensively studied and widely applied in practical applications; as an example, of the median U-turn method has been applied at the intersection of Dongguan Road and Hongwei Road in Dongguan city in Guangdong province, China, and it is shown in Figure 1. Some researchers [3,4,5,6,7,8,9] studied the left-turn traffic organization method at intersections using the VISSIM software and found that the U-turn scheme can reduce the average delay and increase the traffic capacity. Other researchers [10,11,12,13,14,15,16,17] found that the average delay of the intersection using a median U-turn method is related to the traffic volume. Under some traffic volume conditions, the average delay of using a U-turn method is less than the direct left-turn method, while under some traffic volume conditions, the direct left-turn method has less average delay. Guin, A. et al. [18] studied the models of U-turn and traditional intersection using the VISSIM simulation software. They found that the U-turn performed better in overall intersection emissions levels. Omarov, M. et al. [19] studied the traffic delay due to U-turns to understand the causes of the delay and develop control measures for improved traffic performance. Kay, J. et al. [20] found that median U-turn intersections can provide superior safety performance when used in the appropriate conditions. The above research studies show that using an U-turn method at an intersection can reduce the average delay and improve the intersection’s capacity under suitable conditions. However, most of the literature only focused on the delay and capacity effect of using the U-turn method at some specific intersections, and the quantitative relationship between the applicability of using the U-turn method and the traffic volume is not yet clear enough.
In addition, more and more scholars are paying attention to the relationship between traffic organization and pollutant emissions at intersections under the background of China’s Double-Carbon Policy. Some researchers [21,22,23,24,25,26] studied the pollutant emissions at signalized intersections using the Vehicle Specific Power (VSP) method. Sun [27] and Haydari [28] calculated the pollutant emissions of vehicles at intersections by establishing pollutant emission models. Gastaldi et al. [29] studied the difference in carbon dioxide emissions at roundabouts instead of signalized intersections using a portable emission measurement system (PEMS). Ba et al. [30] studied the impact of optimization measures for intersection traffic organization on emissions using the VSP method. Li [31] studied the impact of signal optimization measures for intersections on emissions using the VSP method. Wu [32] studied the pollutant emissions at the left turn by using an adjacent opposing lane using the VSP method. From the above literature, it can be seen that some research has been conducted on signalized intersections considering pollutant emissions as objectives, but there are few studies considering pollutant emission indicators in traffic organization of using the U-turn method at an intersection.
In summary, the traffic and pollutant emission conditions suitable for applying the median U-turn method at an intersection are not clear enough yet. This paper intends to study the quantitative relationship between the two indicators of average delay and CO emissions and the traffic flow composition including through traffic and left-turn traffic to clarify optimal conditions for implementing the median U-turn method at an intersection. The findings of this study will provide a reference for the intelligent design of intersections utilizing a median U-turn design.
2. Materials and Methods
2.1. Setting of Simulation Model and Parameters
VISSIM is a microscopic traffic simulation software based on time and driving behavior developed by PTV, a company in Germany. It is widely used for evaluating traffic planning and design schemes [33]. This paper uses real traffic conditions to verify the feasibility of using the VISSIM software to study U-turns. This paper used the VISSIM software (Figure 2b) to simulate the real traffic movements at the intersection of Dongguan Road and Hongwei Road in Dongguan city in Guangdong province (Figure 2a). The average delay in real-world intersection is 5.2 s, and the simulated average delay in the VISSIM model is 5.24 s. The difference between the actual average delay and the average delay obtained by the VISSIM software is small, and the simulated traffic movements are similar to the real conditions, so it is feasible to use the VISSIM software to study this U-turn method.
The simulation scheme here in VISSIM is as follows: the object is a plane cross intersection, with three lanes for each entrance and exit. Each entrance includes three lanes, that is, a left-turn lane, a straight lane, and a right-turn lane. The width of the central median is 4 m, the median U-turn opening is located 400 m away from the intersection, and the length of the median U-turn opening is 8 m. The schematic diagrams of the median U-turn method and direct left-turn method at an intersection are shown in Figure 1. When the median U-turn method is used as shown in Figure 3a, the signal timing plan at the intersection includes no left-turn phase and left-turning traffic is prohibited within the intersection. Left-turning traffic needs to move across the intersection first, then make a U-turn at the downstream opening crossover, and finally turn right at the intersection to complete the left turn. When the direct left-turn method is used as shown in Figure 3b, the signal timing plan at the intersection includes a left-turn phase and left-turning traffic directly make a left turn within the intersection. At the same time, there is a signal at each downstream opening to control the U-turn behavior of vehicles. Specifically, when the median U-turn method is used, the U-turn signal at the downstream opening should display a green light. When the direct left-turn method is used, the U-turn signal at the downstream opening displays a red light. In addition, signs prohibiting pedestrians and non-motorized vehicles access are set at each downstream opening to prevent pedestrians and non-motorized vehicles from crossing the road through the opening.
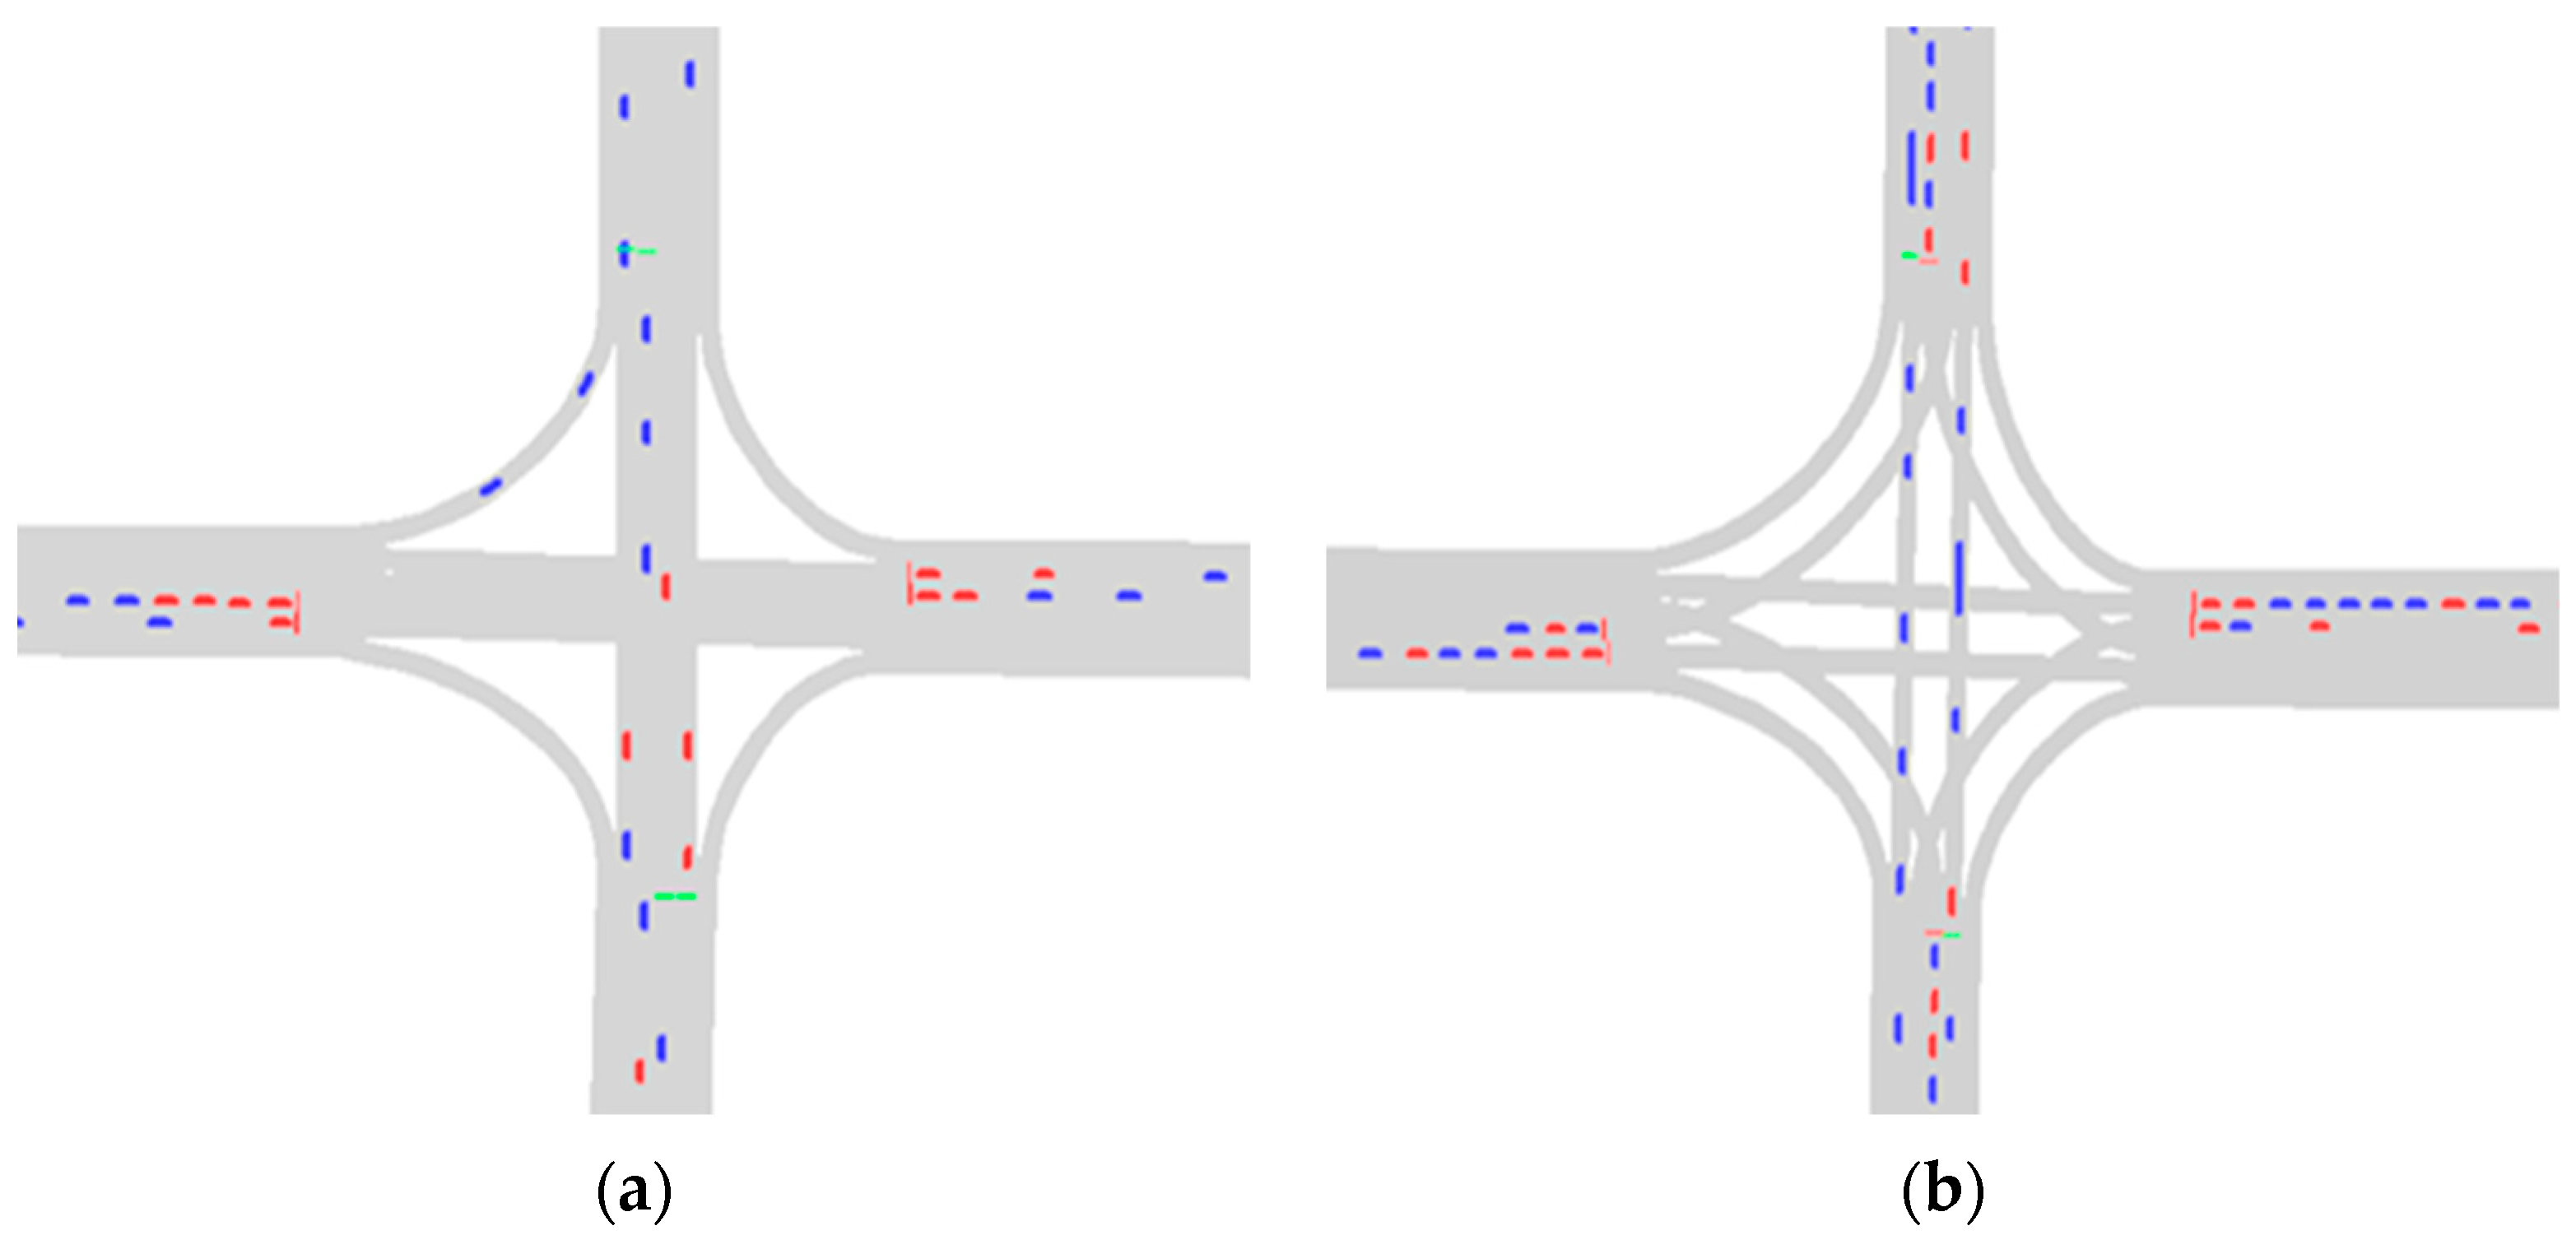
The VISSIM software is used to model the traffic delay and pollutant emissions at the intersection using an median U-turn method or a direct left-turn method with different through traffic volume Qs and left-turn ratio Rls, and then the suitable through traffic volumes and left-turn ratios of the intersection using a median U-turn method can be determined with the goal of smaller traffic delay and pollutant emissions. The simulation models for the median U-turn method and the direct left-turn method are shown in Figure 4, respectively.
2.2. Approach for Deriving Evaluation Indices
The average delay and CO emissions at an intersection are chosen as the two evaluation indexes here. The VISSIM can output the average delay [34], travel time, velocity, and acceleration data. Then, based on the relationship between vehicle specific power (VSP) and acceleration and velocity v, following [35], the vehicle specific power (VSP) can be calculated. In addition, for the vehicle type of emission calculation, the traffic flow is divided into two categories: light vehicles and heavy vehicles. Light vehicles account for 70% of the total, and heavy vehicles account for 30% of the total. The speed of the light vehicle is set to 50 km/h, and the speed of the heavy vehicle is set to 40 km/h. In addition to the settings mentioned in the article, other settings use the default values in the VISSIM4.3 software.
After obtaining the VSP value of each vehicle in each lane, each vehicle should be distributed to a VSP interval according to its VSP value, and then the proportion of the vehicles in each interval to the total number of vehicles in each lane can be calculated. Finally, the CO emission rate of each VSP interval during the simulation period can be calculated by multiplying the CO emission rate of each vehicle shown in Table 1 and the number of vehicles in each VSP interval. The sum of the CO emission rates of all VSP intervals can obtain the total CO emissions of all vehicles per unit time. Then, the total CO emissions of all vehicles during the simulation period can be obtained by multiplying the total CO emissions of all vehicles per unit time and the total travel time.
2.3. Simulation Schemes
Signal controlled left-turn traffic and through traffic have higher average delays and pollutant emissions, while uncontrolled right-turn traffic has a lower average delay and pollutant emissions at an intersection. Therefore, in this paper, the right-turn traffic volume to through traffic volume ratio () is set as a constant value of 0.2 [36], and the through traffic volume and the left-turn ratio (the left-turn traffic volume to through traffic volume ratio at the entrance lane, referred to as the left-turn ratio) are used as the two traffic parameters to determine the applicable conditions of using the median U-turn method.
The simulation designs consider through traffic volumes both below and above 500 veh/h. This approach helps reveal the characteristics of delay and emissions at intersections with varying levels of congestion and traffic volume, as shown in Figure 5. For unobstructed intersections with a through traffic volume of 500 veh/h or less, we have configured eight sets of designs. These range from 100 to 500 veh/h. The left-turn ratios are set within specific ranges and intervals depending on the through traffic volume. For example, at 100 veh/h, the left-turn ratio ranges from 0.3 to 3.9 with an interval of 0.3. Similarly, other specific ranges and intervals are set for higher volumes. At congested intersections where the through traffic volume exceeds 500 veh/h, six sets of designs are created for volumes ranging from 500 to 3000 veh/h. For instance, at 500 veh/h, the left-turn ratio is between 2.6 and 3.0 with an interval of 0.1. For volumes of 1000 to 3000 veh/h, the left-turn ratio ranges from 0.1 to 1.0 with an interval of 0.1. The signal timing for both the median U-turn and direct left-turn methods lasts 142 s. In the median U-turn method, there are two signal phases with a green light time of 68 s and a yellow light time of 3 s for north–south and east–west through traffic. The direct left-turn method features four signal phases controlling both through and left-turn traffic for north–south and east–west directions. The green light time of the north–south and east–west through phase is 40 s, the green light time of the north–south and east–west left-turn phase is 25 s, and the yellow light time is always 3 s.
3. Results
3.1. Unobstructed Intersection
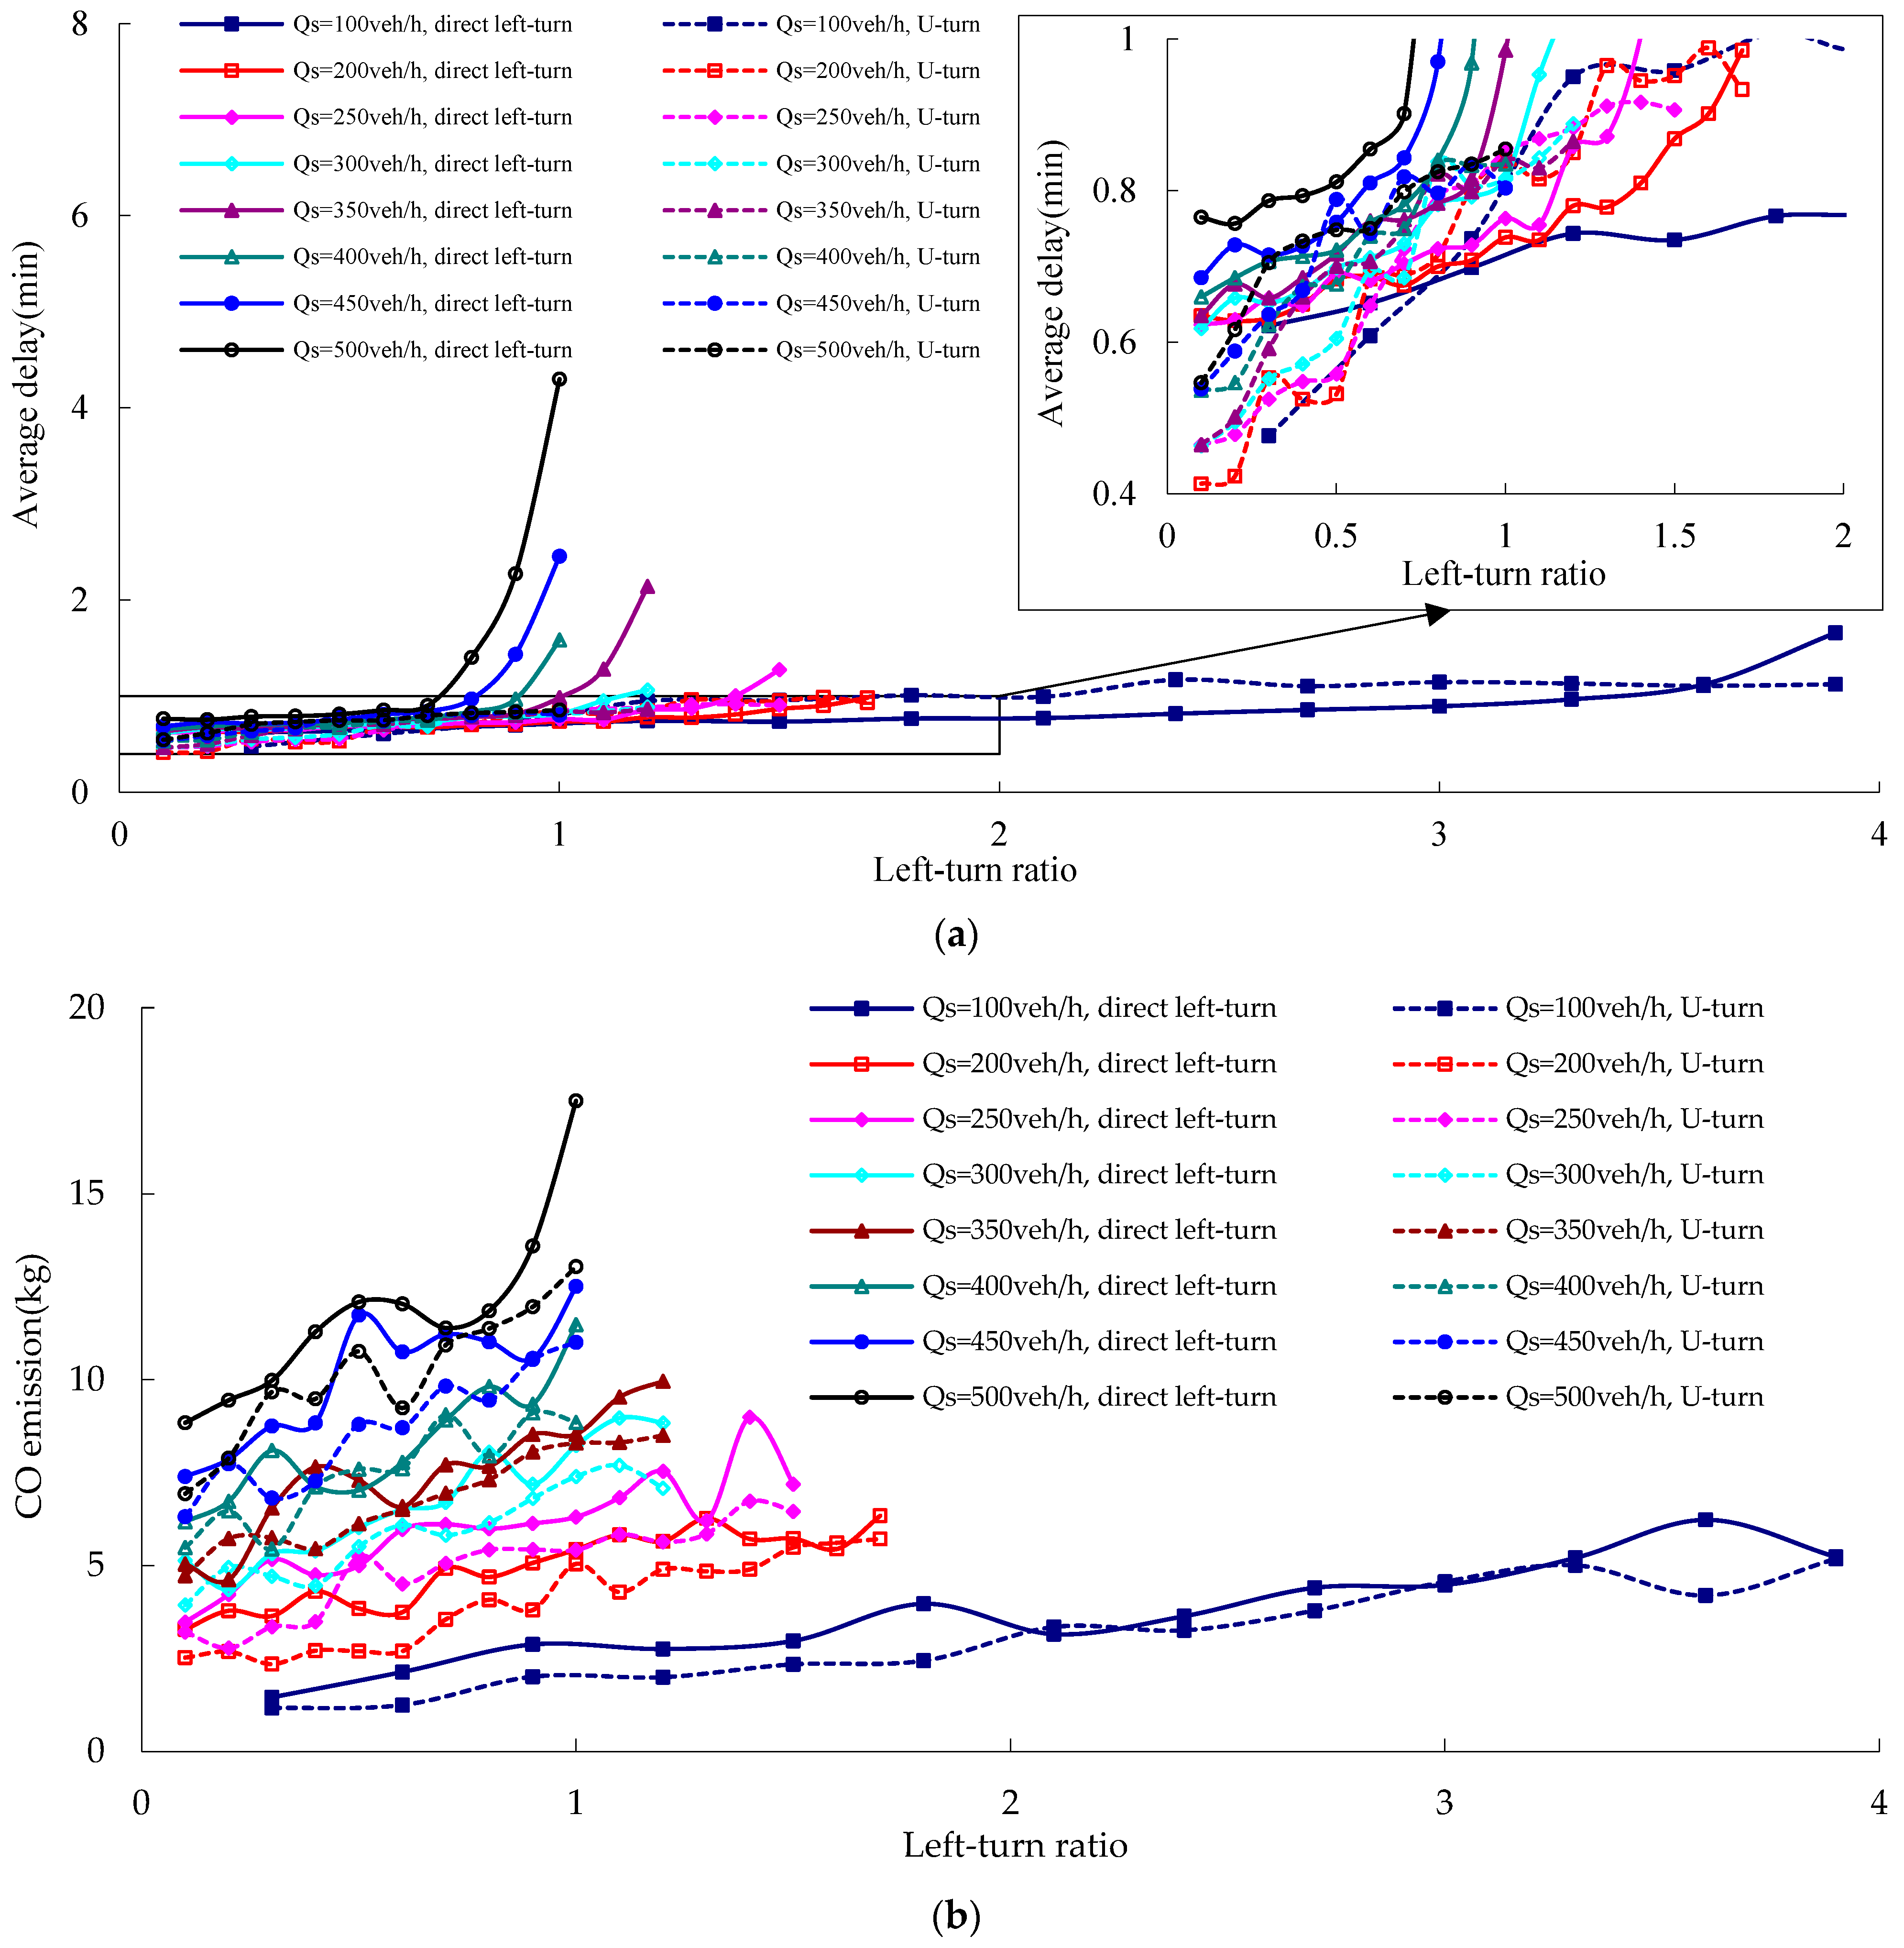
Through simulating the above schemes with through traffic volume Qs ≤ 500 veh/h in Figure 5, the relationship between the average delay, CO emissions at the intersection, and the left-turn ratio with each through traffic volume is shown in Figure 6.
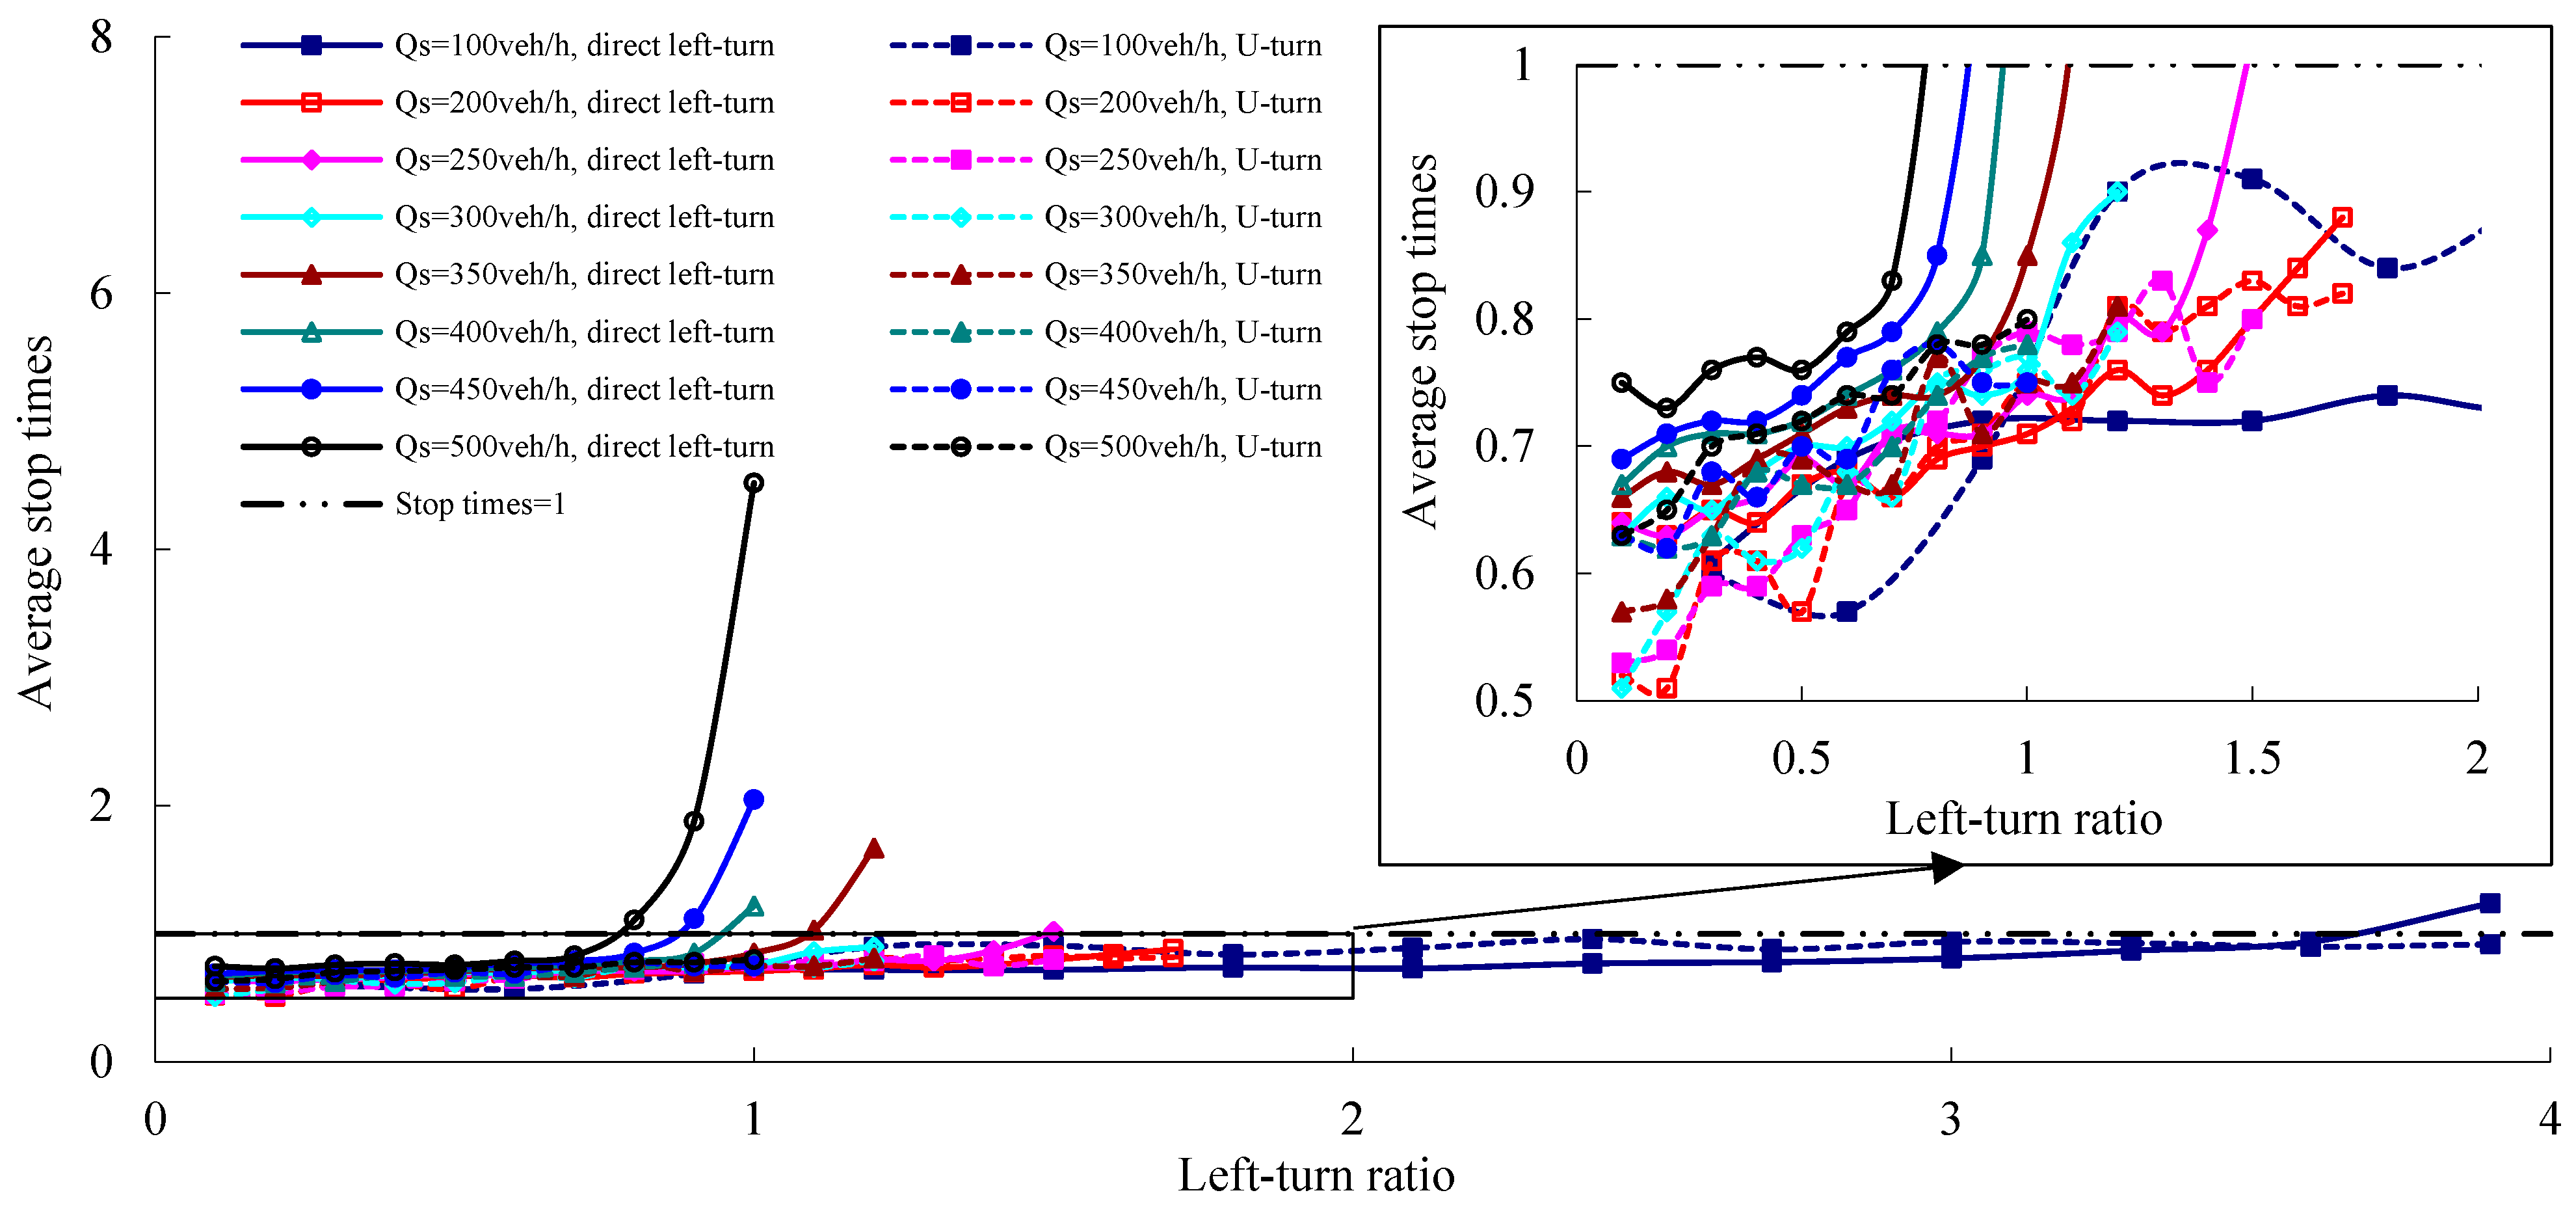
From Figure 6a, it can be observed that when the through traffic volume is constant, with an increase in the left-turn ratio, the average delay of the intersection using the direct left-turn method experiences an accelerated increase, and the average delay of the intersection using the median U-turn method shows a steady increase. The accelerated increase in the average delay at the intersection using the direct left-turn method is related to the stop times at the intersection. When more and more vehicles cannot pass through the intersection in a signal cycle, it will lead to a sharp increase in the average delay at the intersection. The relationship between the average stop times and the left-turn ratio is shown in Figure 7, from which it can been seen that the stop time is larger than 1 when the through traffic volume is 350, 400, 450, and 500 veh/h, respectively, with the left-turn ratio approaching 1. Correspondingly, in Figure 6a, the above four through traffic volumes all show an accelerated increase in the average delay at the intersection. In Figure 7, the average stop times of the intersection using a U-turn method do not appear to be larger than 1, and accordingly, there is no accelerated increase in the average delay at the intersection in Figure 6a.
From Figure 6b, it can be observed that when the through traffic volume is constant, both the U-turn and direct left-turn methods show an increasing trend in CO emissions at the intersection with an increase in the left-turn ratio. When the through traffic volume Qs ≥ 500 veh/h, the CO emission curve of using a median U-turn method is lower than that of the intersection using a direct left-turn method. Therefore, from the point of view of the emission index, the median U-turn method is more suitable when the through traffic volume Qs ≤ 500 veh/h.
In terms of the average delay index at the intersection, with the increase in left-turn ratio, the accelerated increasing average delay curve of the intersection using a direct left-turn method may intersect with the continually increasing average delay curve of the intersection using a median U-turn method. In order to quantify the effect of the intersection using a median U-turn method on the average delay reduction at the intersection under different through traffic volumes, the relationship between the reduction rate of the average delay at the intersection using a median U-turn method and using a left-turn ratio method is given, as shown in Figure 8. In Figure 8, when the delay reduction rate is positive, it indicates that it is better to use a median U-turn method.
where Rdr is the delay reduction rate, ddlt is the delay of the intersection using a direct left-turn method, and dut is the delay of the intersection using the median U-turn method.
Rdr = (ddlt − dut)/ddlt × 100%
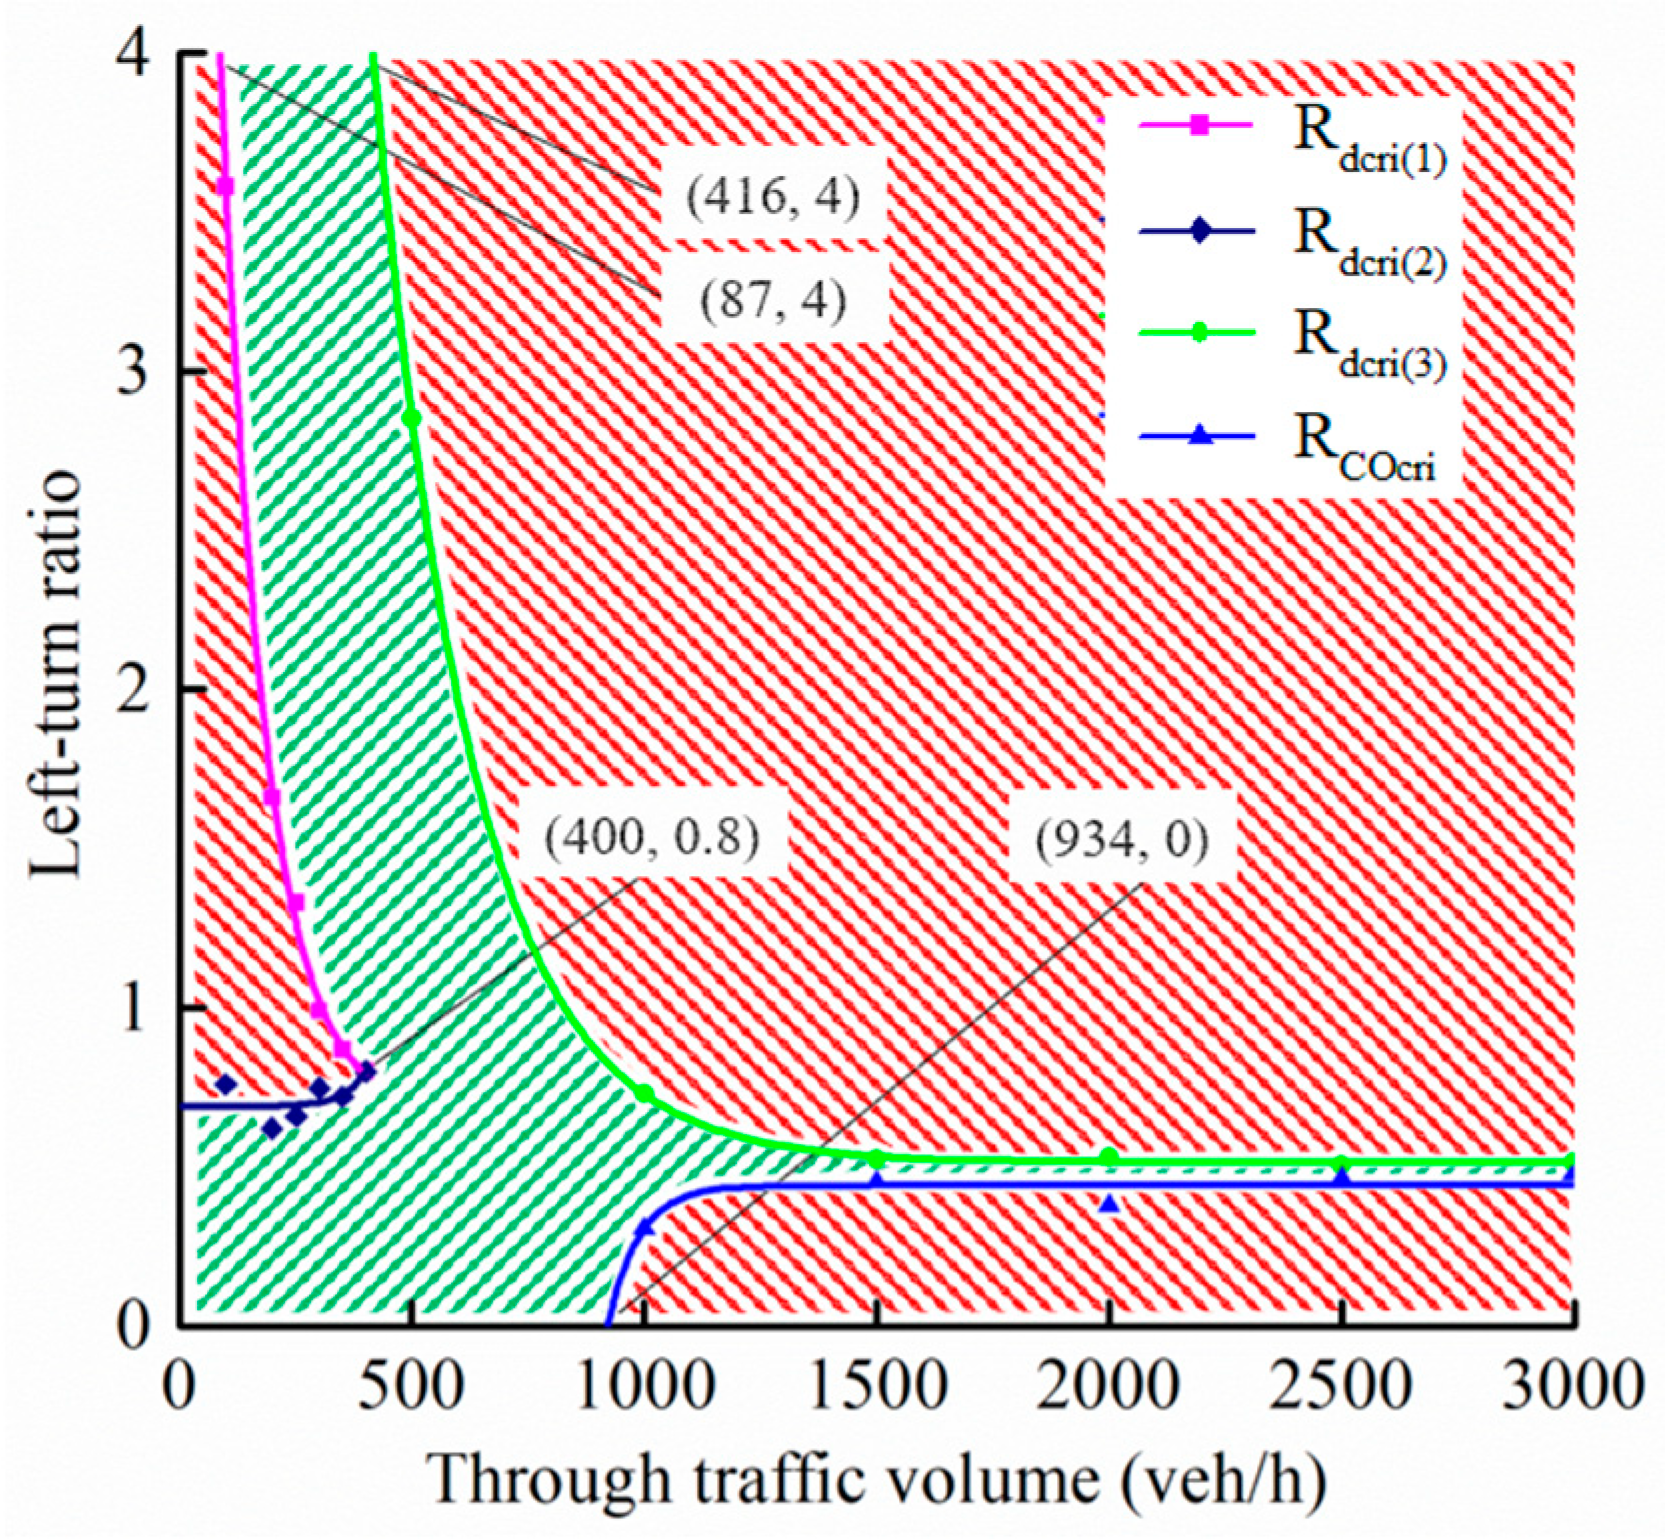
From Figure 8, it can be observed that the delay reduction rate at the intersection using a median U-turn method initially decreases and then increases with the increase in left-turn ratio. When the through traffic volume Qs ≤ 450 veh/h, the delay reduction rate curve of the intersection using a median U-turn method intersects with the X-axis. When the through traffic volume is 450 veh/h, the distribution of the left-turn ratio of the two intersection points is more discrete than that of the other intersection points, which are no longer considered here. When the through traffic volume Qs = 400 veh/h, there is only one intersection point between the delay reduction rate curve of the intersection using a median U-turn method and the X-axis. When the through traffic volume Qs < 400 veh/h, there are two intersection points between the delay reduction rate curve of the intersection using a median U-turn method and the X-axis. The left-turn ratio of the smaller intersection point is relatively concentrated, while the left-turn ratio of the larger intersection point increases rapidly as the through traffic volume decreases, as shown in Figure 9. In Figure 9, under the same smaller through traffic volume, the fitting curve for the smaller critical left-turn ratios is defined as the smaller delay-based critical left-turn ratio curve Rdcri(1), and the fitting curve for the larger critical left-turn ratios is defined as the larger delay-based critical left-turn ratio curve Rdcri(2).
3.2. Congested Intersection
Through simulating the schemes with through traffic volume Qs ≥ 500 veh/h, shown in Figure 5, the relationships between the average delay and CO emissions at the intersection and the left-turn ratio under each through traffic volume are shown in Figure 10.
From Figure 10a, it can be observed that when the through traffic volume is equal to 500 veh/h and the left-turn ratio is between 2.6 and 3.0, the variation range of the average delay at the intersection using the direct left-turn method is between 17.6 and 18.6 min. With the increase in the left-turn ratio, the average delay at the intersection using the direct left-turn method increases continually on the whole, and the intersection point is around the left-turn ratio of 2.9. When the through traffic volume Qs is 1000 veh/h, the average delay at the intersection using the median U-turn method increases with the increase in the left-turn ratio, and the average delay at the intersection using the direct left-turn method initially decreases and then increases with the increase in the left-turn ratio. The intersection point of the delay curves at the intersection using the U-turn method and the direct left-turn method is around the left-turn ratio of 0.7. When the through traffic volume Qs > 1000 veh/h and remains constant, with the increase in left-turn ratio, the average delay at the intersection using the direct left-turn method decreases firstly and then increases, and the average delay at the intersection using the median U-turn method also decreases slightly and then increases rapidly. The intersection point of the two average delay curves at the intersection using the median U-turn method and the direct left-turn method is near the left-turn ratio of 0.5.
From Figure 10b, it can be observed that when the through traffic volume is 500 veh/h and the left-turn ratio is between 2.6 and 3.0, the CO emissions curve of the intersection using the median U-turn method is lower than that of the intersection using a direct left-turn method. When the through traffic volume Qs ≥ 1000 veh/h, with the increase in the left-turn ratio, the CO emissions at the intersection using both the U-turn method and the direct left-turn method increase first and then decrease on the whole. With the increase in the left-turn ratio, the CO emissions of the intersection using a median U-turn method change from larger than to less than those of the intersection using a direct left-turn method. When the through traffic volume is 1000 veh/h, there is an intersection point with left-turn ratio of about 0.3 between the CO emission curves at the intersection using the U-turn method and the direct left-turn method. When the through traffic volume Qs > 1000 veh/h, there is a single intersection point between the CO emission curves of the intersection using a direct left-turn method and the median U-turn method. When the real left-turn ratio is larger than that of the intersection point, the CO emissions at the intersection using the median U-turn method are smaller.
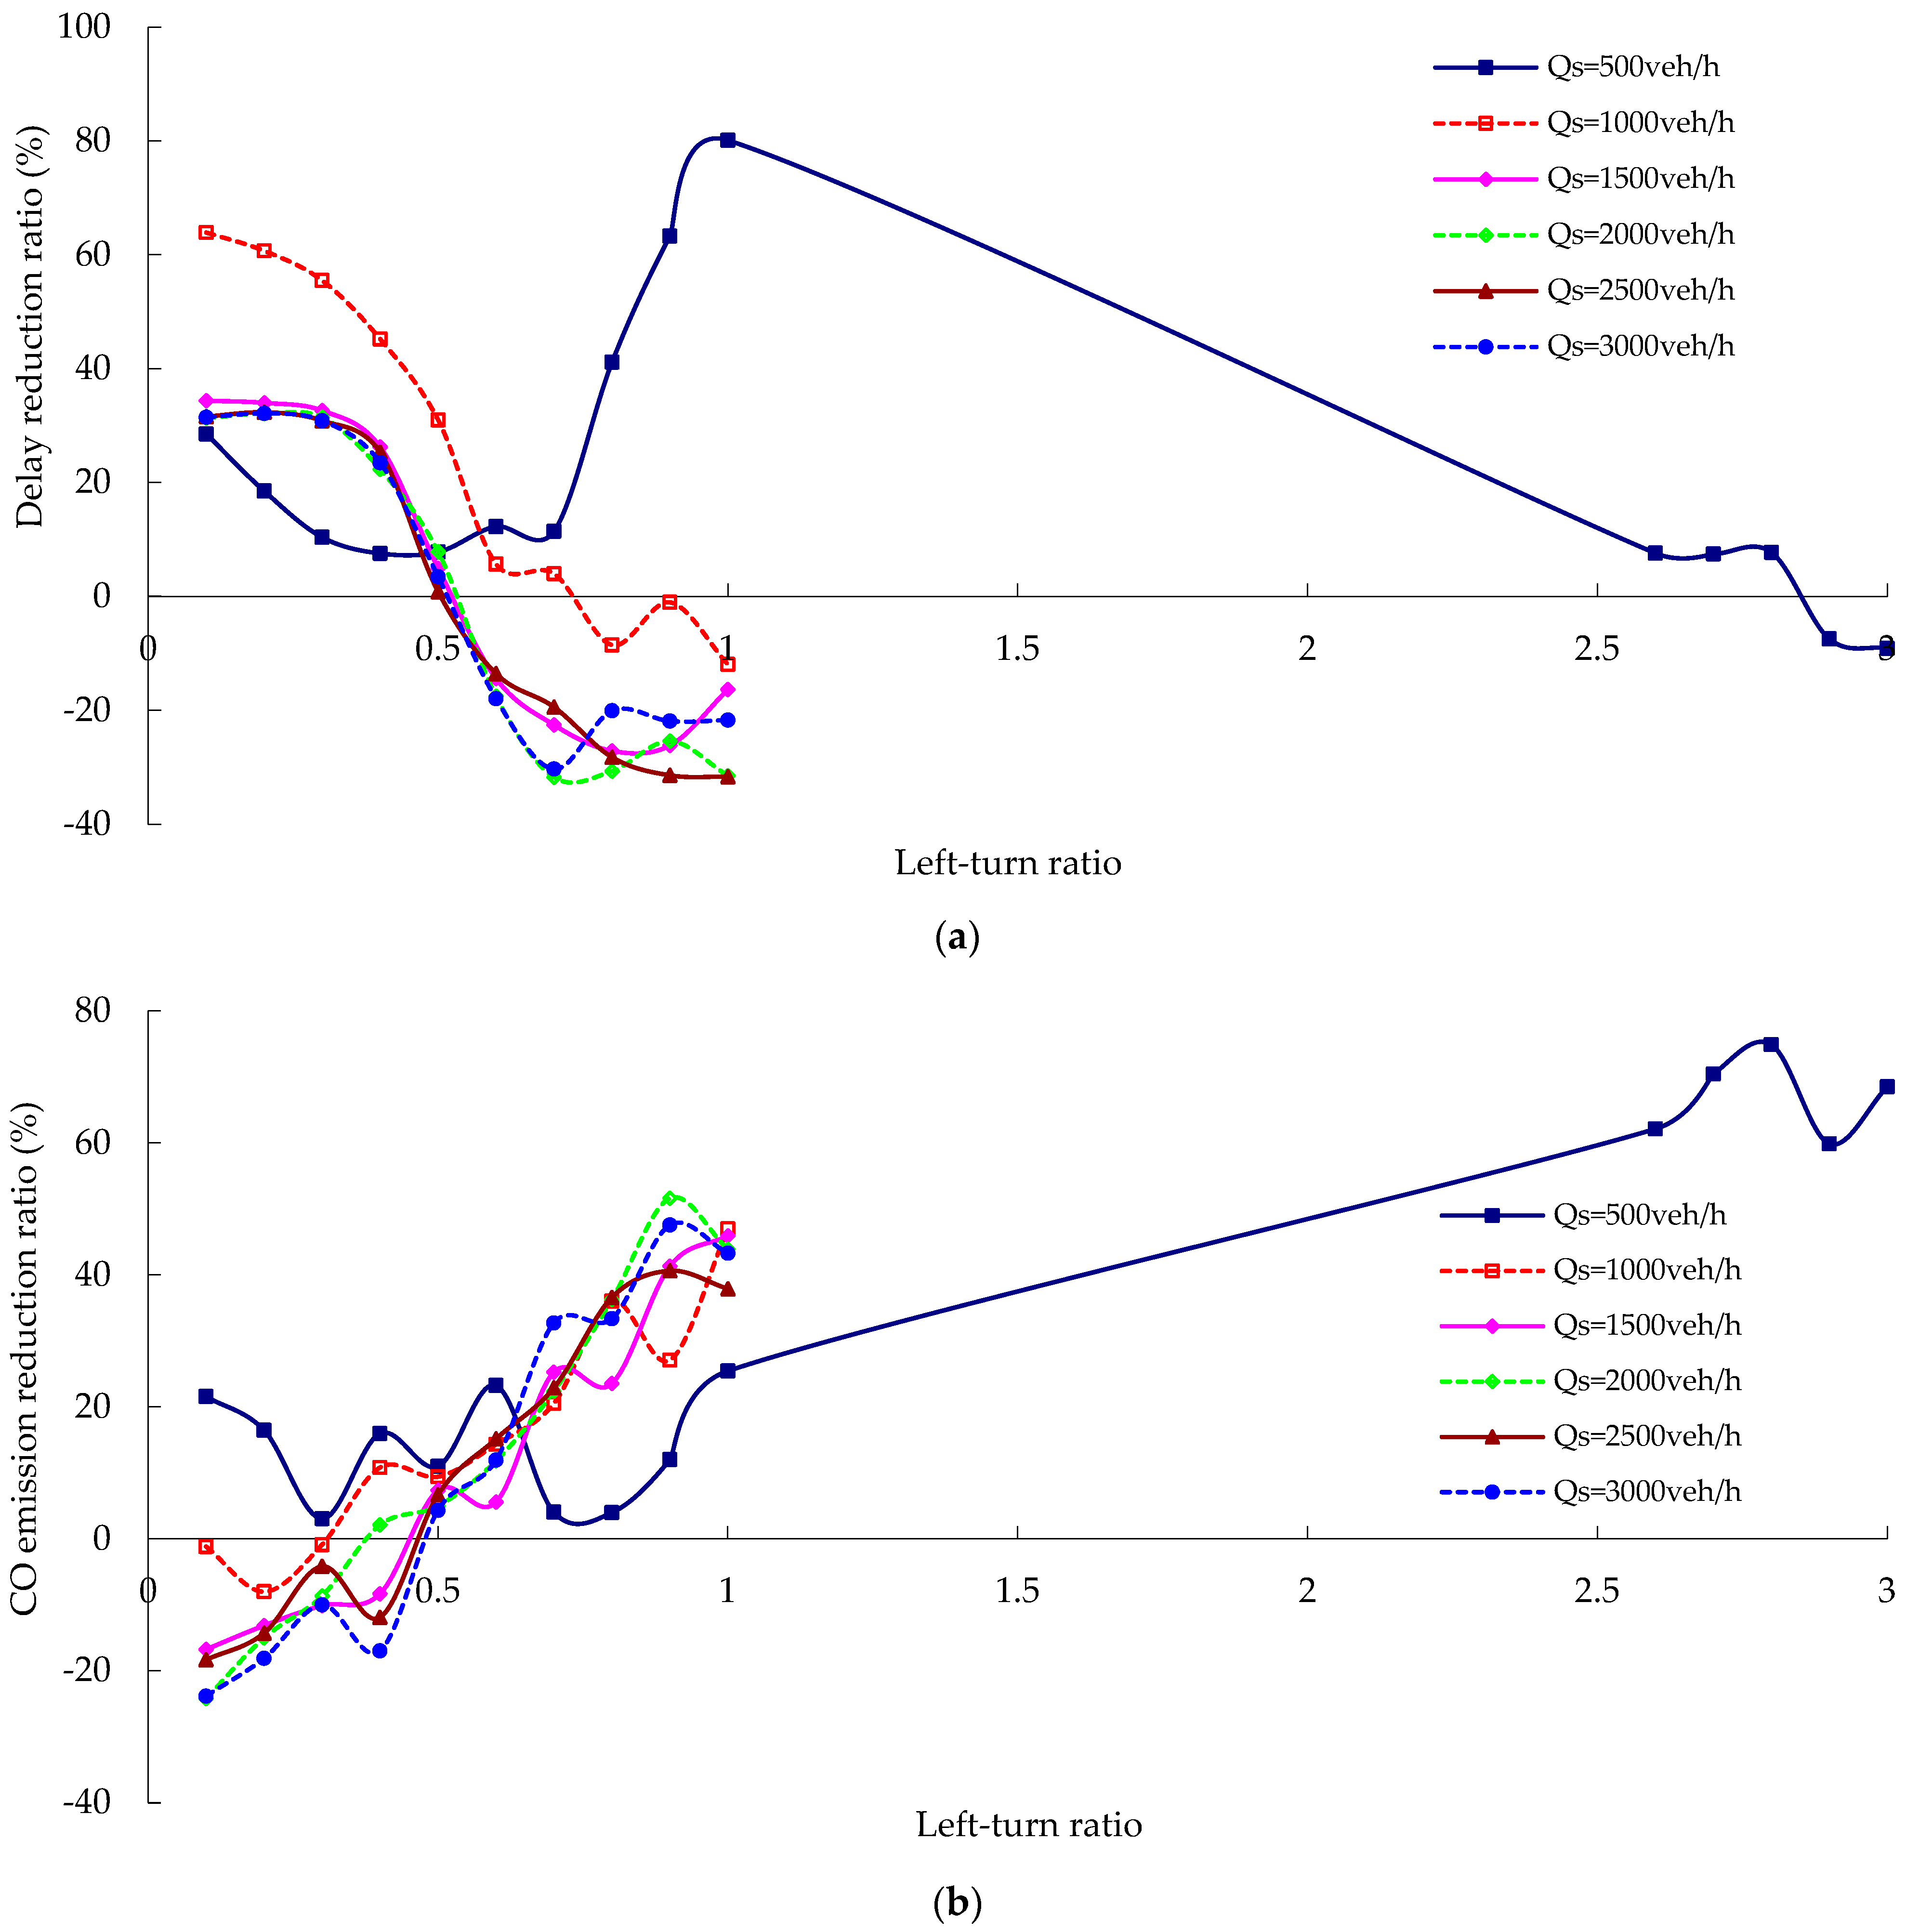
In order to more intuitively show the applicability of the intersection using a median U-turn method with the through traffic volume Qs ≥ 500 veh/h, similar to the condition of through traffic volume Qs ≤ 500 veh/h shown in Figure 8, the delay reduction rate and CO emission reduction rate under different through traffic volumes can be obtained through Formulas (2) and (3), as shown in Figure 11.
where REr is the CO emission reduction rate, Edlt is the CO emissions of the intersection using a direct left-turn method, and Eut is the CO emissions of the intersection using a median U-turn method.
REr = (Edlt − Eut)/Edlt × 100%
From Figure 11, it can be observed that under each through traffic volume, every average delay reduction rate curve has an intersection point with the X-axis, and the fitting line for the left-turn ratios corresponding to these intersection points can be named as delay-based critical left-turn ratio boundary curve Rdcri(3) under large through traffic volumes. As shown in Figure 9, it can be seen that Rdcri(3) decreases rapidly and then stabilizes. When the left-turn ratio is lower than the left-turn ratio corresponding to the intersection point under each through traffic volume, the average delay reduction rate of the intersection is positive, which means that the average delay at the intersection using the median U-turn method is smaller.
From Figure 11, it can be seen that the reduction rate of CO emissions increases with the increase in left-turn ratio on the whole. Except for the through traffic volume of 500 veh/h, every CO emission reduction rate curve has an intersection point with the X-axis, and the fitting line for the left-turn ratios corresponding to these intersection points can be named as CO emission-based critical left-turn ratio boundary curve RCOcri. As shown in Figure 9, it can be seen that RCOcri increases slightly and then tends to be constant with the increase in the through traffic volume. When the left-turn ratio is larger than the left-turn ratio corresponding to the intersection point under each through traffic volume, the reduction rate of CO emission at the intersection is positive, which means that the CO emissions at the intersection using the median U-turn method are lower.
3.3. Optimal Conditions for Implementing the Median U-Turn Method at Intersections
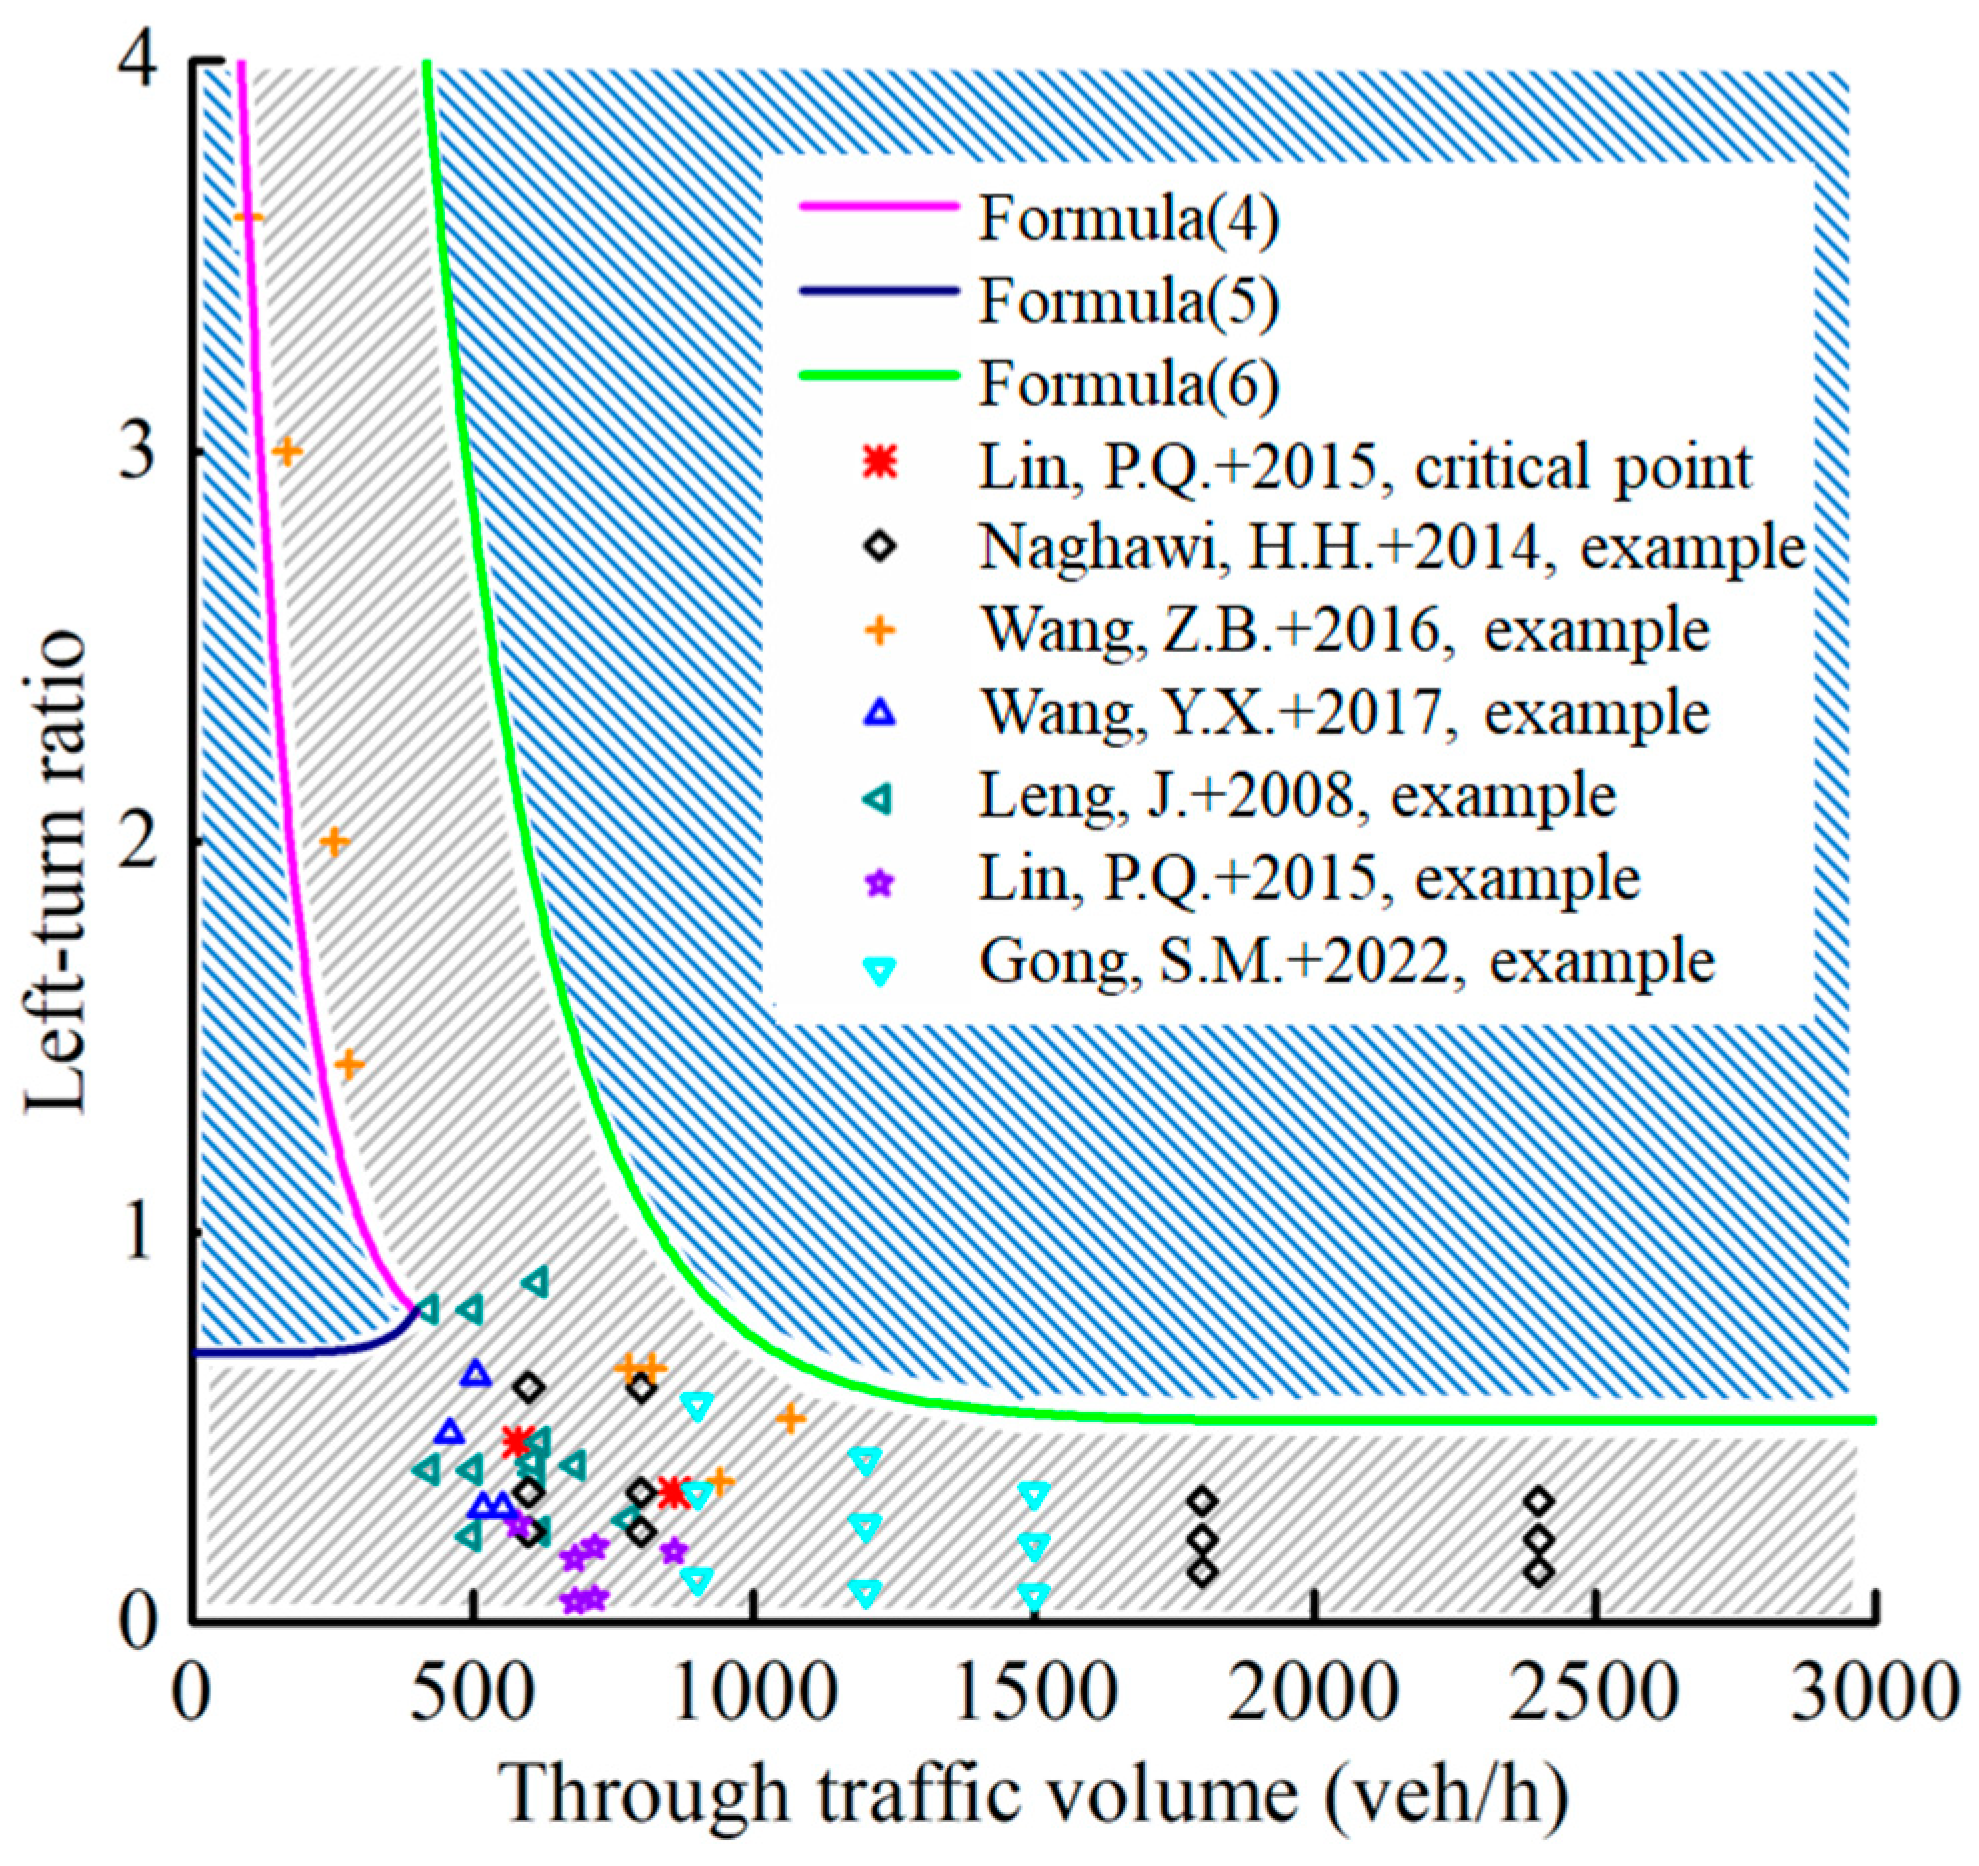
According to Figure 9, by fitting the relationships between critical left-turn ratios Rdcri(1), Rdcri(2), Rdcri(3), RCOcri, and through traffic volume Qs, the areas suitable for using a median U-turn method (green areas) and those not suitable for using a median U-turn method (red areas) at an intersection can be obtained, as shown in Figure 9. The fitting formulas of Rdcri(1), Rdcri(2), Rdcri(3) and RCOcri are as follows:
Therefore, the real left-turn ratio Rls suitable for using the median U-turn method under different through traffic conditions is shown in Table 2. After measuring the through traffic volume and the left-turn traffic volume and calculating the left-turn ratio of each entrance at an intersection, the median U-turn method can be used to achieve a smaller average delay and CO emissions at the intersection if the following requirements for through traffic volume and left-turn ratio are met.
- When the through traffic volume Qs ≤ 87 veh/h, the left-turn ratio Rls suitable for using the median U-turn method is in the range of 0–.
- When the through traffic volume is in the range of 87–400 veh/h, the left-turn ratio Rls suitable for using the median U-turn method is in the range of –4 or 0–.
- When the through traffic volume is in the range of 400–416 veh/h, the left-turn ratio Rls suitable for using the median U-turn method is in the range of 0–4.
- When the through traffic volume is in the range of 416–934 veh/h, the left-turn ratio Rls suitable for using the median U-turn method is in the range of 0–.
- When the through traffic volume Qs ≥ 934 veh/h, and the left-turn ratio Rls suitable for using the median U-turn method is in the range of .
4. Discussion
From the introduction section, it can be seen that many scholars have given examples of applying the median U-turn method based on the average delay at an intersection. In order to verify the applicable zone of the median U-turn method determined by the Formulas (4)–(6), as shown in Figure 12, the suitable left-turn ratios that used a median U-turn method under different through traffic volumes in some of the literature are also plotted in Figure 12. From Figure 12, it can be seen that all suitable left-turn ratios of the intersection using a median U-turn method under different through traffic volumes fall within the applicable grey zone of the intersection using a median U-turn method determined by Formulas (4)–(6), which proves that the applicable zone of the median U-turn method determined in this paper is correct and feasible.
According to the “Evaluation Method for Road Traffic Congestion” (GA/T 115-2020) in China, it can be concluded that the intersection is in a slight congestion state when the average delay at an intersection exceeds 55 s, and the intersection is in a serious congestion state when the average delay at the intersection exceeds 145 s [37]. The unobstructed intersection means that the average delay of the intersection is less than one signal cycle. The slight congestion intersection means that the average delay of the intersection is greater than one signal cycle. The congested intersection means that the average delay of the intersection is greater than two signal cycles. According to Figure 6a and Figure 10a, when the through traffic volume Qs > 500 veh/h and the left-turn ratio Rls = 1, the average delay at the intersection exceeds 145 s and the average stop times at the intersection are more than 4 times (Figure 7), and the intersection is in a serious congestion state. When the through traffic volume Qs ≥ 1000 veh/h, the average delay at the intersection far exceeds 145 s and the average stop times at the intersection are more than 4 times (Figure 7), and the intersection is also in a serious congestion state under all left-turn ratios. As this kind of congestion state may occur at urban intersections, it is still necessary to give the suitable left-turn ratios for an intersection using a median U-turn method based on the average delay and CO emissions as indexes. However, it is not enough to only consider whether or not to use a median U-turn method to alleviate the congestion at the intersection. Some other measures to alleviate traffic congestion also need to be comprehensively considered such as road network traffic organization, intersection space channelization, signal timing optimization, and so on.
5. Conclusions
- Through VISSIM software simulation, it can be seen that when the through traffic volume Qs ≤ 400 veh/h, the average delay curve of the intersection using a direct left-turn method and that of the intersection using a median U-turn method have one or two intersection points. The left-turn ratio corresponding to the smaller intersection point is relatively concentrated, while the left-turn ratio corresponding to the larger intersection point decreases rapidly as through traffic volume increases. When the through traffic volume Qs > 400 veh/h, the average delay curve of the intersection using a direct left-turn method and that of the intersection using a median U-turn method have one intersection point, and the left-turn ratio corresponding to the intersection point shows a trend of rapid decrease followed by stabilization with the increase in through traffic volume.
- Through VISSIM software simulation, it can be seen that when the through traffic volume Qs < 934 veh/h, the CO emission curve of the intersection using a median U-turn method is lower than that of the intersection using a direct left-turn method under each through traffic volume. When the through traffic volume Qs ≥ 934 veh/h, the CO emission curve of the intersection using a direct left-turn method has a single intersection point with that of the intersection using a median U-turn method, and the left-turn ratio corresponding to the intersection point shows a trend of increase followed by stabilization with the increasing through traffic volume.
- When the through traffic volume is between 0 and 3000 veh/h and the left-turn ratio is between 0 and 4, three critical left-turn ratio boundary curves named , , and can be obtained by fitting the left-turn ratios corresponding to the intersection points of the average delay curve of the intersection using a median U-turn method and that of the intersection using a direct left-turn method under different through traffic volumes, and a critical left-turn ratio boundary curve named can be obtained by fitting the left-turn ratios corresponding to the intersection points of the CO emission curves of the intersection using a median U-turn method and that of the intersection using a direct left-turn method under different through traffic volumes. The median U-turn method is considered applicable at the intersection when the through traffic volumes are in the range of 0–87 veh/h, 87–400 veh/h, 400–416 veh/h, 416–934 veh/h, and 934–3000 veh/h, respectively, and, accordingly, the left-turn ratios are in the range of 0–, 0– or, 0–4, 0–, and .
It should be noted that the research in this article is based on the following conditions: the research object is a flat four-way intersection with three entrance lanes and three exit lanes in each direction; each entrance includes a left-turn lane, a straight lane, and a right-turn lane, and each of four central medians with a width of 4 m has a U-turn opening with a length of 8 m located 400 m away from the intersection. Under the geometric conditions of the road intersection mentioned above, only the through traffic volume and left-turn traffic volume are considered to seek the suitable conditions of an intersection using a median U-turn method. Further research is needed on the through traffic volumes and left-turn ratios that are suitable for using a median U-turn method at intersections under other road intersection geometric conditions. Additionally, safety issues and pedestrian movements were not considered in the current analysis and are left for future work.
Author Contributions
Conceptualization, Z.Z. and Q.G.; methodology, B.G.; software, Z.Z.; validation, B.G., C.T., and Q.G.; formal analysis, Z.Z.; investigation, Q.G.; resources, B.G.; data curation, B.G.; writing—original draft preparation, Z.Z.; writing—review and editing, B.G.; visualization, Q.G.; supervision, B.G.; project administration, C.Z.; funding acquisition, C.T. All authors have read and agreed to the published version of the manuscript.
Funding
This research was financed by two grants from the Jiaozuo Engineering Research Center of Road Traffic and Transportation (JRTT2023003 and JRTT2023012).
Institutional Review Board Statement
Not applicable.
Informed Consent Statement
Not applicable.
Data Availability Statement
The data presented in this study are available in the article.
Acknowledgments
Conflicts of Interest
The authors declare no conflicts of interest.
References
- Wang, W. Delay Analysis Method for Capacity of Road Intersections. Chin. J. Highw. 1998, 8, 62–67. [Google Scholar]
- Zhao, J.Y.; Yang, X.F. Study on safety evaluation index of urban road intersection. J. Chang. Univ. (Archit. Environ. Sci. Ed.) 2003, 3, 59–62. [Google Scholar]
- Naghawi, H.H. Analysing delay and queue length using microscopic simulation for the unconventional intersection design Superstreet. J. S. Afr. Inst. Civ. Eng. 2014, 56, 100–107. [Google Scholar]
- Zhou, H.S.; Hou, X.D.; Li, Y.F. Improvement design of intersection based on far-side U-turn—Taking Lanzhou intersection as an example. Gansu Sci. Technol. 2018, 34, 88–90. [Google Scholar]
- Wang, Z.B. Analysis of the application of far-side U-turn at the Minzu Jinzhou intersection in Nanning. West. Transp. Sci. Technol. 2016, 5, 89–93. [Google Scholar]
- Zhang, W.H.; Chen, J.S.; Dong, R.J. Study on the geometric parameter setting and traffic efficiency of the secondary road at the intersection. China Civ. Eng. J. 2017, 50, 121–128. [Google Scholar]
- Wang, Y.X. Delay analysis of two organization modes of left-turn traffic flow at intersections. Qinghai Transp. Technol. 2017, 6, 10–13. [Google Scholar]
- Chen, J.S. Planning Method of U-Turn Traffic of Secondary Traffic Flow at Road Intersection; Hefei University of Technology: Hefei, China, 2018. [Google Scholar]
- Wang, L.; Zhang, N.; Liu, J.G. Study on Organization of Far-Side U-Turn for Left-Turning Vehicles at T-Intersection Side Roads. Compr. Transp. 2021, 43, 91–97. [Google Scholar]
- Yang, X.K.; Zhou, H.G. CORSIM-based simulation approach to evaluation of direct left turn versus right turn plus U-turn from driveways. J. Transp. Eng. 2004, 130, 68–75. [Google Scholar] [CrossRef]
- Leng, J.; Zhang, Y.; Sun, M. VISSIM-based simulation approach to evaluation of design and operational performance of U-turn at intersection in China. In Proceedings of the 2008 International Workshop on Modelling, Simulation and Optimization, Hong Kong, China, 27–28 December 2008; pp. 309–312. [Google Scholar]
- Zhang, N.; Chen, K.; Gao, C.H.; Huang, W. Micro-simulation-based Location Planning Method for Far-Side U-Turns. J. Traffic Transp. Eng. 2008, 1, 78–82. [Google Scholar]
- Hou, J.; Zhou, G.; Du, X.C.; Guo, X.C. Simulation study on left-turn traffic organization at the entrance of urban main road. In Proceedings of the Fourth Annual Conference of China’s Intelligent Transportation, Beijing, China, 12–15 October 2008; pp. 603–607. [Google Scholar]
- Yang, Z.D.; Yang, Y.J.; Bai, S.K. Simulation analysis and application research on U-turning at intersections. Traffic Transp. Acad. Ed. 2012, 2, 128–131. [Google Scholar]
- Shen, C.Q.; Lu, J.; Zhu, S.X.; Wei, D.M. Non-signalized intersection remote U-turn selection of Primary Highway. J. Highw. Transp. Res. Dev. 2013, 30, 122–127. [Google Scholar]
- Lin, P.Q.; Gu, Y.M.; Zhuo, F.Q.; Ran, B.; Xu, J.M. Delay calculation model of two organization modes of left-turn traffic flow at intersection. J. South China Univ. Technol. (Nat. Sci. Ed.) 2015, 43, 119–126. [Google Scholar]
- Gong, S.M.; Feng, S.B.; Duan, L.M.; Chen, Y.Y.; Zhang, Q.G. Research on the U-turn location of vehicles at signalized intersections of urban Main roads. J. Xinxiang Univ. 2022, 39, 55–59. [Google Scholar]
- Guin, A.; Robinson, K.; Unthank, H.; Roy, S.; Hunter, M. Impact of Restricted Crossing U-Turns on Vehicular Emission. Transp. Res. Rec. 2023, 2677, 386–397. [Google Scholar] [CrossRef]
- Omarov, M.; Ismail, S.; Rani, W.N.M.W.M.; Durdyev, S. Estimation of traffic delay due to U-turns at uncontrolled medians: Case study in Phnom Penh, Cambodia. Sustainability 2021, 14, 118. [Google Scholar] [CrossRef]
- Kay, J.; Gates, T.J.; Savolainen, P.T.; Shakir Mahmud, M. Safety performance of unsignalized median U-turn intersections. Transp. Res. Rec. 2022, 2676, 451–466. [Google Scholar] [CrossRef]
- Gao, Y.F.; Hu, H. Estimation of exhaust emissions from queuing vehicles at signalized intersections based on the specific power method. China J. Highw. Transp. 2015, 28, 101–108. [Google Scholar]
- Yang, Z.S.; Qu, X.; Lin, C.Y.; Bing, Q.C.; Gong, B.W. Traffic signal optimization method considering low emission and low delay. J. South China Univ. Technol. (Nat. Sci. Ed.) 2015, 43, 29–34+41. [Google Scholar]
- Xu, Y.F.; Yu, L.; Song, G.H. Intersection operation mode distribution model and emission measurement. J. Transp. Syst. Eng. Inf. Technol. 2018, 18, 158–165+185. [Google Scholar]
- Yao, R.H.; Long, M.; Zhang, W.S.; Sun, L. Analysis of influencing factors of vehicle emission factors at signalized intersections. J. Beijing Jiaotong Univ. 2019, 43, 122–131. [Google Scholar]
- Yao, R.H.; Long, M.; Zhao, S.C. Analysis of influencing factors of motor vehicle emissions at signalized intersections based on orthogonal test. J. Beijing Univ. Technol. 2022, 46, 300–310. [Google Scholar]
- Zhao, Y. Research on Intersection Signal Optimization Method Considering Low Emission; Jilin University: Changchun, China, 2022. [Google Scholar]
- Sun, X.F. Research on Emission Estimation Method of Signalized Intersection under Vehicle-Infrastructure Cooperation; Beijing Jiaotong University: Beijing, China, 2016. [Google Scholar]
- Haydari, A.; Zhang, M.; Chuah, C.N.; Ghosal, D. Impact of deep RL-based traffic signal control on air quality. In Proceedings of the 2021 IEEE 93rd Vehicular Technology Conference (VTC2021-Spring), Helsinki, Finland, 25–28 April 2021; pp. 1–6. [Google Scholar]
- Gastaldi, M.; Meneguzzer, C.; Giancristofaro, R.A.; Gecchele, G.; Della Lucia, L.; Prati, M.V. On-road measurement of CO2 vehicle emissions under alternative forms of intersection control. Transp. Res. Procedia 2017, 27, 476–483. [Google Scholar] [CrossRef]
- Ba, X.Q.; Xu, M.F.; Li, H.T. MOVES-based emission analysis of urban road intersection organization optimization. J. Chongqing Inst. Technol. (Nat. Sci.) 2018, 32, 115–121. [Google Scholar]
- Li, J.Z. Research on Traffic Signal Control Model and Optimization Method for Low Pollution Emission; South China University of Technology: Guangzhou, China, 2018. [Google Scholar]
- Wu, M.Z. Research on Vehicle Exhausts Emissions at Left-Turn Intersections; Southwest Jiaotong University: Chengdu, China, 2020. [Google Scholar]
- Lu, Y.H. Research on lane change in ten-lane interchange diversion area based on VISSIM simulation. Smart City 2020, 6, 153–154. [Google Scholar]
- Xing, X.G. Optimization design of intersection signal control scheme based on VISSIM. Transp. World 2021, 31, 29–30. [Google Scholar]
- Wang, H.W. Research on Traffic Control Optimization Method of Low-Carbon Ring Island; Jilin University: Changchun, China, 2011. [Google Scholar]
- Zhang, L.H. Application research of U-turn far lead in main line inductive coordinated control. J. Wuhan Univ. Technol. 2015, 39, 60–64. [Google Scholar]
- GA/T 115-2020; Evaluation method of road traffic congestion degree. Ministry of Public Security of China: Beijing, China, 2020.
Figure 1.
Intersection of Dongguan Road and Hongwei Road in Dongguan city in Guangdong province.

Figure 2.
The real-world intersection and the intersection model in VISSIM. (a) The real traffic movements at intersection; (b) the simulated traffic movements at intersection in VISSIM.
Figure 2.
The real-world intersection and the intersection model in VISSIM. (a) The real traffic movements at intersection; (b) the simulated traffic movements at intersection in VISSIM.

Figure 3.
The left-turn diagram at an intersection. (a) U-turn; (b) direct left turn.

Figure 4.
The simulation models for left turn at an intersection. (a) U-turn; (b) direct left turn.

Figure 5.
The simulation schemes.

Figure 6.
The relationship between the average delay, CO emissions at the intersection, and the left-turn ratio. (a) Average delay; (b) CO emissions.
Figure 6.
The relationship between the average delay, CO emissions at the intersection, and the left-turn ratio. (a) Average delay; (b) CO emissions.

Figure 7.
Comparisons of average stop times.

Figure 8.
The delay reduction rate of using a U−turn method at the intersection.

Figure 9.
The critical left-turn ratio boundary curves Rdcri(1), Rdcri(2), Rdcri(3), and RCOcri.

Figure 10.
The relationship between the average delay and CO emissions at the intersection and the left-turn ratio for Qs ≥ 500 veh/h. (a) Average delay; (b) CO emissions.
Figure 10.
The relationship between the average delay and CO emissions at the intersection and the left-turn ratio for Qs ≥ 500 veh/h. (a) Average delay; (b) CO emissions.

Figure 11.
Average delay and CO emission reduction rates for Qs ≥ 500 veh/h. (a) Average delay; (b) CO emission.
Figure 11.
Average delay and CO emission reduction rates for Qs ≥ 500 veh/h. (a) Average delay; (b) CO emission.

Figure 12.
The schematic diagram of the applicability of the intersection using a median U-turn method in the relevant literature [3,5,7,11,16,17].


Table 1.
The emission rate of pollutant CO corresponding to each interval (g/s).
| Number | VSP Interval | CO Emission Rate |
|---|---|---|
| 1 | (−∞,−2) | 0.0110 |
| 2 | [−2,0) | 0.0087 |
| 3 | [0,1) | 0.0047 |
| 4 | [1,4) | 0.0122 |
| 5 | [4,7) | 0.0167 |
| 6 | [7,10) | 0.0233 |
| 7 | [10,13) | 0.0293 |
| 8 | [13,16) | 0.0369 |
| 9 | [16,19) | 0.0495 |
| 10 | [19,23) | 0.0638 |
| 11 | [23,28) | 0.1054 |
| 12 | [28,33) | 0.2478 |
| 13 | [33,39) | 0.4131 |
| 14 | [39,+∞) | 0.6247 |
Table 2.
The suitable left-turn ratio Rls for the intersection using a median U-turn method.
| Conditions | 1 | 2 | 3 | 4 | 5 |
|---|---|---|---|---|---|
| Qs (veh/h) | 0– | 416– | 934–3000 | ||
| Rls | 0– | 0– or | 0–4 | 0– |
Disclaimer/Publisher’s Note: The statements, opinions and data contained in all publications are solely those of the individual author(s) and contributor(s) and not of MDPI and/or the editor(s). MDPI and/or the editor(s) disclaim responsibility for any injury to people or property resulting from any ideas, methods, instructions or products referred to in the content. |
© 2024 by the authors. Licensee MDPI, Basel, Switzerland. This article is an open access article distributed under the terms and conditions of the Creative Commons Attribution (CC BY) license (https://creativecommons.org/licenses/by/4.0/).
Share and Cite
MDPI and ACS Style
Zhao, Z.; Tian, C.; Guo, B.; Zhu, C.; Guo, Q. Analyzing Delay and CO Emissions: A Simulation Study of the Median U-Turn Method at Intersections. Appl. Sci. 2024, 14, 3737. https://0-doi-org.brum.beds.ac.uk/10.3390/app14093737
AMA Style
Zhao Z, Tian C, Guo B, Zhu C, Guo Q. Analyzing Delay and CO Emissions: A Simulation Study of the Median U-Turn Method at Intersections. Applied Sciences. 2024; 14(9):3737. https://0-doi-org.brum.beds.ac.uk/10.3390/app14093737
Chicago/Turabian StyleZhao, Ziyan, Caixia Tian, Baohua Guo, Chengming Zhu, and Qingwen Guo. 2024. "Analyzing Delay and CO Emissions: A Simulation Study of the Median U-Turn Method at Intersections" Applied Sciences 14, no. 9: 3737. https://0-doi-org.brum.beds.ac.uk/10.3390/app14093737
Note that from the first issue of 2016, this journal uses article numbers instead of page numbers. See further details here.