1. Introduction
The development and popularization of renewable energy source applications, the reduction in energy consumption and the optimization of energy management in order to limit environmental problems (air pollution, global warming, acid rain, etc.) and the impacts of the global energy crisis have now become a real focus of scientific and engineering research. In addition, due to the impressive increase in demands in the building and industrial sectors worldwide, there is a growing need for appropriate methods to improve the thermal performance of heating and cooling systems.
The market is looking for new materials, systems and technologies that could be used to reduce the dependence of buildings on fossil fuels, to use renewable energy sources, to contribute to the greener and more efficient use of energy and to improve indoor thermal comfort in a more sustainable and cost-effective way. Apart from heating, one of the biggest energy needs in buildings is the preparation of domestic hot water. In this area, it is very important to use PCMs (phase change materials) for heat storage in order to achieve the necessary savings and a balance between peak demand and energy production. This is confirmed by the amount of research and testing of these materials and their practical applications. Here, the current practice is facing several challenges, especially regarding the economic feasibility of implementing PCMs and the ways to use them [
1,
2].
Thermal energy storage (TES) and phase change materials (PCM) are efficient technologies that can store high thermal energy densities in a limited temperature range.
An extensive method to reduce energy consumption is the use of phase change materials known as “PCMs”. PCMs have attracted much attention and have become a topic of major interest in recent decades. Latent heat accumulation is a highly promising method because it can provide higher energy storage densities than thermal energy storage systems in the form of sensible heat, and has the ability to store heat at a constant (or approximately constant) temperature corresponding to the phase transition temperature of the PCM. PCMs used in TES must meet two main requirements, namely high latent heat values and high thermal conductivity, and at the same time, they must have a melting/solidification point within the practical range of application [
3,
4,
5].
Phase change materials can be used as preferred materials for energy storage and have the advantage of being able to maintain a high energy density under limited temperature conditions. The issue is that PCMs have relatively low thermal conductivity, which can limit the charge and discharge rates of a thermal energy storage device.
Existing research focuses on potential solutions to improve the physicochemical properties of accumulation materials and their compatibility with each other in multi-stage phase accumulation. Existing research is also focused on monitoring the properties of binary compounds. The results are aimed at improving energy efficiency by increasing the ratio of renewable sources, through energy management and by reducing energy consumption for heating and cooling. This is caused by the significant increase in energy demand worldwide due to the rapid growth of the world’s population and economy, which, in turn, leads to severe environmental impacts [
4,
5].
The most suitable PCMs for research and application (solid–liquid state and vice versa) are paraffins, which have many advantages over other materials. Their primary characteristics are a wide range of temperature ranges, relatively high latent heat, a noncorrosive nature, durability and a long cyclic lifetime.
PCM-TES systems for heat storage are receiving a lot of attention, and various possible PCM-based technological approaches in heating systems are being investigated. Emphasis is placed on the concept of PCM systems for space heating and the use of PCMs in passive and active systems. Active PCM-TES systems (underfloor heating, PCM ceiling slabs and other systems) and passive PCM-TES systems (PCM slab walls, PCM shutters, PCM building blocks, air heating systems, underfloor heating, ceiling slabs, etc.) have high potential to reduce the heating load in buildings [
4,
6,
7,
8,
9,
10].
The use of PCMs in cooling, heating and power generation is divided into four temperature ranges: For the low temperature range (−20 °C to 5 °C), mainly organic compounds are used as PCMs. For the medium–low temperature range (5 °C to 40 °C), mainly organic compounds and salt hydrates are used. For the medium temperature range (40 °C to 80 °C), mainly organic PCMs such as paraffin and fatty acids are used. Finally, for the high temperature range (80 °C to 200 °C), salt hydrates have long dominated the TES sector due to their durability and economic advantages, while organic PCMs are seldom used in this temperature range [
11].
Cool thermal energy storage (CTES) currently represents a significant area of application for industrial refrigeration, such as process cooling, food preservation and building air conditioning systems. One of the possibilities is the application of a phase change in which the temperature range can be appropriately adjusted for proper and efficient operation of the cooling system. For air conditioning and refrigeration (cold storage), temperatures between 5 and 15 °C are optimal for heat storage, but at lower temperatures, latent heat storage materials are more efficient than sensible heat storage materials (such as water).
CTES can have an important role in peak load management and addressing the problem of the interruption of power supply from renewable energy sources, especially when CTES is integrated into district cooling systems [
12,
13]. PCMs can be integrated into free cooling systems, passive building heating and cooling systems, and evaporative and radiant cooling systems to improve indoor thermal comfort and reduce energy consumption. With systems integrated into PCMs, energy cost savings of up to 50% can be achieved compared to traditional options, with the fastest payback of approximately 6 years [
14,
15,
16]. For space cooling, a suitable general-purpose cooling medium is water with a temperature of 5–12 °C. The reasons for its significant application are mainly associated with its high specific heat capacity, simple equipment, low cost and unpretentious technical requirements. However, the accumulation of cold in water as a liquid has one significant drawback, namely the range of the temperature interval, which, in many cases, is only a few degrees. Many applications in the industrial and food sectors require temperatures up to 8 °C, and others such as refrigeration and air-conditioning require systems up to 15 or 18 °C, and this significantly limits the amount of accumulated cold (energy extracted from the water); the lower limit is, in practice, a temperature above 4 °C that occurs due to pressure changes associated with the water anomaly. Other problems arising from the above include the low energy storage density, the large volume of the water storage tanks and the difficulties in storing and treating the cold.
However, the use of PCM for CTES purposes is still limited due to its low thermal conductivity. As a result, extensive research has been carried out to improve its thermal performance by adding nanomaterials, microencapsulating and stabilizing its form. In addition to scientific research papers, there are review articles on CTES using PCMs [
17].
Currently, there is extensive research on TES systems for heat and cold storage in renewable-energy-based systems [
18,
19,
20]. Current research in the field of heat storage is focused on increasing the thermal conductivity of PCMs in a variety of ways, including the effects of PCM geometrical parameters, PCM heat exchanger configurations and the addition of nanoadditives such as carbon, graphene, graphite, metals, nanotubes, metal foams, etc., but at the same time, problems such as the sedimentation of additives also arise from this. The main three factors that influence the selection of PCMs for different applications are the melting temperature, the latent heat of fusion and the thermophysical properties of the PCM, the primary thermal conductivity [
21,
22,
23].
Studies on this subject also focus on increasing the heat transfer rate in PCMs. Currently, commercially available heat storage systems are based on sensible heat, while PCM-based heat storage systems are mostly in the development or experimental commercial use phase. As this literature review shows, most works deal with paraffin-based PCMs, which indicates the importance of this substance and its techno-economic potential for further improvement and application [
24,
25].
The heat transfer from the surface of a PCM to the inner layers of the PCM is dependent on its physical properties.
According to [
26,
27], the melting process can be described by four phases: (1) PCM in solid state, (2) PCM in solid state—phase change, (3) PCM in semi-solid state—phase change, (4) PCM in liquid state—liquid.
With respect to the “massiveness” of the PCM, but especially the very small values of λ in the solid state—valid for phases (1) to (3)—the internal heat exchange is of crucial importance. Therefore, it is necessary to consider not only the conditions on the surface between the PCM and the tank in which the PCM is placed, but also the internal heat exchange process itself.
Several authors, mentioned in [
28], have used various methods leading to an improvement in the internal heat exchange, especially in the semi-solid state, where a liquid phase has already been formed between the container in which the PCM is stored and the solid phase of the PCM, and this separates the core of the PCM (in the solid phase from the exchange surface). From their results, it can be concluded that there is a decrease in the rate of phase change, and this is due to the low value of λ. As the research demonstrates, it is essential to ensure an increase in the λ value of a PCM that is still in the solid phase.
Research on the influence of the size, mass and arrangement of PCMs in thermal energy storage, as well as ways to improve the thermal conductivity of PCMs, is mostly based on mathematical, analytical and numerical models [
28], which are not supported by experimental studies. Therefore, an experimental model was developed to test PCMs, in which various thermophysical parameters of such materials, as well as methods to improve the methods of thermal energy storage and transfer, were investigated.
Based on the growing demand for sustainable energy solutions and the limitations of current energy storage methods, this study focuses on improving the thermal conductivity of phase change materials (PCMs). Although PCMs offer significant advantages for thermal energy storage due to their high latent heat capacity, their low thermal conductivity hinders their practical application. Existing research has explored various methods to improve the performance of PCMs, including the incorporation of nanoadditives, microencapsulation and geometric modifications (e.g., fins) [
21,
22,
23]. However, a critical gap in the research remains regarding the achievement of significant improvements in cure and fusion rates without compromising other important PCM properties and without implementing complex and expensive modifications. This research aims to address this gap by exploring the implementation of readily available, uncomplicated metal structures to significantly improve the thermal conductivity and heat transfer rate of PCMs. The goal is to achieve significantly faster solidification and melting processes compared to existing methods.
The primary objective is the experimental testing of various techniques to improve the thermal conductivity of PCMs and heat transfer, mainly by using commonly available non-random metal structures from the point of view of their applicability in practice. The other objective is to reduce the times of the process of accumulation and transfer of energy, respectively, in the melting and solidification of PCMs.
Recent published results show an acceleration in the melting process of 24.52% and in solidification of 43.6%, as reported by the authors [
29] for shell- and tube-type heat exchangers using the technique of improving heat transfer by applying three longitudinal fins of brass. In the work [
30], the authors achieved a reduction in solidification time of 5% and in melting time of 37.8% in the simulation of a triplex-tube heat exchanger containing a Y-shaped fin. Hosseinzadeh et al. [
31], in a system with tree-like and conventional rectangular fins, achieved a 76% reduction in solidification time compared to a plain triplex-tube heat exchanger. The authors of [
32], in an experimental analysis, estimated reductions in the charging and discharging times of 41.48% and 22.16%, respectively, with the integration of spiral fins. The authors of [
33] attempted the combination of metal foam and nanoparticles, which led to significant reductions in melting times of 69.52% compared to pure PCM.
The aim of our work is to demonstrate the possibility of speeding up the process of solidification (which was reduced by 79%) and melting (by 54%).
The methods consist of experimental measurements of various techniques for monitoring the temperatures in the individual layers a PCM during the whole process of the accumulation and transfer of energy, and an evaluation of the influence of various metal structures on the thermal conductivity of the PCM and the heat transfer between the individual layers of the PCM and the interface between the PCM surface and the heat transfer fluid.
2. Materials and Methods
To perform the measurements, a PCM had to be selected, the necessary equipment for measuring the values had to be prepared and the right conditions had to be ensured.
The PCM chosen was a material of organic nature, specifically, paraffin, with a phase change in the temperature range of 48.2–52 °C for the melting process and 53.5–51 °C for the solidification process. Based on the above, it can be concluded that the phase change process for the material shows a hysteresis curve.
The Comet MS3 measuring and recording panel was used to obtain the most accurate temperature measurement. The measuring and recording panel was designed to measure, record, evaluate and subsequently process input electrical quantities that are subject to relatively slow changes (>1 s). In conjunction with appropriate sensors and transducers, it is suitable for monitoring physical quantities. The device can measure up to 16 channels simultaneously. It can also work independently without the use of a PC as it has its own memory for 150,000 data. The data can be measured cyclically and non-cyclically, and the desired time interval of data measurements can be set. K-type thermocouples were used for temperature measurement; the tolerance is ±0.15 °C at the required temperature range of measurement (25 to 65 °C). Temperature sensors of this type are a combination of nickel and chromium alloys. The thermocouples have good mechanical flexibility and strength and are resistant to acids and liquids with adverse effects.
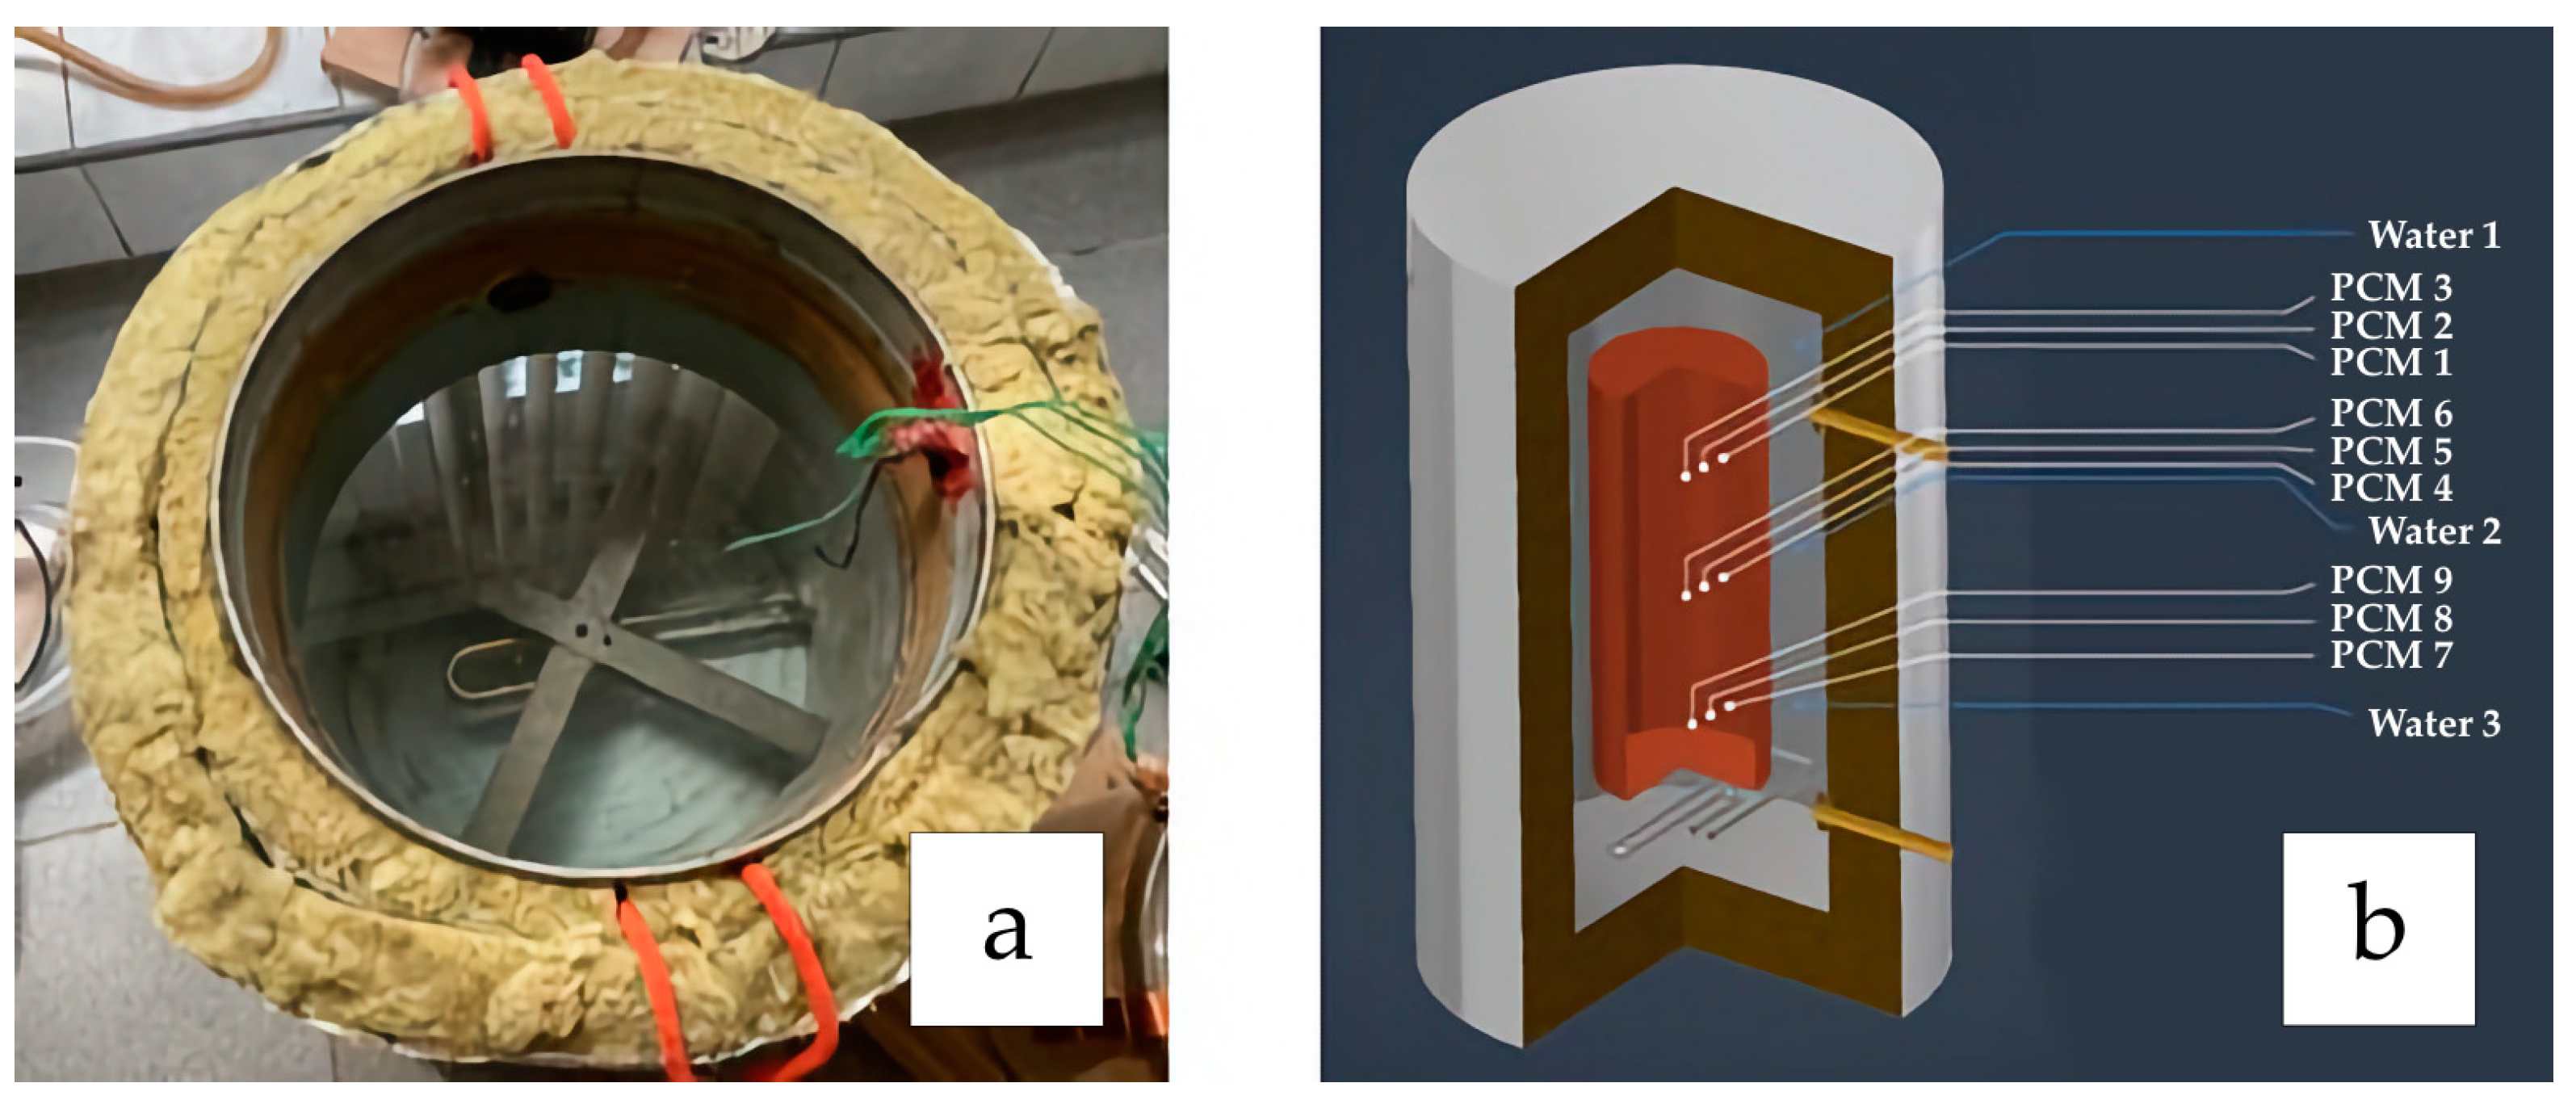
The equipment shown in
Figure 1a was used to heat (charge) the samples. For measurements to detect energy transfer profiles, the samples were placed in the constructed calorimetric experimental device. The device monitors the transfer of thermal energy from the water and PCM to the heat transfer medium (water), and is shown in
Figure 1b. The parameters of the selected material are shown in
Table 1.
The storage tank was a 12 L transparent tank with a controllable heat source (1000 W) with a temperature range from 20 °C to 99 °C in steps of 0.1 °C and a deviation from the desired temperature of approx. 0.2 °C. The heat source also allowed the water in the tank to circulate. The experimental device was designed to monitor the state of phase change of the PCM from solid to liquid and vice versa. The experimental setup thus allowed the samples to be monitored with the required temperature parameters while also ensuring a uniform flow of water around the samples with the PCM. At the same time, the transparent tank allowed the possibility of creating time-lapse image recordings, enabling the evaluation of the individual stages of phase change.
2.1. Experimental Samples
Glass laboratory beakers according to ISO 3819 [
34] with a volume of 100 mL were chosen as the experimental sample containers. The transparency level of the laboratory beakers was satisfactory to observe and visually document the phase change behavior of the PCM.
2.2. Measurement Procedure
The measurements were divided into three parts. (1) The first included the reference measurements of the charging and discharging of a sample of pure water and a sample of PCM; these measurements were necessary for comparisons with the others. (2) The second part included the measurements of the PCM samples with three different thermal conductivity and heat transfer techniques (steel twisted matrix, copper matrix, copper spiral). The measurements were designed to compare and select the most suitable technique. The first two parts of the measurements are provided in
Figure 1a,b. Then, (3) the third part included the measurements in the experimental setup, shown in
Figure 2, where the most appropriate technique chosen in part (2) was used.
2.3. Numerical Model
The energy equation in enthalpy form is written as [
35,
36]:
where the total enthalpy (H) corresponds to the sum of the sensible enthalpy and the latent heat.
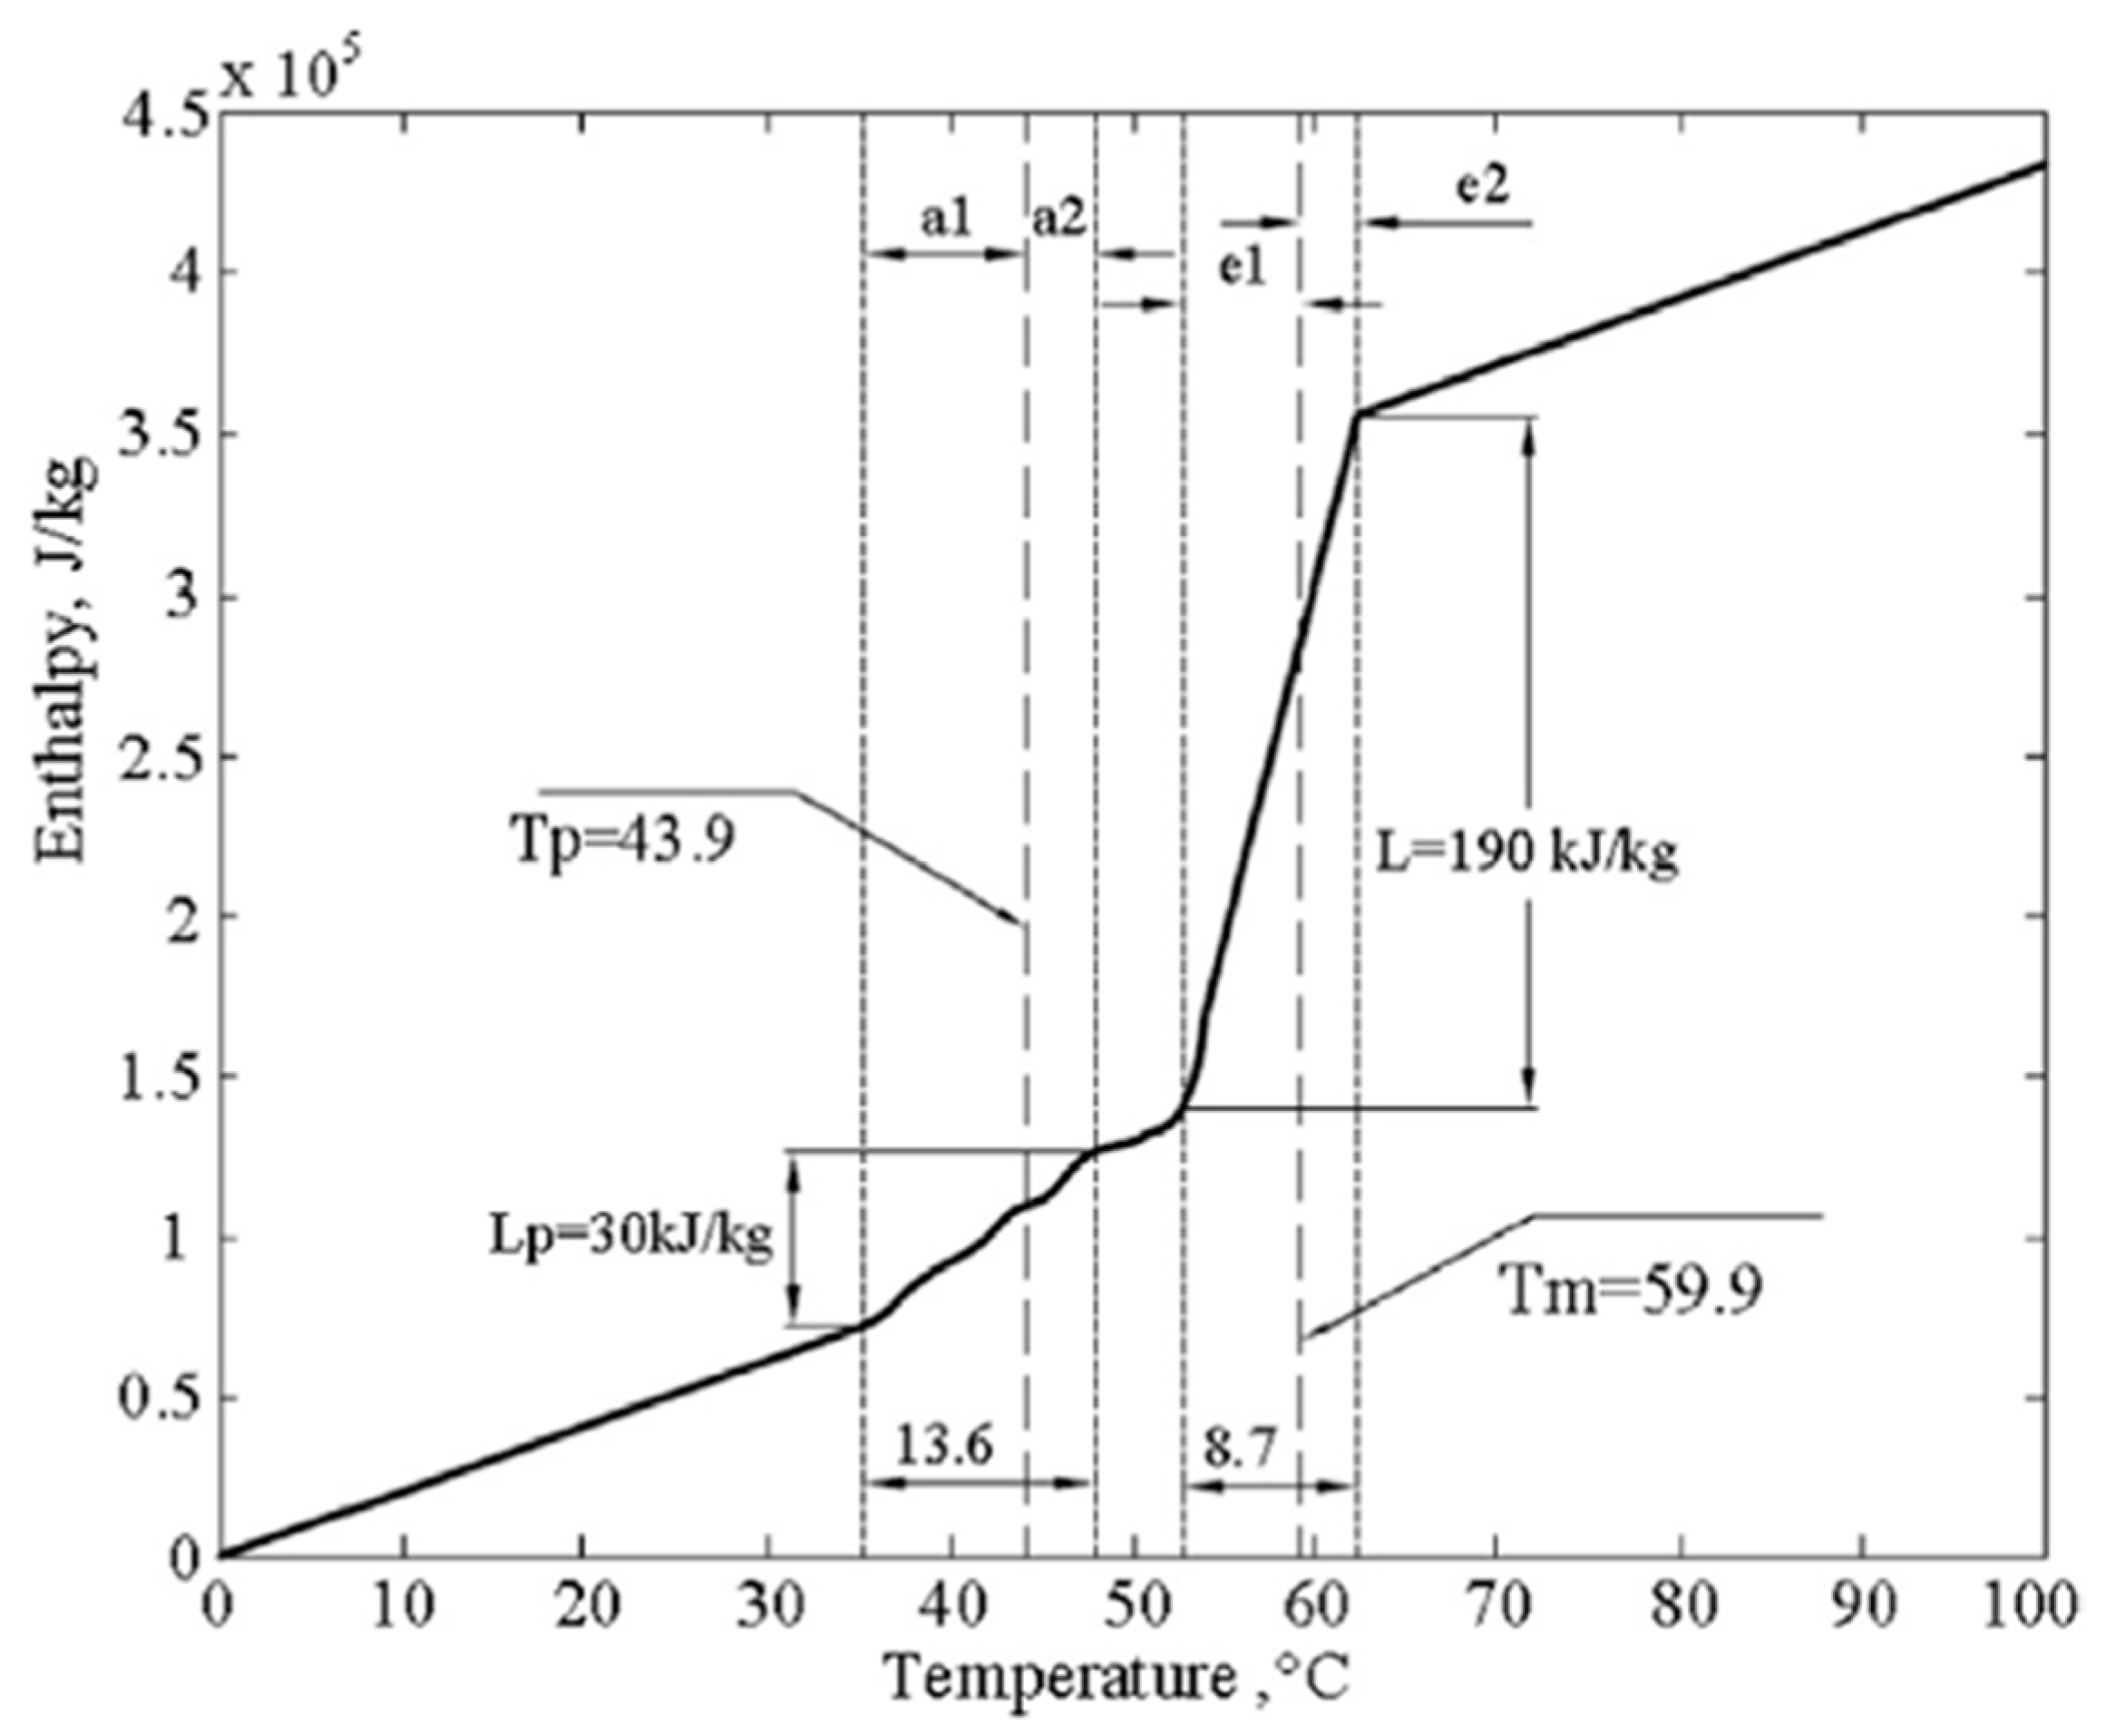
According to [
35], the enthalpy–temperature relationship (
Figure 3) during the melting process can be described by four phases: solid-state PCM, solid-state PCM—phase change, semi-solid-state PCM—phase change, liquid-state PCM—liquid.
Consequently, according to [
35,
36,
37,
38,
39], the enthalpy is the sum of the enthalpy h and the enthalpy at phase change.
Subsequently, the thermal conductivity of the PCM, k, at the interface phase is expressed as follows:
The stored energy in a unit volume of PCM can be expressed as follows [
35]:
Consequently, the sensible enthalpy h is given by [
25,
26,
40,
41,
42]
href—reference enthalpy;
Tref—reference temperature;
Cp—specific heat capacity at constant pressure.
The enthalpy of latent heat is expressed as follows [
35,
39]:
The liquid fraction β is defined as follows:
L is latent heat.
The latent heat density varies between the solid state (a value equal to zero) and the liquid state.
For solidification and melting, the equation is as follows:
H—enthalpy;
Ρ—density;
—flow velocity.
During the phase change process, heat is exchanged between the heat transfer fluid and the phase change interface in the PCM at the phase change temperature [
40,
41,
42]. This heat transfer is a function of the thermal resistance of the PCM that is in the phase change process. The result is a functional dependence of the outlet fluid temperature on the thermal resistance of the system and the constraints of the phase change temperature. Maximum heat transfer is achieved under the condition where the outlet temperature is equal to the phase change temperature of the PCM.
When the phase change interface is reached, the PCM stack can be analyzed as an exchanger between the fluid (heat transfer fluid) and the cooler/source (constant-temperature PCM). Therefore, for the average efficiency of the system at phase change according to [
42,
43], one can write the relation:
ε—efficiency;
Qact—energy released from the reservoir during the phase change;
Qth—maximum theoretical energy released from the tank during the phase change;
ṁ—mass flow rate of the heat transfer fluid;
Cp—heat capacity of the heat transfer fluid;
Ti—inlet temperature of the heat transfer fluid into the tank;
Tout—outlet temperature of the heat transfer fluid from the storage tank;
Δt—time interval;
TPCM—PCM phase change temperature.
The actual usable amount of phase change energy stored in this way is defined by the charging and discharging efficiency. Since the efficiency is based on a constant outlet temperature, this efficiency provides information about the temperature reached at the outlet of the storage tank. The efficiency can thus be characterised as a function of the operating flow rate, which characterizes the energy capacity of the storage tank. Further, as [
42,
43,
44] shows, efficiency increases as flow rates decrease because as the thermal resistance of the PCM changes, the amount of energy transferred to the heat transfer fluid also changes. Efficiency defines the operating conditions of the storage system and is a key parameter for the design of the storage tank.
Another factor is the so-called PF (Packing Factor), which defines the ratio of the total volume of the PCM to the total volume of the storage tank [
43].
where
VPCM—volume of PCM in the tank;
Vstorage—total volume of the tank.
The Packing Factor allows us to compare different PCM case designs in a convenient way, and at the same time, it allows to indirectly evaluate the efficiency in terms of determining the total in energy capacity of the tank in the usable area.
The temperature solution is essentially an iteration between the energy equation and the liquid fraction equation. In ANSYS Fluent, the method proposed by Voller and Swaminathan is used to update the liquid fraction.
2.4. Problems of Mass and Heat Transfer in the Flow of Liquid PCM along a Wall
When a fluid flows along a wall or solid body, a boundary layer [
45] is formed due to the adhesion of molecules.
When a horizontal plate is traversed at a velocity of u
t, the fluid velocity decreases due to the effect of frictional forces to zero near the surface of the plate, which is shown by the velocity profile. The thickness of the hydrodynamic boundary layer δHdMV gradually increases in the flow direction along the plate’s (1) laminar flow, (2) transition region and (3) turbulent region (
Figure 4). At the same time, a laminar sublayer is formed close to the surface in regions (2) and (3). Critical values of the Reynolds numbers can be used to determine the transition boundaries between the boundary layers.
For point 1, the following equation is calculated:
For point 2, the following equation is calculated:
At the temperature boundary layer, there is a temperature change, i.e., the temperature at the surface of the body T
p is different (in this case, bigger) compared to the ambient temperature T
t, which is shown by the temperature profile (
Figure 5).
At a distance of x from the leading edge of the heat exchange surface, the local value of the heat flux density can be obtained by applying Fourier’s heat conduction law:
where λt is the coefficient of thermal conductivity of the fluid [W·m
−1·K
−1], T
p is the surface temperature [K] and T
t is the temperature of the flowing fluid [K].
At the outer boundary, near the core of the flow, the temperature of the fluid changes only slightly in this direction; here, the heat is transferred to the core of the flow by convection.
Subsequently, the local heat transfer coefficient is calculated as follows:
When a heated vertical plate is surrounded by liquid, at a plate surface temperature higher than the liquid paraffin temperature T
p > T
t, a thermal boundary layer is formed (
Figure 6).
To determine the value of the heat transfer coefficient for natural convection in the PCM, the following equations are calculated:
where β is the temperature coefficient of the volumetric expansion of the fluid [K
−1], L is the characteristic length at which natural convection takes place [m], ΔT is the difference between the temperature on the surface of the body and the temperature of the surrounding environment [K] and ν is the kinematic viscosity of the fluid [m
2·s
−1].
In Equation (20), ρ is the density of the fluid [kg·m
−3], c is the mass heat capacity [J·kg
−1·K
−1], λt is the coefficient of thermal conductivity of the fluid [W·m
−1·K
−1] and a is the coefficient of thermal conductivity of the fluid [m
2·s
−1].
The solution is to increase the heat exchange surface, but at the same time, there cannot be a significant increase in the volume of the additive material.
3. Experimental Work
3.1. Reference Water Sample
The first measurement of the reference sample was to determine the time required for the sample to reach temperature.
The plot of
Figure 7 shows the increase in temperature over time. The total time for heating the water from 25 °C to 65.8 °C is therefore 395 s for Δt = 40.8 °C. The temperature of the heating medium was set at 69–70 °C. The sample contained 60 mL of water, which corresponds in mass to 80 mL of PCM. The total energy required to heat 60 g of water is expressed by the following equation:
In the above formula, Q is the amount of energy, J, which represents the amount of energy delivered from the PCM to the water (heat transfer medium); m is the mass of the heat transfer medium, kg; c is the specific heat capacity of water, J/(kg·K); and Δt is the temperature difference of the heat transfer medium, K.
The second measurement of the reference sample shows us the amount of energy the sample can transfer to the heat transfer medium and in which period. The measurement was carried out in an experimental setup (
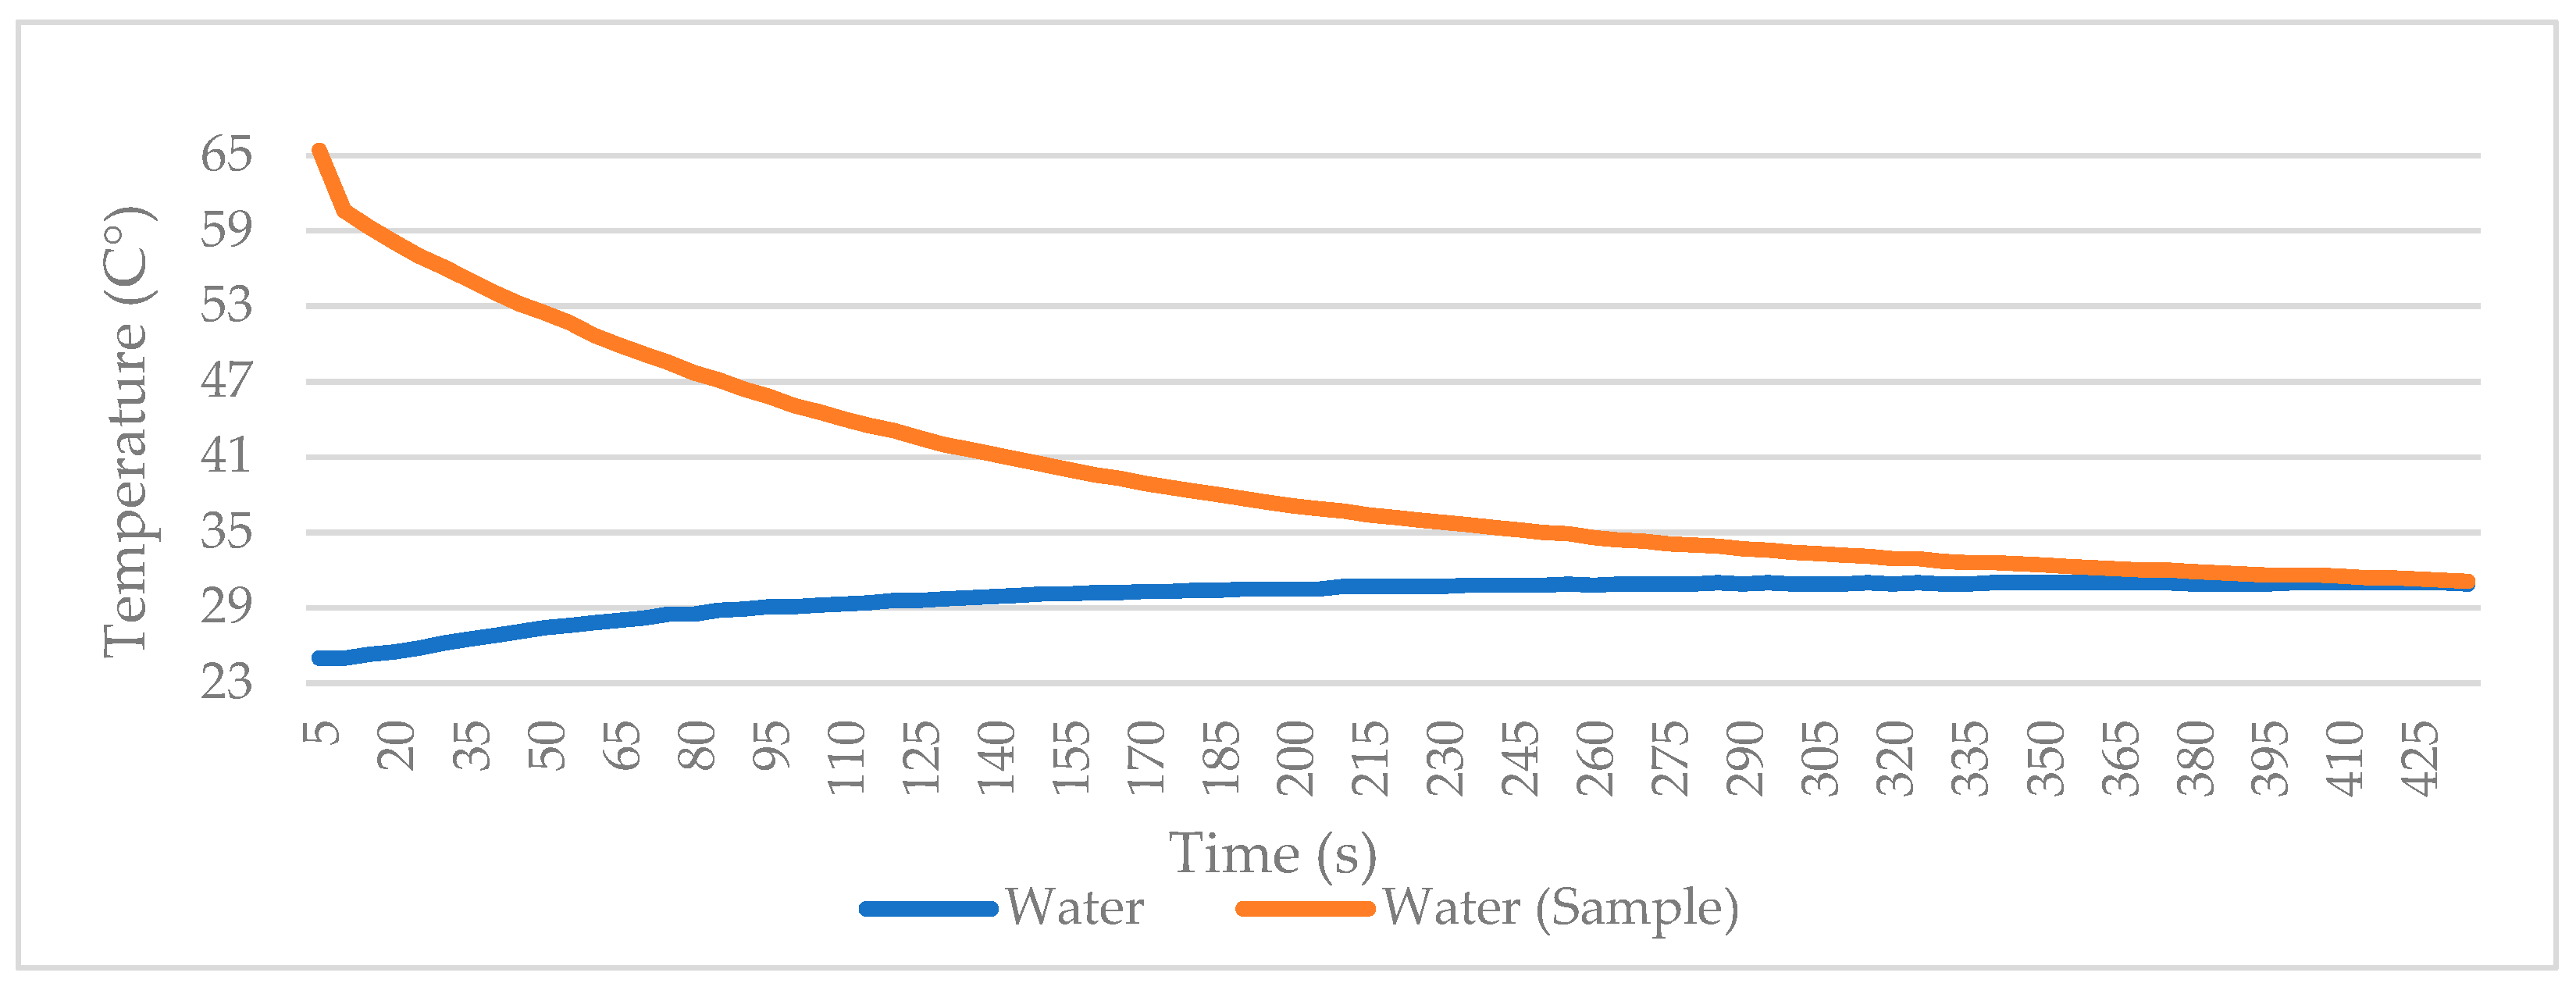
Figure 1b) with an experimental calorimeter. The device contained 400 mL of water, which was 62.5 times smaller than a 25 L container. The course is described in
Figure 8.
During the discharge of the reference sample, 60 mL water (sample), we heated 400 mL of water in the experimental calorimeter from 25 °C to 31 °C, which corresponds to Δt = 6 °C, in a time of 425 s. The sample was calculated to transfer 10,032 J of energy. In these measurements, only the sensible heat transfer was measured.
3.2. Reference PCM Sample
Further measurements focused on the melting and solidification processes of PCM over time. To compare the sensible and latent heat energy transfer, 60 g of PCM was placed in the samples, specifically, the paraffin mentioned above with a melting phase change of 48.2–51 °C. An amount of 60 g of this paraffin represents 80 mL. In
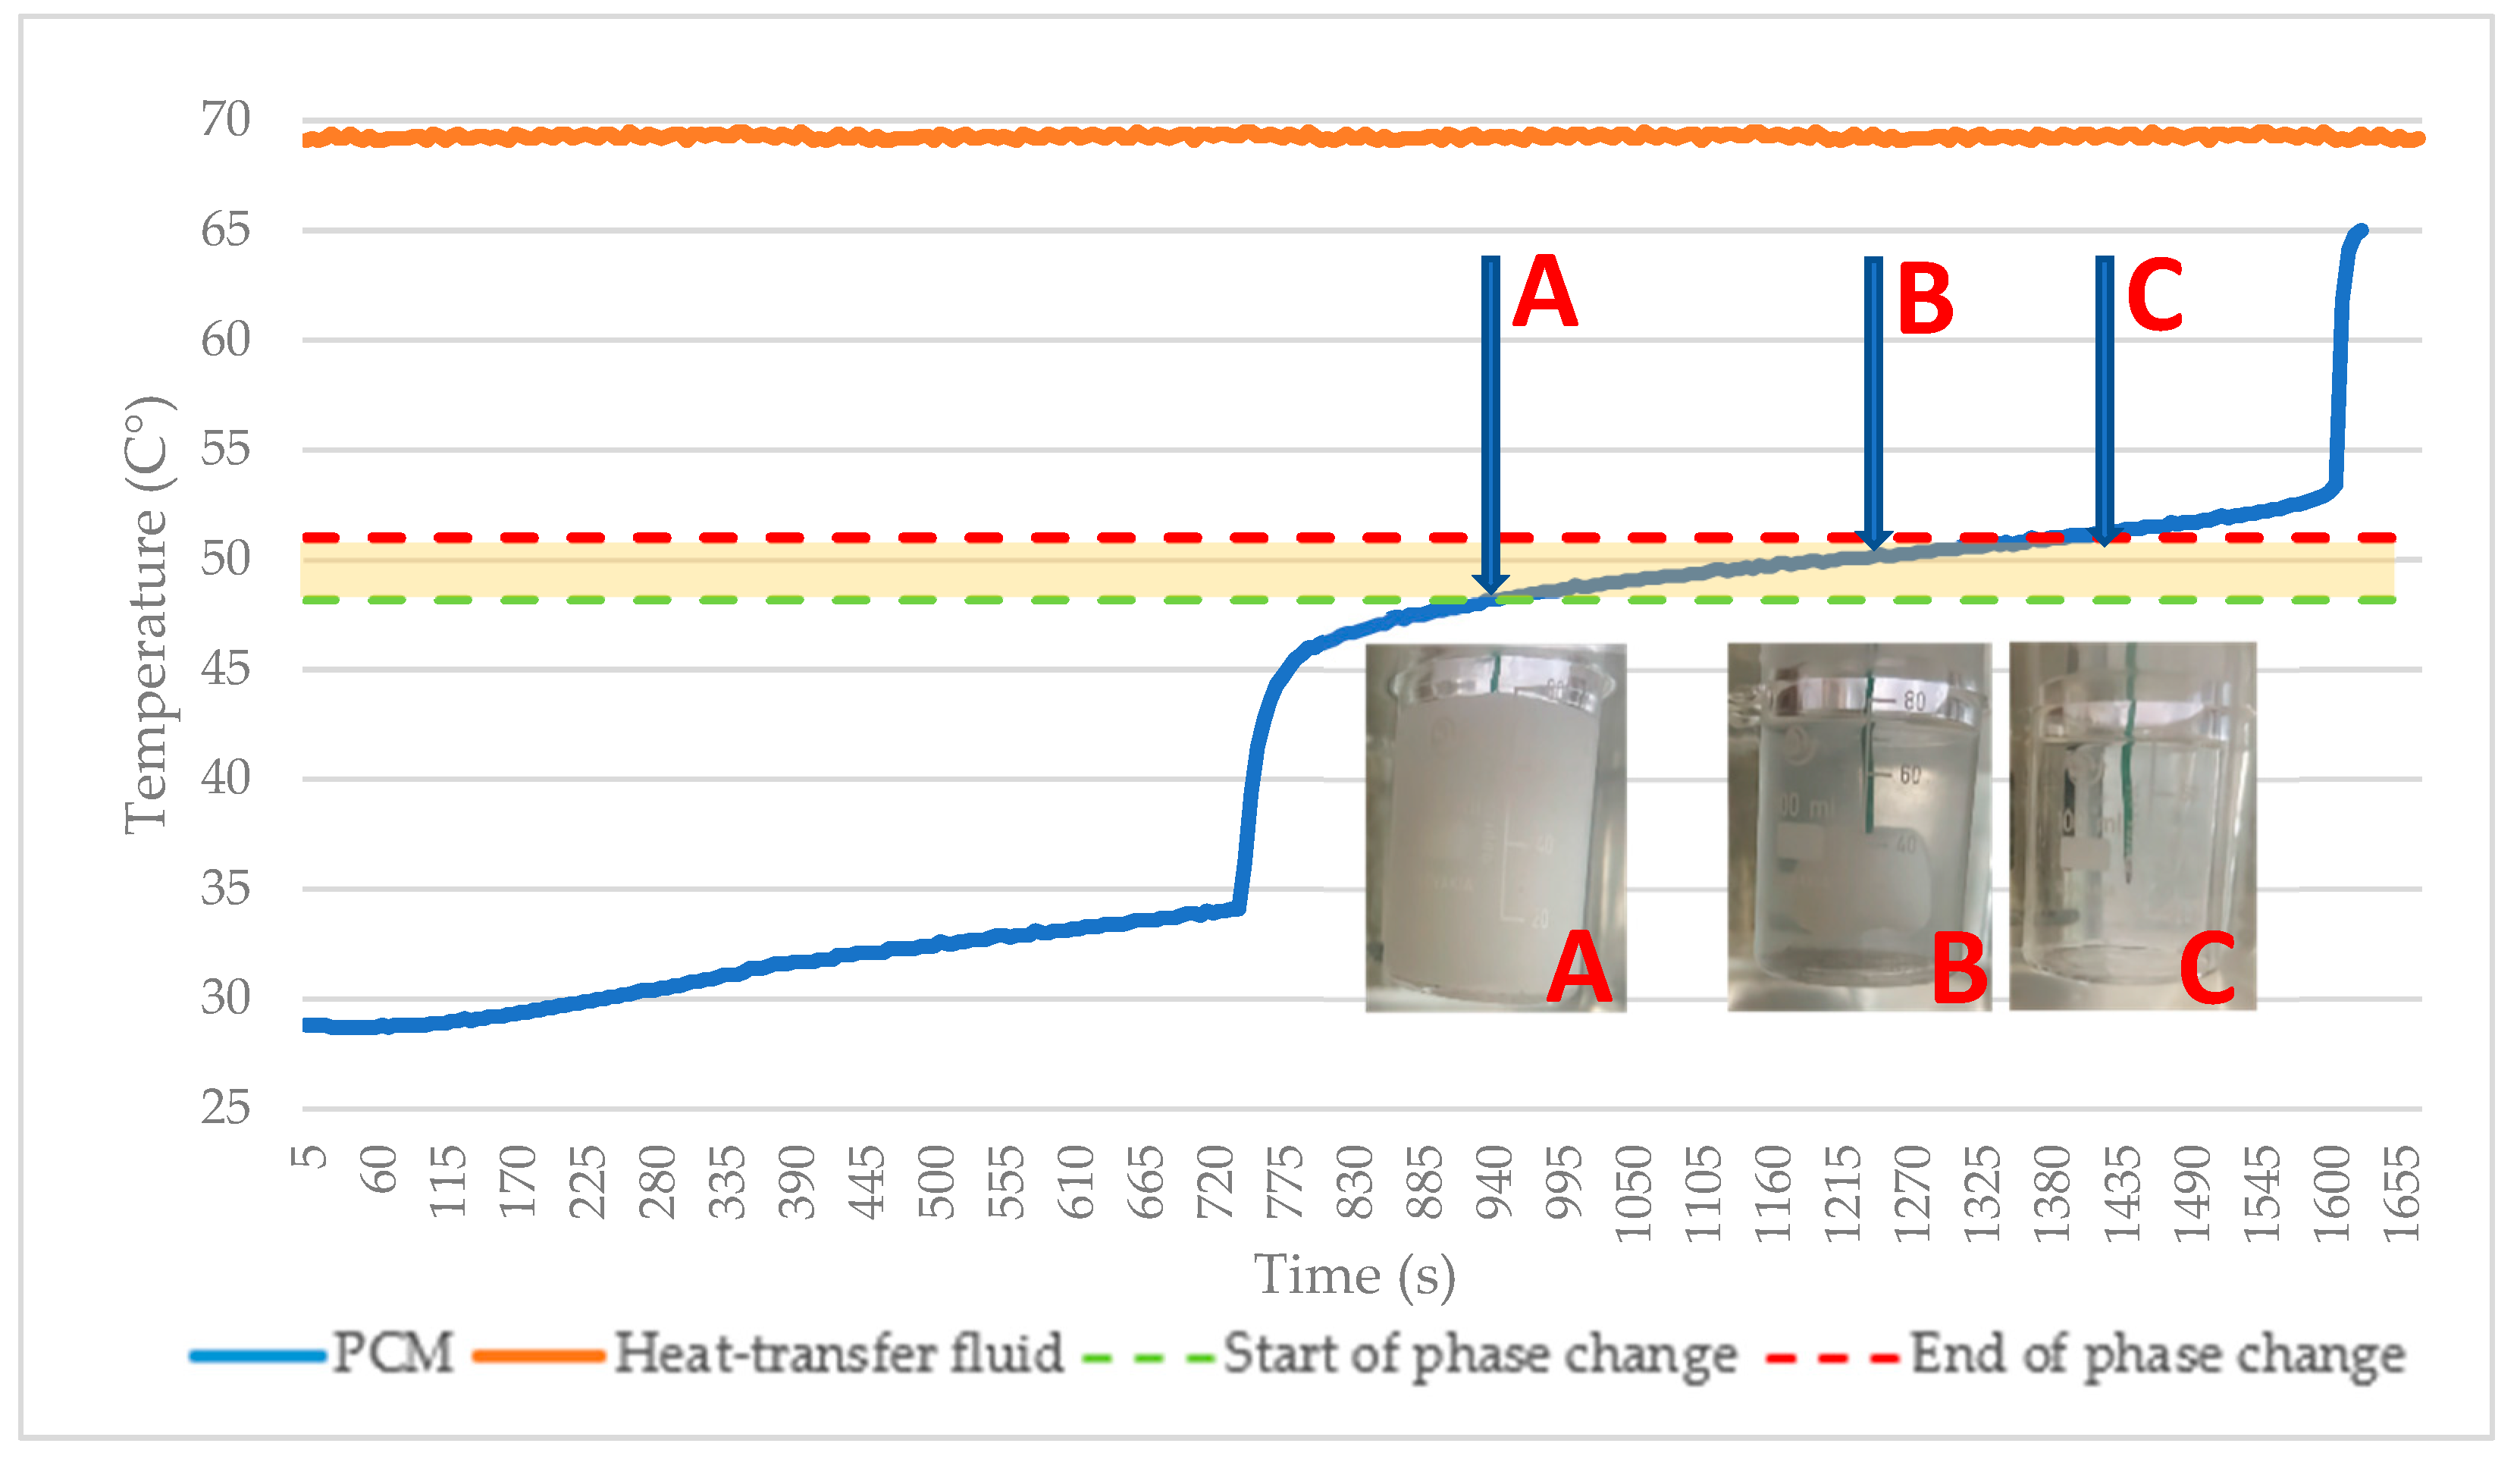
Figure 9, a graphical progression of the melting of pure PCM can be observed.
Since the measured sample contains one thermocouple, which is in the center or core of the paraffin, the image may not correlate with the real situation. This is due to uneven heating of the sample, due to the lower thermal conductivity of the paraffin. This means that the sample, i.e., the PCM on the shell, underwent a phase change much earlier than its core.
In the first part of
Figure 9, the curve of sensible heat transfer (State A) is shown, which lasts for 935 s; then, at a temperature of 48.2 °C, the second part of the graph starts with a phase change transition (melting of the PCM in the core) or the transfer of energy in the form of latent heat (image record State B). The end of the phase change occurs after the core melts at 52 °C at 1525 s. This means that the whole phase change took 590 s. In the third part of the graph, the curve again shows the acceptance of sensible heat up to the time of the end of the measurement.
According to the parameters of the paraffin, it received 10,800 J in the form of latent heat during the phase change, since paraffin has a latent heat capacity of 180 KJ/kg. To express the amount of energy absorbed by the paraffin in the form of sensible heat, Equation (1) can be used. The heat capacity of the paraffin, according to the parameters in
Table 1 and Δt = 34.3 °C, is 4527.6 J.
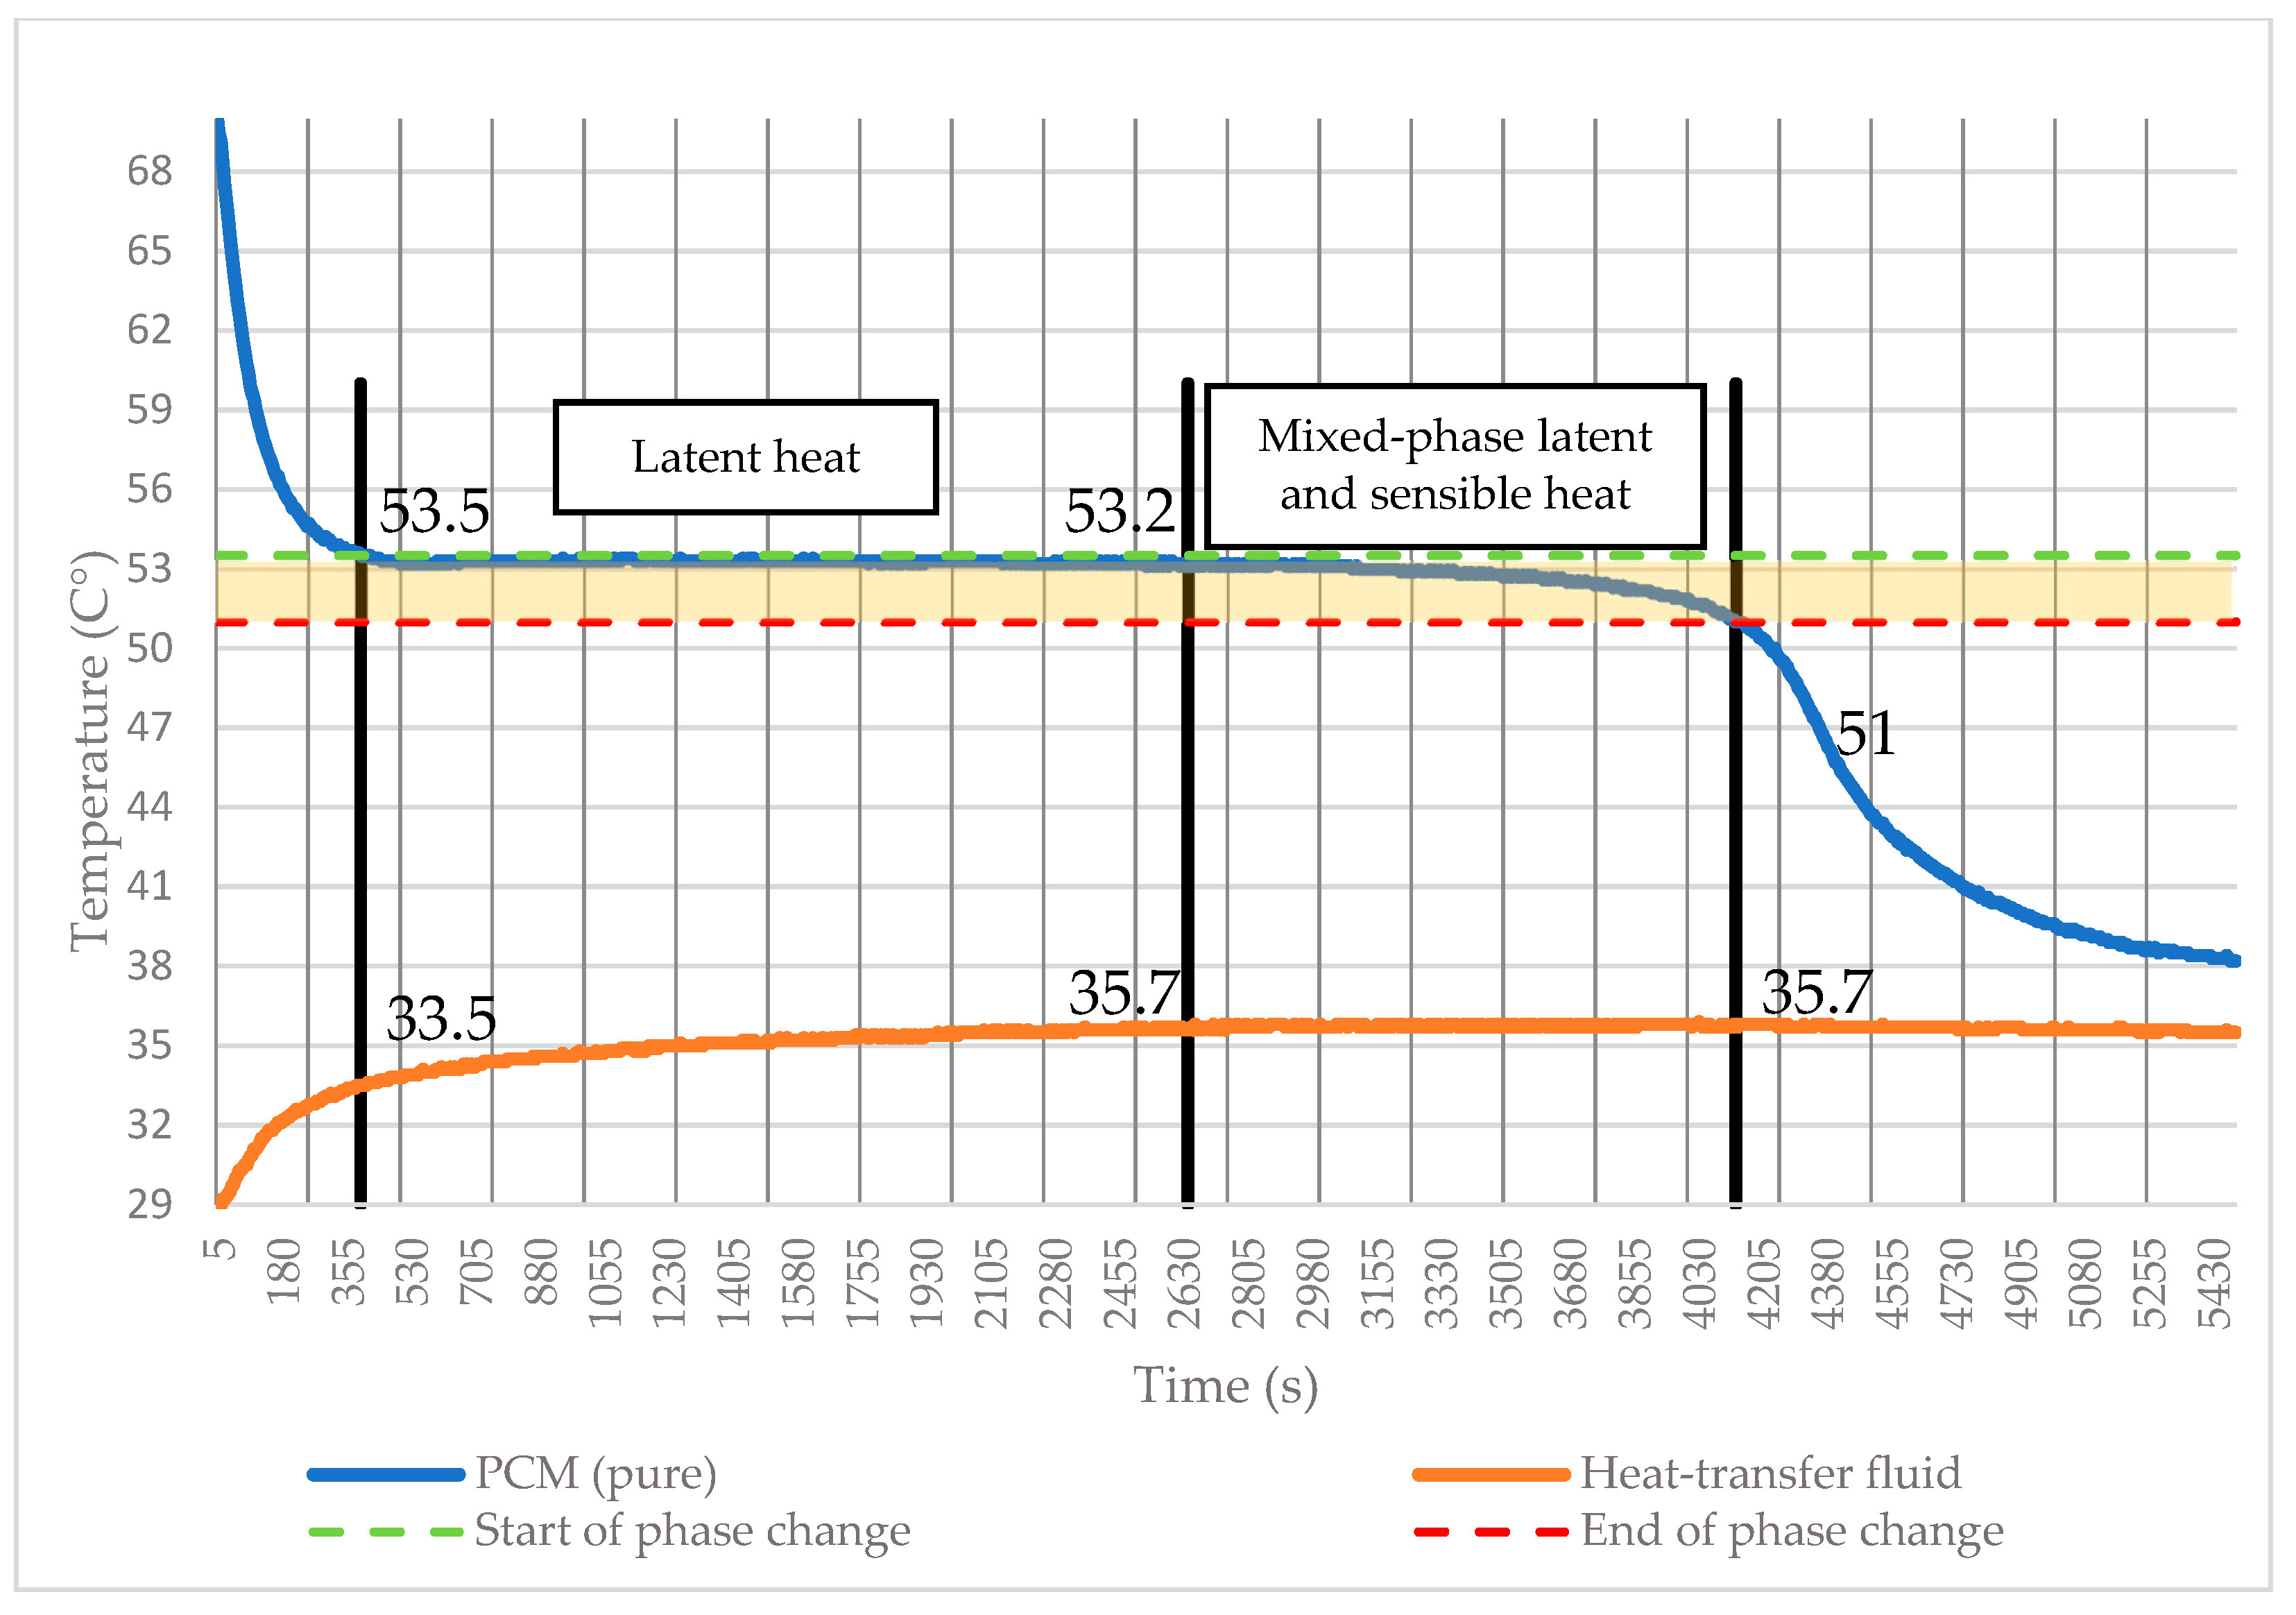
The discharging or solidification process of the PCM is described in
Figure 10. The figure shows the whole process of energy supply, mainly energy in the form of latent heat.
The focus of this measurement is the amount of latent heat transfer to the heat transfer medium over time. In
Figure 10, the progression of the onset of the solidification process of the PCM can be observed, which starts at a time of 395 s and a temperature of 53.5 °C. The temperature of the heat transfer medium is 33.5 °C at this point. The phase change ends at 51.00 °C at a time of 4135 s. The heat transfer medium has heated to a temperature of 35.7 °C. In total, the phase change lasted 3740 s. From
Figure 10, it can be determined that the phase change consists of two parts. These parts can be divided into a constant-temperature latent heat part and a mixed latent and sensible heat part. The latent heat part takes 2295 s and the mixed-phase part takes 1445 s which means that the latent heat part accounts for 61.36% of the total phase change time. During this section, the PCM heated the heat transfer medium from 33.5 °C to 35.7 °C, i.e., Δt = 2.2 °C. This can be calculated as follows:
The PCM supplied 3678.4 J to the heat transfer medium during the latent heat part of the phase change. During the mixed phase, the curve or temperature is in equilibrium and maintains the temperature of the medium at 35.7 °C. Two thermocouples were used in the experimental setup, one for measuring the temperature of the heat transfer medium and the other for measuring the phase change of the sample located in the core. Therefore, the measured state may be different from the real state due to the uneven solidification of the PCM both on the shell and in the core.
3.3. Verification of Results in ANSYS
After the first experimental measurements, the experiment with the heating of the PCM in the laboratory breaker was simulated in the ANSYS 19.0 software. The simulation results were compared with the experimental measurements and confirmed.
The modeling results match the experimental measurements.
Figure 11 shows the uniform states of the PCM, where state (1) corresponds to a time of 550 s, state (2) to a time of 620 s, state (3) to a time of 800 s, state (4) to a time of 900 s, state (5) to a time of 1000 s and state (6) to a time of 1150 s. The results show minimal differences, caused by the idealization of the process in ANSYS.
3.4. Sample with Copper Matrix
Measurement of the PCM sample with a copper matrix was carried out, to find out the percentage efficiency of the melting and solidification of PCM and the acceleration of energy transfer to the heat transfer medium. The role of the copper matrix or copper spiral is to ensure uniform heat transfer within the PCM while at the same time providing an increase in heat transfer between the PCM and the PCM tank shell primarily through conduction (for solid-phase PCM), and in a combined manner through conduction and convection (for liquid-phase PCM). The transition state of the mixture during phase change melting is characterised by a transition from primary transfer through conduction to combined transfer. Within the conductive structure, melting occurs at its surface, which, from a heat transfer point of view, represents the formation of convective flow at the boundary layer. In cooling, the process is more complex due to the formation of a solid phase not only on the inner surface of the tank shell, but also on the surface of the structure towards the core. In view of the above, these processes are described by a set of cooling curves, which generally produce hysteresis.
When the samples were measured with PCM, a copper matrix was added to PCM due to its high thermal conductivity. The copper matrix had a mass of 36 g. The thermal capacity of the copper matrix was not considered in these measurements. In
Figure 12, the melting of pure PCM with the copper matrix is presented graphically. The thermocouple was placed in the paraffin core.
In the first part of
Figure 12, the curve of sensible heat (State A) is presented, which lasts for 715 s; then, at a temperature of 48.2 °C, the phase change transition (melting of the PCM in the core) starts in the second part of the graph with latent heat (image record State B). The end of the phase change occurs after the core melts at 52 °C at a time of 1215 s. In this case, the whole phase change takes 500 s. In the third part of the graph, the curve again shows the acceptance of sensible heat up to the time of the end of the measurement.
In the case of the measurement, the paraffin received the same amount of energy as the reference sample, namely 10,800 J of latent heat.
The measurement at
Figure 13 shows us the curve of latent heat transfer to the heat transfer medium over time. The solidification process of the PCM starts at a time of 260 s and a temperature of 53.5 °C. The temperature of the heat transfer medium at this point is 29.9 °C. The phase change ends at a temperature of 51.00 °C at a time of 1190 s. The heat transfer medium was heated to a temperature of 34.2 °C.
In total, the phase change took 930 s. As can be also observed here, the phase change consists of two parts. The latent heat part lasts for 505 s, and the mixed-phase part lasts for 425 s, which means that the latent heat part accounts for 54.30% of the total phase change time. During this period, the PCM heated the heat transfer medium from 29.9 °C to 33.0 °C, i.e., Δ = 3.1 °C. This can be calculated as follows:
The PCM supplied 5183.2 J to the heat transfer medium during the latent heat part of the phase change. During the mixed phase, the sample heated the heat transfer medium to a final temperature of 34.2 °C. In total, the two phases together heated the medium by 4.3 °C:
The total energy transferred was 7189.6 J.
Two thermocouples were used for the measurements in the experimental setup, one for measuring the temperature of the temperature of the heat transfer medium and the other for measuring the phase change of the sample located in the core. Therefore, the measured state may be different from the real state due to the non-uniform solidification of the PCM both on the surface and in the core.
3.5. Sample with Copper Spiral
When measuring the sample with PCM, a copper spiral was added to the sample. The copper spiral had a mass of 21 g. The heat capacity of the copper spiral in these measurements was not considered. The melting of pure PCM with the copper spiral is graphically presented in
Figure 14. The thermocouple was placed in the core of the sample. In the first part of the graph, the curve of sensible heat (State A) is presented, which lasts for 1430 s, and the second part of the graph starts at a temperature of 48.2 °C with the phase change transition (melting of PCM in the core) or the acceptance of energy in the form of latent heat (image record State B). The end of the phase change occurs after the core melts at 52 °C at a time of 1630 s. This means that the whole phase change process took 200 s. The latent energy received was 10,800 J.
The
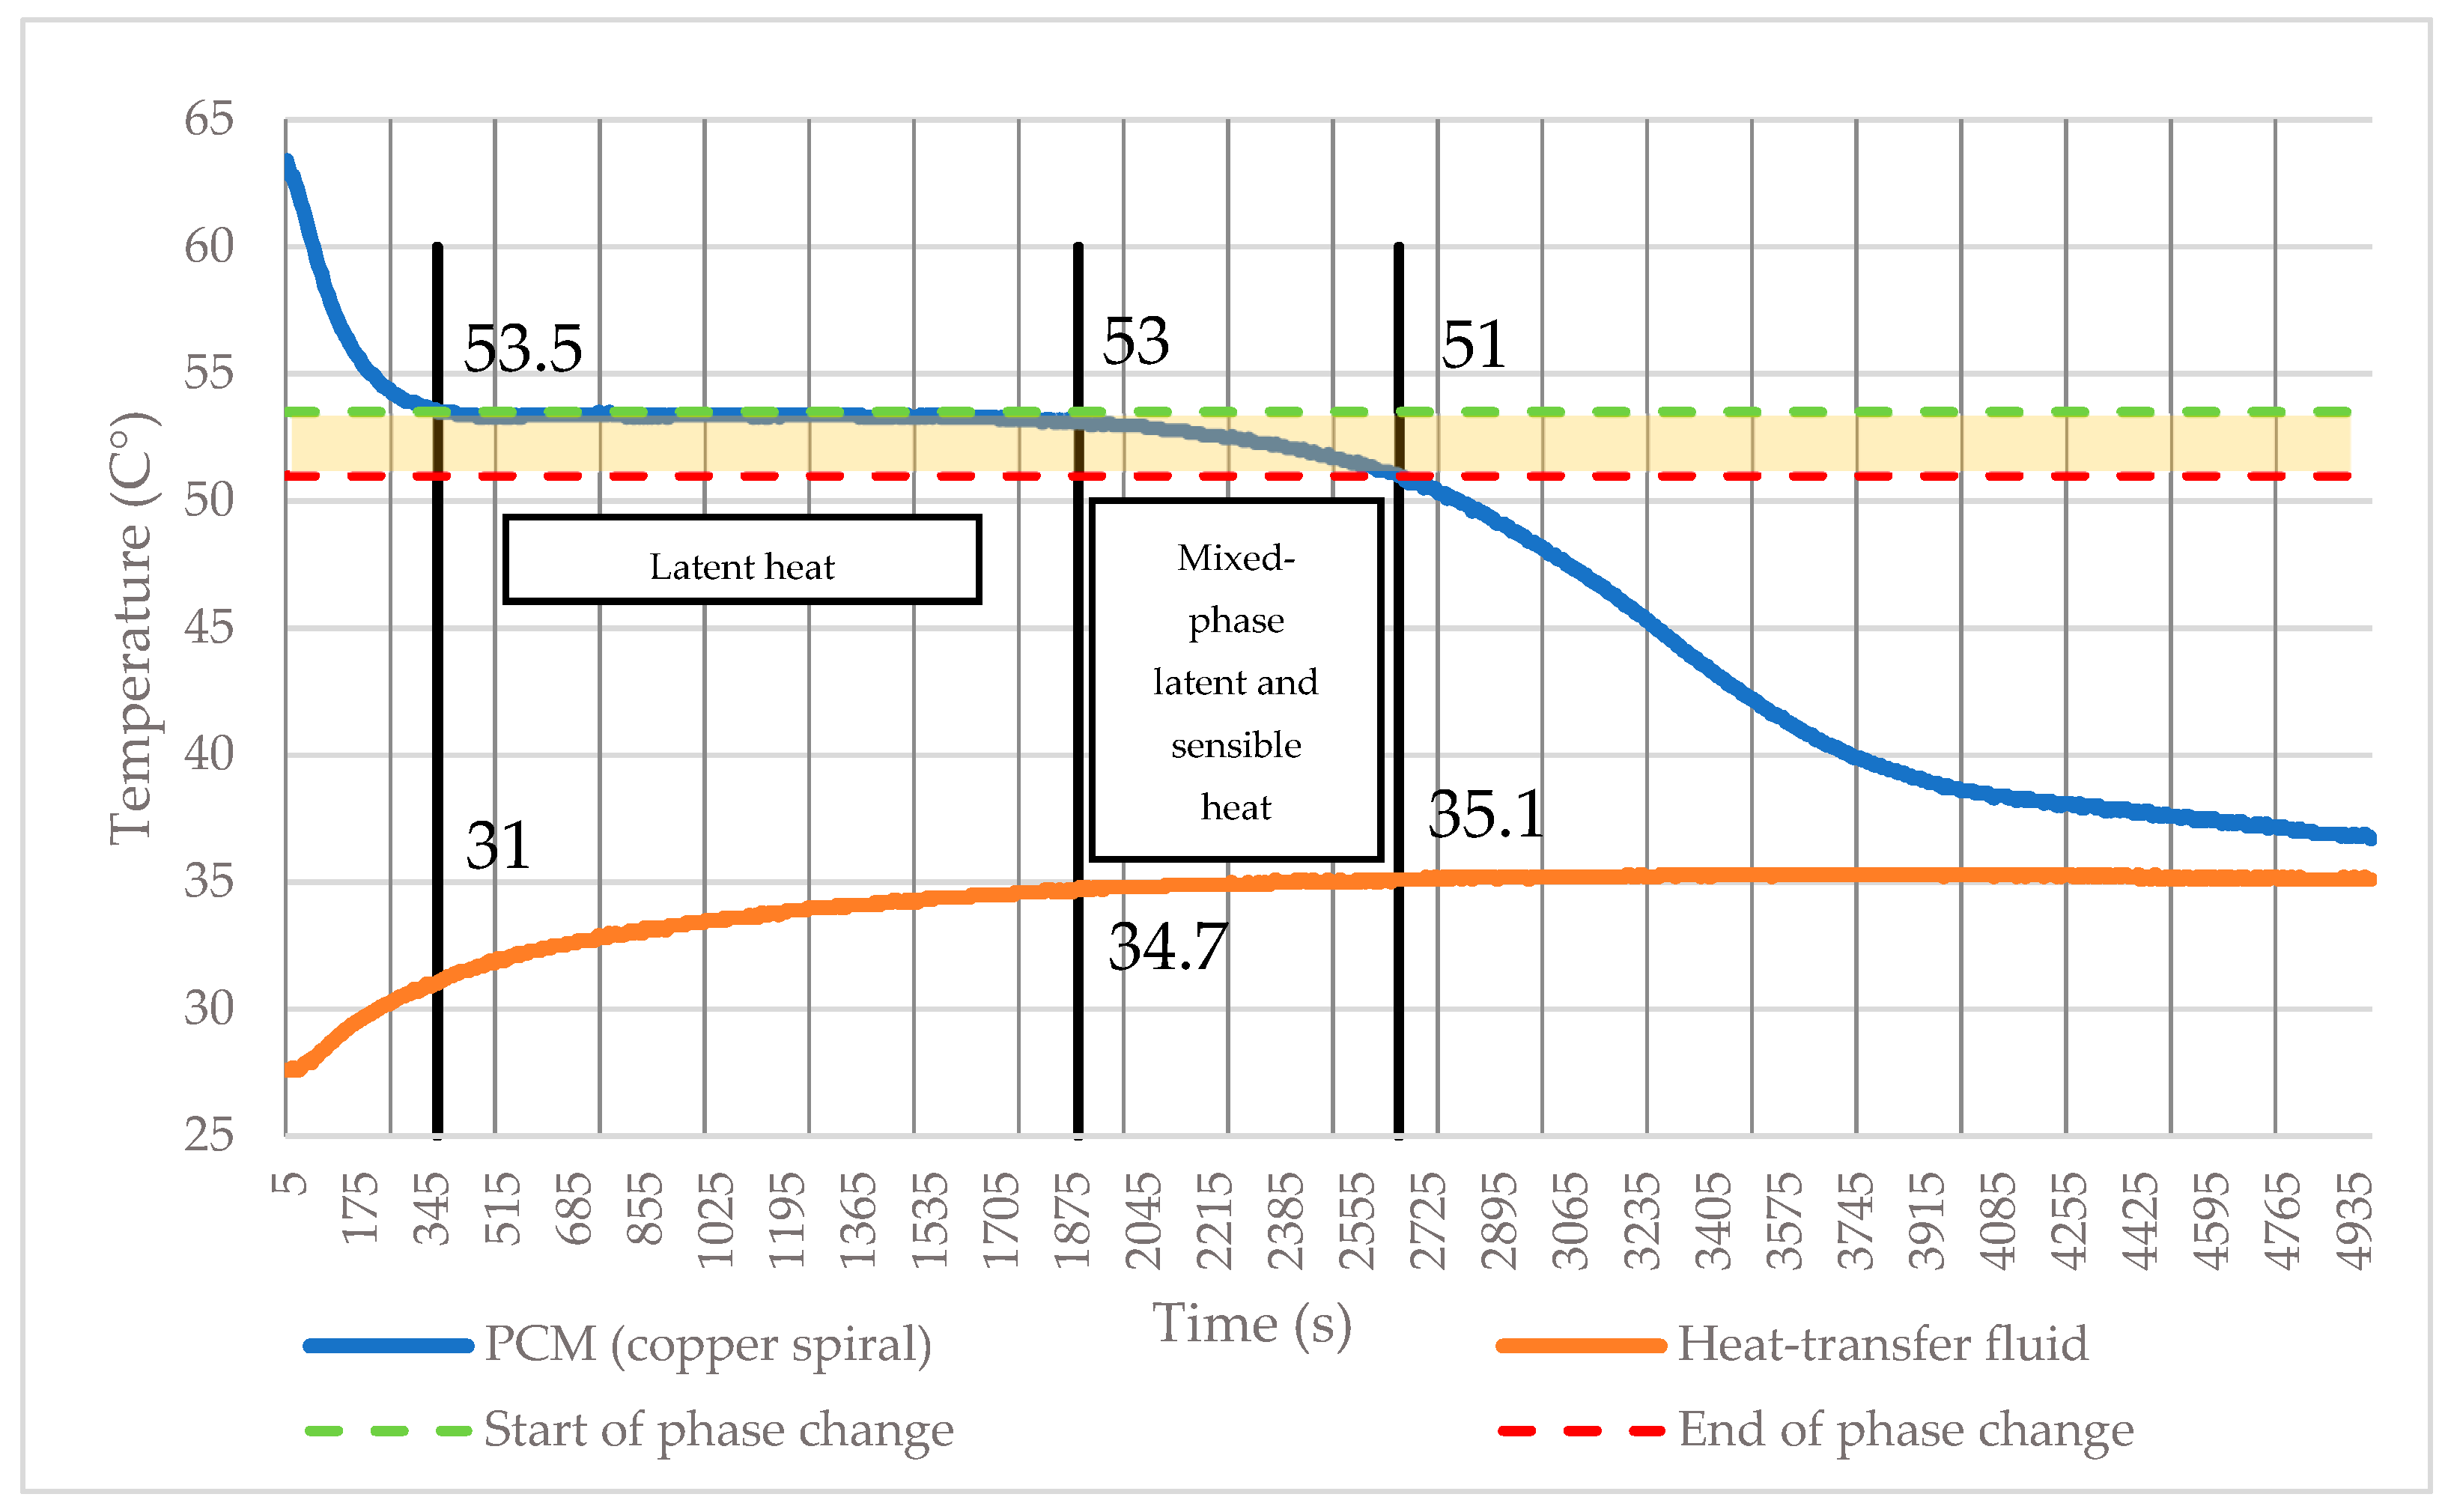
Figure 15 shows the curve of latent heat transfer to the heat transfer medium over time. The solidification process of the PCM starts at a time of 365 s and a temperature of 53.5 °C. The temperature of the heat transfer medium at this point is 31.0 °C. The phase change ends at a temperature of 51.00 °C at a time of 2660 s. The heat transfer medium was heated to a temperature of 35.1 °C. In total, the phase change lasted 2295 s. The latent heat portion lasts 1555 s and the mixed-phase portion lasts 740 s, which means that the latent heat portion accounts for 67.75% of the total phase change time. During this section, the PCM heated the heat transfer medium from 31.0 °C to 34.7 °C, i.e., Δt = 3.7 °C. This can be calculated as follows:
The PCM supplied 6186.4 J to the heat transfer medium during the phase change in the latent heat part, 6186.4 J. During the mixed phase, the sample heated the heat transfer medium to a final temperature of 35.1 °C. In total, the two phases together heated the medium by 4.1 °C:
The total energy transferred was 6855.2 J.
Two thermocouples were used for measurements in the experimental setup—one for measuring the temperature of the heat transfer medium and the other for measuring the phase change of the sample located in the core. Therefore, the measured state may be different from the real state due to the uneven solidification of the PCM both on the surface and in the core.
3.6. Sample with Twisted Matrix
The steel matrix, despite having lower thermal conductivity than copper, was chosen because of its dense, twisted structure that transmits temperature throughout the sample volume.
In the measurement of the sample, the steel twisted matrix was added to the PCM. The steel twisted matrix had a mass of 6 g. The heat capacity of the steel twisted matrix was not considered in these measurements. In
Figure 16, the graphical progression of the melting of pure PCM with the steel twisted matrix is presented. The thermocouple was placed in the core of the sample. In the first part of the graph, the curve of sensible heat acceptance (State A) is visible, which lasts for 915 s. Then, at a temperature of 48.2 °C, the second part of the graph starts with a phase change transition (melting of the PCM in the core) or the acceptance of energy in the form of latent heat (image record State B). The end of the phase change occurs after the core melts at 52 °C at a time of 1575 s. This means that the whole phase change process took 660 s. The latent energy received was 10,800 J.
The solidification process at
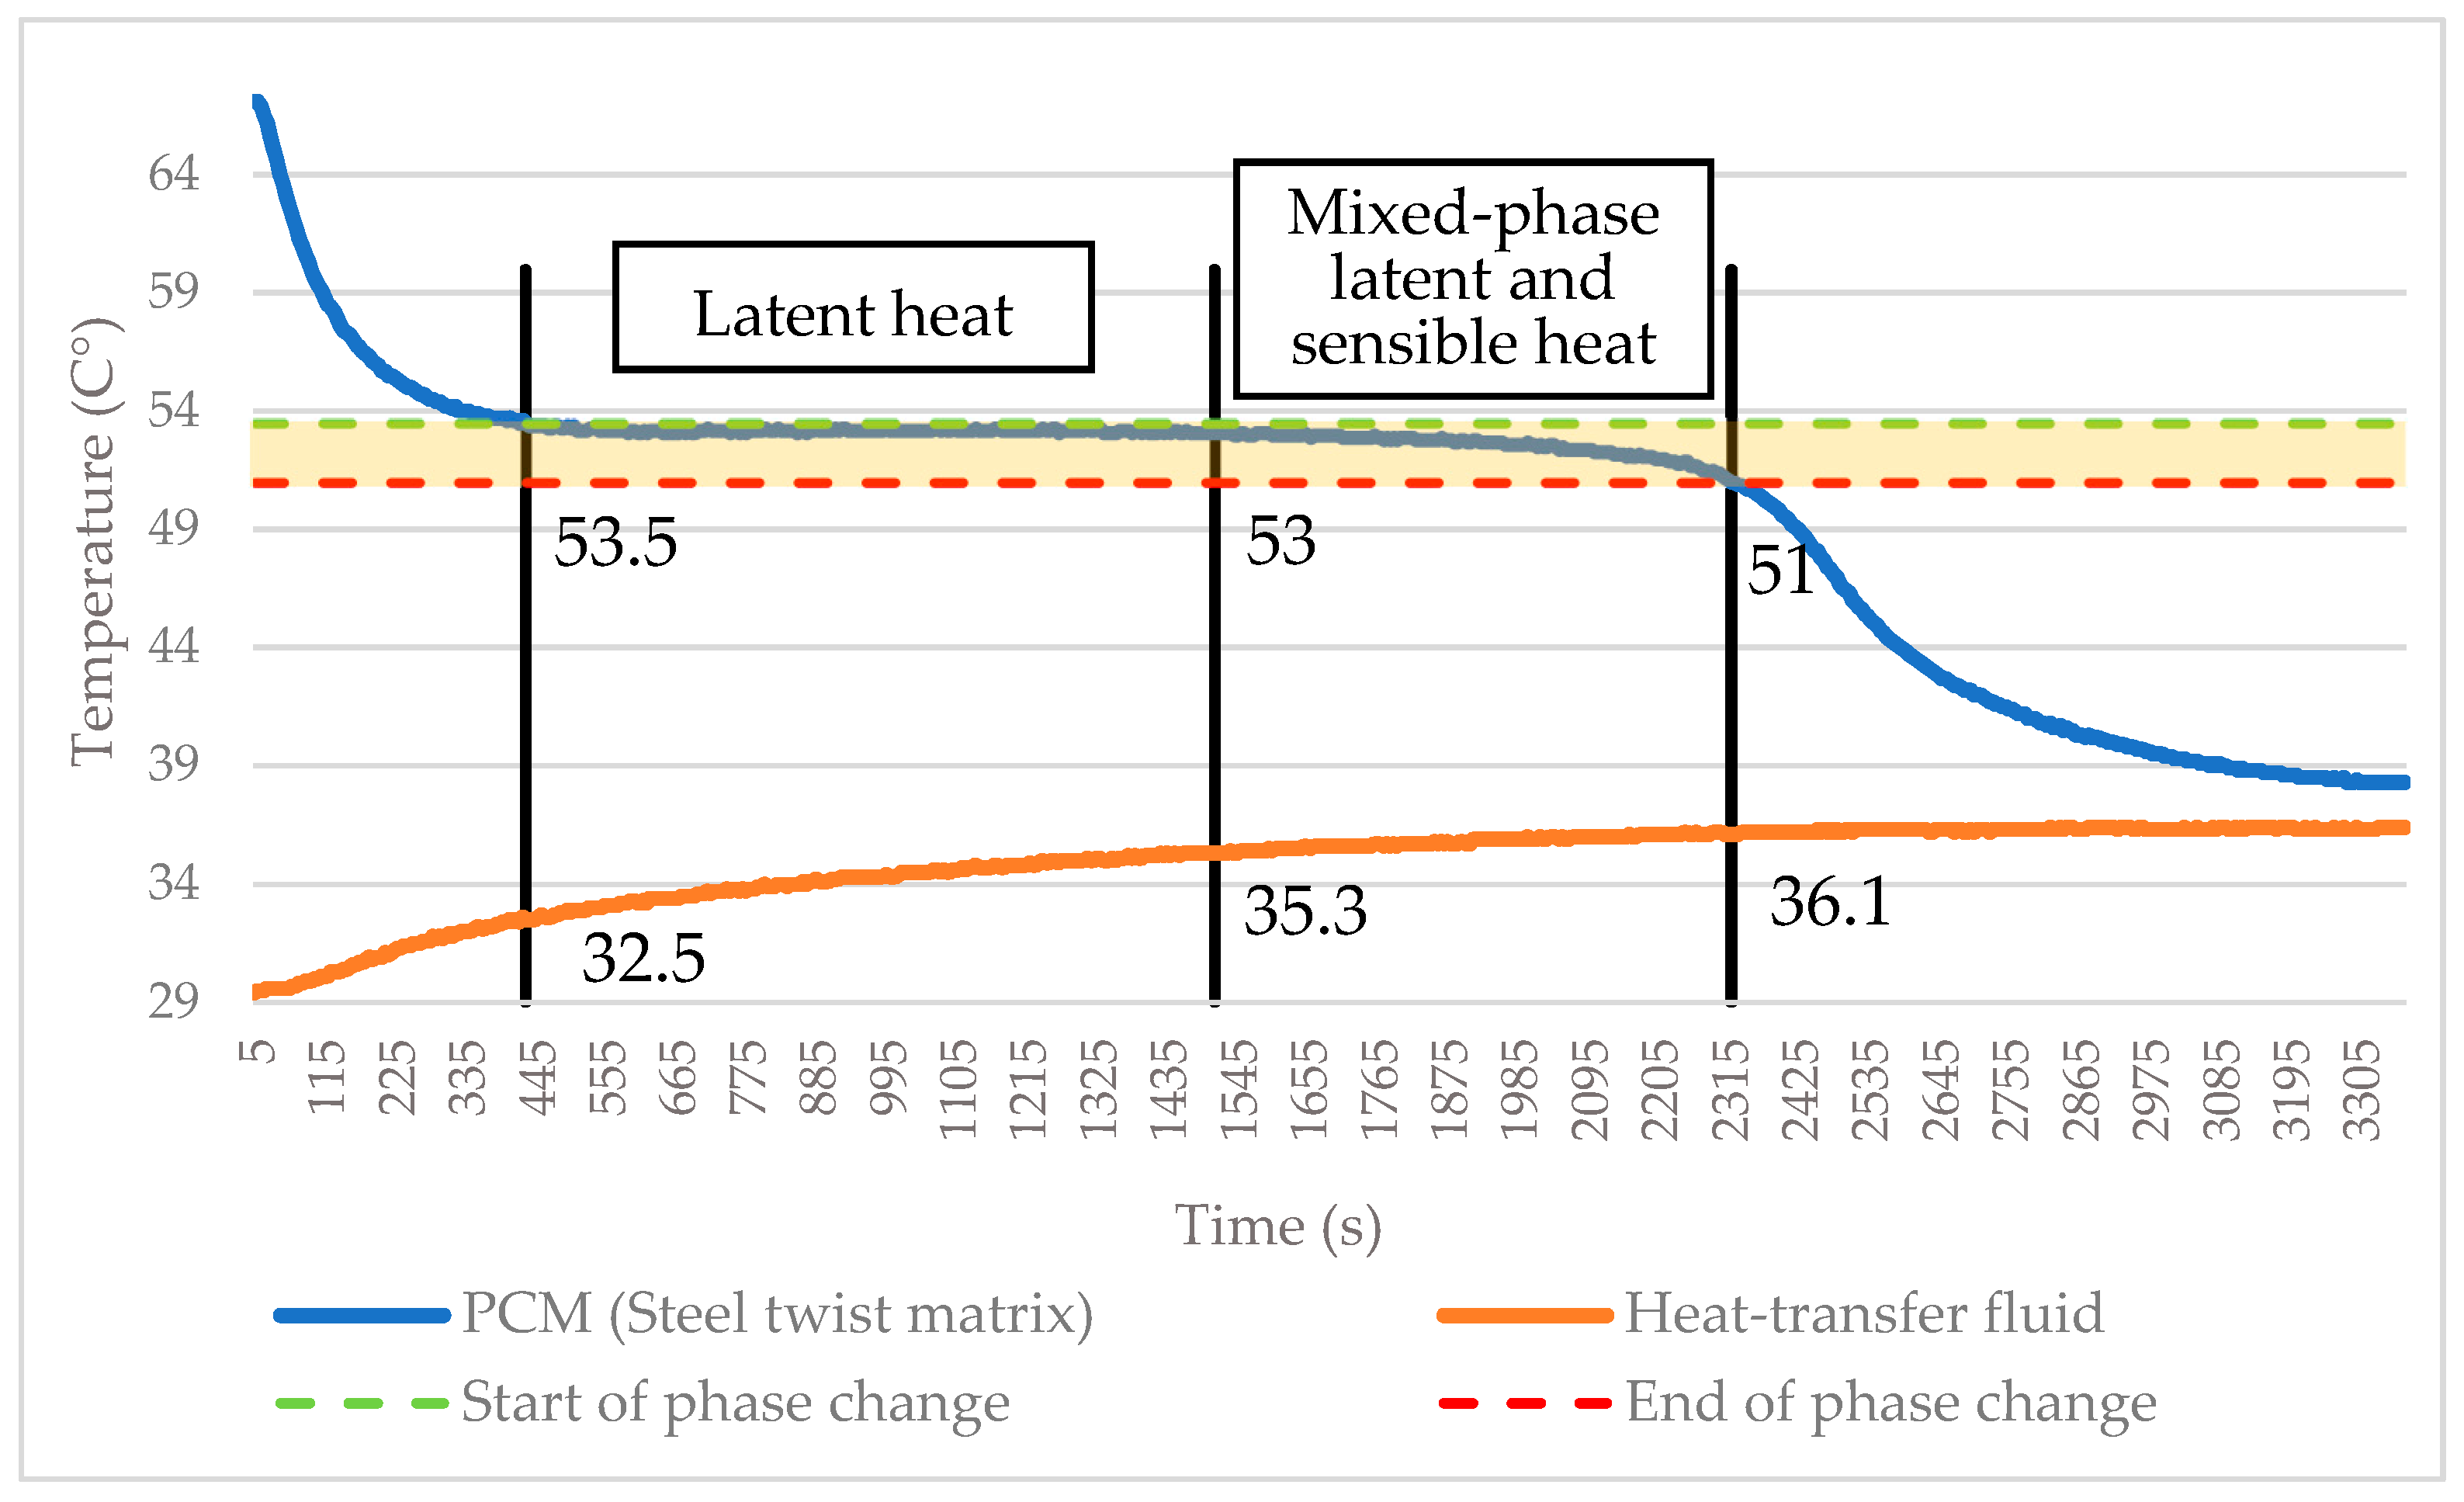
Figure 17 of PCM starts at a time of 430 s and a temperature of 53.5 °C. The temperature of the heat transfer medium at this point is 32.5 °C. The phase change ends at a temperature of 51.00 °C at a time of 2320 s. The heat transfer medium was heated to a temperature of 36.1 °C.
In total, the phase change took 1890 s. The latent heat part took 1110 s and the mixed-phase part took 780 s, which means that the latent heat part accounts for 58.73% of the total phase change time. During this section, the PCM heated the heat transfer medium from 32.5 °C to 35.3 °C, i.e., Δt = 2.8 °C. This can be calculated as follows:
During the phase change in the latent heat part, the PCM supplied 4681.6 J to the heat transfer medium. During the mixed phase, the sample heated the heat transfer medium to a final temperature of 36.1 °C. In total, the two phases together heated the medium by 3.6 °C:
The total energy transferred was 6019.2 J.
Two thermocouples were used for the measurements in the experimental setup, one for measuring the temperature of the heat transfer medium and the other for measuring the phase change of the sample located in the core. Therefore, the measured state may be different from the real state due to the non-uniform solidification of the PCM both on the surface and in the core.
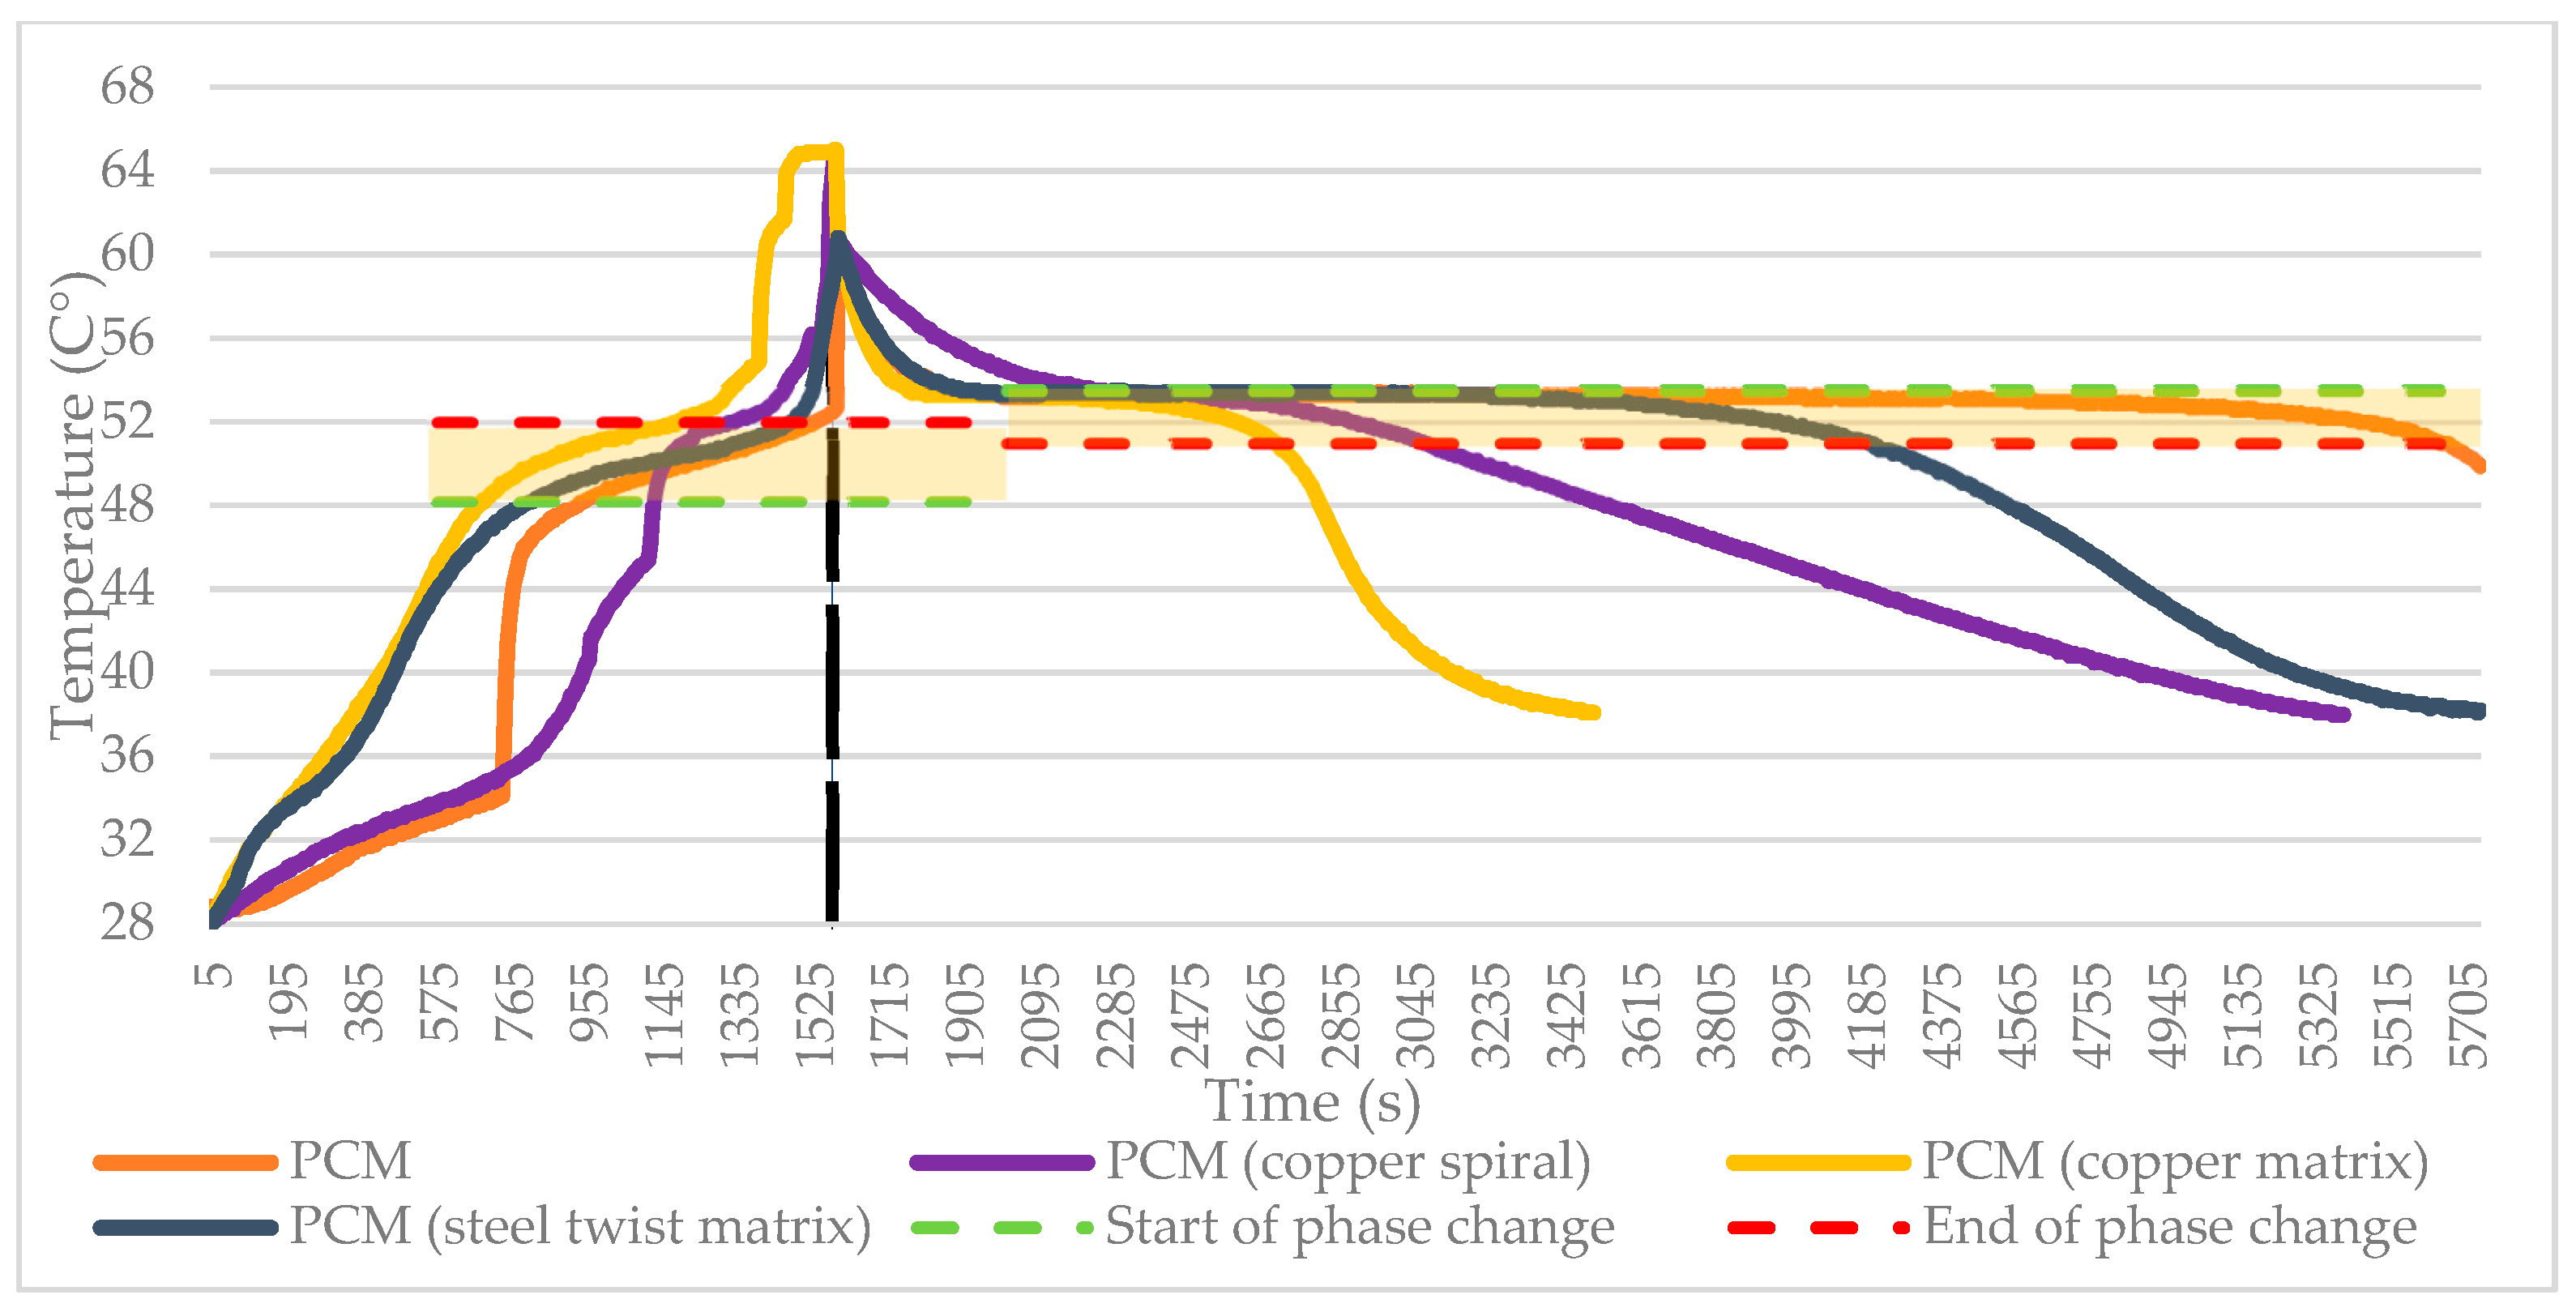
3.7. Comparison of Sample-Charging Rates
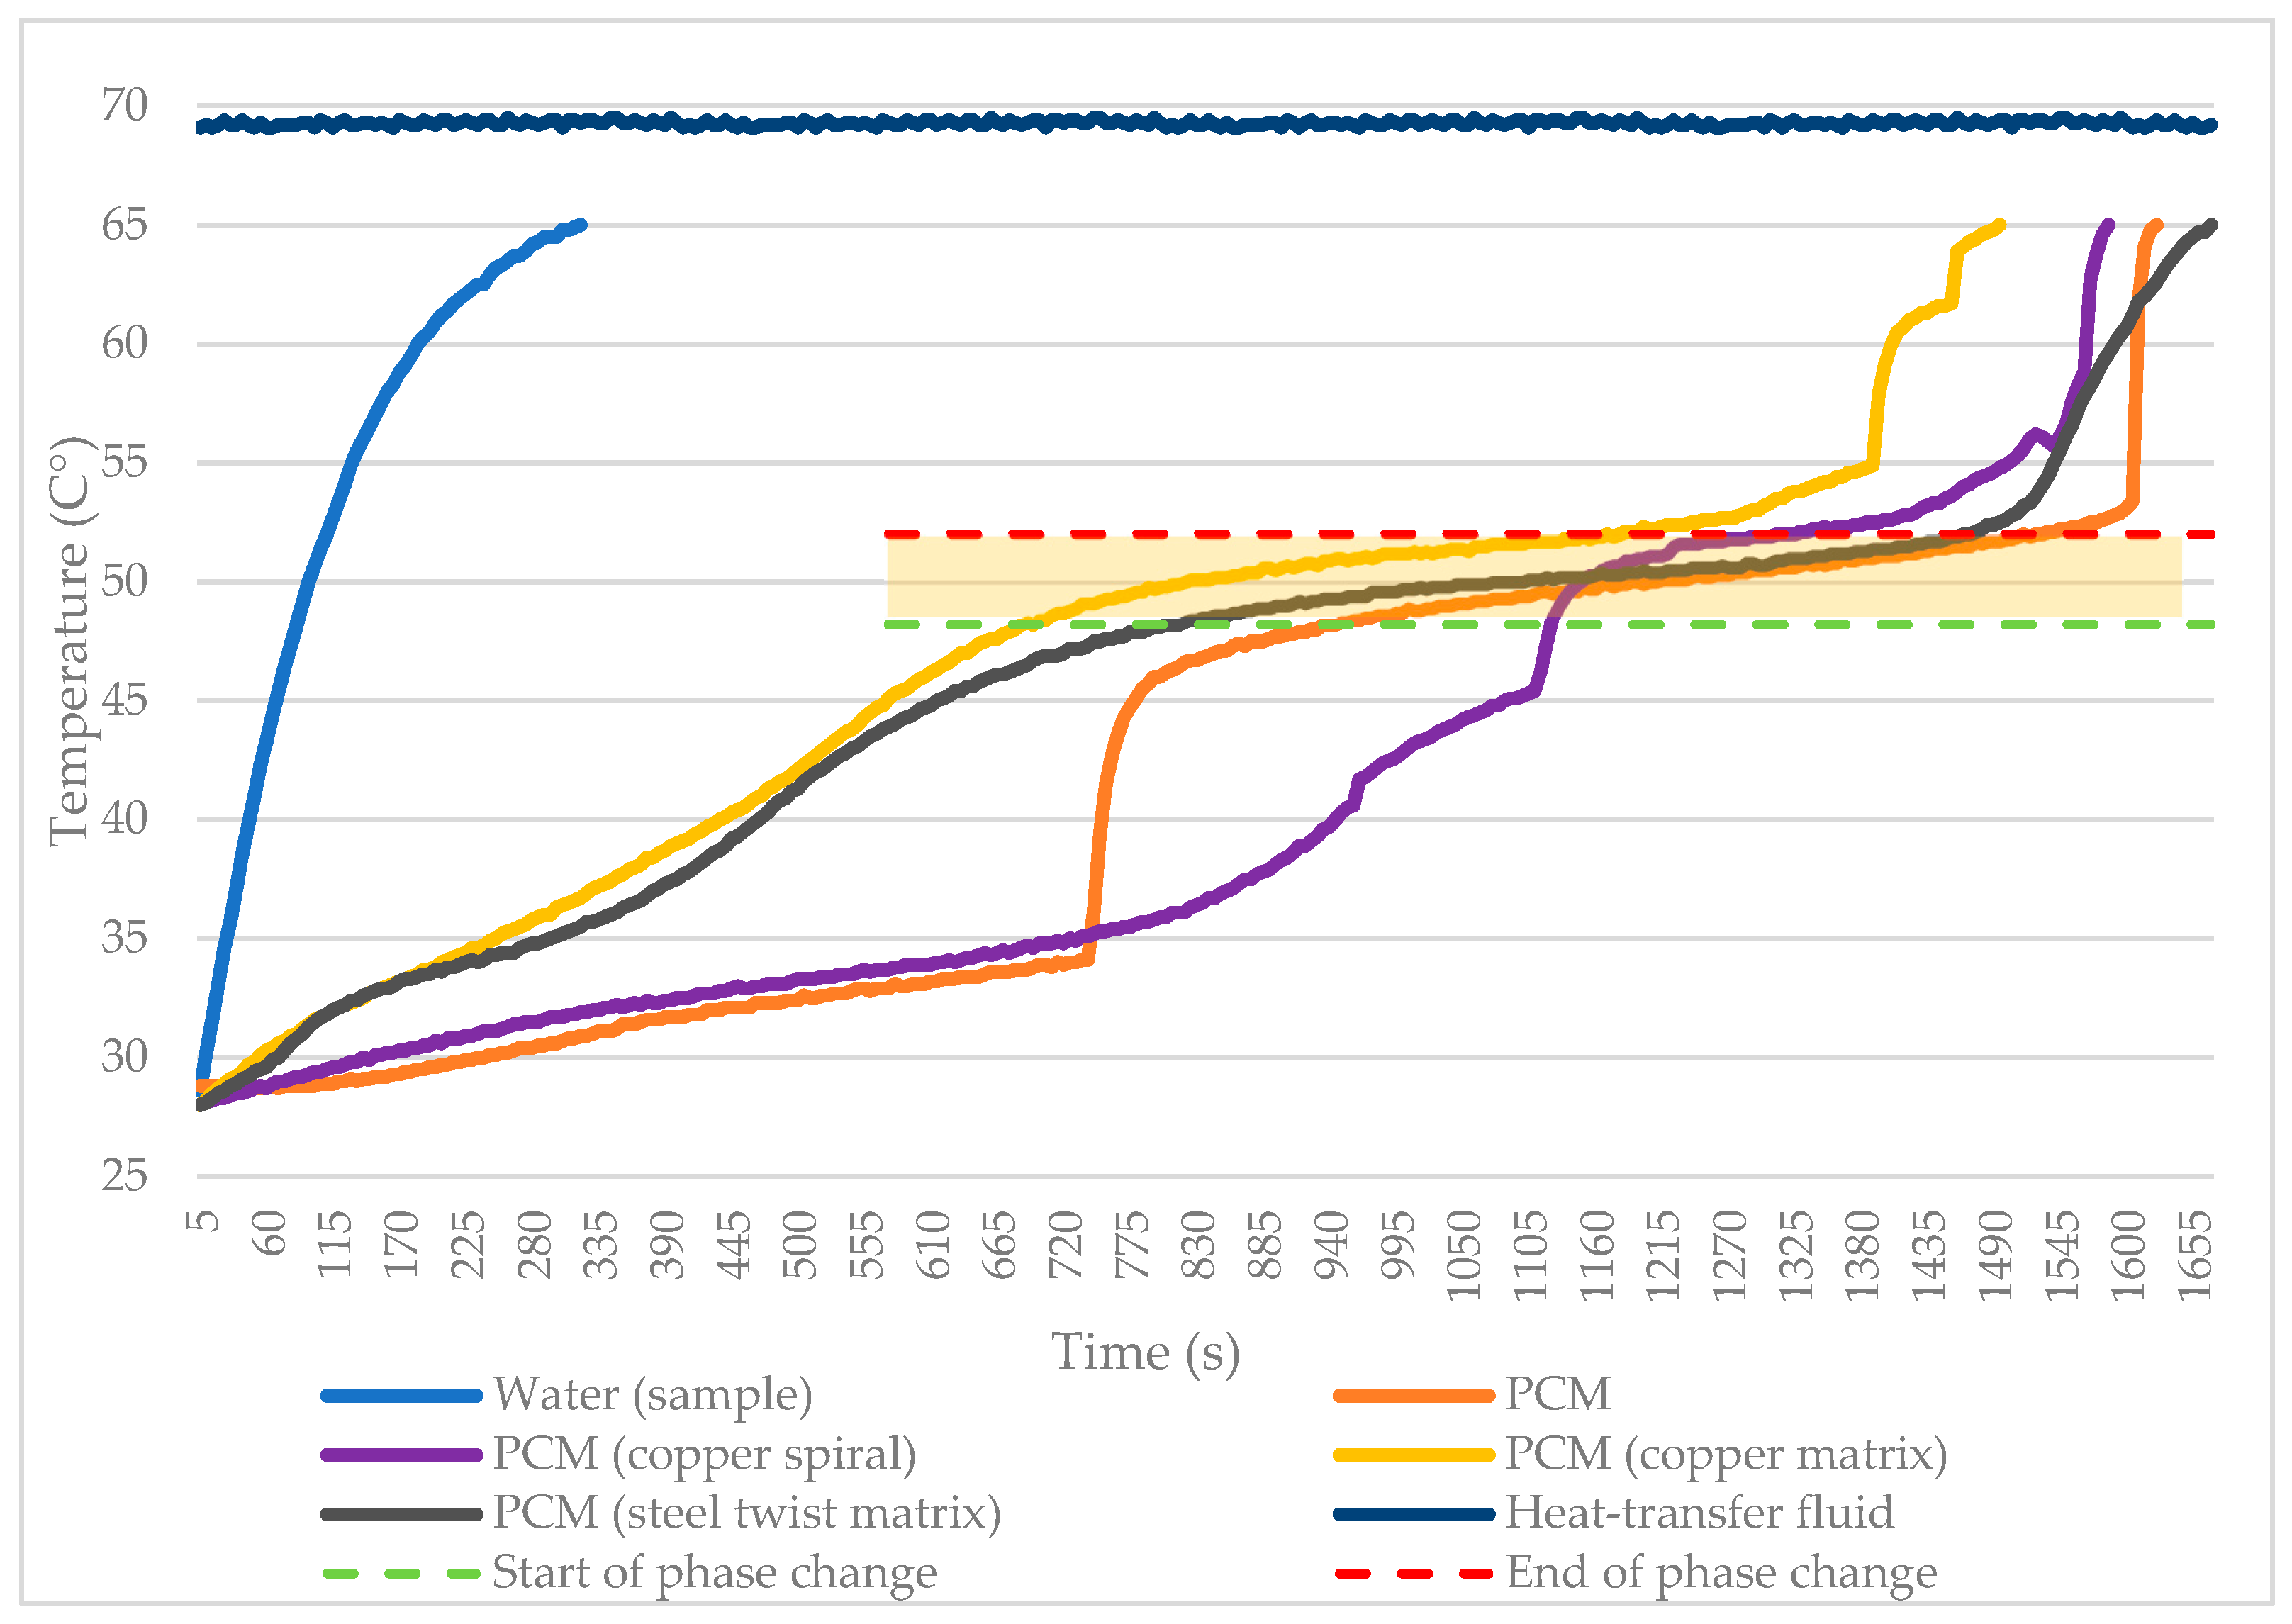
Figure 18 shows a comparison of the sample-charging rates. The reference measurement was a PCM sample that did not contain any components to increase thermal conductivity. The total phase change time is 590 s. The steel twisted matrix curve melted the PCM in a time of 660 s. Compared to the reference sample, this time is 11.86% longer but, at the same time, the total charging time along with the sensible heat is 3.3% shorter after the end of the phase change process. The PCM curve (copper spiral) shows a longer charging time for sensible heat but, at the same time, the time required to go through the phase change is significantly lower at 200 s. Compared to the reference sample, this is a significant acceleration of 66.1%. The total time even with sensible heat is 14.1% shorter, which means that the copper spiral transfers heat more efficiently.
The PCM (copper matrix) achieves a transition time of 500 s, which means an acceleration of 15.25% compared to the reference sample. Compared to the PCM with a copper spiral, this acceleration is not as efficient, but the overall time is significantly different, specifically, by 22.62% compared to the reference sample. It is obvious that the copper matrix can work even more efficiently than the copper spiral. The higher content of the embedded copper element does not always guarantee a faster phase change transition, but due to the acceleration of the overall charging (sensible + latent), this phenomenon can be ignored.
3.8. Comparison of Sample-Discharging Rates
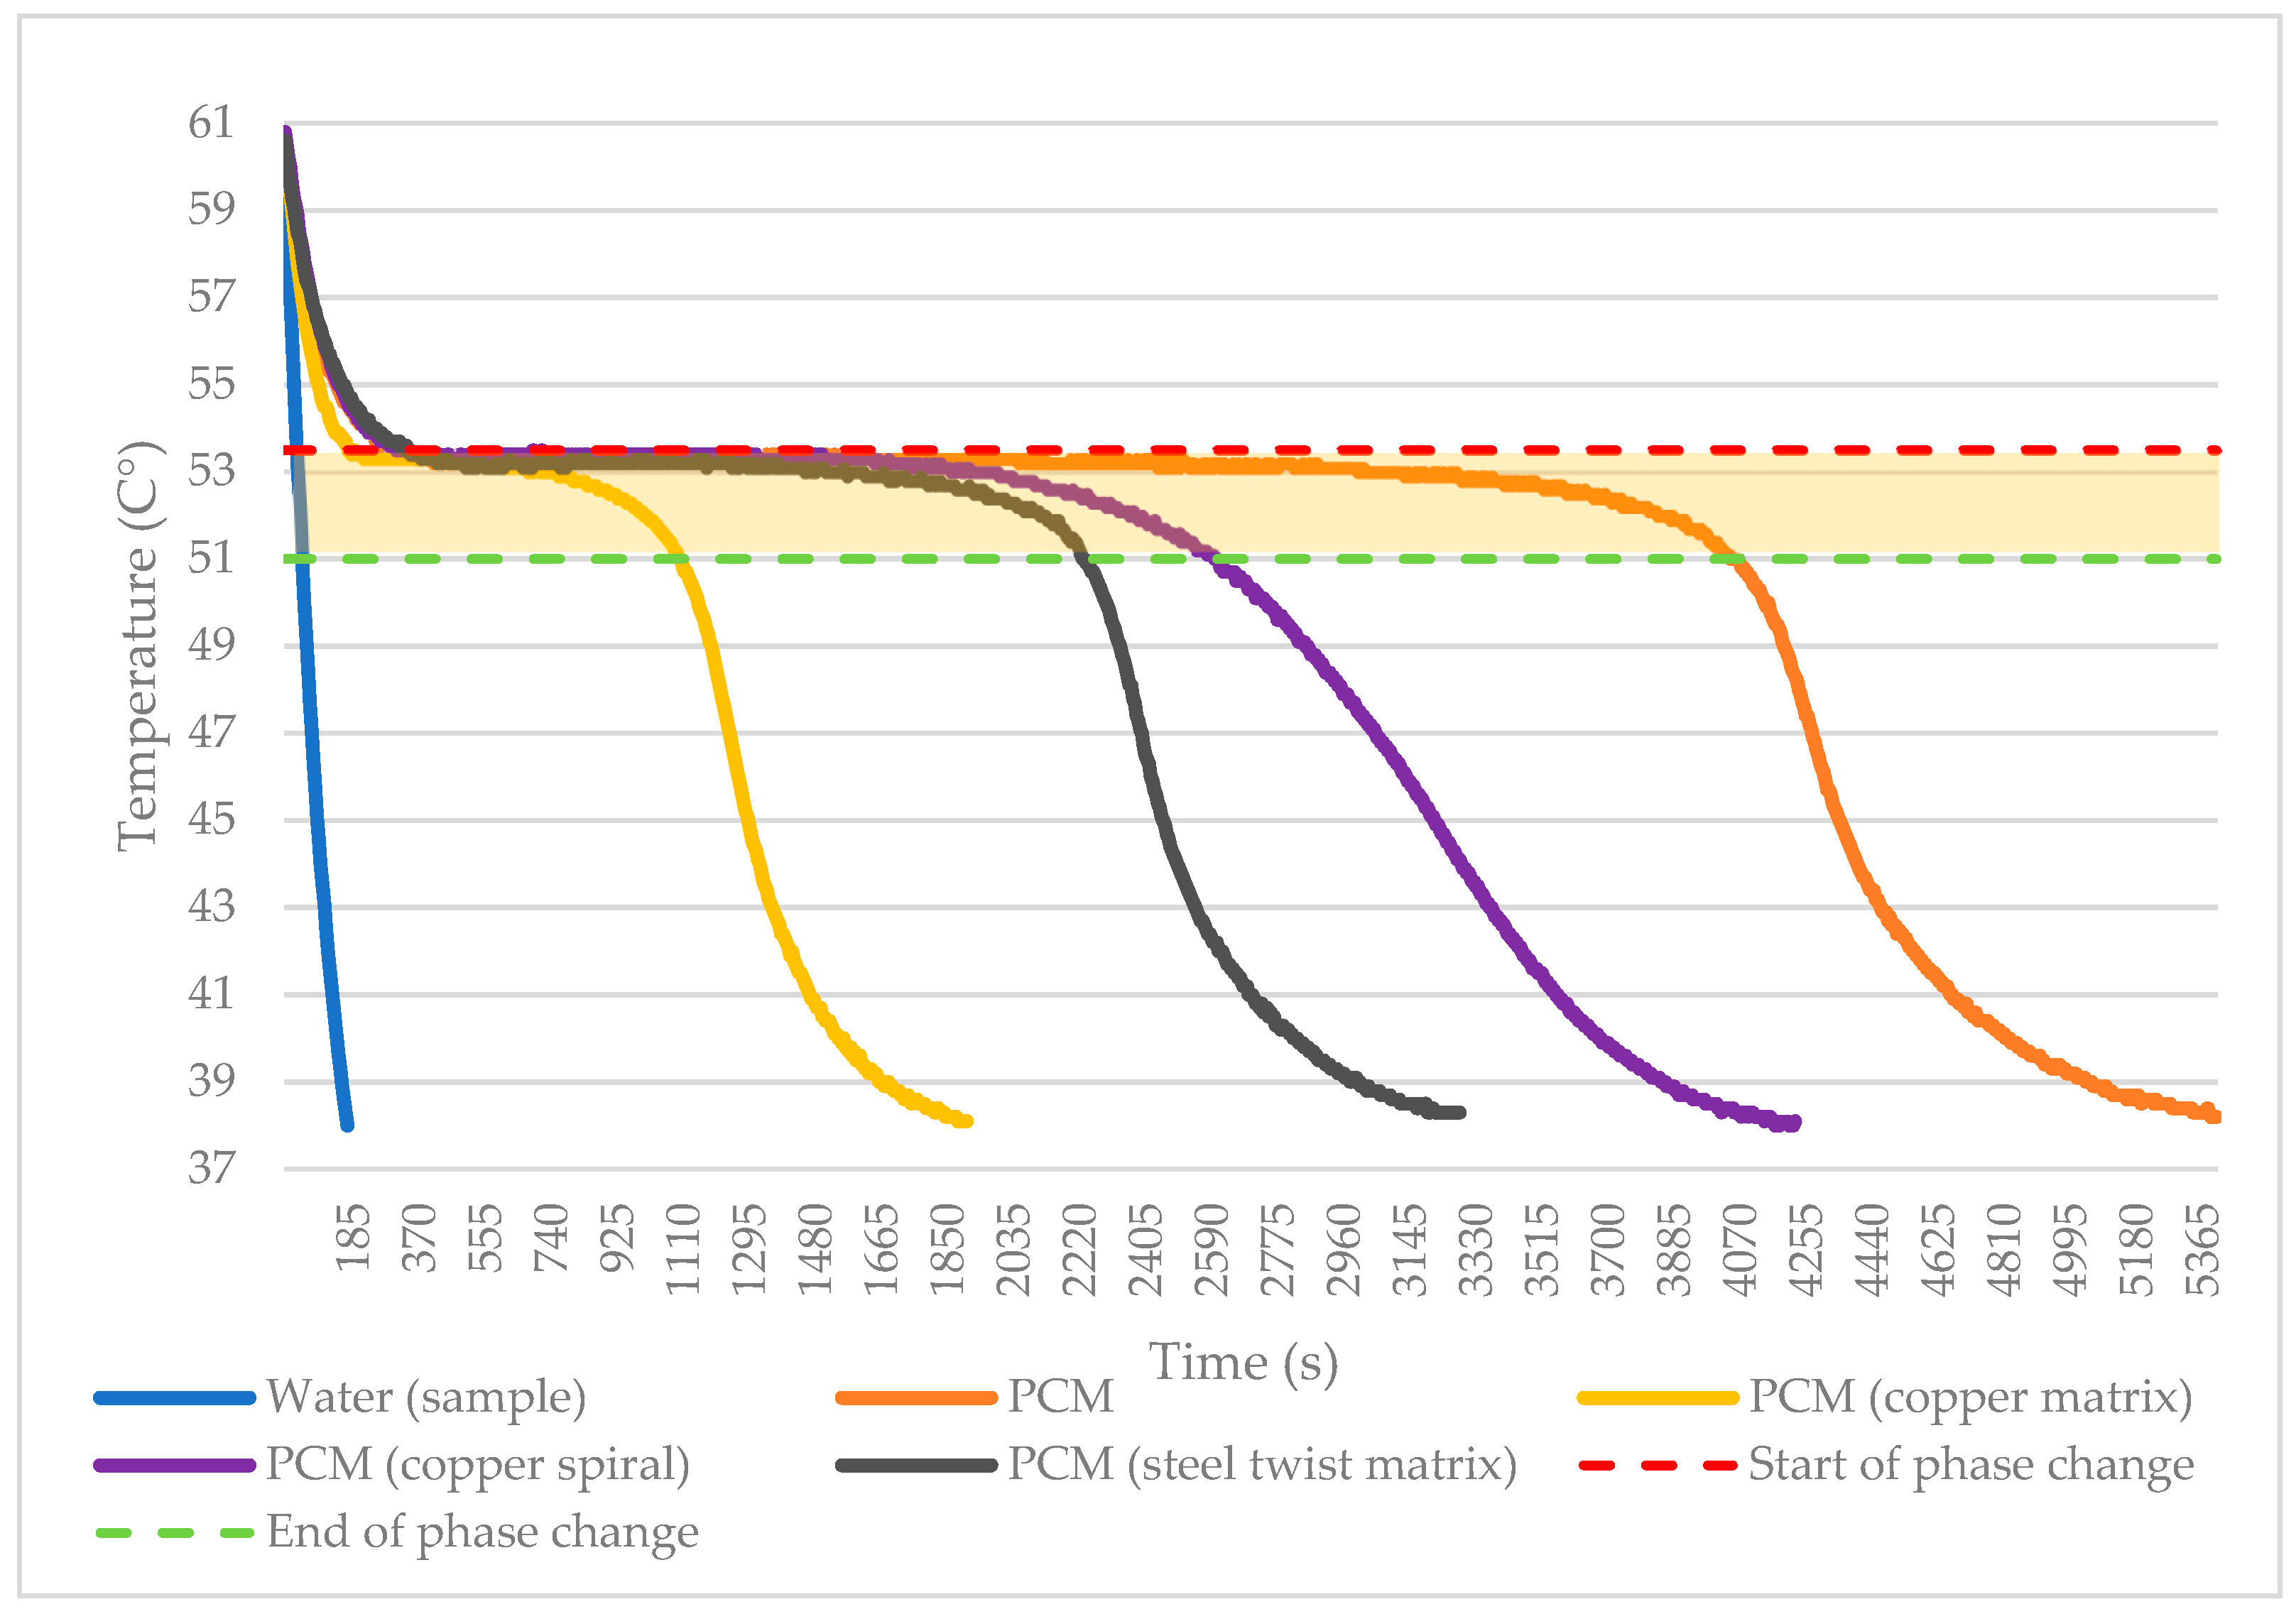
Figure 19 shows the energy transfer rate waveforms of each sample. The reference measurement of the pure PCM sample shows that the phase change time (solidification process) that takes place from 53.5 °C to 51 °C has a sample time of 3740 s.
The PCM with the copper spiral achieved a phase change time of 2295 s. The sample achieved an increase in phase change acceleration of 38.6% compared to the reference measurement.
The PCM with the steel twisted matrix had a time of 1890 s. This shows that the phase change was faster compared to the reference sample by 49.46% and faster by 17.65% compared to the copper spiral.
The PCM with the copper matrix showed promising results during the solidification process. Its time was 930 s, which means 75.13% acceleration compared to the reference sample. Compared to the steel twisted matrix, this difference is 50.79%, indicating that this method is relatively efficient and applicable for practical use.
A summary of the results in terms of increasing the transfer of latent heat energy from the PCM to the heat transfer fluid is shown in
Table 2.
3.9. Interfacial Interaction of Metal Structures and PCM
During the calorimetric experiments, different metal structures were added to the sample with pure PCM; details of the characteristics, such as weight, volume, heat exchange surface and ratio of percentage volume to PCM volume, are shown in
Table 3.
The data in the table clearly show the great influence of metal structures on thermal conductivity and heat transfer even at low volume ratios from 2.7% in the case of the steel twisted matrix to 6.1% in the case of the copper matrix. At the same time, the most important factor in comparing the techniques is the heat exchange surface, as it can be seen in the graphs above that the copper matrix shows the best results, even though according to the data from
Table 3, compared to the steel twisted matrix, the copper matrix has an area of only 33% of the area of the steel twisted matrix.
In the case of our experiments, the amount of sensible heat in copper is insignificant. In the case of the copper matrix, during the experiment, during the heating of the PCM from 25 °C to 53 °C (this range should be taken into account), with a specific heat capacity of copper of 385 J/Kg and a copper matrix weight of 36 g, the whole amount of energy is 388.08 J, which is 5.4% of the total heat released by the PCM. When calculated only during the phase change (53.5 °C–51 °C), this value is only 36.45 J and, or 0.67%.
3.10. Hysteresis Curves of Measurements
In the measurements of the pure PCM sample, the hysteresis is not clearly visible; in fact, it is minimal, due to differences in the charging and discharging process. During charging, the dynamic itself is relatively high, which is due to the transition of the PCM from the solid to the liquid phase, while the internal heat transfer improves with an increase in the liquid fraction. In the discharge process, the curve reaches an ideal level where there is almost no temperature drop in the PCM during the phase change. However, it is necessary to note that the process is exceptionally slow and inefficient from the point of view of the time course. The gradual transition to the solid phase on the PCM-HTF contact surface results in a decrease in the thermal conductivity, resulting in a decrease in the ability to transfer heat efficiently. The experimental results are shown in
Figure 20.
Figure 21 shows the application of the volumetric structure on the base of the copper matrix (0.0006 m × 0.0085 m). The result in the charging process is only a slight change in the curve, and this is in the final phase where a significant amount of solid material changes phase to liquid in a short time. During discharge, there is a significant improvement in dynamics and a reduction in the total time compared to pure PCM of up to 75%. Such an improvement in the dynamics allows the use of latent heat for application in the reservoir due to the acceleration of the energy release in a sufficient time range.
As shown in
Figure 22, the copper spiral only slightly improves the dynamics of the process during the extraction of energy, while it is possible to observe a comparable process in the case of pure PCM. During the charging process it is possible to observe the influence of the location of the spiral, which is cross-sectionally on the inner radius of the beaker, and it is possible to confirm the theoretical conclusions from the point of view of the theory of boundary formation, which, in this case, is significantly influenced. There is a significant improvement in the heat transfer between the wall area of the beaker and the surface layer of the PCM, but this effect disappears in the core itself and standard sweating occurs.
In
Figure 23 is presented a waveform with the application of a volumetric structure represented by a thin-walled spatial structure in the whole volume with flat metallic fibers (0.0001 m × 0.00045 m). There are no significant changes in the charging process, similar to the case of pure PCM and PCM–copper spiral. In the discharge process, there is a significant shortening of time, which is demonstrated as an effective improvement in the heat transfer dynamics in the entire volume, even after the transition of the surface contact layer to the solid phase.
3.11. Measurement of the Experimental Hybrid Tank of Water–Pure PCM
A cylindrical accumulation tank (heat transfer medium reservoir) made of low-alloy ferritic–pearlitic steel (steel grade 13—Cr-Ni-V) was used for the measurements (
Figure 24a). The volume of the tank was 30 l and the dimensions were a diameter of 320 mm and a height of 420 mm. The tank was insulated with two layers of glass wool. The heating of the heat transfer medium was provided by an electric coil with an input of 1000 W. A heat exchanger (radiator) with an output of 800 W was chosen as the load. The tank was filled to 25 L as there was a smaller tank with PCM inside.
A smaller cylindrical tank with a capacity of 5 l served as a reservoir with the PCM for energy storage. The tank was also made of low-alloy ferritic–pearlitic steel of grade 13 (Cr-Ni-V). The dimensions of the vessel were a diameter of 160 mm and a height of 250 mm. The vessel material had a thermal conductivity of λ = 80 W/m·K. The container contained 3.7 kg of paraffin, which, based on its density, corresponds to 5 liters, while the percentage of the copper matrix to PCM volume was 1.3%.
A total of 12 thermocouples were used in the measurement tanks, 3 of which were used to measure the temperatures in the storage tank with the heat transfer medium and 9 of which were used to measure the temperatures in the PCM tank. The locations of the thermocouples in the vessels are shown in
Figure 24b. A cylindrical system was chosen as the method of thermocouple placement.
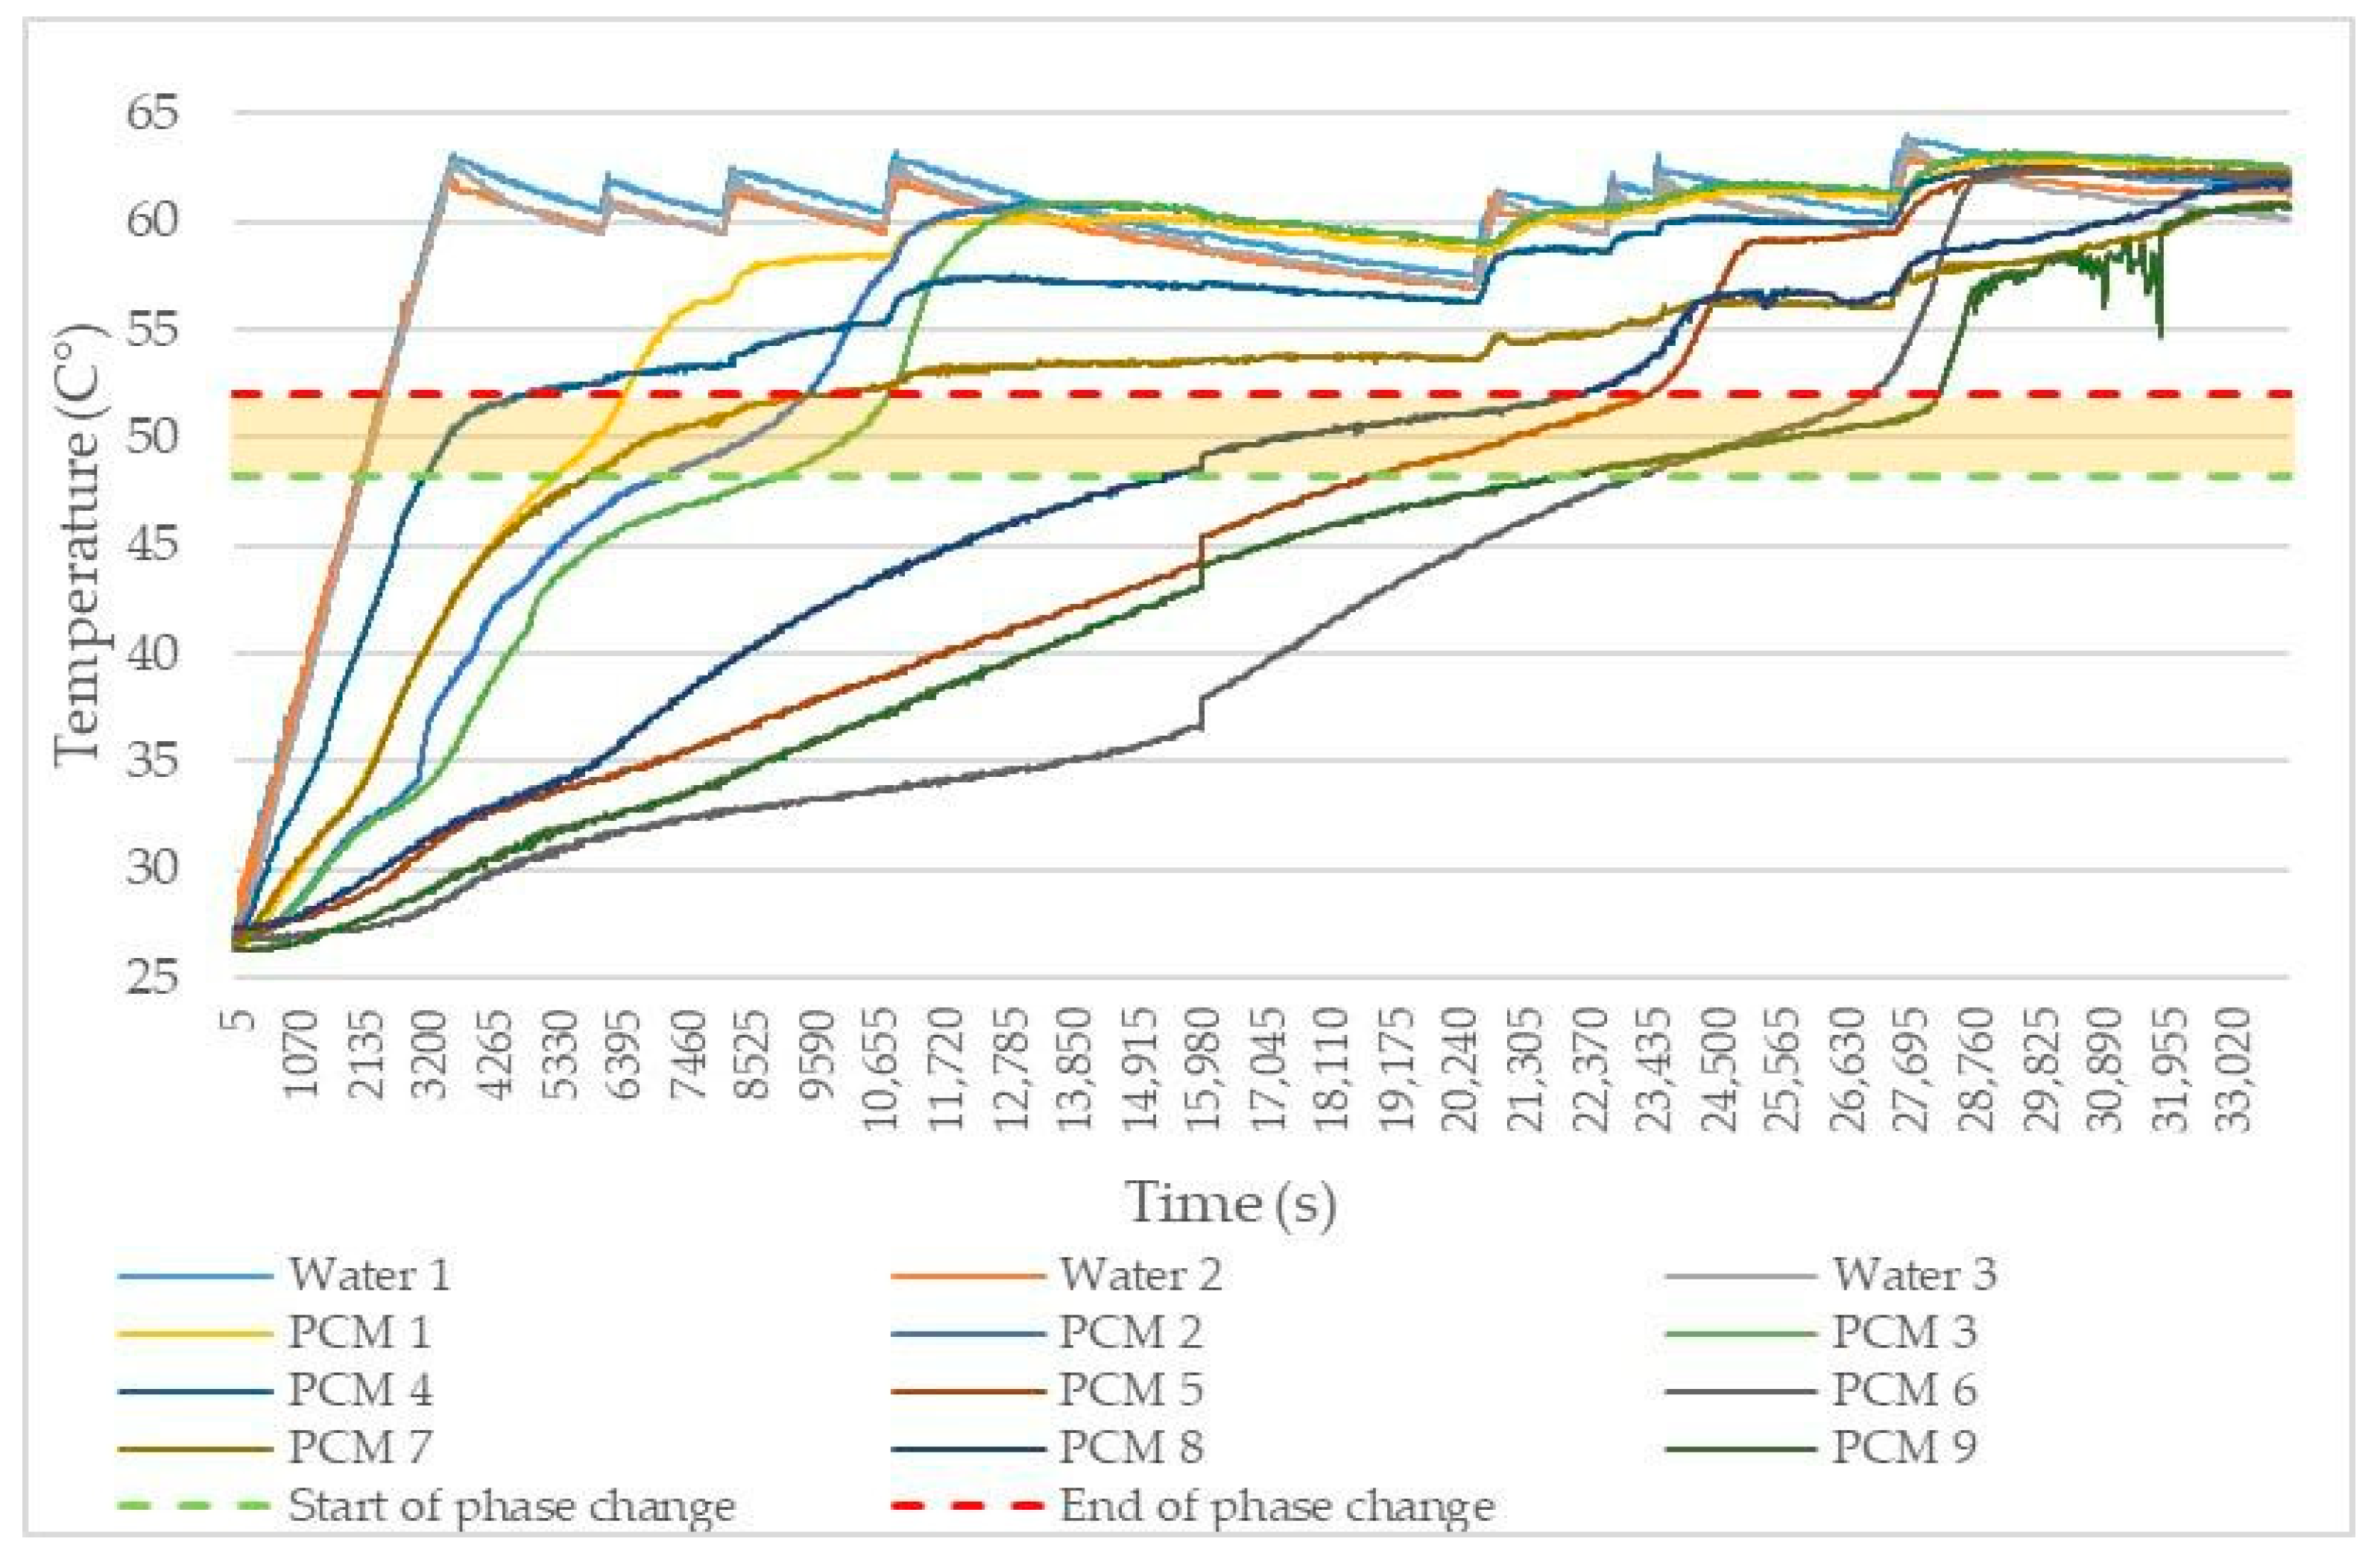
Figure 25 shows the charging process of the water and PCM tank. The phase change starts at 3155 s at the part where the PCM4 thermocouple is located. Gradually the phase change passes from the shell of the tank to the core of the tank. From the graph, the heat transfer dissipation between HTF and the paraffin shell and core is clearly visible; this is due to the low thermal conductivity, especially in the semi-solid phase.
The total time to melt the entire 3.7 kg of PCM is 28,185 s. The end of the phase change occurs in the core of the tank with the PCM9 thermocouple. It is evident from
Figure 25 that the charging is non-uniform throughout the volume.
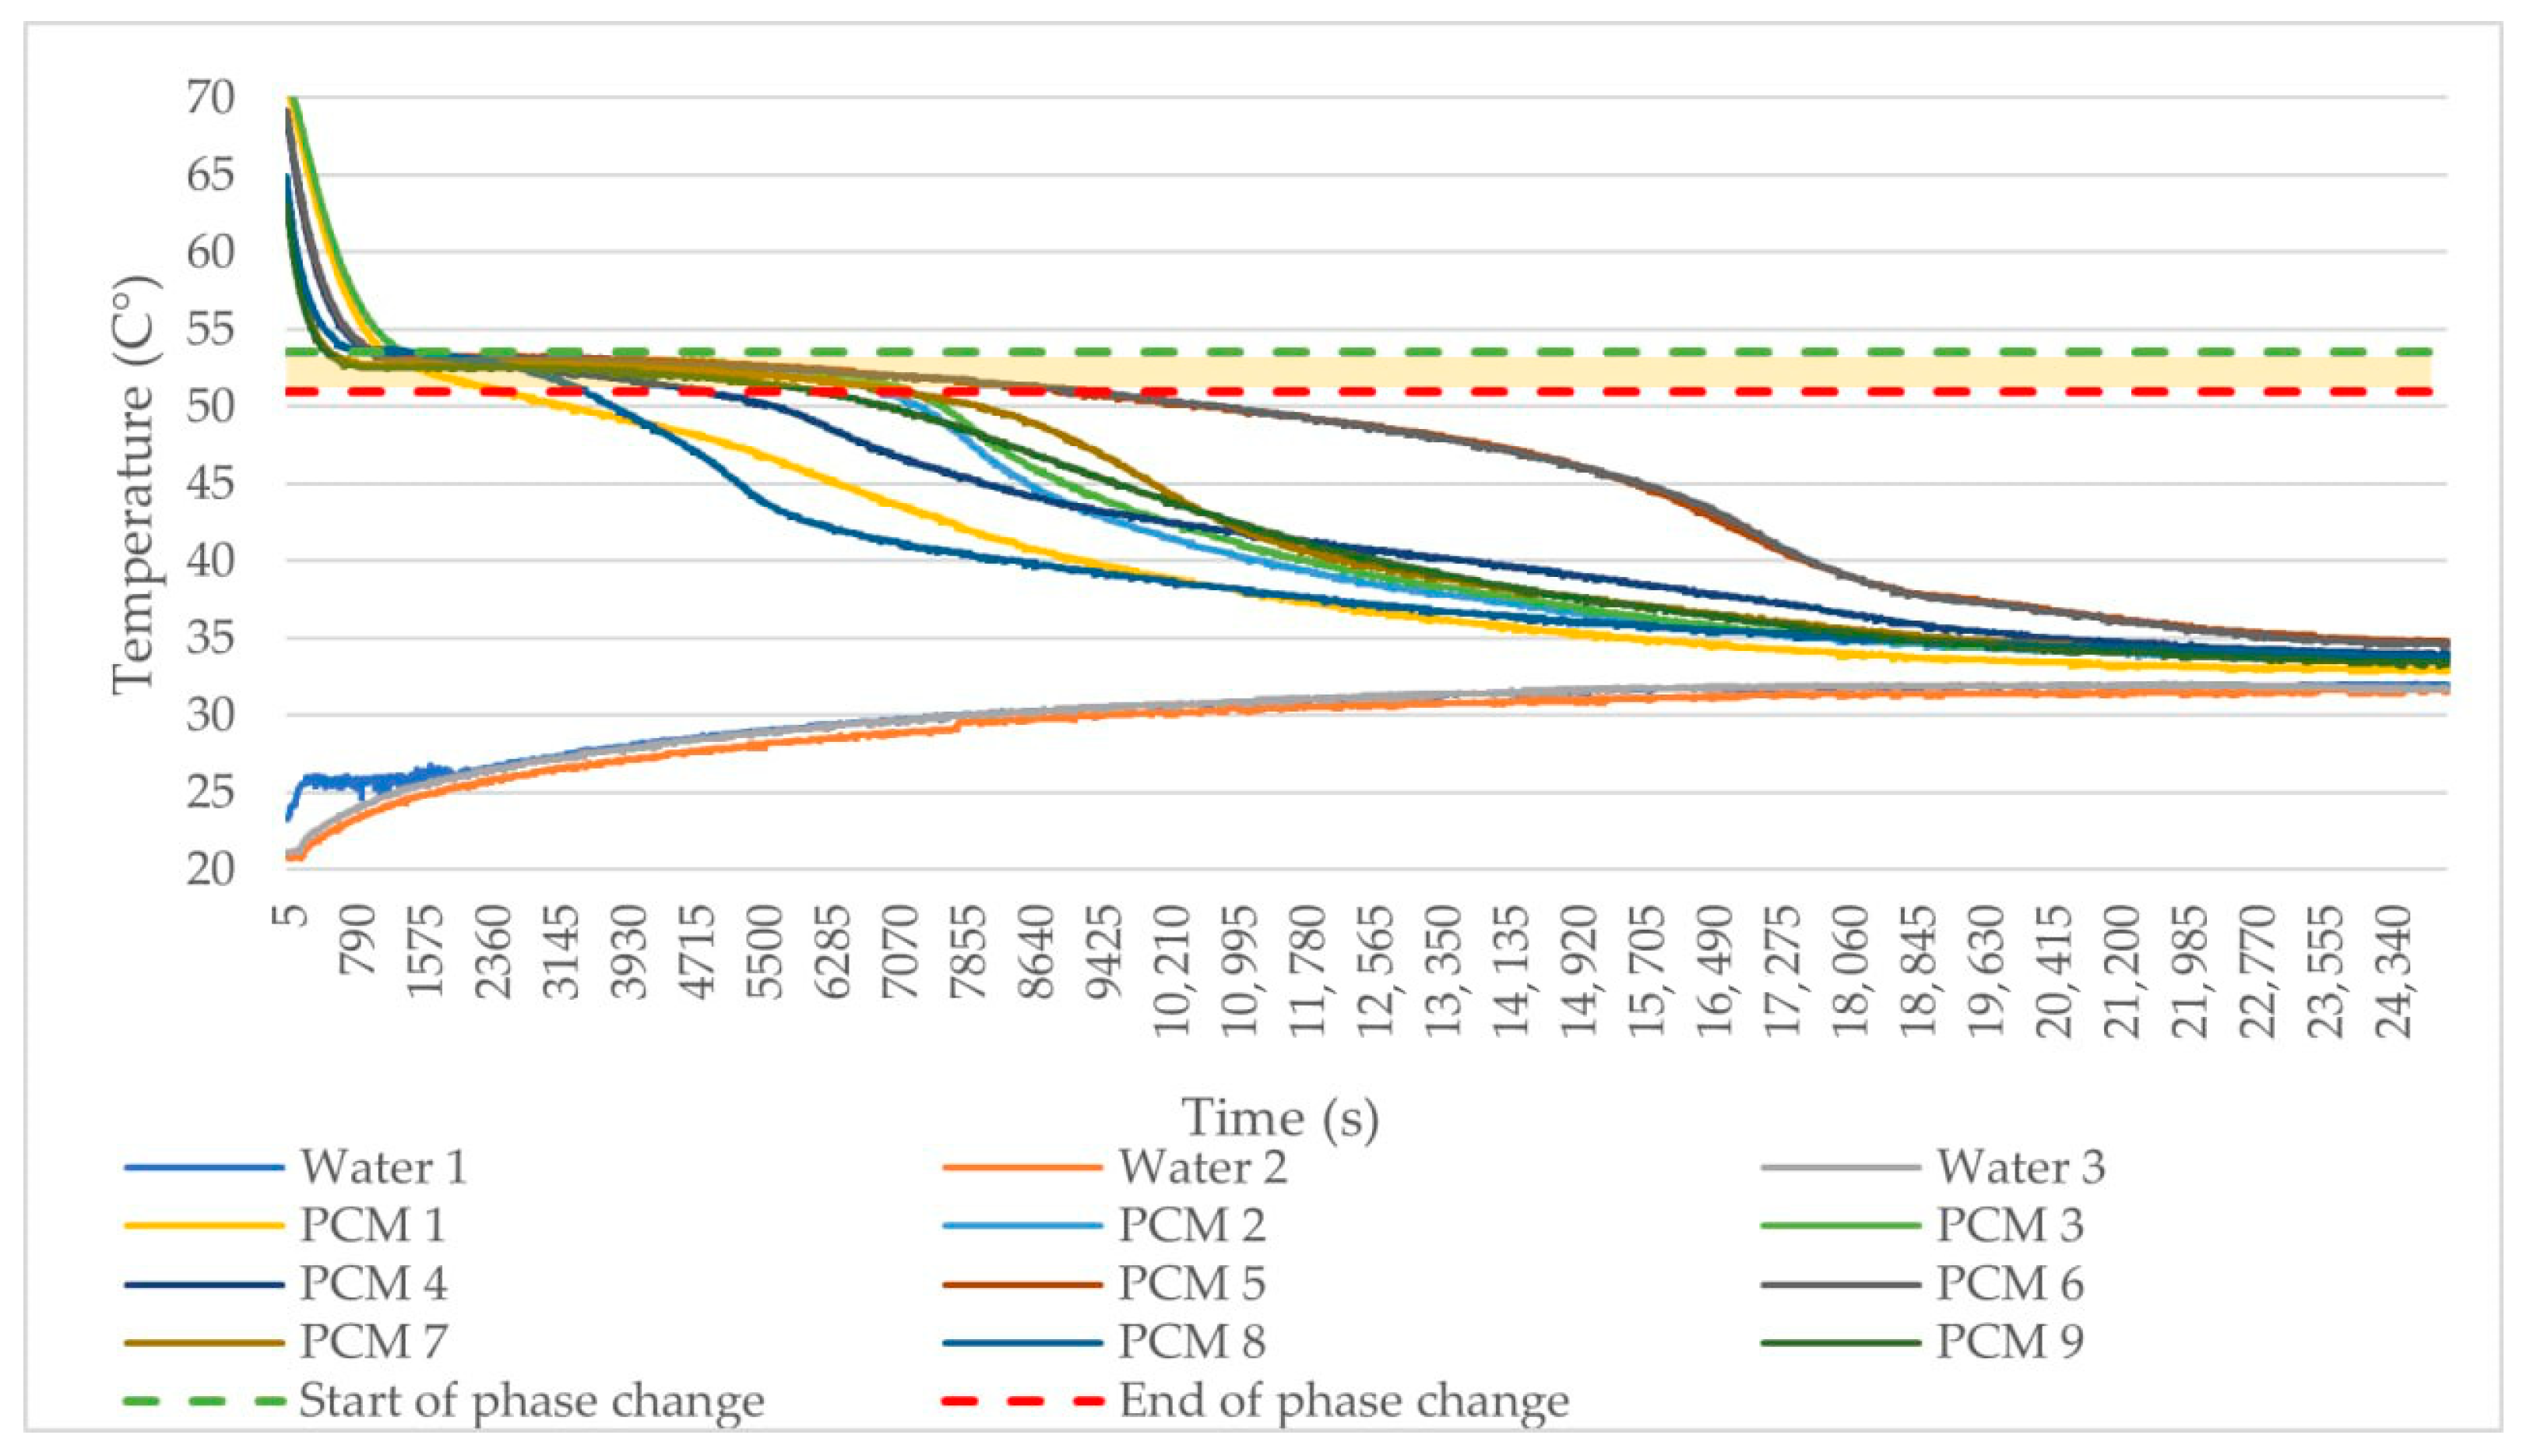
Figure 26 shows the solidification process of the PCM in the storage tank and the charging of the heat transfer medium of the accumulation tank. Solidification starts at a time of 1310 on the PCM9 thermocouple. During this measurement, the heat transfer medium was discharged to a temperature of 43.4 °C. Thus, the temperature of the heat transfer medium is still at approximately 48.9 °C at this point. The phase change ends at a temperature of 51.00 °C at 43,050 s on the PCM5 thermocouple. The total solidification time is 41,740 s. The heat transfer medium was heated to a maximum temperature of 47.0 °C. This temperature was recorded approximately at the midpoint of the phase change. Overall, the heat transfer medium was heated by Δt = 3.6 °C. This can be calculated as follows:
3.12. Measurement of the Experimental Hybrid Tank of Water–PCM with Copper Matrix
During the investigation and experimental testing of various ways of improving the thermal conductivity of the PCM, such as a steel twisted matrix, a copper matrix and a copper spiral, the copper matrix technique was selected for the experimental setup. A comparison of the charging and discharging of the samples using the different methods of thermal conductivity enhancement for PCM versus the reference pure PCM is shown in
Figure 27. When observing the charging and discharging of an experimental tray of pure PCM, the effect of the low thermal conductivity of paraffin and, consequently, the significant temperature differences between the core and the shell of the material during the whole charging and discharging process are clearly visible.
The copper matrix was a spatial structure embedded in an internal PCM tank and was formed of 13 layers of conductive copper strips. Each layer represented a rib with a thickness of 1 mm and an unfolded length of approximately 1000 mm. The width of each rib was 5 mm (
Table 4).
Figure 28 shows the charging progress of the water and copper matrix PCM reservoir. The phase change starts at a time of 6195 s in the part where the PCM8 thermocouple is located. The total time to melt the complete 3.7 kg of PCM is 18,960 s. The end of the phase change occurs at the PCM7 thermocouple. The phase change transition took 12,765 s which is 54.7% faster compared to the PCM tank without the copper matrix. The charging in this case was much more uniform throughout the volume.
Figure 29 shows the solidification process of the PCM with the copper matrix and the charging of the heat transfer medium of the accumulation tank. Solidification starts at 460 s on the PCM9 thermocouple. At this time, the heat transfer medium is at 22.3 °C. The phase change ends at 51.00 °C at 9145 s on the PCM6 thermocouple. The total solidification time is 8685 s. The heat transfer medium was heated to a maximum temperature of 30.4 °C. In total, the heat transfer medium was heated by Δt = 8.1 °C. This can be calculated as follows:
For comparison, the PCM with the copper matrix was able to deliver 125% more latent heat energy than the PCM without a copper matrix, and the phase change was faster by 79.19%. This result indicates a significant shift in the rate and amount of energy transferred.
5. Conclusions
The accumulation of thermal energy in the form of latent heat is currently quite a widespread topic to investigate. PCMs are used for latent heat accumulation. Their segmentation is wide and there are a number of different types with different parameters. Since each group of PCMs has different properties, each group has its advantages and disadvantages for use in energy storage. The biggest disadvantage is their low thermal conductivity, which causes uneven melting and solidification; moreover, the main problem with heat transfer during a phase change is the boundary level. There have been many studies around the world that have looked at ways to improve thermal conductivity. In this work, the improvement of the thermal conductivity of paraffins by using different elements such as a copper matrix, a steel matrix or a copper spiral was described. For each element, measurements designed to monitor the increase in the thermal conductivity of melting and solidification were carried out. Overall, the results were positive and each of the elements led to acceleration of the melting and solidification of the samples, either in a greater or lesser proportion. The most suitable measured variation was the copper matrix PCM sample, at a copper matrix-to-PCM volume ratio percentage of 6.1% in a laboratory beaker.
The solidification rate of the PCM was 75.13% faster than that of the reference sample. Similarly, these results were also measured for an experiment on a larger accumulation tank with a PCM storage tank, where into the PCM tank was integrated a copper matrix, where the percentage of copper matrix to PCM volume was 1.3%. These differences were clearly visible and confirmed again that the copper matrix placed in the PCM tank increased the heat transfer coefficient, and thus, the total phase change time for solidification was reduced by 79.19% and melting by 54.7%; therefore, it is one of the best options to increase the thermal conductivity of paraffin as a PCM for hybrid storage tanks. The integration of a copper matrix into the PCM tank proved to be the most effective solution, increasing the latent heat transfer from 55,677.6 J to 125,274.6 J, which signifies a 125% enhancement over experiments with pure PCM. An analysis using hysteresis curves revealed that the copper matrix not only improves heat transfer but also stabilizes the thermal response of the PCM across cycles of charging and discharging. This stability is crucial for the practical application of PCMs in energy systems, where consistent performance is necessary to manage peak loads and enhance overall energy efficiency.
Considering future research, it is imperative to delve deeper into the microstructural interactions within PCM composites that are modified with metal matrices. Understanding the specific impacts of these matrices on the thermal and physical properties of PCMs will pave the way for targeted enhancements in PCM technology. Additionally, extending numerical simulations to assess the dynamic thermal behavior under varying operational stresses will provide a comprehensive view of their potential in real-world applications.
Based on the current research and our experiments, it is important for further development to determine a clear relationship between the volume of the copper matrix and the volume of the PCM by introducing a coefficient that could determine the optimal ratio of the volume structure to achieve the maximum effect. Based on the results of our work, at a smaller volume in calorimetric experiments, the volume ratio of the copper matrix to the PCM was 6.1% and the achieved discharge acceleration result was 75%, and in the case of the experimental setup, the ratio was 1.3% and the achieved discharge result was 79%, which confirms the above statements and shows a further way to achieve significant improvements.
The promising results from this study suggest that further exploration into scaled-up systems and long-term operational stability could significantly advance the deployment of PCM-based energy storage solutions in both industrial and residential settings, promoting more sustainable and efficient energy management.


 ,
, 


