
Two-Line Element Outlier and Space Event Detection Method Based on Multi-Strategy Genetic Algorithm

1
School of Geomatics, Liaoning Technical University, Fuxin 123000, China
2
Institute of Geodesy and Navigation Positioning, Chinese Academy of Surveying & Mapping, Beijing 100036, China
3
Beijing Fangshan Satellite Laser Ranging National Observation and Research Station, Beijing 100036, China
*
Author to whom correspondence should be addressed.
Appl. Sci. 2024, 14(9), 3729; https://0-doi-org.brum.beds.ac.uk/10.3390/app14093729
Submission received: 22 March 2024
/
Revised: 19 April 2024
/
Accepted: 25 April 2024
/
Published: 27 April 2024
(This article belongs to the Section Earth Sciences)
Abstract
:The detection of two-line element (TLE) outliers and space events play a crucial role in enhancing spatial situational awareness. Therefore, this paper addresses the issue of TLE outlier detection methods that often overlook the mutual influence of multiple factors. Hence, a Multivariate Gaussian Mixture Model (MGMM) is introduced to consider the interdependencies among various indicators. Additionally, a Multi-strategy Genetic Algorithm (MGA) is employed to adjust the complexity of the MGMM, allowing it to accurately learn the actual distribution of TLE data. Initially, the proposed method applies probabilistic fits to the predicted error rate changes for both the TLE semi-major axis and the orbital inclination. Chaos initialization, a posterior probability penalty, and local optimization iterations are subsequently integrated into the genetic algorithm. These enhancements aim to estimate the MGMM parameters, addressing issues related to poor robustness and the susceptibility of the MGMM to converge to local optima. The algorithm’s effectiveness is validated using TLE data from typical space targets. The results demonstrate that the optimized algorithm can efficiently detect outliers and maneuver events within complex TLE data. Notably, the comprehensive detection performance index, measured, using the F1 score, improved by 15.9% compared to the Gaussian mixture model. This significant improvement underscores the importance of the proposed method in bolstering the security of complex space environments.
1. Introduction
Space objects in the Earth’s orbit include spacecraft, rocket debris, and space debris. Their number has grown exponentially due to increased space activities, exacerbating orbital congestion and collision risks. The number of on-orbit objects is currently 44,700 [1]. Most are uncontrolled space debris that pose a significant risk to the operational safety of on-orbit spacecraft [1,2]. Therefore, it is necessary to monitor the location, characteristics, functions, and space environment of all objects in Earth’s orbit using space surveillance systems to improve space situational awareness [3]. The process of cataloging space objects plays a vital role in achieving this goal. However, data acquisition is costly, and the observation equipment has limited capacity. Thus, the space objects catalog may contain outliers due to space events, such as solar activity, geomagnetic variations, collisions, or orbital maneuvers [4]. These outliers represent orbital elements that deviate significantly from the actual values, which undermines the credibility and reliability of subsequent analytical procedures. Therefore, the timely and accurate detection of TLE outliers and space events is crucial to ensure their operational safety.
The two-line element (TLE) catalog created by the North American Aerospace Defense Command (NORAD) is the most complete catalog of orbital information for describing the positions and velocities of space targets. Due to its provision of orbital information, TLE plays a vital role in satellite orbit prediction, collision avoidance, orbit tracking, and other fields. However, TLE data carry inherent uncertainties and errors arising from factors such as the quality of the observation data, loss of computational accuracy, and simplifications in models. Moreover, NORAD do not furnish information regarding their accuracy; thus, directly utilizing TLE data may pose potential risks or compromise the stability and reliability of subsequent research outcomes. Two TLE outlier and space event detection methods using historical TLE data have been used. The first method utilizes the semi-major axis or inclination for maneuver detection. For example, several researchers [5,6,7,8] used a moving window to fit the semi-major axis and predict future movements. This approach averages the data in the window. The results depend on the window size, which is difficult to determine due to the irregularity of the TLE release time. Some researchers have detected maneuvers by assuming that the semi-major axis of the target is highly variable [9,10]. The second object detection method is an algorithm based on a probabilistic statistical approach. It does not determine if the target orbit is stable but evaluates whether the TLE data are consistent with the target’s predicted movement [11]. References [12,13] conducted maneuver detection experiments assuming a Gaussian distribution and using discriminative methods, such as the Euclidean or Mahalanobis distance. However, due to large fluctuations in the TLE’s accuracy, it is difficult to detect low-thrust satellite maneuvers [14].
Machine learning algorithms are increasingly used for TLE outlier and maneuver detection as computer hardware capabilities have improved. These methods can learn the “long-term orbital motion patterns” of a target from a series of historical TLE data and use them as a basis for identifying anomalies and space events. These machine learning methods can be roughly divided into clustering discrimination and reconstruction discrimination according to the criteria of anomaly judgement. Clustering techniques such as Gaussian mixture models, K-nearest neighbour methods, multilayer neural networks, and convolutional neural networks, among others, identify points that are distant from the cluster centre in the data set as anomalies [15,16,17]. Reconstruction discrimination methods, such as principal components analysis, generative adversarial networks, and autoencoder networks, project the data set into a subspace and calculate the reconstruction error, judging samples that do not match the distribution of training samples as anomalies [18,19,20,21]. In addition, Adaptive Markov Inference Game Optimization, long short-term memory networks and time-delay neural networks can achieve good results [22,23,24]. However, few studies have investigated multivariate analysis and the models’ robustness.
Since the existing data cleaning methods can only target a single element to remove the obvious anomalies of the TLE, the improper processing of a large amount of noise causes the model to deviate from the real data structure of the TLE data, which in turn affects the accuracy of TLE outlier and space event detection. Therefore, this paper proposes a probabilistic fitting method combining the Multivariate Gaussian Mixture Model (MGMM) and Multi-Strategy Genetic Algorithm (MGA) to address the limitations of univariate anomaly detection and the poor robustness and tendency to fall into local optima associated with traditional Gaussian mixture models. This approach, referred to as MGMMMGA, aims to improve the accuracy of TLE outlier and space event detection.
The remainder of this paper is structured as follows. Section 2 describes the TLE outlier and space event detection method, including sample data generation, the MGMM, and the MGA. Section 3 presents the experimental results and compares the performances of the proposed and GMM methods. Section 4 provides the discussion and the conclusion.
2. Method
Li et al. [25] proposed a method used for the detection of maneuvers of space objects. We provide a brief description of this method. Although the semi-major axis is employed to delineate the proposed detection method, alternative parameters, such as the inclination and eccentricity, may also be utilized. Subsequently, the MGMM used for determining the probability distribution of the TLE data and the MGA used for learning the parameters of the GMM are presented. The method uses the maximum likelihood function for the optimization and the a posteriori probability penalty with a robust correction factor to minimize noise in the sample. The hyperparameters and other details of the MGA are discussed.
2.1. Sample Data Generation
TLE sets serve as a crucial data format, encapsulating the essential orbital parameters of Earth-orbiting objects at a specific epoch. For instance, TLE data typically comprise orbital information, including the NORAD ID, B* drag term, orbital inclination, eccentricity, and mean motion of the space target. The Simplified General Perturbations 4 (SGP4) model, developed in the 1980s, is an analytical method encapsulating orbital information to form Two-Line Element (TLE) sets. Unlike complex numerical integration methods, SGP4 simplifies the satellite perturbation model, significantly reducing computational requirements while providing a position accuracy of approximately 1 km. This capability enables the rapid cataloging of thousands of space objects. It is important to note that TLEs must be computed using the SGP4 model for a reliable determination of an object’s position and velocity. Thus, we employed the SGP4 model to calculate the prediction errors of TLEs, as illustrated in Figure 1, depicting the sample generation process. The TLE values’ track parameter at time is extrapolated to to obtain , and the value at is utilized to obtain track parameter . The predicted values of the orbital parameters are subtracted from the TLE values to obtain the prediction intervals and prediction errors . Dividing the two quantities yields the rate of change of the prediction errors of the orbital parameters . Similarly, the change rate of the m prediction errors for a single element is obtained by extrapolating the TLE value at time to time , to where the subsequent m values refer.
It should be noted that the generation of patterns can be achieved not only using the semi-major axis, but also by selecting the orbital inclination, eccentricity, and orbital energy. This process is repeated for all catalog values, resulting in prediction errors at different times. They comprise the sample data of the prediction errors, i.e., the set .
where is the rate of change of the semi-major axis prediction error from the nth catalogued value to the n + mth catalogued value. is the rate of change of the orbital inclination forecast error from the nth catalogued value to the n + mth catalogued value.
2.2. Loss Function
The MGMM is a statistical model describing the data distribution. It is well suited to dealing with multivariate and multimodal data sets. It uses a linear combination of multiple Gaussian distributions to model the data distribution. Each Gaussian distribution has a mean and covariance matrix. The different distributions are combined using weights to capture the data characteristics. The samples S are modeled in groups to determine the time-dependent features of the TLE sample data. Let be a random variable for sample . The MGMM is defined as follows:
where includes the weight , the expected value , and the variance of each component; is the number of Gaussian components. Since the establishment of the samples is the same for each group, we do not show, in the subsequent equations, the sample to which the random variable belongs to simplify the labeling.
We propose a MGMM that separates the Gaussian components to capture TLE outliers:
where is the anomaly level and the scale factor of the K-th Gaussian component. Reference [26] used a GMM to model the probability distribution of the TLE prediction error. The results showed that three to four Gaussian distributions were sufficient to obtain a satisfactory fit.
The maximum likelihood method is commonly used to estimate parameter values. It assumes that each data point is independent. The probability density function was used. The loss function of the MGMM is defined as follows:
Since the logarithmic function is monotonic, the location of the extreme value does not change. Even a small change in the 0–1 range can cause relatively large fluctuations in the output value. Thus, we used the logarithmic likelihood function to calculate the final loss:
Many parameter estimation methods for GMM have been used, such as the expectation-maximization (EM) algorithm, fuzzy clustering, and Monte Carlo sampling [27]. The EM algorithm is the most common approach; it is sensitive to the initial value. We propose the use of a multi-strategy genetic algorithm (MGA) for the MGMM parameters.
2.3. Multi-Strategy Genetic Algorithm
The Genetic Algorithm (GA) is inspired by natural selection, evolution, and group behavior. A population of candidate solutions is optimized to obtain an optimal solution. GA is an ideal choice for solving complex optimization problems due to its global search capability, strong adaptability, parallelism, scalability, and ability to overcome local optima. A detailed introduction to GA can be found in [28]. We used floating-point coding to encode the weights, mean, and variance because it is more stable than binary coding [29]. Chaotic initialization, a posteriori probability penalty, and a local optimal iteration strategy were utilized to ensure rapid convergence and prevent falling into a local optimum.
2.3.1. Chaotic Initialization Strategy
Random initialization has adverse effects on the population’s evolution, such as insufficient diversity, not utilizing the entire solution space, and slowing the GA model’s convergence [30]. Chaotic initialization has randomness and regularity. The search space is assessed in a specific range without repetition, improving the solution accuracy and convergence speed. The most common chaos initialization methods are logistic and Chebyshev initializations [31]. Since most of the sample data were close to 0, we used the Singer method to initialize the population as follows:
where is the chaos coefficient. When the parameter and , the system is in a chaotic state, and the entire space is mapped.
The population initialization consisted of the following steps. The initial value was randomly generated using Equation (7). An iterative calculation was performed to obtain a numerical sequence, where N is the population size. The chaotic sequence was mapped to the solution value domain, and the entire search space was traversed.
2.3.2. Posterior Probability Penalty
The proposed method delivers a low number of false positives and high accuracy because it uses a posterior probability penalty. The modified posterior probability density is also called the responsiveness of the component to the data. It is calculated as follows:
where is the responsiveness of sample i to sub-model k; is the robust correction function, which indicates how well the i-th sample matches the k-th component.
is defined as follows:
where is the robustness factor, which indicates the confidence level of the i-th sample.
The main role of the robustness factor is to prevent model overfitting. According to the TLE prediction accuracy, the robustness factor was divided into three categories: (1) the normal segment refers to data in the expected accuracy range; (2) the uncertain segment refers to data with a wide accuracy range; (3) the segment to be eliminated refers to data outside the expected accuracy range; it has a low probability of occurrence. Weight estimation methods include the Huber, Danish, the IGG (Institute of Geodesy and Geophysics, Chinese Academy of Sciences) III weight function, one-time paradigm minimization, and Turkey’s methods [32]. Only the IGGIII method provides the above three segments [33]. Therefore, it was used to determine the robustness factor as follows:
where is the normalized distance; denotes the distance between the i-th sample point and the best Gaussian component ; is the arithmetic square root of the variance of the k-th Gaussian component ; and are experience constants related to the scenarios, with ranges of 1–1.5 and 2.5–8, respectively [33,34,35].
2.3.3. Iterative Local Optimization
We propose an iterative local optimization strategy using the GA and EM algorithms to determine the suitable model parameters to obtain a stable solution for a small population. This uses a maximum likelihood function to search efficiently for the globally optimal solution. The equations used for estimating the model parameters are as follows:
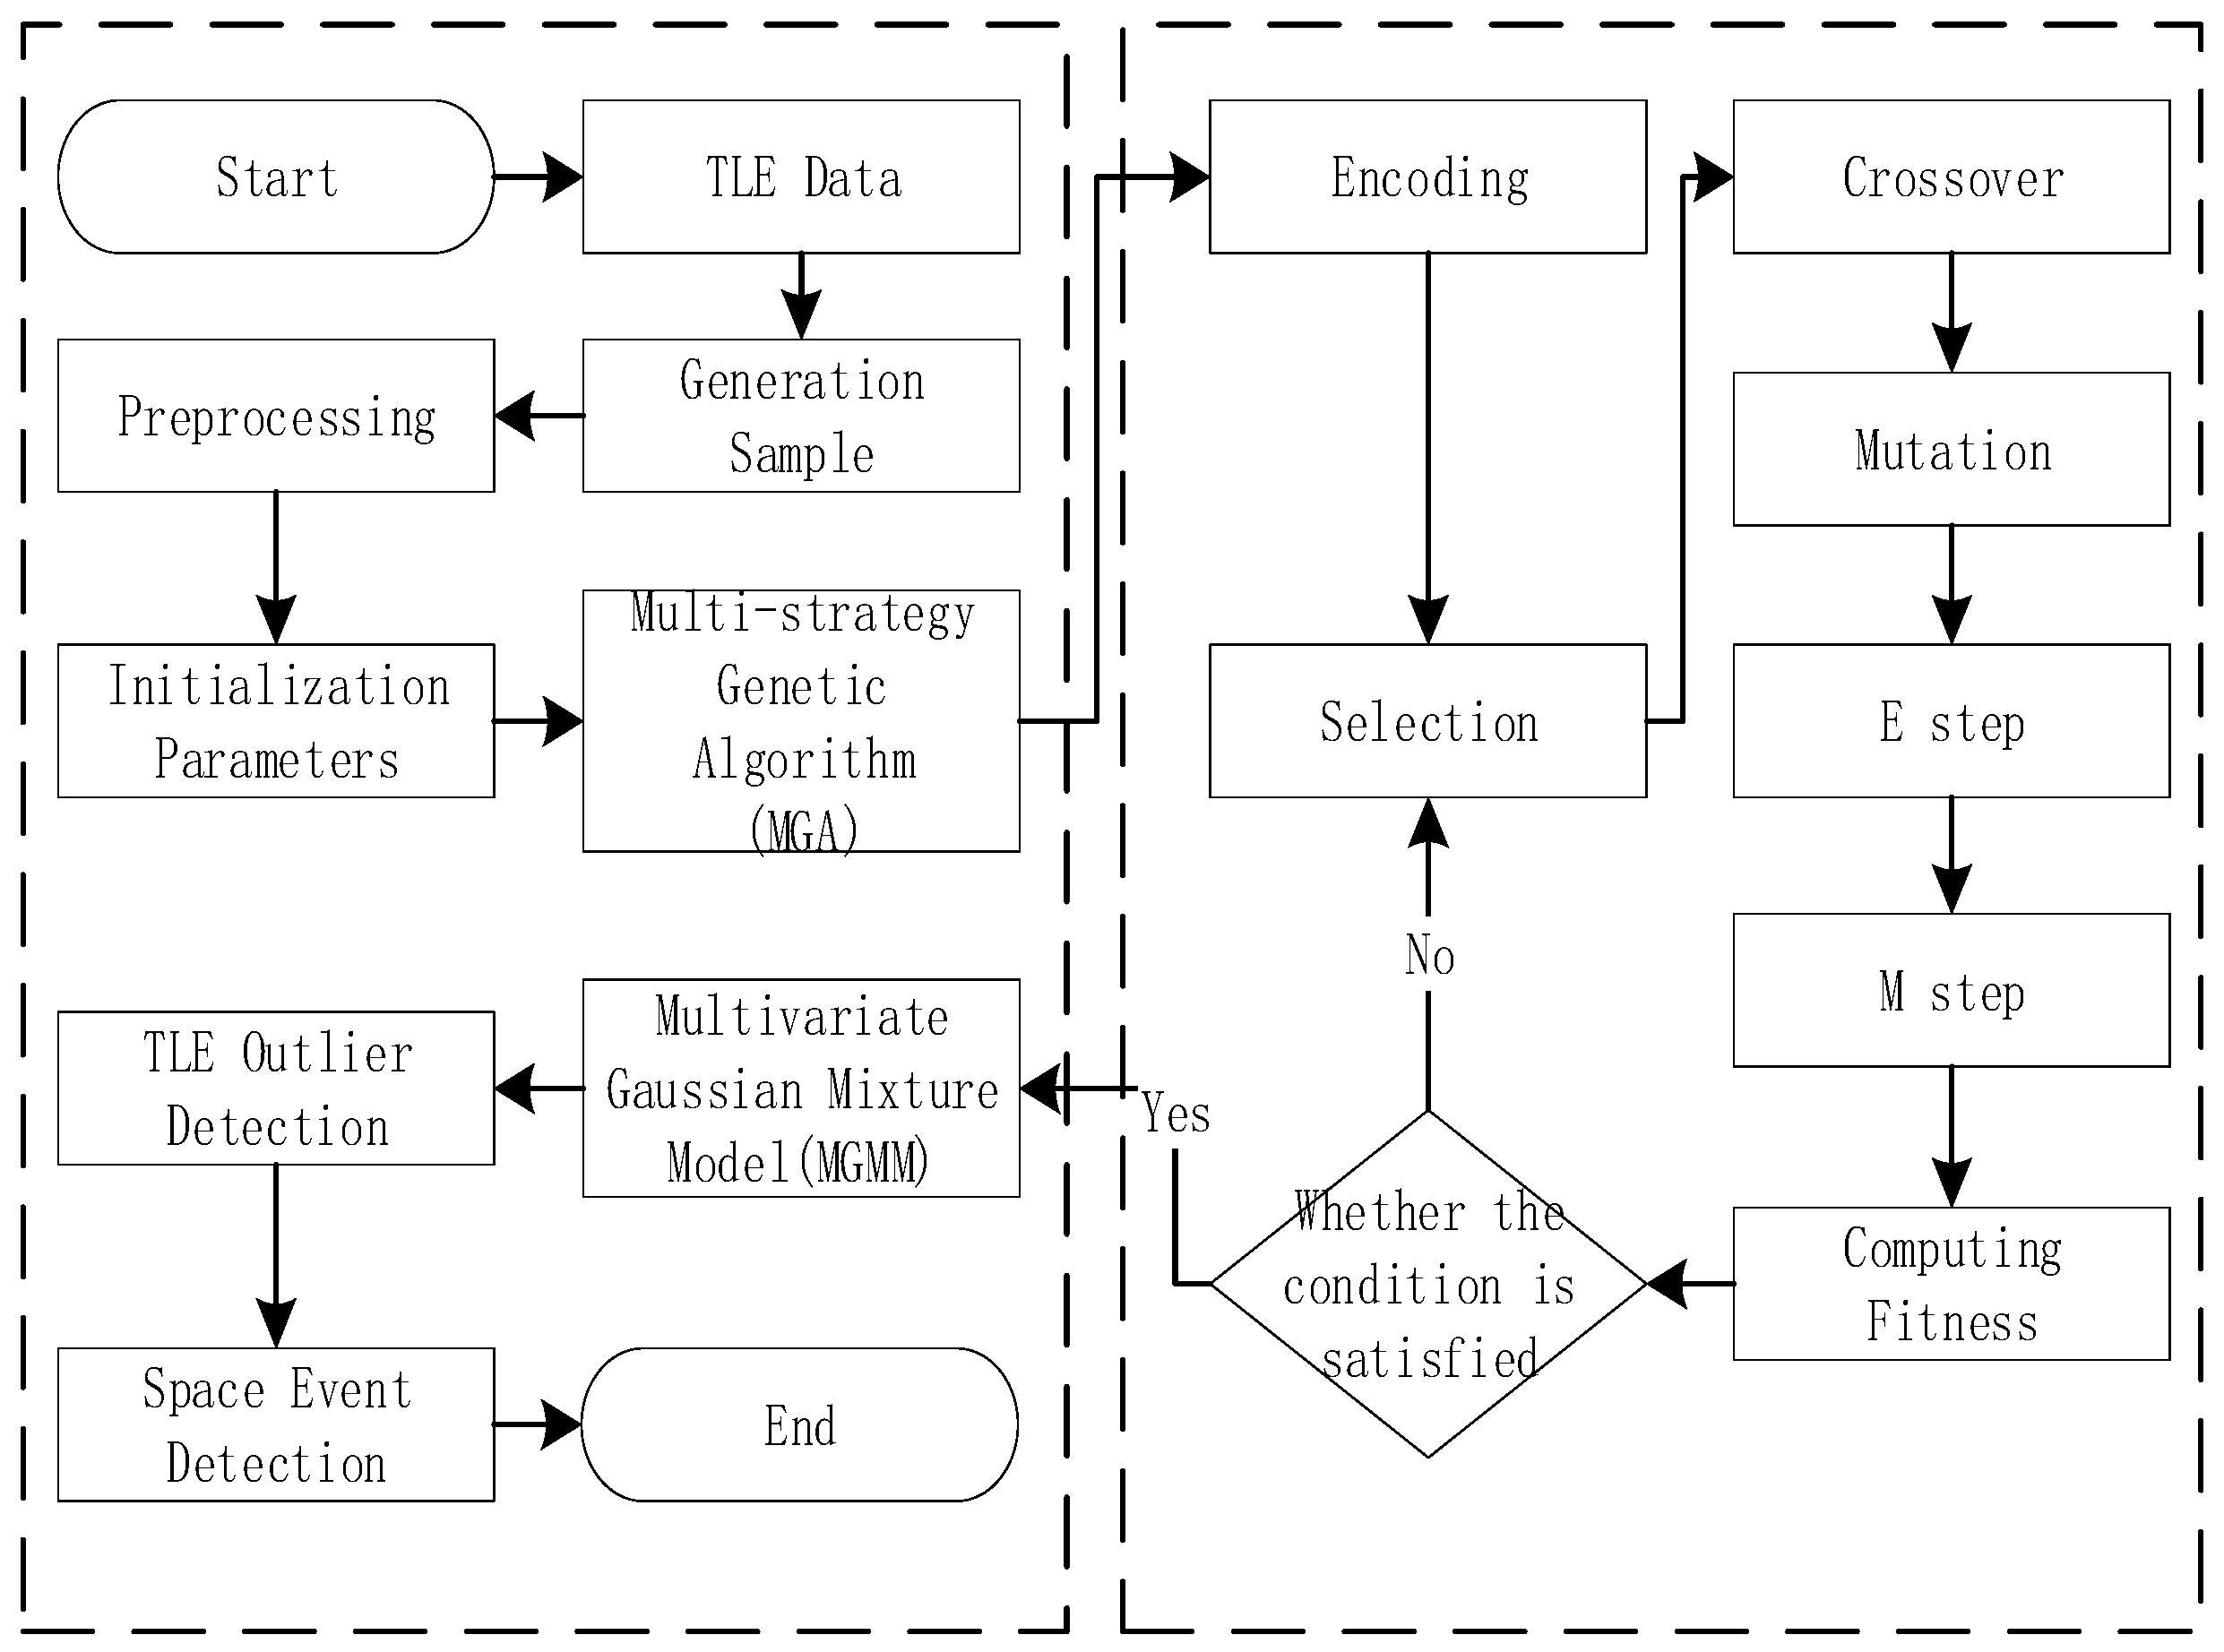
After the EM algorithm has iteratively estimated the model parameters, the K-th component is ignored, and the scale factors of the first K-1 components are scaled equivalently to establish the MGMM model. This MGMM is used to calculate the detection threshold corresponding to the 95% probability, and the TLE data exceeding the detection threshold are obtained. In general, the TLE outliers represent maneuvers. However, the TLE data are also superimposed by noise; thus, an outlier may not represent a maneuver. Maneuver detection is not the focus of this paper. The threshold calculation and maneuver detection method are described in [25]. The flowchart of the maneuver detection and processing is shown in Figure 2.
2.4. Evaluation Metrics
Evaluating the performance of the classification models is a critical step in maneuver detection. We used precision, recall, and the F1 score to assess the model performance [36]. Precision, which is of particular interest in target analysis and collision avoidance, is defined as the proportion of correctly predicted anomalies out of all samples predicted as anomalies. [37]. Recall, which is critical for ballistic coefficient estimation and orbit improvement, is the proportion of actual anomalies that are correctly identified as such. [38]. Given the trade-off between precision and recall, we incorporate the F1 score as a comprehensive metric to evaluate the effectiveness of the model. The precision, recall, and F1 score were calculated as follows:
where P is the precision rate, R is the recall rate, and F1 is the F1 score. TP denotes true positive samples, i.e., the model correctly predicts the positive class. FP denotes false positive samples, i.e., the model predicts the negative class as a positive class. FN denotes false negative samples, i.e., the model predicts the positive class as a negative class.
3. Results and Discussion
In this section, we selected targets with real maneuver events as candidate objects. We selected eight typical low-Earth-orbit (LEO) targets as test subjects to validate the proposed method, considering their value in detecting anomalies. Table 1 provides a summary of their key characteristics. While TLE data are accessible for tens of thousands of targets, the selected data were specifically picked to illustrate instances of TLE anomalies. These targets possess high-quality TLE datasets, and their space event histories were obtained. The TLE data were retrieved from the Spacetrack website, while the space event histories were sourced from the International Laser Ranging Service website.
NORAD ID 27386 was utilized as an example to illustrate the anomaly and space event detection process, showcasing the efficacy of this method. Initially, all permissible elements in the TLE-derived semi-major axis time series were propagated to each of the subsequent 14 epochs (m = 14) to generate sample data for the prediction error. Subsequently, anomaly detection thresholds were established using the 95th percentile rule based on the fitting results. Finally, spatial events were identified using the maneuver detection method.
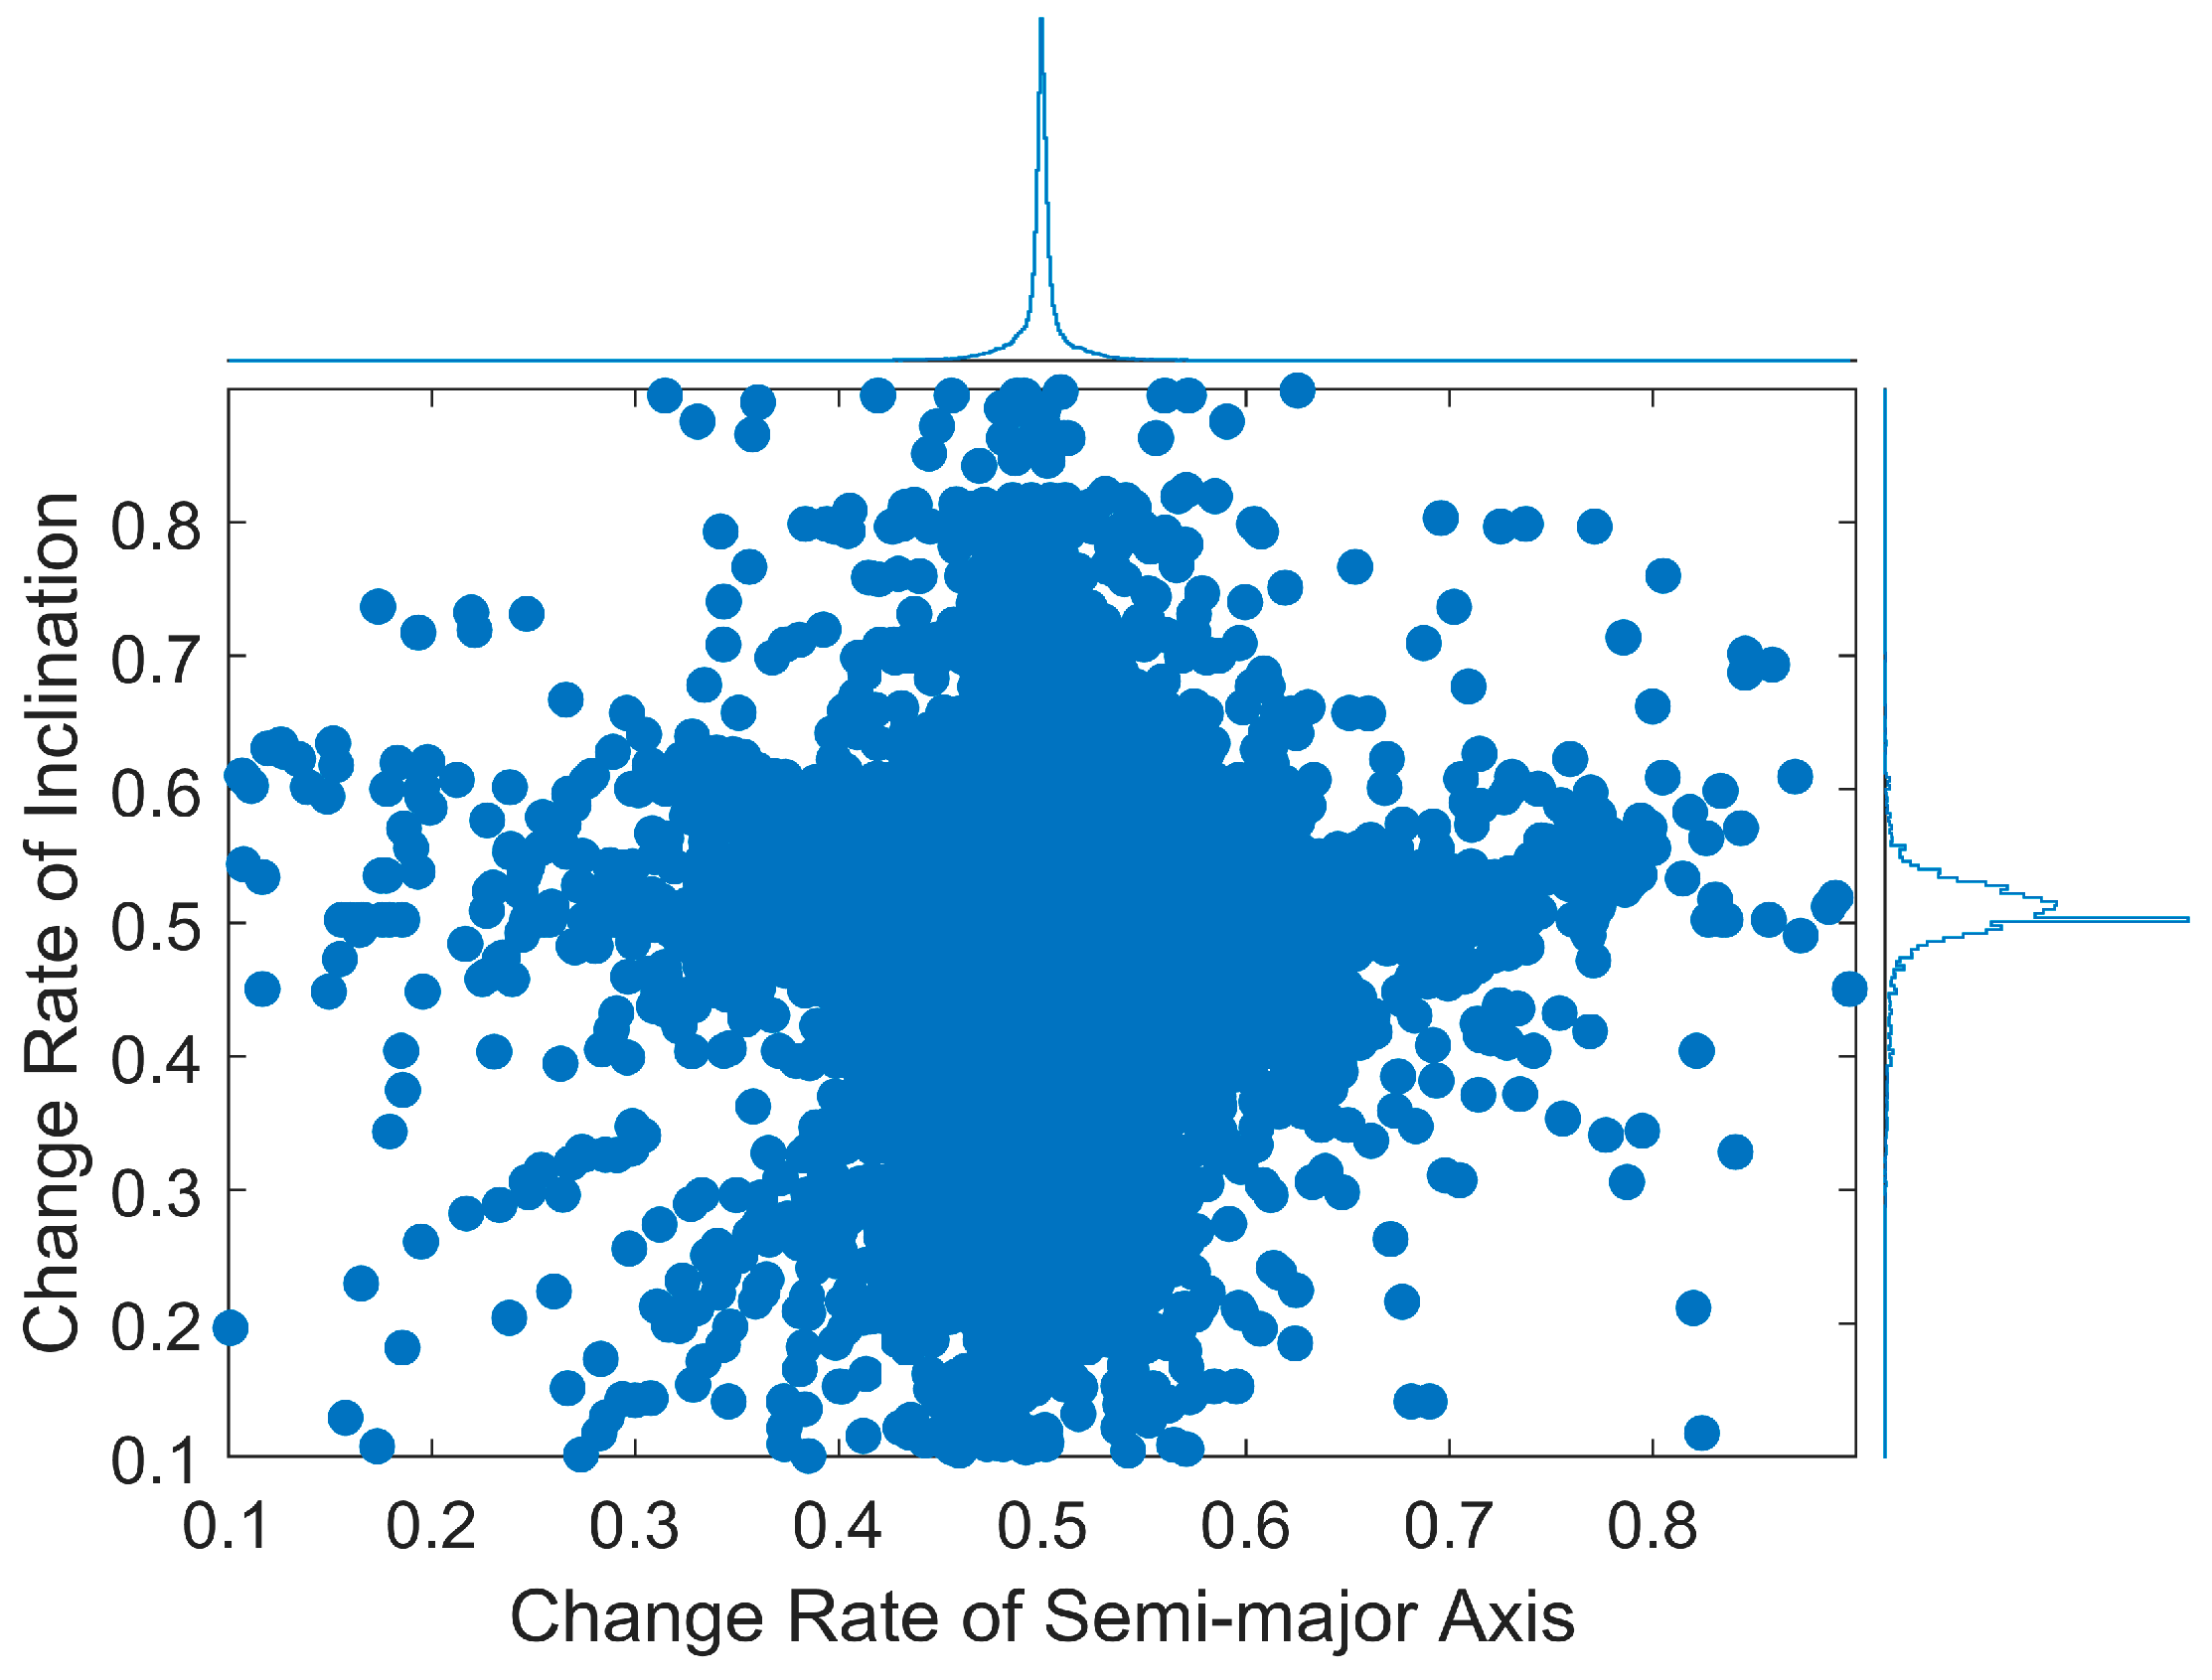
To visually showcase the effectiveness of the methods proposed in this paper, we present the results using histogram scatter statistics, as depicted in Figure 3. These results illustrate that the relationship between the semi-major axis and the rate of change of the orbital inclination is not independent, indicating that using a one-dimensional Gaussian mixture model for the analysis may not be appropriate.
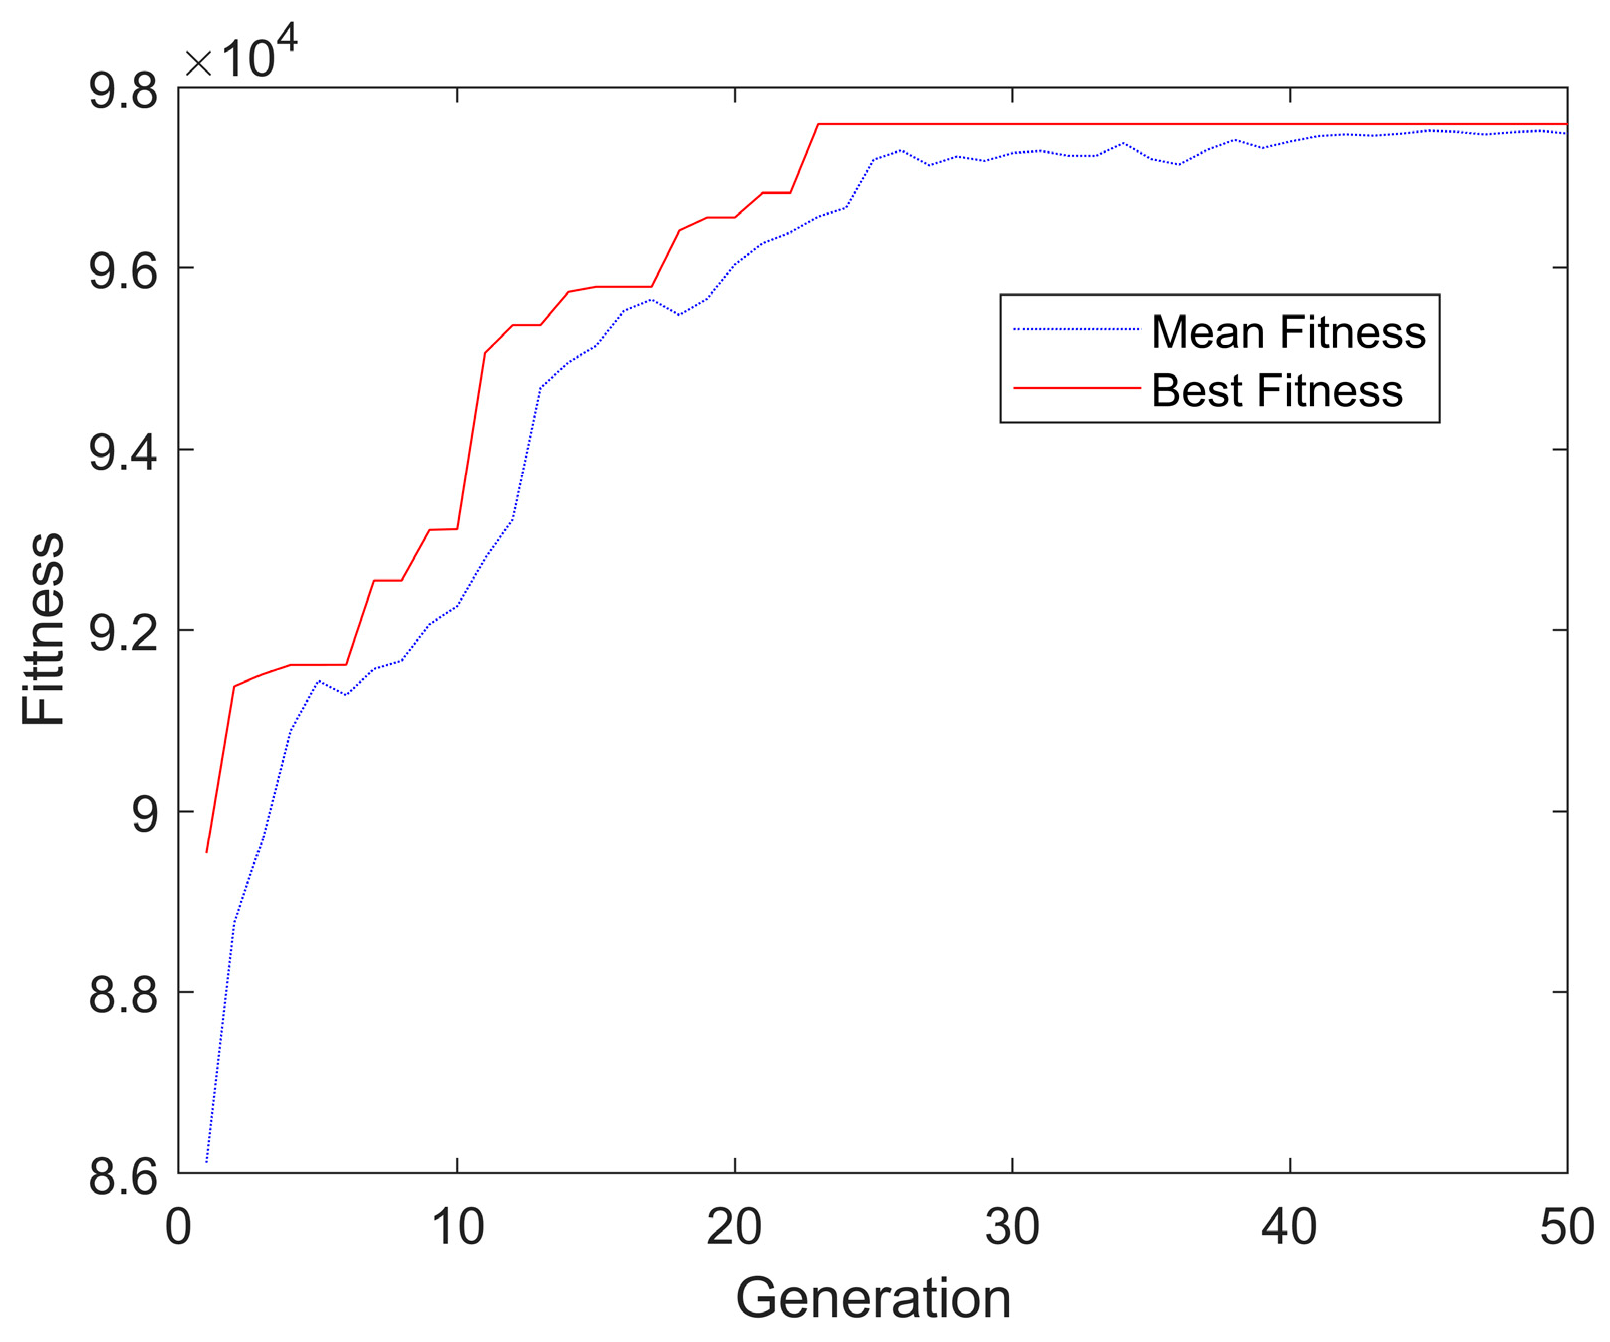
In this study, a multi-strategy genetic algorithm (MGA) is employed to estimate MGMM. The training process is illustrated in Figure 4. As depicted in Figure 4, the average fitness within the population and the fitness of the optimal individual converge to a consistent result after approximately 20 iterations. This suggests that the MGA utilized for estimating the MGMM parameters can accelerate the convergence speed and identify the global optimal solution in the solution within a certain timeframe. In addition, we compared the statistical properties of our samples and models to ensure that the obtained model effectively captures the intrinsic structure of the samples. Consequently, Figure 5 illustrates a quantile–quantile (Q-Q) plot of the sample model, demonstrating whether the model’s distribution aligns with that of the complete training data. The ‘X quantiles’ are derived from the sample data, while the ‘Y quantiles’ originate from the generated data of the learned model. The fact that the X and Y quantiles on the Q-Q plot form a straight line indicates that the resulting model conforms to the same distribution as the sample data. This observation validates the effectiveness of our proposed method in learning the distribution structure of multiple variables within the TLE data samples.
The 95th quantile was then utilized to establish the anomaly detection threshold, and the sample data sequence was processed to identify outliers. The outcomes of the outlier detection are illustrated in Figure 6. For clarity, we define an ‘outlier’ or ‘anomaly’ based on the magnitude of the deviation between adjacent measurements rather than predicted errors. Specifically, deviations in orbit inclination greater than 0.003° and semi-major axis deviations approximately exceeding 20 m are considered significant. These thresholds are not exact figures but rather represent a scale of detectable anomalies, as our anomaly score is a composite index derived from the loss function values of these two variables. It is, therefore, not feasible to provide an exact size for any single variable. This approach ensures that our method can detect TLE outliers of a significant size that may not be identifiable by simpler methods. It is evident that there is a notable presence of outliers in the TLE when there are frequent changes in the orbital elements of the cataloguing data. Therefore, it becomes imperative to enhance responsiveness through the robust correction function, consequently refining the accuracy of outlier detection and thereby bolstering the detection of historical maneuvers. Building upon the results of the outlier detection, the maneuver detection process is employed to detect historical maneuver events. In order to assess the efficacy of the proposed method for the detection of maneuvers, the Receiver Operating Characteristic (ROC) plots for both the MGMMMGA and GMMEM methods are presented in Figure 7. It should be noted that the GMMEM is a Gaussian Mixture Model (GMM) obtained using the Expectation Maximization (EM) algorithm. The ROC plot of the MGMMMGA method was observed to be closer to the upper left corner, indicating that our model outperforms the GMMEM method. In terms of the area under the curve (AUC), a higher AUC indicates superior performance in maneuver detection. The results showed that the area under the curve of the MGMMMGA method was 10% higher than that of the GMMEM, which can effectively improve the maneuver detection performance and lay a solid groundwork for understanding subsequent space target motion patterns and orbits.
The aforementioned process is iterated for the remaining targets to derive spatial event detection outcomes for all targets. These results are summarized in Table 2. From Table 2, it is clear that the MGMMMGA recall and F1 scores outperform those of the GMM model. In terms of precision, for targets 27386, 41335, and 39086, the GMM model outperforms the MGMMMGA model. This is due to the specific maneuvering characteristics of these targets. Their maneuvering events have extremely short durations, typically less than 1 s. These ultra-low-thrust maneuvers are prone to misjudgment, which may result in the lower accuracy of the MGMMMGA model. In contrast, the GMM model has a broader fitting range, which is only applicable when forecasting error data for larger thrusts. Furthermore, it is insensitive to low-thrust data. This explains why, out of the eight targets, only 27386, 41335, and 39086 have a higher detection accuracy with GMM compared to MGMMMGA. This observation suggests that, in case of large fluctuations in TLE precision, the down-weighting treatment of suspicious data can improve the GMM model’s performance for space event detection in the scenario of contaminated TLE data.
However, outlier and space event detection for different targets requires further investigation. Our methodology does indeed rely on the prediction error characteristics of the targets, and we recognize that these characteristics may vary depending on the target type, orbital height, orbital inclination, and orbital shape. Thus, further studies are necessary to clarify the effectiveness of our method.
4. Conclusions
To deal with TLE outliers, a probabilistic approach, consisting of the MGMMMGA, is proposed to capture the relationships between different variables through multivariate modeling. In addition, a multi-strategy genetic algorithm is employed to adjust the complexity of the MGMM, and multiple strategies are applied to prevent the genetic algorithm from falling into a local optimum and to limit the influence of suspicious data on the model. In terms of data correlation, the semi-major axis and the rate of change of inclination are not independent of each other, and it is more reasonable for the MGMM to carry out the analysis than the 1D GMM. In terms of probability density fitting, the MGA can be used in accelerating the convergence speed of the MGMM to find the global optimal solution in the solution space in a certain time, and the training model is basically consistent with the sample data. In terms of the Receiver Operating Characteristic curve, the area under the curve of the MGMMMGA model improves by 0.1 compared to the GMM, and performs better in space event detection. The experimental results obtained from eight typical low-Earth-orbit space targets demonstrate the superiority of the MGMM compared to the traditional GMM model, yielding a 15.9% improvement in the F1 score. This enhancement bolsters maneuver detection performance, offering stronger support for subsequent orbital collision warning systems of space targets. In addition, our methodology relies on the prediction error characteristics of the targets. In the future, we plan to use more targets and models with drag coefficient and eccentricity to identify TLE outliers and space events.
Author Contributions
H.Z. collected field data, completed the paper and wrote the paper. C.Z. and Z.H. edited the paper. All authors have read and agreed to the published version of the manuscript.
Funding
This research was funded by the National Natural Science Foundation of China (No. 42174033), The National Key Research and Development Program of China (2020YFB0505801, 2020YFB0505802).
Institutional Review Board Statement
Not applicable.
Informed Consent Statement
Not applicable.
Data Availability Statement
The original data presented in the study are openly available at https://celestrak.org/ and https://ids-doris.org/analysis-documents.html (accessed on 22 March 2024).
Acknowledgments
The authors thank the reviewers for their great help on the article during its review progress.
Conflicts of Interest
The authors declare no conflicts of interest.
References
- Space-Track.org. Available online: https://www.Space-Track.Org (accessed on 22 March 2024).
- Yin, Y.; Li, Z.; Liu, C.; Kang, Z.; Sun, J.; Chen, L. Improved Initial Orbit Determination Based on the Gooding Method of Low Earth Orbit Space Debris Using Space-Based Observations. Remote Sens. 2023, 15, 5217. [Google Scholar] [CrossRef]
- Zheng, S.; Jiang, L.; Yang, Q.; Zhao, Y.; Wang, Z. Space Target Tracking with the HRRP Characteristic-Aided Filter via Space-Based Radar. Remote Sens. 2023, 15, 4808. [Google Scholar] [CrossRef]
- Schumacher, P., Jr. Prospects for Improving the Space Catalog. In Proceedings of the Space Programs and Technologies Conference, Huntsville, AL, USA, 24–26 September 1996; American Institute of Aeronautics and Astronautics: Valley City, ND, USA, 1996. [Google Scholar]
- Kelecy, T.; Hall, D.; Hamada, K.; Stocker, M.D. Satellite Maneuver Detection Using Two-Line Element (TLE) Data. In Proceedings of the Advanced Maui Optical and Space Surveillance Technologies Conference, Maui, HI, USA, 12–15 September 2007; p. 16. [Google Scholar]
- Swartz, R.; Coggi, J.; McNeill, J. A Swift SIFT for Satellite Event Detection. In Proceedings of the AIAA/AAS Astrodynamics Specialist Conference, Toronto, ON, Canada, 2–5 August 2010; p. 7527. [Google Scholar]
- Patera, R.P. Space Event Detection Method. J. Spacecr. Rocket. 2008, 45, 554–559. [Google Scholar] [CrossRef]
- Li, T.; Li, K.; Chen, L. New Manoeuvre Detection Method Based on Historical Orbital Data for Low Earth Orbit Satellites. Adv. Space Res. 2018, 62, 554–567. [Google Scholar] [CrossRef]
- Song, W.D.; Wang, R.L.; Wang, J. A Simple and Valid Analysis Method for Orbit Anomaly Detection. Adv. Space Res. 2012, 49, 386–391. [Google Scholar] [CrossRef]
- Li, T.; Chen, L. Historical-Orbital-Data-Based Method for Monitoring the Operational Status of Satellites in Low Earth Orbit. Acta Astronaut. 2018, 151, 88–94. [Google Scholar] [CrossRef]
- Mukundan, A.; Wang, H.-C. Simplified Approach to Detect Satellite Maneuvers Using TLE Data and Simplified Perturbation Model Utilizing Orbital Element Variation. Appl. Sci. 2021, 11, 10181. [Google Scholar] [CrossRef]
- Lemmens, S.; Krag, H. Two-Line-Elements-Based Maneuver Detection Methods for Satellites in Low Earth Orbit. J. Guid. Control Dyn. 2014, 37, 860–868. [Google Scholar] [CrossRef]
- Pastor, A.; Escribano, G.; Escobar, D. Satellite Maneuver Detection with Optical Survey Observations. In Proceedings of the Advanced Maui Optical and Space Surveillance Technologies Conference (AMOS), Maui, HI, USA, 15–18 September 2020. [Google Scholar]
- Kovář, P.; Puričer, P.; Kovářová, K. Study of the Two-Line Element Accuracy by 1U CubeSat with a GPS Receiver. Sensors 2022, 22, 2902. [Google Scholar] [CrossRef]
- Gao, Y.; Yang, T.; Xu, M.; Xing, N. An Unsupervised Anomaly Detection Approach for Spacecraft Based on Normal Behavior Clustering. In Proceedings of the 2012 Fifth International Conference on Intelligent Computation Technology and Automation, Zhangjiajie, China, 12–14 January 2012; pp. 478–481. [Google Scholar]
- Wang, Y.; Bai, X.; Peng, H.; Chen, G.; Shen, D.; Blasch, E.; Sheaff, C.B. Gaussian-Binary Classification for Resident Space Object Maneuver Detection. Acta Astronaut. 2021, 187, 438–446. [Google Scholar] [CrossRef]
- Wang, D.; Li, F. A Machine Learning Method for the Orbit State Classification of Large LEO Constellation Satellites. Adv. Space Res. 2023, 71, 1644–1656. [Google Scholar] [CrossRef]
- Singh, N.; Horwood, J.T.; Aristoff, J.M.; Murray-Krezan, J. Athena: A Data-Driven Anomaly Detection and Space Object Classification Tool for SSA. In Proceedings of the 26th AAS/AIAA Space Flight Mechanics Meeting, Napa, CA, USA, 14–18 February 2016. [Google Scholar]
- Abay, R.; Gehly, S.; Balage, S.; Brown, M.; Boyce, R. Maneuver Detection of Space Objects Using Generative Adversarial Networks. In Proceedings of the Advanced Maui Optical and Space Surveillance Technologies Conference, Maui, HI, USA, 11–14 September 2018. [Google Scholar]
- Shen, D.; Sheaff, C.; Guo, M.; Blasch, E.; Pham, K.; Chen, G. Enhanced GANs for Satellite Behavior Discovery. Sens. Syst. Space Appl. XIII 2020, 11422, 110–121. [Google Scholar]
- Najari, N.; Berlemont, S.; Lefebvre, G.; Duffner, S.; Garcia, C. RADON: Robust Autoencoder for Unsupervised Anomaly Detection. In Proceedings of the 2021 14th International Conference on Security of Information and Networks (SIN), Edinburgh, UK, 15–17 December 2021; Volume 1, pp. 1–8. [Google Scholar]
- Shen, D.; Sheaff, C.; Lu, J.; Chen, G.; Blasch, E.; Pham, K. Adaptive Markov Inference Game Optimization (AMIGO) for Rapid Discovery of Satellite Behaviors. Sens. Syst. Space Appl. XII 2019, 11017, 57. [Google Scholar]
- Tariq, S.; Lee, S.; Shin, Y.; Lee, M.S.; Jung, O.; Chung, D.; Woo, S.S. Detecting Anomalies in Space Using Multivariate Convolutional LSTM with Mixtures of Probabilistic PCA. In Proceedings of the 25th ACM SIGKDD International Conference on Knowledge Discovery & Data Mining, Anchorage, AK, USA, 4–8 August 2019; pp. 2123–2133. [Google Scholar]
- Mortlock, T.; Kassas, Z.M. Assessing Machine Learning for LEO Satellite Orbit Determination in Simultaneous Tracking and Navigation. In Proceedings of the 2021 IEEE Aerospace Conference (50100), Big Sky, MT, USA, 6–13 March 2021; pp. 1–8. [Google Scholar]
- Li, T.; Li, K.; Chen, L. Maneuver Detection Method Based on Probability Distribution Fitting of the Prediction Error. J. Spacecr. Rocket. 2019, 56, 1114–1120. [Google Scholar] [CrossRef]
- Legendre, P.; Deguine, B.; Garmier, R.; Revelin, B. Two Line Element Accuracy Assessment Based on a Mixture of Gaussian Laws. In Proceedings of the AIAA/AAS Astrodynamics Specialist Conference and Exhibit, Keystone, CO, USA, 21–24 August 2006; p. 6518. [Google Scholar]
- Castillo-Barnes, D.; Martinez-Murcia, F.J.; Ramírez, J.; Górriz, J.M.; Salas-Gonzalez, D. Expectation–Maximization Algorithm for Finite Mixture of α-Stable Distributions. Neurocomputing 2020, 413, 210–216. [Google Scholar] [CrossRef]
- Chou, C.-F.; Tsai, C.-M.; Chen, C.-H.; Wong, Y.-H.; Fang, Y.-C.; Wen, C.-C.; Lee, H.-Y.; Le, H.-T.; Chang, S.-H.; Liao, H.-Y. Optical Design and Optimization with Genetic Algorithm for High-Resolution Optics Applied to Underwater Remote-Sensing. Appl. Sci. 2021, 11, 10200. [Google Scholar] [CrossRef]
- Liu, Q.; Li, X.; Gao, L.; Li, Y. A Modified Genetic Algorithm with New Encoding and Decoding Methods for Integrated Process Planning and Scheduling Problem. IEEE Trans. Cybern. 2021, 51, 4429–4438. [Google Scholar] [CrossRef] [PubMed]
- Ahmad, M.F.; Isa, N.A.M.; Lim, W.H.; Ang, K.M. Differential Evolution with Modified Initialization Scheme Using Chaotic Oppositional Based Learning Strategy. Alex. Eng. J. 2022, 61, 11835–11858. [Google Scholar] [CrossRef]
- Kazimipour, B.; Li, X.; Qin, A.K. A Review of Population Initialization Techniques for Evolutionary Algorithms. In Proceedings of the 2014 IEEE Congress on Evolutionary Computation (CEC), Beijing, China, 6–11 July 2014; pp. 2585–2592. [Google Scholar]
- de Menezes, D.Q.F.; Prata, D.M.; Secchi, A.R.; Pinto, J.C. A Review on Robust M-Estimators for Regression Analysis. Comput. Chem. Eng. 2021, 147, 107254. [Google Scholar] [CrossRef]
- Wang, R.; Becker, D.; Hobiger, T. Stochastic Modeling with Robust Kalman Filter for Real-Time Kinematic GPS Single-Frequency Positioning. GPS Solut. 2023, 27, 153. [Google Scholar] [CrossRef]
- Zhu, H.; Fan, J.; Li, J.; Li, B. Research on Robust Adaptive RTK Positioning of Low-Cost Smart Terminals. Sensors 2024, 24, 1477. [Google Scholar] [CrossRef] [PubMed]
- Fang, X.; Hu, Y.; Wang, B.; Kutterer, H.; Zeng, W.; Li, D. On Robust Estimation of the Gauss–Markov Model with a Singular Covariance Matrix. Measurement 2023, 223, 113834. [Google Scholar] [CrossRef]
- Cheng, X.; Li, B.; Deng, Y.; Tang, J.; Shi, Y.; Zhao, J. MMDL-Net: Multi-Band Multi-Label Remote Sensing Image Classification Model. Appl. Sci. 2024, 14, 2226. [Google Scholar] [CrossRef]
- Sánchez, L.; Vasile, M. Intelligent Decision Support for Collision Avoidance Manoeuvre Planning under Uncertainty. Adv. Space Res. 2023, 72, 2627–2648. [Google Scholar] [CrossRef]
- Cimmino, N.; Opromolla, R.; Fasano, G. Machine Learning-Based Approach for Ballistic Coefficient Estimation of Resident Space Objects in LEO. Adv. Space Res. 2023, 71, 5007–5025. [Google Scholar] [CrossRef]
Figure 1.
Sample data generation.

Figure 2.
Workflow for maneuver detection.

Figure 3.
27386 semi-major axis and change rate plot.

Figure 4.
Iteration process of data.

Figure 5.
Quantile–quantile plot (Comparison between the sample distribution, shown in blue, and the theoretical distribution, shown in red.).
Figure 5.
Quantile–quantile plot (Comparison between the sample distribution, shown in blue, and the theoretical distribution, shown in red.).

Figure 6.
Anomaly detection results.

Figure 7.
ROC Plot.


Table 1.
Summary of selected objects.
| NORAD ID | Mass [kg] | Launch Date | Period [min] | Apogee [km] | Perigee [km] | Inclination [°] | TLE Quantity | Events Quantity | TLE Time Span |
|---|---|---|---|---|---|---|---|---|---|
| 27386 | 8100 | March 2002 | 100 | 791 | 785 | 98.6 | 11,896 | 177 | 2003–2010 |
| 36508 | 720 | April 2010 | 99 | 732 | 718 | 92 | 8630 | 179 | 2010–2023 |
| 41240 | 553 | January 2016 | 112 | 1343 | 1331 | 66 | 7235 | 47 | 2016–2023 |
| 41335 | 1250 | February 2016 | 101 | 806 | 802 | 99 | 10,788 | 73 | 2016–2023 |
| 43476 | 600 | May 2018 | 94 | 491 | 470 | 89 | 4139 | 39 | 2018–2023 |
| 43477 | 600 | May 2018 | 94 | 491 | 470 | 89 | 4134 | 39 | 2018–2023 |
| 37781 | 1500 | August 2011 | 103 | 917 | 902 | 99 | 12,805 | 58 | 2011–2023 |
| 39086 | 400 | February 2013 | 101 | 785 | 782 | 99 | 7039 | 63 | 2013–2023 |
Table 2.
Maneuver detection results.
| NORAD ID | Maneuvers | MGMMMGA | GMM | ||||
|---|---|---|---|---|---|---|---|
| Precision | Recall | F1 | Precision | Recall | F1 | ||
| 27386 | 177 | 93.1% | 91.0% | 92.0% | 97.7% | 73.4% | 83.9% |
| 36508 | 179 | 99.3% | 84.3% | 91.2% | 99.2% | 67.6% | 80.4% |
| 41240 | 47 | 92.2% | 100.0% | 95.9% | 85.5% | 100.0% | 92.2% |
| 41335 | 73 | 83.9% | 100.0% | 91.3% | 100.0% | 68.5% | 81.3% |
| 43476 | 39 | 84.2% | 82.1% | 83.1% | 56.5% | 33.3% | 41.9% |
| 73477 | 39 | 80.6% | 74.4% | 77.3% | 56.7% | 43.6% | 49.3% |
| 37781 | 58 | 89.2% | 100.0% | 94.3% | 46.0% | 100.0% | 63.0% |
| 39086 | 63 | 94.2% | 77.8% | 85.2% | 96.2% | 39.7% | 56.2% |
| Total | 675 | 91.7% | 88.9% | 90.3% | 81.6% | 68.3% | 74.4% |
Disclaimer/Publisher’s Note: The statements, opinions and data contained in all publications are solely those of the individual author(s) and contributor(s) and not of MDPI and/or the editor(s). MDPI and/or the editor(s) disclaim responsibility for any injury to people or property resulting from any ideas, methods, instructions or products referred to in the content. |
© 2024 by the authors. Licensee MDPI, Basel, Switzerland. This article is an open access article distributed under the terms and conditions of the Creative Commons Attribution (CC BY) license (https://creativecommons.org/licenses/by/4.0/).
Share and Cite
MDPI and ACS Style
Zhang, H.; Zhao, C.; He, Z. Two-Line Element Outlier and Space Event Detection Method Based on Multi-Strategy Genetic Algorithm. Appl. Sci. 2024, 14, 3729. https://0-doi-org.brum.beds.ac.uk/10.3390/app14093729
AMA Style
Zhang H, Zhao C, He Z. Two-Line Element Outlier and Space Event Detection Method Based on Multi-Strategy Genetic Algorithm. Applied Sciences. 2024; 14(9):3729. https://0-doi-org.brum.beds.ac.uk/10.3390/app14093729
Chicago/Turabian StyleZhang, Haoyue, Chunmei Zhao, and Zhengbin He. 2024. "Two-Line Element Outlier and Space Event Detection Method Based on Multi-Strategy Genetic Algorithm" Applied Sciences 14, no. 9: 3729. https://0-doi-org.brum.beds.ac.uk/10.3390/app14093729
Note that from the first issue of 2016, this journal uses article numbers instead of page numbers. See further details here.