
Research on Laser Dual-Mode Fusion Detection Method of Ship Wake Bubbles
1
Faculty of Electronic Engineering, Naval University of Engineering, Wuhan 430034, China
2
Qingdao Campus, Naval Aviation University, Qingdao 266041, China
*
Author to whom correspondence should be addressed.
Appl. Sci. 2024, 14(9), 3695; https://0-doi-org.brum.beds.ac.uk/10.3390/app14093695
Submission received: 1 February 2024
/
Revised: 22 April 2024
/
Accepted: 23 April 2024
/
Published: 26 April 2024
(This article belongs to the Special Issue Application of Signal Processing in Lidar)
Abstract
:Addressing the issues of weak echo signals and strong background interference in the laser detection of ships’ wakes, an analysis of the laser backscatter detection characteristics of ships’ wakes has been conducted. Based on the Monte Carlo method, a simulation model for the dual-mode fusion detection of ship wake bubbles using laser technology was constructed under different target characteristics. A dual-mode fusion detection system for ships’ wakes was designed, and an indoor experimental platform for the dual-mode fusion detection of ship wake bubbles using laser technology was established. To address problems such as a wide range of echo signal intensity changes, severe signal fluctuations, low resolution, poor image contrast, and blurred target edge information, an algorithm based on multi-timescale hierarchical fusion signal processing and temporal difference accumulation image processing was proposed. Verification experiments for ship wake detection were conducted, which revealed that the dual-mode fusion detection method for ship wake bubbles using laser technology can effectively enhance the detection signal-to-background ratio and counter the maneuvering evasion of underwater weapons by ships. It achieved high sensitivity, large dynamic range, high resolution, and a wide field of view detection and real-time signal processing of ship wake bubble targets of different magnitudes against a strong reverberation background. The effectiveness of the dual-mode fusion detection mode was validated, providing theoretical support for the overall system design and parameter settings.
1. Introduction
Underwater laser detection is a technology that uses laser to search, track, detect, locate, and identify underwater targets. It has the characteristics of high precision, high robustness, and rapid response. It has great application value in marine remote-sensing surveying and mapping, underwater target detection, and tracking. Ship wake detection technology based on laser guidance is a typical application of underwater laser detection technology [1]. The wake of the ship is a dynamic air curtain belt formed at the tail of the ship when the ship is sailing on the water surface due to the cavitation of the propeller, the breaking of the wave, and the involvement of a large amount of air in the water line of the ship [2,3]. The theoretical geometric optics of the scattering characteristics of bubbles in water is in good agreement with the Mie scattering theory. Using the Mie scattering effect of the ship wake bubbles on the laser, the detection of the ship wake can be realized, so as to invert the trajectory and velocity characteristics of the ship in the ocean [4,5]. An underwater vehicle equipped with the laser detection system can realize the tracking and striking of the ship. However, the current laser detection system has problems and bottlenecks such as large dynamic changes in the received signal, poor stability of the received signal, and low SBR of the received signal [6,7]. At present, in the wake bubble detection method, the intensity detection based on laser forward scattering and the backward radar detection are mostly used. In the wake signal processing, the intensity modulation detection mode is mostly used. The experimental scene is mostly concentrated on the laboratory simulation environment, without considering the environmental interference such as scattering and multi-target occlusion. The model application scene is limited, and the signal processing method has low adaptability to external field experiments. Therefore, there is an urgent need for a laser detection method that combines multiple detection modes to meet the adaptive performance of ship wake laser detection in different hydrological conditions, sea areas, seasons, hydrology, and other external environments, and to achieve high sensitivity, strong anti-interference, large dynamic echo, and high reliability of underwater weapon wake laser detection and tracking.
In the field of laser detection of ships’ wakes, domestic and foreign scholars have carried out simulation detection and other related research in the laboratory for the intensity detection and image measurement of simulated bubbles in ships’ wakes. For example, Li Tenglong et al. [8] studied the bubble size distribution and bubble rising law in the bubble curtain of a simulated ship wake using high-speed photography technology in the laboratory environment. Yuan Junxing et al. used holographic imaging technology to detect the wake, and studied the forward scattering characteristics of wake bubbles. Units such as the Huazhong University of Science and Technology, the Naval Engineering University, the Shanghai Institute of Optics and Mechanics, and the Chinese Academy of Sciences have used pulsed laser to detect ships’ wakes, and carried out research on the high-power pulsed laser detection of wake bubbles. Rao Jionghui et al. [9] studied the laser backscattering characteristics of a bubble curtain using the Monte Carlo simulation method, and effective scattering signals from the wake bubbles of a real ship were detected at 11.5 s.
To enhance the reliability of the ship wake detection system and enable the identification of bubble size, number density, and thickness in ships’ wakes, this paper proposes a dual-mode laser fusion detection method for ships’ wakes. The wake bubble area is illuminated with green light, and the light scattered back by the bubble is received by the APD receiving system and the imaging CMOS detection receiving system. Through high-precision timing control, synchronized signal acquisition between the APD and CMOS detection modules is achieved. A multi-timescale hierarchical fusion signal processing approach is proposed, enabling the graded fusion processing of ns-level and ms-level laser echo signals. Additionally, a time-differential accumulation image processing method is introduced, effectively distinguishing between wake bubble targets and the water background. By combining the high sensitivity and large dynamic range of laser detection with the high resolution and large field of view of image detection, the dual-mode laser fusion detection method can achieve high-sensitivity, large-dynamic-range, high-resolution, and large-field-of-view detection of wake microbubbles against a strong reverberation background.
This paper primarily adopts a research approach that combines theory, simulation, system design, and experimental verification. The first section focuses on analyzing the laser detection characteristics of ships’ wakes. In the second section, based on Monte Carlo simulations, the laser dual-mode fusion detection characteristics of different bubbles are analyzed. In the third section, based on theoretical and simulation studies, system design and signal processing algorithms are investigated. Finally, in the fourth section, experimental verification tests are conducted using the system.
2. Ship Wake Bubbles Laser Detection Characteristics and Analysis
In this section, the laser detection characteristics of ship wake bubbles are analyzed from three aspects: the bubble distribution characteristics of ship wake, the characteristics of ship wake laser detection system, and the wake characteristics of ship maneuvering wake guidance weapon.
2.1. Bubble Distribution Characteristics and Analysis of Ship Wake
The characteristics of ship wake bubbles are related to many factors, such as propeller type, propeller speed, draft depth, heading (straight line, turning maneuver, etc.), meteorological, and hydrological conditions, which are the basis of the engineering application of laser wake detection technology. The ship wake is divided into a short-range wake and long-range wake. The short-range wake is generally the distance from the ship to three times the length of the ship [10]. There are obvious differences in bubble characteristics between the short-range ship wake and the long-range ship wake. The bubbles in the wake field of the short-range ship are greatly affected by the cavitation force formed by the propeller and the cavitation force after the ship is driven. The bubble scale is large, generally below 1000 μm, mainly concentrated in 100~500 μm, and the bubble number density can reach 106~3 × 10⁸ m−3. The larger the bubble scale, the faster the bubble floats, and the larger the bubble scale, the lower the bubble number density [11,12,13,14]. Bubbles in the wake field of long-range ships are mainly affected by their buoyancy. Large-scale bubbles rise to sea level and die out. Small-scale bubbles stay in seawater for a long time due to their slow rise. The scale is generally 10~300 μm, of which 40~80 μm is the majority [15]. According to the actual measurement, the bubble size in the seawater background is generally 20~200 μm, the bubble number density is generally 102~105 m−3, and the bubble number density of the remote ship wake is generally 105~6 × 10⁶ m−3. With the increase in time, the number density of the wake of the long-range ship gradually decreases to the number density of bubbles in the seawater background. The number density of 10~20 μm bubbles is the largest, and the thickness of the bubble layer is generally 2~4 m.
From the long-range wake to the short-range wake, the distribution characteristics of the ship wake bubbles and the characteristics of the bubble target are as follows:
- the wake width decreases gradually;
- the concentration scale of the bubble group gradually increases;
- the bubble number density gradually increases;
- the thickness of the bubble layer gradually increases and begins to decrease after reaching the maximum thickness.
In summary, the bubble scale of the ship wake can be obtained from um level to mm level; the bubble thickness varies from 10 cm to more than ten meters. The bubble number density varies from 102 m−3 to 109 m−3, the magnitude span is large, the distribution is wide and uneven, and the target characteristics are weak.
2.2. Laser Detection Characteristics and Analysis of Ship Wake
Due to the strong attenuation of the seawater medium to the laser and the low reflection coefficient of the bubble, the laser receiving device can only receive the weak signal returned by the wake bubble target, and the weak target signal is also superimposed on the background of the strong close-range water scattering signal, making it more difficult to distinguish. This has always been the reason that restricts the slow engineering process of wake laser detection. The wake laser detection needs to suppress the backscattering of seawater, thereby improving the detection signal-to-background ratio (SBR) of the bubble echo signal. Usually, distance gating can be used to suppress the backscattering of seawater, but the distance between the wake bubble and the laser detection device is mostly within 20 m, and the laser detection time is in the order of hundreds of nanoseconds. Limited by the underwater platform, the wake laser detection device needs to meet the requirements of compact installation. At present, the acousto-optic and electro-optic distance gating devices cannot meet the requirements in technical performance and size. At present, relevant scholars have mostly used laser backward detection mode and laser imaging detection mode to detect ships’ wakes [16]. Among them, the laser backscatter detection system has a simple structure design, low cost, and reliable structure. It can suppress the backscatter of seawater and improve the detection SBR of the echo signal of the ship’s wake. However, the receiving field of view is narrow, and only the echo signal in the close-range part can be received. If the bubble is not in its receiving field of view, the wake bubble target cannot be detected, which cannot meet the needs of the large field of view reception. The laser imaging detection system has the advantages of a large detection field, wide detection range, and high precision. It can also suppress the backscattering of seawater and improve the detection SBR of the ship’s wake echo signal. However, the back-end image processing and target detection are difficult. The existing target detection algorithm cannot effectively detect the ship’s wake bubble target, and its signal processing rate is slow compared to the backscatter detection, which cannot adapt to the high-speed underwater weapon carrier. According to [17,18,19], it can be concluded that the echo signal or image has the following characteristics:
- weak echo signal (target feature);
- random discrete distribution of echo signals (targets);
- large environmental interference;
- large amount of target echo signal data.
The front-end detection system needs to have the characteristics of high sensitivity, large dynamic range, high resolution, and a large field of view, so as to meet the engineering requirements of laser wake detection.
2.3. Technology and Characteristics of Ship against Wake-Guided Weapons
In the process of the development of underwater-guided weapons, the methods of countering underwater-guided weapons are also constantly developing. In order to effectively avoid attacks from underwater weapons, surface ships will change the wake path to resist the attack creating false wakes, steering avoidance, cross tracks, and so on [20,21]. Now, the wake characteristics of the more complex manufacturing of false wakes and cross tracks are analyzed.
- (1)
- Creating false wake deception jamming
When the surface ship is captured by underwater weapons, the surface ship can launch air curtain bombs to simulate one or more false wakes that are connected to the wake track of the ship but go in different directions, luring the underwater weapons away from the real wake zone. The main diagram is shown in Figure 1. The width and thickness of the false wake manufactured by it have obvious changes to the real wake. The specific wake change is that the number of bubbles increases sharply at 1, 2, 3, and 4 of the wake, the thickness of the bubbles does not change much, and the range of bubble scale changes and expands. If the detection system has the ability to analyze and detect the number density and scale of bubbles, it can resist the false wake of artificial air curtain bombs. According to the authors of [22], it can be seen that the change in bubble number density and scale can be identified by the change in echo intensity and saturation depth of the laser detection system, and the reliability of true and false wake identification can be further improved by combining laser imaging detection.
- (2)
- Annular wake interference
When the surface ship is captured by the underwater weapon, the surface ship can form a cross wake by turning 270° to trap the incoming weapon. The main schematic diagram is shown in Figure 2. The number of bubbles in the annular wake created by it increases sharply at 1, the thickness of the bubbles increases, and the range of the bubble scale expands. If the detection system has the ability to analyze and detect the bubble number density, thickness and scale, it can resist the annular wake. Similarly, the change in bubble number density, thickness, and scale can be identified by the change in echo intensity and saturation depth of the laser detection system, and the reliability of true and false wake identification can be further improved by combining laser imaging detection.
In the application of anti-artificial false wakes and ship cross-annular wakes, if only the laser adaptive backscattering detection mode is used, it will be limited by the detection range and cannot reliably resist false wakes and annular wakes. If only the laser imaging detection mode is used, it will be limited by the speed of image processing algorithms and target detection, and cannot effectively track the ship. By combining the advantages of the two detection methods, the laser backscattering detection is used to track the ship wake, and the laser imaging method is used to assist the large field of view detection and discriminate against the wake form. The laser backscattering detection mode is combined with the laser imaging detection mode, which can further improve the detection SBR of the ship’s wake echo signal and suppress the influence of seawater backscattering on the detection system.
3. Simulation of Ship’s Wake Bubble Laser Dual-Mode Detection Based on Monte Carlo
This section is based on Monte Carlo simulation to analyze the backscattering characteristics of ship’s wake bubbles and the imaging characteristics of laser illumination, verifying the effectiveness of the dual-mode fusion detection method.
3.1. Monte Carlo Simulation Model
In this study of the propagation of lasers in water, water is regarded as a discrete scattering medium, and the laser beam is regarded as a photon beam composed of many photons. Therefore, the problem of laser propagation in water can be transformed into the problem of photon beam propagation in water. The distribution of particles in seawater is random. When photons propagate in water, they will randomly collide with the medium. The Monte Carlo method is based on the computer simulation of the photon motion trajectory. The basic process is that the photon enters the medium in a specific direction to determine the free path of the photon motion when the collision occurs. If scattering occurs, the corresponding scattering phase function can be selected. Then, the new direction of motion of the photon is determined. If absorption occurs, the photon disappears. These processes are repeated randomly until the photon is received by the receiver. The statistics of photon motion reflect the propagation law of photons in water. The Monte Carlo simulation is based on the statistical experimental method of the computer, which can simulate the motion process of a large number of photons and record the state of photons. It does not need too much approximation, and can simulate the absorption and scattering characteristics of the water body under different attenuation coefficients.
In this paper, we consider the case of multiple scattering of the water medium, that is, the scattering particles in water are dense, and we consider the single, secondary, and higher-level scattering and attenuation on the scattering path. To simulate the propagation of photons in water, three basic conditions need to be determined: the motion distance of photons, the motion direction of photons, and the decision of photon survival. The process can be divided into six steps:
- the emission wavelength and energy determination;
- determination of free path;
- scattering angle calculation;
- new direction of motion after collision;
- new free path;
- receive or die.
The free path formula:
is the new beam propagation distance after m collisions; is the probability of collision of motion; is the probability that the motion does not collide; is the particle radius; N is the logarithmic density about c; is a random number between (0, 1).
After the mth collision, the emission direction of the photon is relative to the previous coordinate system. After the m + 1th collision, the emission direction is relative to the mth coordinate system. Among them:
The Monte Carlo photon simulation motion program is shown in Figure 3.
3.2. Simulation of Laser Backscattering Detection of Ship’s Wake
Based on the distribution of the ship’s wake and the characteristics of bubble target, the characteristics of laser dual-mode fusion detection with different bubble size, bubble number density, and bubble layer thickness are analyzed. When the number of photons is higher, the simulation effect is better. However, due to the performance limitation of the computer, when the number of photons is set to 107, the simulation efficiency is high and the effect is better. The laser transmission distance of 532 nm is set to be far, and the water scattering is smaller than other wavelengths. Setting the water attenuation coefficient to 0.151 m−1 can approximately simulate the offshore seawater quality [23].
- (1)
- Laser backscattering characteristics of bubbles with different number densities
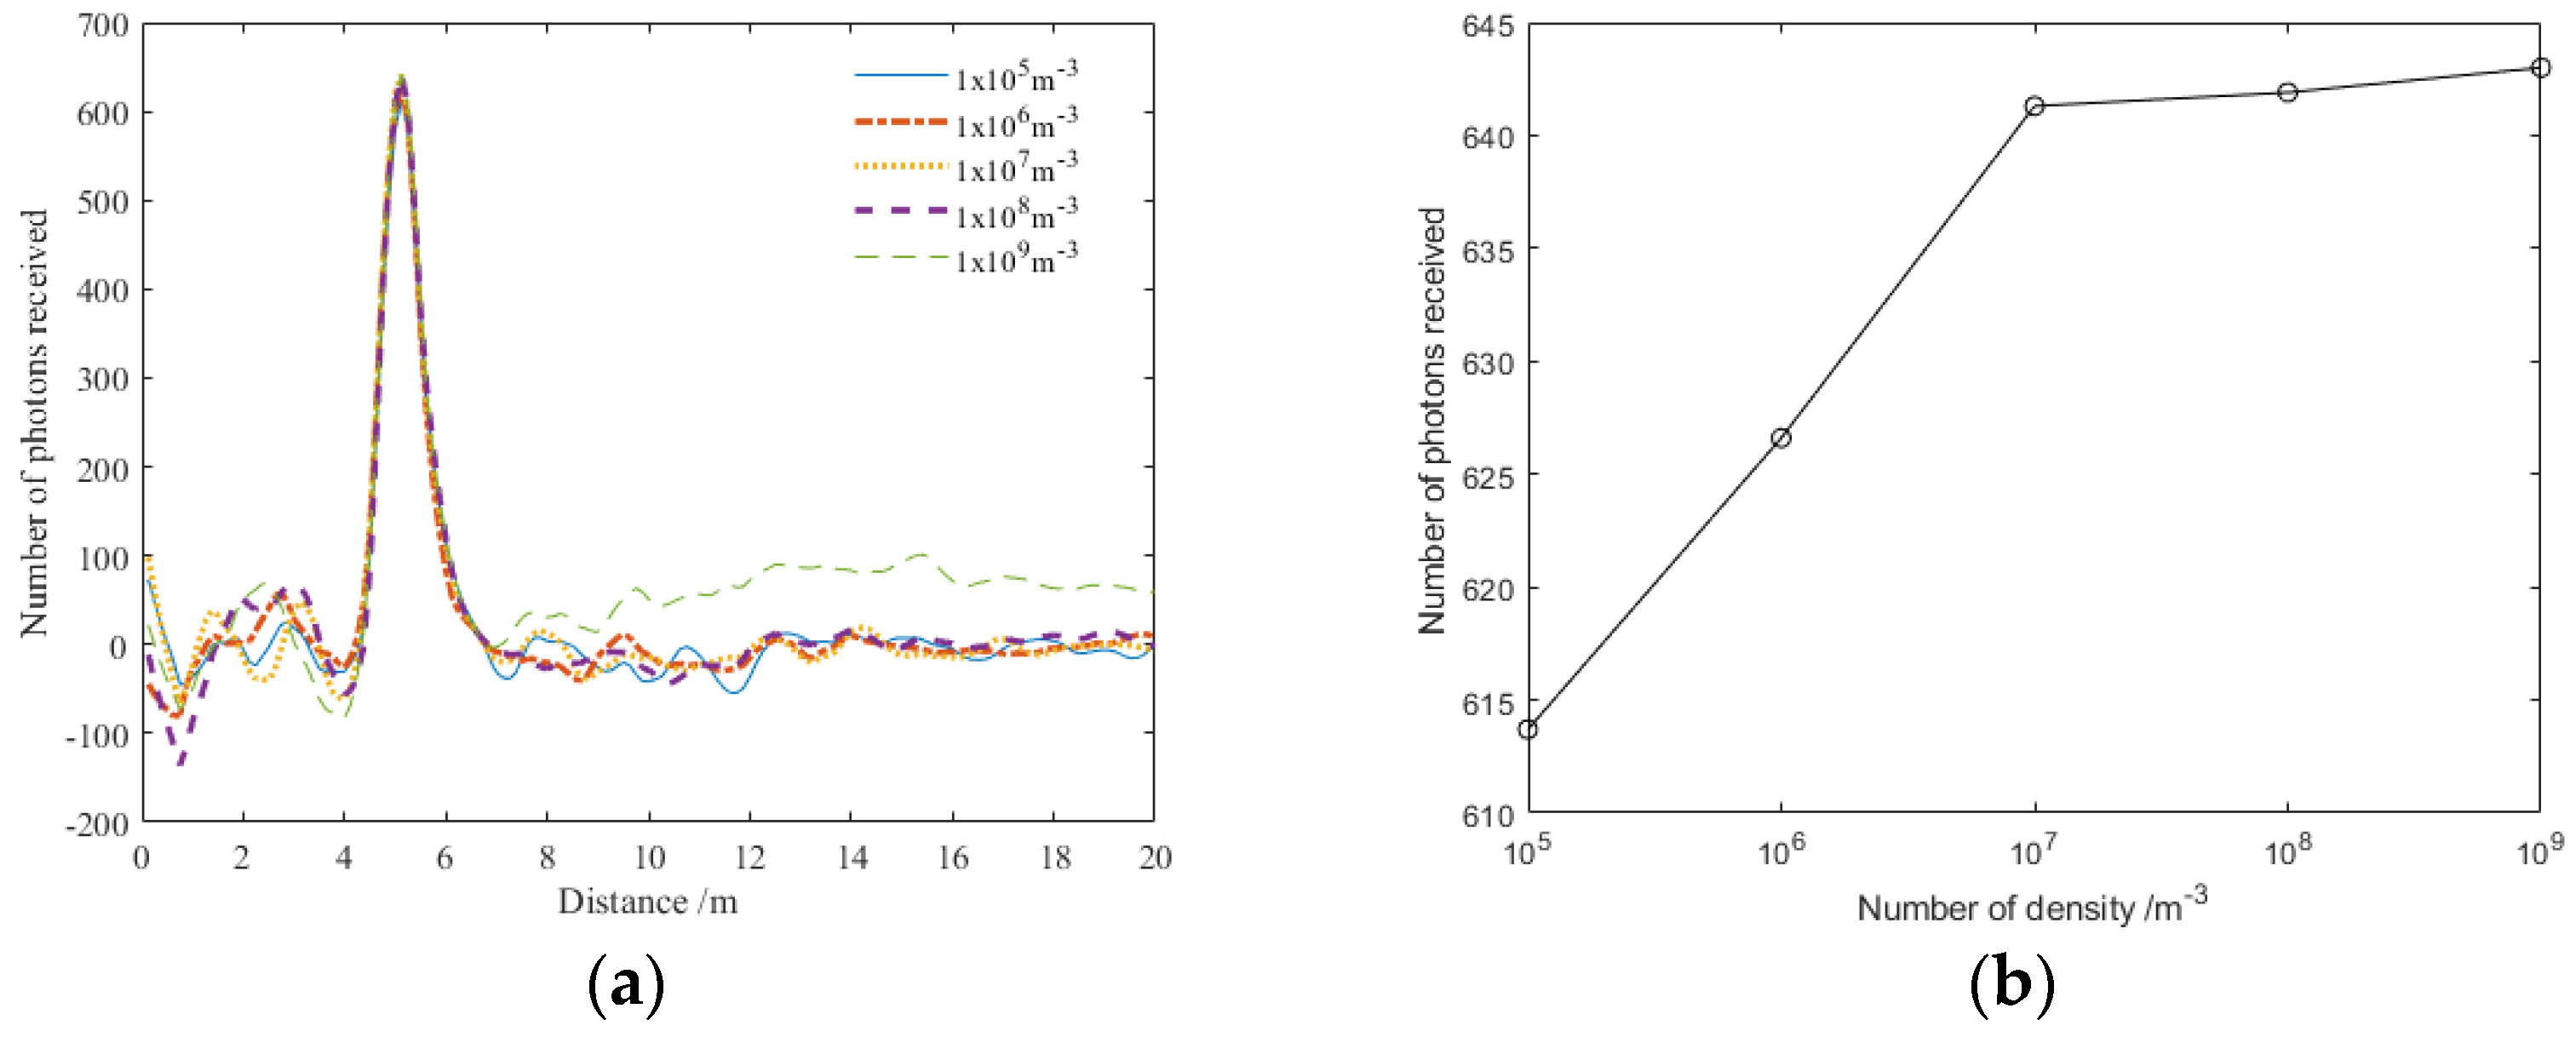
Firstly, the simulation conditions are set as follows: the bubble distance is 5 m, the bubble size is 80 μm, the bubble layer thickness is 0.3 m, and the bubble number densities are 106, 107, 108, 109 m−3, respectively. The change in laser backscattering when the bubble number density changes is analyzed. The simulation results are shown in Figure 4a, and the change trend in the peak signal after signal processing is shown in Figure 4b.
It can be found from Figure 4a that when the bubble number density increases, the peak amplitude of the laser backscatter echo signal increases continuously, but the change range is small; additionally, the pulse width remains basically unchanged. After signal processing, it is found that when the number density changes, the peak photon number changes within 1~17, and the change range is small. Its peak change trend first rises rapidly and then tends to be gentle.
- (2)
- The change in laser backscattering of bubbles with different thickness
The bubble field in a ship’s wake is a constantly changing process, and the echo characteristics of the bubble layer at different distances are different. Therefore, studying the thickness characteristics of ship wake bubbles is of great significance. The bubble layer thickness is set to be 0.1, 0.3, 0.5, 0.7, and 0.9 m, and the bubble number density is 108 m−3, with other conditions remaining unchanged. The change in laser backscattering when the thickness changes is analyzed. The simulation results are shown in Figure 5a, and the change trend of the peak signal after signal processing is shown in Figure 5b.
It can be found from Figure 5a that when the bubble thickness continues to increase, the peak amplitude of the laser backscatter echo signal continues to increase, the amplitude change is more obvious, and its pulse width also varies greatly. After signal processing, it is found that when the thickness changes, the peak photon number changes within 250~400, and the change range is large. The overall change is stronger than the change in the bubble number density. The change trend of the peak value is linear as a whole.
- (3)
- The variation in laser backscattering of bubbles with different scales
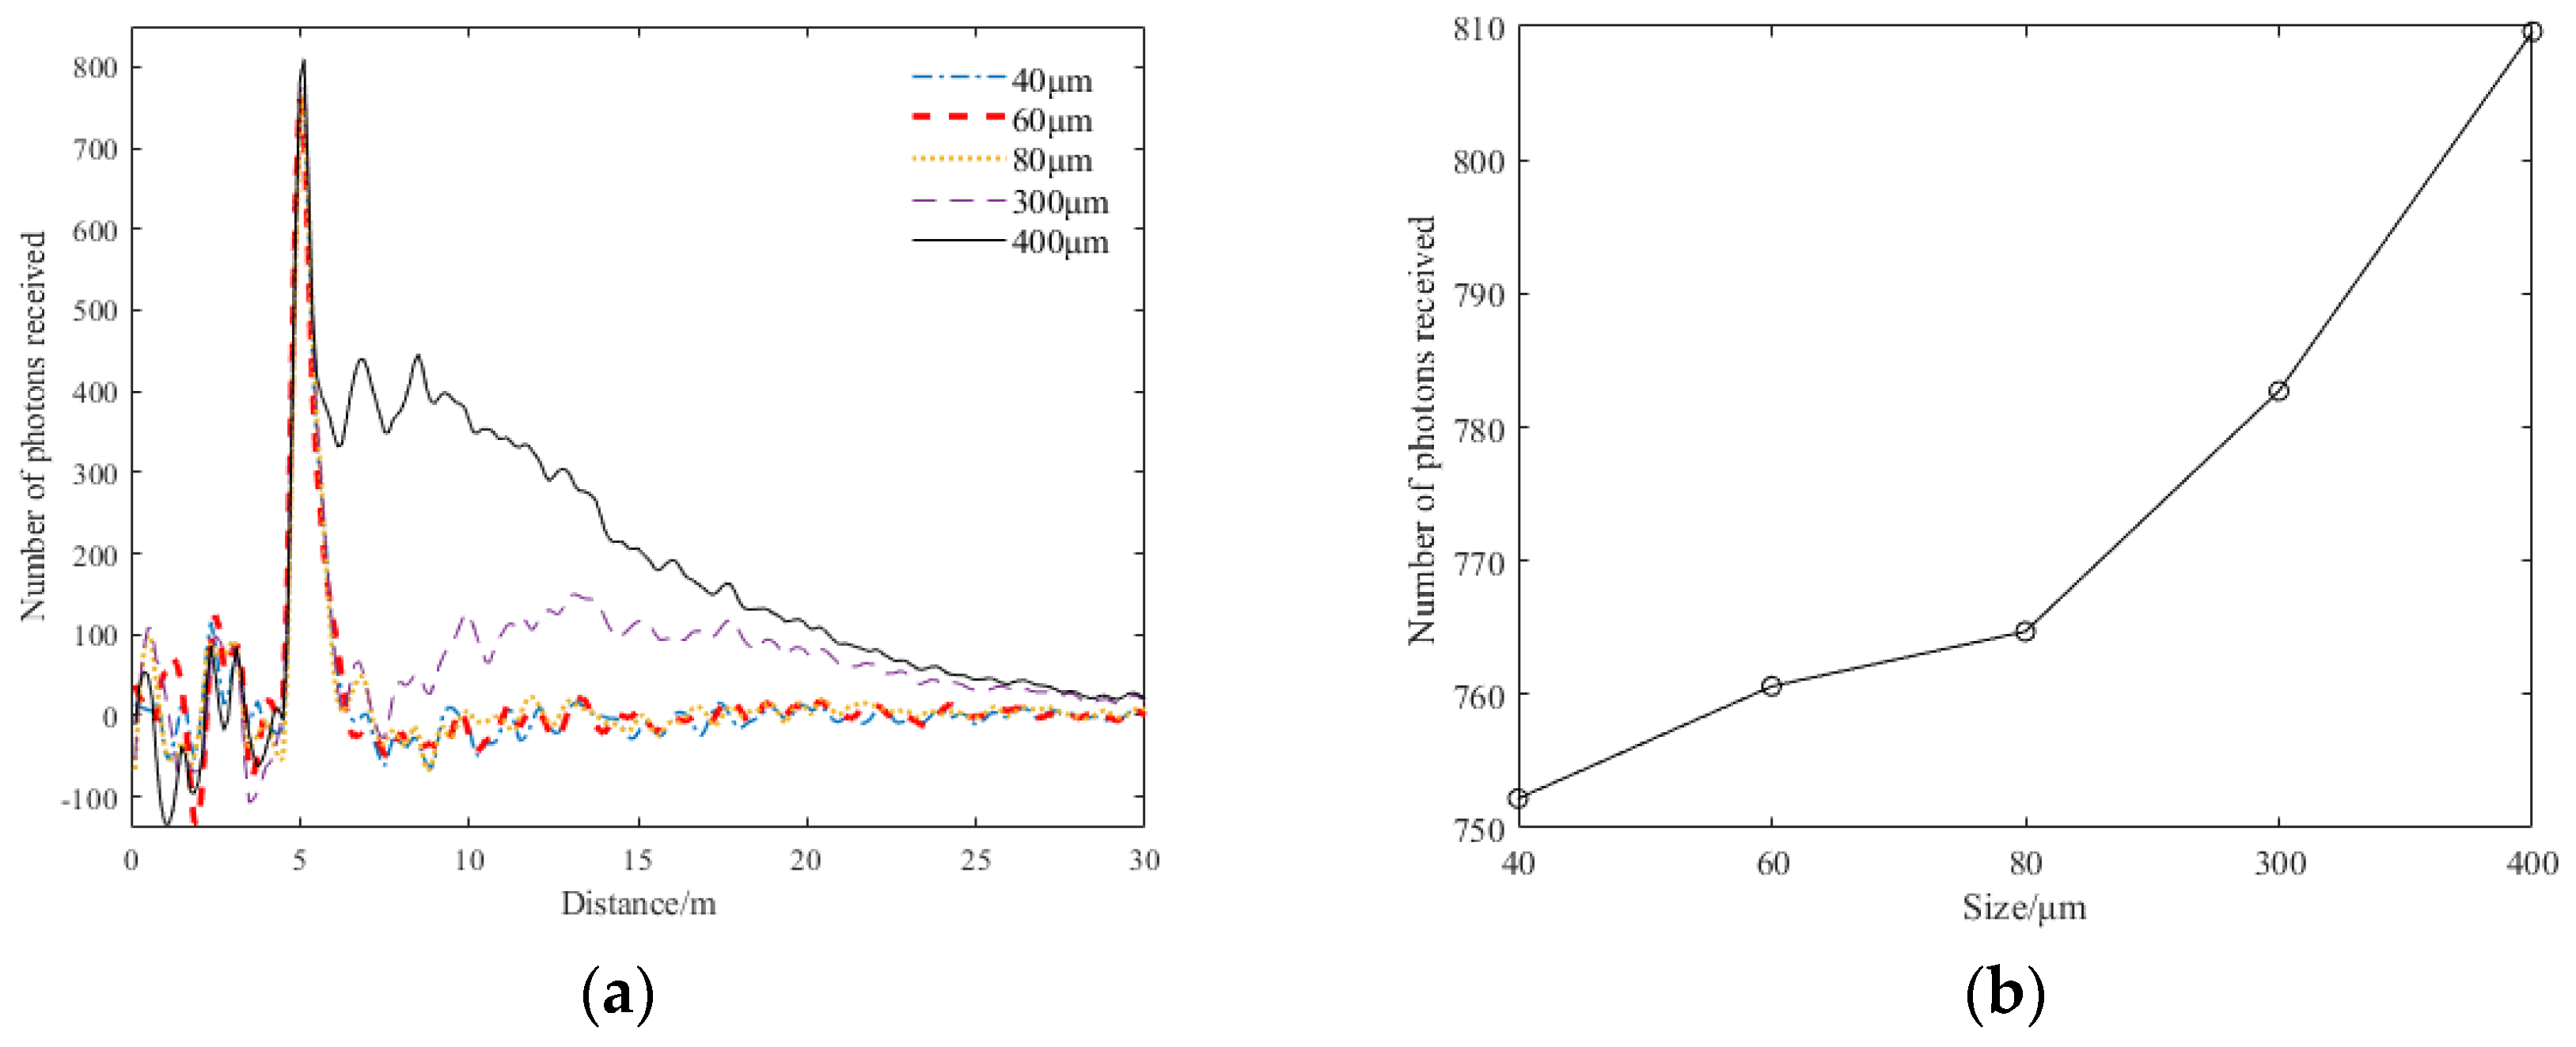
The bubble size is set to 40, 60, 800, 300, and 400 μm, and the thickness of the bubble layer is 0.3 m. Other conditions remain unchanged. The change in laser backscattering when the bubble size changes is analyzed. The simulation results are shown in Figure 6a, and the change trend of the peak signal after signal processing is shown in Figure 6b.
From Figure 6a, it can be found that when the bubble size increases, the peak amplitude of the laser backscatter echo signal increases continuously, and the amplitude change is not obvious. After signal processing, it is found that when the bubble size changes, the peak photon number changes within 10~25, and the change range is small. However, its variation is stronger than when the bubble number density changes, second only to when the bubble thickness changes. The overall peak change showed a trend of slow rise first and then rapid rise, and the pulse width showed obvious broadening. The backscattering signal of the microbubbles only changes a little, and the backscattering signal of the large-scale bubbles changes greatly. The detection effect of large bubbles is better than that of microbubbles.
In summary, when the bubble target size, bubble layer thickness, and bubble number density gradually increase, the peak amplitude of the bubble echo signal gradually becomes stronger, and the broadening phenomenon occurs when it increases to a certain extent. The change in bubble layer thickness has a great influence on the laser detection system, followed by the change in bubble size, and the change in bubble number density has the least influence.
3.3. Simulation of Laser Illumination Imaging Characteristics of Ship Wake Bubbles
- (1)
- Laser backscattering characteristics of bubbles with different number densities
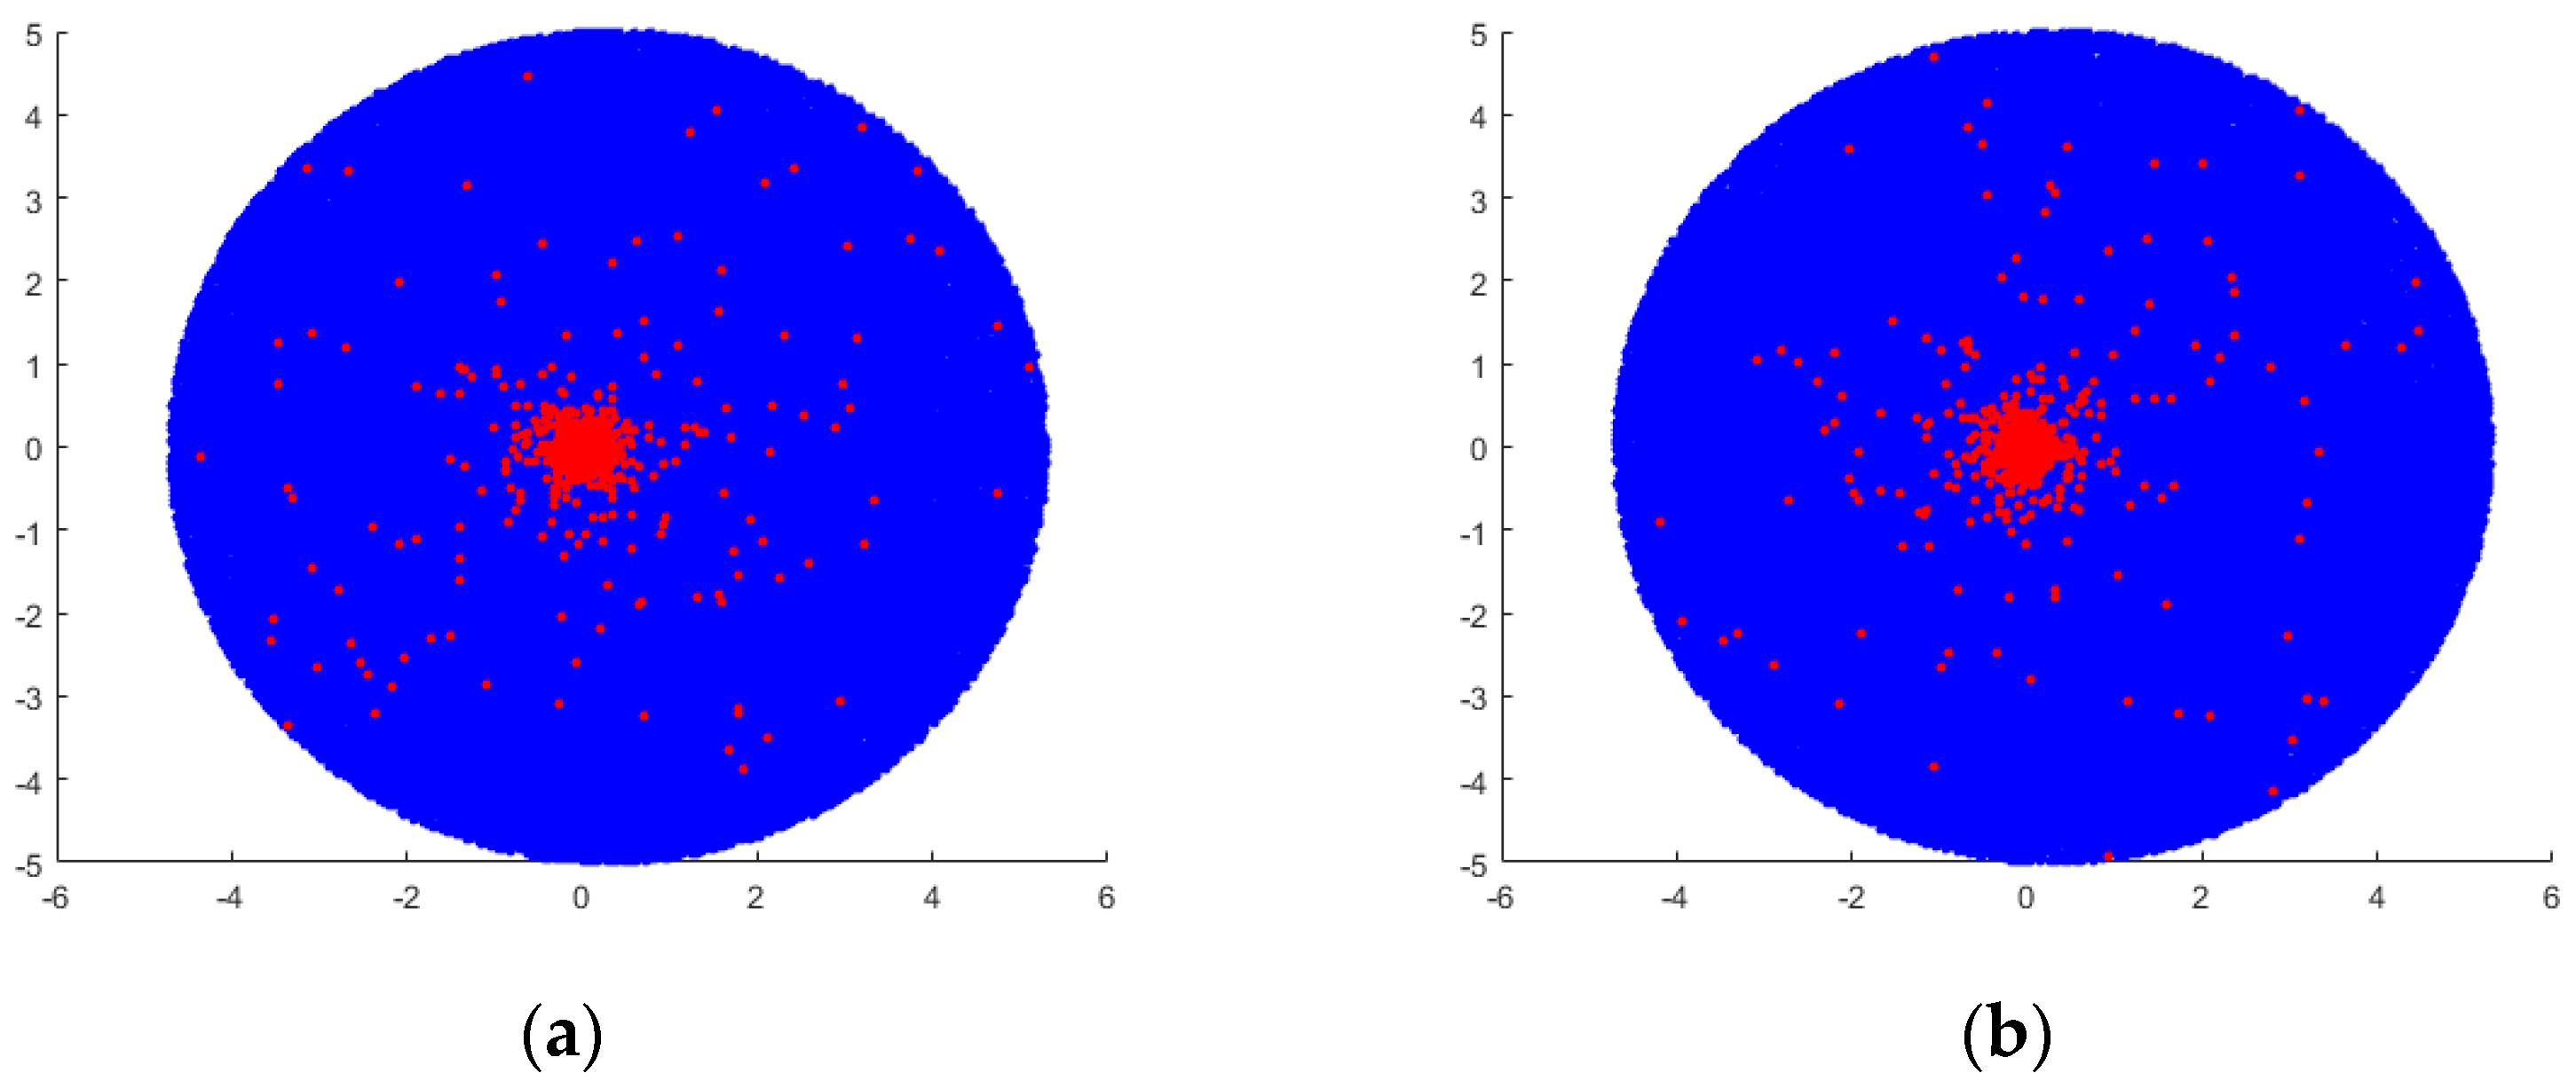
According to the above ship’s wake distribution model, the passive imaging characteristics of bubbles under different bubble number densities are studied. The bubble number density is set to 105, 106, 107, 108, and 109 m−3, the bubble layer thickness is 0.3 m, the bubble size is 80 μm, and the distance is set to 5 m. The bubble imaging simulation is shown in Figure 7, where the blue area is the receiving lens area, and the bubble imaging change is simulated by counting the photons returned to the bubble group.
From Figure 7, it can be found that as the bubble number density increases, the number of photons received by the receiving lens gradually increases, and the overall change becomes stronger and stronger. In addition, the photons in the central region become more concentrated and brighter. The number of photons in the circumferential region also increases, but their positions change more randomly. This can also be confirmed by the backscattering simulation of the above ship’s wake. From the perspective of imaging, the change is more obvious than the change in backscattering, which can make up for the defect that the amplitude of backscattering change is small when the bubble number density changes to a certain extent. It can also prevent the ship from avoiding underwater weapons by judging the change in bubble number density characteristics.
- (2)
- The change in laser backscattering of bubbles with different thickness
The backward scattering characteristics of bubbles under different bubble layer thicknesses are studied. The bubble number density is set to 108 m−3, the bubble layer thickness is 0.1, 0.3, 0.5, and 0.7 m, and the other parameters remain unchanged. The bubble imaging simulation diagram is shown in Figure 8.
From Figure 8, it can be observed that as the thickness of the bubble layer increases, the number of photons received by the receiving lens gradually increases. Additionally, the photons in the central region become more concentrated and brighter, resulting in a stronger overall change. However, the degree of this change is relatively weaker compared to that caused by variations in the bubble number density. Moreover, the number of photons in the circumferential region also increases, but their positions vary randomly. This observation corroborates the aforementioned simulation of backscattering from ships’ wakes. From the perspective of imaging, it can also be concluded that bubbles with a large thickness have a greater impact on the detection system, resulting in higher detection sensitivity.
- (3)
- The change in laser backscattering of bubbles with different sizes
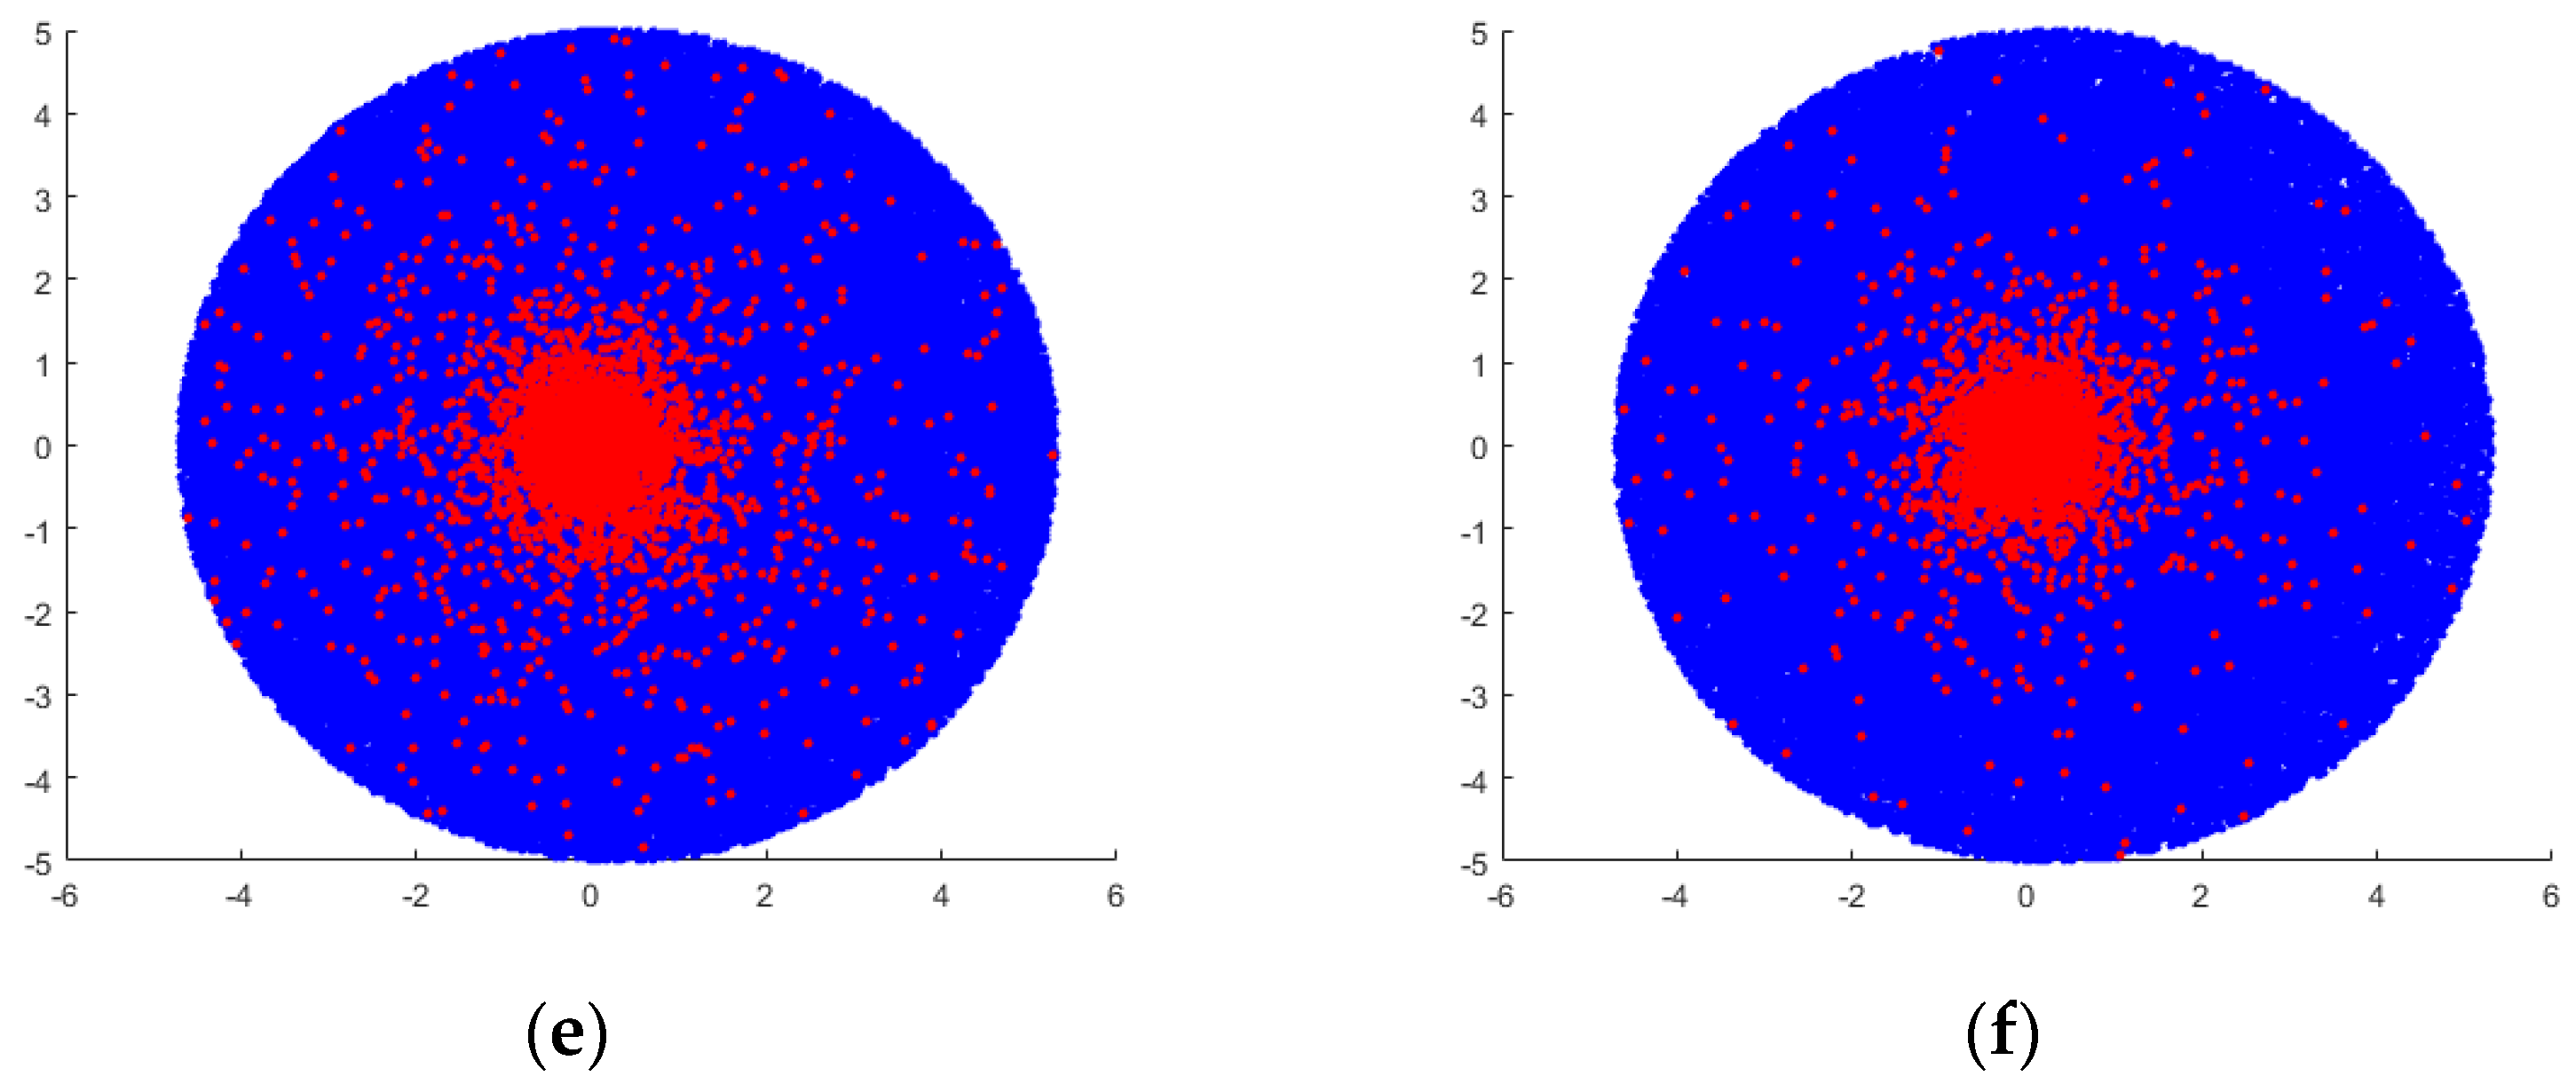
The bubble passive imaging characteristics under different bubble number densities are studied. The bubble scale is set to 40, 60, 80, 300, 400, and 500 μm, and the thickness of the bubble layer is 0.3 m. The other parameters remain unchanged. The bubble imaging simulation is shown in Figure 9.
From Figure 9, it can be observed that as the size of the bubbles increases, the number of photons received by the receiving lens gradually increases. Additionally, the photons in the central region become more concentrated and brighter, resulting in a stronger overall change. This change is more significant compared to variations in bubble layer thickness. Furthermore, the number of photons in the circumferential region also increases, but their positions vary randomly. This observation corroborates the aforementioned simulation of backscattering from ships’ wakes. From the perspective of imaging, it can be concluded that large-scale bubbles have a greater impact on the detection system compared to microbubbles, resulting in higher detection sensitivity. The imaging perspective reveals more pronounced changes compared to variations in backscattering, which can compensate for the limited change in backscattering amplitude when bubble size varies. Therefore, it may be possible to counter ships’ evasion of underwater weapons by discriminating changes in bubble size characteristics.
In summary, when the bubble target size, bubble layer thickness, and bubble number density gradually increase, the photons in the bubble-receiving lens area are more and more concentrated, the number of photons in the circumferential area increases, and the position changes are more random. This can be confirmed by the above ship’s wake backscattering simulation, which proves the feasibility of the imaging detection of bubbles. The echo characteristics of the ship’s wake bubbles in the two detection modes are different. Both of them have their own advantages and can make up for each other. The integration of the two detection modes can further exert their advantages.
4. The Design and Signal Processing Method of Laser Dual-Mode Fusion Detection System for Ships’ Wakes
4.1. Design of Ship’s Wake Laser Dual-Mode Fusion Detection System
The laser dual-mode fusion detection system for a ship’s wake mainly includes a laser transmitting device, an APD receiving system, an imaging CMOS detection receiving system, a synchronous control system, and an information processing system. The structure design is shown in Figure 10.
The laser emitting device uses a semiconductor pump laser with an emission wavelength of 532 nm, a pulse width of 8~10 ns, a repetition rate adjustable in the range of 1~5 KHz, and a laser energy adjustable between 1 and 20 mJ. The laser APD receiving system consists of an optical receiving mirror group, an optical fiber, an APD detector, and a filter device. The APD receiving gain is adjustable from 0 to 30 dB. The light reflected by the target is focused on the optical fiber through the convex lens and the filter device, and is coupled into the APD detector through the optical fiber. The imaging detection receiving module selects an industrial camera with a maximum frame rate of 814 fps and a minimum exposure time of 40 μs. The imaging detection is performed by external trigger, and the lens can be replaced according to the actual detection needs. Based on a GD32 single-chip microcomputer, a high-precision synchronous control trigger circuit is designed, which triggers the CMOS industrial camera with low exposure and high frame rate synchronously with the high peak power and high repetition frequency pulse laser to realize laser-gated imaging and effectively improve the detection image quality. Based on the MS1003 high-precision time measurement chip, a real-time ranging panel is designed to output the target distance information in real time, so that the dual-mode detection results can support each other and improve the detection reliability.
The laboratory indoor pool is shown in Figure 11. The length × width × height of the laboratory pool is 18 m × 2 m × 1.5 m. A towing vehicle is installed above the pool, which can drag the molybdenum wire plate and ceramic tube to move. The two ends of the pool are equipped with optical transmission windows, and the laser detection system can transmit and receive laser, which can simulate the underwater experiment equivalently. The bubbles generated by the molybdenum wire plate are about 30~70 μm, which can simulate the far-field wake, and the bubbles generated by the ceramic tube are about 100~300 μm, which can approximately simulate the near-field wake and simulate the occurrence of false wake.
4.2. Ship’s Wake Laser Dual-Mode Fusion Detection Signal Processing Method
4.2.1. Multi-Timescale Fusion Hierarchical Signal Processing Method
Aiming at the problems of the weak echo signal of ship’s wake bubbles, the random discrete distribution of echo signal, a large environmental interference, and a large quantity of target echo signal data, this paper proposes a multi-timescale hierarchical signal processing method. Combined with integral processing, envelope detection, mean filtering, and other methods, the fusion and discrimination of single pulse cycle millisecond micro-time scale and multi-cycle cumulative second-level macro-timescale wake characteristics are realized, which effectively improves the SBR of wake signal detection [24,25].
- (1)
- Single-cycle millisecond-scale microscopic timescale
For the single-cycle laser echo signal, the common target characteristic detection signal processing method is to detect the change in its energy peak and waveform pulse width. However, the highest SBR of these two methods is about 1.5, which is difficult to adapt to the laser echo detection of wake bubbles. In this paper, a signal processing method based on integral circuit for single-cycle millisecond micro-timescale is proposed.
SBR is the ratio of the intensity of the target signal to that of the backscattered signal from the waters in a given time or space. That is,
where is the target echo signal amplitude and is the water background signal amplitude. For wake detection, the farther the detection SBR is from 1, the greater the discrepancy between the wake signal and the background signal of the water, and the better the detection performance. However, when detecting low-density, small-scale bubble groups, the laser echo signal is very weak, and its amplitude is often similar to the water background signal. In this case, the signal-to-background ratios of both amplitude and pulse width are close to 1, making it difficult to determine whether a wake is detected.
As shown in Figure 12, in the coordinate system , the blue curve is the simulated wake echo signal with amplitude and pulse width . The red curve is the simulated water background signal with amplitude and pulse width . The amplitude SBR of the two signals in Figure 12 is as follows:
Calculating the ratio of the pulse widths of the two signals in the same way, the SBR of the pulse widths is as follows:
Approximating the two signals as sinusoids, the tail flow signal expression is as follows:
The water background signal expression is as follows:
Integrate the two signals separately in time provides the following:
The SBR of the integral values of the two signals is as follows:
Therefore, the SBR of the integral value is larger than that of the amplitude and pulse width. The integration method improves the detection SBR, which can amplify the characteristics of the wake signal and make the target easier to be recognized.
- (2)
- Continuous multi-period cumulative second-order macroscopic timescale
The change in target signal is continuous. In order to make full use of the big data brought by a high acquisition rate and reduce the influence of signal instability on the detection performance, a signal processing method of continuous multi-pulse period accumulation is proposed from the second-level timescale [26].
Firstly, the signal is processed based on the single-cycle integral circuit, and the processed signal is cached. When it is accumulated to a certain period, the envelope detection and mean filtering signal processing are performed on the multi-cycle echo signal. Combined with the envelope detection and mean filtering signal processing method, according to the set window size, the multi-cycle cumulative signal is processed to obtain the continuous change in the signal and determine whether the specified target is detected.
In this paper, a ship’s wake detection device is constructed using a high-frequency laser. When the motion speed of the detection device matches the pulse period of the laser, the signals of consecutive cycles can be approximated as the echoes of the same wake bubble. Therefore, the method first splits the signal into intervals of length : . The signal amplitude corresponding to the endpoints of each interval is . The maximum value in each interval is , . The two endpoints and the maximum point within each interval are used to fit the envelope of the signal by employing cubic spline interpolation, which maximizes the retention of the echo signal characteristics of the wake. Cubic spline interpolation is a numerical analysis method that fits discrete points into smooth curves by means of cubic polynomials. Let the cubic spline function in each interval be as follows:
Then, the cubic spline function satisfies the following three conditions:
- (1)
- Interpolation condition, i.e., ;
- (2)
- Equal values of the spline function at the common endpoints of adjacent intervals, i.e., ;
- (3)
- The curve is smooth, i.e., is continuous.
From these three conditions, the value of the cubic spline function coefficients can be derived, which in turn fits the envelope of the original echo signal.
The amplitude distribution of the fitted envelope curve still has a large dispersion affected by the original signal amplitude jitter. In order to reduce the standard deviation of the signal envelope amplitude, a sliding mean filtering algorithm is used to further smooth it. It is a filtering algorithm that takes the average of consecutive points instead of the rd point value [14]. is the size of the sliding window and must be an odd number. For example, if the value of a point is , after the sliding mean filter algorithm, the value is as follows:
The signal processing flow is shown in Figure 13.
4.2.2. Image Processing Algorithm Based on Time Difference Accumulation
Aiming at the problems of poor image contrast, blurred target edge information, and small target pixel points, and combined with the characteristics of the system’s high frame rate and short exposure time imaging conditions, an image processing method based on time difference accumulation is proposed. The principle of multi-frame image accumulation is used to effectively improve the underwater image quality under low-light conditions. The identification and judgment of the ship’s wake bubbles can effectively resist the ship’s maneuvering evasion in a certain form. The image processing flow chart is shown in Figure 14.
5. Experiment and Analysis of Ship’s Wake Dual-Mode Fusion Detection
The laser detection experiment and analysis of simulated ship’s wake bubbles are carried out for two different detection methods, and the characteristics of the ship’s wake bubbles under different detection and receiving devices are analyzed.
5.1. Laser APD Detection Experiment
The gain in the APD receiving circuit is set to 22 dB, and the current of molybdenum wire plate is set to 0.35 A. The data of the whole process from generation to disappearance of bubbles are collected and analyzed.
In Figure 15, the x-axis represents the number of sampling points, one point corresponds to 0.4 ns, and the y-axis represents the amplitude of the received signal. It shows the single-cycle image of the original signal and the single-cycle image after integral processing. It can be observed from Figure 15a that the amplitude of the echo signal is stable at about 0.3 V and the pulse width is about 16 ns when the bubble generating device is not turned on. When the bubble generating device is turned on, the amplitude of the echo signal continuously jumps between 0.5 and 0.8 V, the pulse width continuously jumps between 18 and 22 ns, and the detection SBR can reach up to 2.67. It is observed from Figure 15b that after the signal is processed by the integral circuit, the amplitude of the echo signal is about 7.5 V·s when the bubble generating device is not turned on. When the bubble generating device is turned on, the amplitude of the echo signal jumps violently between 13 and 23 V·s, and the maximum detection SBR can reach 3.26. After integral processing, the SBR is increased by about 1.22 times.
After transmitting all the collected signals to the computer, the envelope detection and mean filtering processing are performed to obtain the echo signal image, as shown in Figure 16.
It can be observed from Figure 16 that when the bubble generating device is not opened, the echo signal is very stable as a whole and remains floating around 0.29 V; when the bubble generating device is turned on, the amplitude of the echo signal will rise rapidly to 0.5~0.8 V, up to about 0.88 V, and the echo signal has obvious violent jitter. The received energy oscillation is mainly related to the number of bubbles generated by molybdenum wire electrolysis. When the bubble generating device is closed, the signal will quickly return to a stable state, and the detection SBR can reach up to 3.26. After signal processing, the signal change trend in the detection system tracking the ship’s wake can be seen more intuitively, but the existence of false wake cannot be effectively judged.
5.2. Image Detection Module Results
The molybdenum wire plate is placed at a distance of 10 m from the detection system, and the current is constant at 0.35 A. After a period of time, the ceramic tube is placed near the molybdenum wire plate, and the ceramic tube is used to simulate the false wake flow for about 20 s, then the ceramic tube is closed. The results collected before electrification are shown in Figure 17a, the results obtained after electrification are shown in Figure 17b, the results of generating simulated false wakes are shown in Figure 17c, and the results obtained after Gaussian filtering and adaptive threshold segmentation are shown in Figure 17d. By comparing the three images, it is found that when there are weak bubbles in the field of view, due to the influence of the optical characteristics of the bubbles themselves, the laser echo will be enhanced, thus showing an increase in the gray value on the image. In order to further verify the feasibility of the method, multi-frame images are processed, and the changes in the maximum and minimum gray values in the image are counted. The results are shown in Figure 17. At this time, the SBR can reach up to about 16, and the detection SBR is nearly 5 times higher than that of the laser adaptive detection mode. The up and down beats of the maximum and minimum gray values are caused by the fact that there are not always target bubbles at the focus, and the reliability is worse than that of the laser APD detection mode. When the false wake occurs, the detection SBR can reach up to 31, and the detection SBR is 10 times higher than that of the laser adaptive detection mode. When the false wake occurs, the detection SBR is nearly 2 times higher than that of the simulated wake detection SBR, and the change is obvious. After passing through the junction of the simulated wake and the false wake, the signal amplitude gradually decreases and slowly recovers to the simulated wake signal change. According to [1], when the detection system is gradually close to the ship, the stronger the laser echo signal is, the overall signal change is similar to a slow upward trend. When there is a false wake, there will be an obvious ‘bump’ in the signal change. It is verified that the detection mode has a good detection SBR and can effectively resist the existence of false wakes, which reduces the false alarm rate of laser tracking detection of ship’s wakes.
Through the analysis of simulation and outdoor experimental data, the multi-timescale hierarchical signal processing method can simultaneously detect and identify remote sparse, discrete microbubbles and short-range dense, continuous large bubbles at the millisecond timescale. Through multi-period cumulative processing analysis at the second timescale, the detection SBR is further improved, and it has strong environmental adaptability and real-time processing capability. The results obtained by the image processing algorithm based on time difference accumulation can also identify the existence of false wakes and improve the detection SBR. Through the analysis of simulation and outdoor experimental data:
- the multi-timescale hierarchical signal processing method can simultaneously detect and identify remote sparse, discrete microbubbles and short-range dense, continuous large bubbles at the millisecond timescale;
- through multi-period cumulative processing analysis at the second timescale, the detection SBR is further improved, and it has strong environmental adaptability and real-time processing capability;
- the results obtained by the image processing algorithm based on time difference accumulation can also identify the existence of false wakes and improve the detection SBR.
By combining the advantages of the two methods, the detection SBR of the ship’s wake can be further improved and the false alarm rate of the laser detection of the ship’s wake can be reduced.
6. Conclusions
This article focuses on the application background of laser guidance for ship’s wake bubbles. It studies the laser backscatter characteristics and illumination imaging characteristics of ship’s wake bubbles with different distances, scales, number densities, and thicknesses. The results indicate that as the target size of the bubbles, the thickness of the bubble layer, and the bubble number density gradually increase, the peak amplitude of the bubble echo signal gradually becomes stronger. However, when it increases to a certain extent, a broadening phenomenon occurs. Additionally, the photons within the receiving lens area of the bubbles become more concentrated, and the number of photons in the circumferential area increases. The position of these photons varies more randomly. The echo characteristics of ship’s wake bubbles differ between the two detection methods, each having its own advantages that can complement each other. Integrating these two detection modes can further enhance their benefits.
A dual-mode fusion detection experimental platform for laser detection of ship’s wake bubbles has been established. Methods based on multi-timescale hierarchical signal processing and algorithms based on time differential cumulative gating image processing have been proposed. Tests and verification analyses have been conducted on the bubbles. The results show that the detection SBR under the laser adaptive detection mode can reach up to 3.26, but it cannot distinguish false wakes. The SBR under the imaging mode can reach approximately 16, and when a false wake appears, the maximum detection SBR can reach 31. The experiments demonstrate that the dual-mode fusion detection of ship’s wake bubbles using lasers can effectively enhance the detection SNR and effectively counter ship-maneuver evasion methods to a certain extent. It achieves effective detection and real-time signal processing of ship’s wake bubble targets of different magnitudes with high sensitivity, a large dynamic range, high resolution, and a large field of view against a strong reverberation background. This verifies the feasibility of the dual-mode fusion detection mode.
In future work, control experiments or simulations under different lighting conditions will be conducted to address issues related to image color degradation.
Author Contributions
Conceptualization, writing—review and editing, X.Z.; investigation, writing—original draft, X.Z.; methodology, S.Z.; supervision, Z.D., S.Y. and B.C. All authors have read and agreed to the published version of the manuscript.
Funding
This research received no external funding.
Institutional Review Board Statement
Not applicable.
Informed Consent Statement
Not applicable.
Data Availability Statement
The data presented in this study are available on request from the corresponding author.
Conflicts of Interest
The authors declare no conflicts of interest.
References
- Zong, S.G.; Zhang, X.; Cao, J. Method and experiment of laser detection and tracking of ship wake. Infrared Laser Eng. 2023, 52, 205–216. [Google Scholar]
- Wang, Y.Q.; Zhang, J.H.; Zheng, Y.C. Brillouin scattering spectrum for liquid detection and applications in oceanography. Opto-Electron. Adv. 2023, 6, 220016. [Google Scholar] [CrossRef]
- Wang, Y.Q.; Xu, Y.R.; Chen, P. Remote Sensing of Seawater Temperature and Salinity Profiles by the Brillouin Lidar Based on a Fizeau Interferometer and Multichannel Photomultiplier Tube. Sensors 2023, 23, 446. [Google Scholar] [CrossRef] [PubMed]
- Guo, R. Study on Wake Characteristics and Optical Properties of Underwater Vehicle. Master’s Thesis, Xidian University, Xi’an, China, 2022. [Google Scholar]
- Zhang, J.S.; Sun, J.P.; Chen, Y. The dynamic characteristics of forward light scattering of bubble screen are simulated based on CMOS detection. Acta Phot. Sin 2014, 43, 26. [Google Scholar]
- Abbaszadeh, M.; Alishahi, M.M.; Emdad, H. Experimental investigations on the bubbly wake of a transom stern model using optical laser beam scattering characteristics. Appl. Ocean Res. 2020, 104, 102380. [Google Scholar] [CrossRef]
- Chaussonnet, G.; Mees, L.; Šormaz, M. Modeling multiple scattering transient of an ultrashort laser pulse by spherical particles. J. Comput. Phys. 2022, 457, 110696. [Google Scholar] [CrossRef]
- Zhang, Y.B.; Li, S.N.; Jiang, P. Underwater bubbles recognition based on PCA feature extraction and elastic BP neural network. Infrared Laser Eng. 2020, 49, 187–192. [Google Scholar]
- Rao, J.H.; Yang, K.C.; Zhang, X.H.; Xu, D.S.; Xia, M.; Zheng, Y. Simulation of ship bubble wake using pulse laser detection. Opt. Optoelectron. Technol. 2007, 5, 40–42. [Google Scholar]
- Zong, S.G.; Zhang, X.; Liang, S.Y. Laser Detection Simulation and Experiment of Multiscale Complex Water Wake Bubble. Chin. J. Lasers 2023, 50, 71–81. [Google Scholar]
- Zong, S.G.; Zhang, X.; Yang, S.P. Laser backscattering characteristics of ship wake bubble target. Chin. Opt. 2023, 16, 1333–1342. [Google Scholar]
- Xu, J.Q.; Witschas, B.; Kabelka, P.G. High-spectral-resolution lidar for measuring tropospheric temperature profiles by means of Rayleigh–Brillouin scattering. Opt. Lett. 2021, 46, 3320–3323. [Google Scholar] [CrossRef] [PubMed]
- Liang, K.; Zhang, R.; Sun, Q. Brillouin shift and linewidth measurement based on double-edge detection technology in seawater. Appl. Phys. B 2020, 126, 160. [Google Scholar] [CrossRef]
- Yi, X.; Li, Z.; Liu, Z. Underwater optical communication performance for laser beam propagation through weak oceanic turbulence. Appl. Opt. 2015, 54, 1273–1278. [Google Scholar] [CrossRef] [PubMed]
- Ma, W.X.; Chang, X.; Wang, W.Q. Study on the influence of shaft brackets on the scale effect of the four-screw ship wake field. Ocean Eng. 2023, 287, 115881. [Google Scholar] [CrossRef]
- Chen, P.; Li, X.; Zhang, G. Rapid detection to long ship wake in synthetic aperture radar satellite imagery. J. Oceanol. Limnol. 2019, 37, 1523–1532. [Google Scholar] [CrossRef]
- Zhang, Q.; Wang, Y.M. Multi bubble model and finite element analysis in wake. Torpedo Technol. 2014, 22, 316–320. [Google Scholar]
- Gumulya, M.; Joshi, J.B.; Utikar, R.P. Bubbles in viscous liquids: Time dependent behaviour and wake characteristics. Chem. Eng. Sci. 2016, 144, 298–309. [Google Scholar] [CrossRef]
- Issa, V.; Daya, Z.A. Modeling the ship white water wake in the midwave infrar. Appl. Opt. 2018, 57, 10125–10134. [Google Scholar] [CrossRef] [PubMed]
- Song, M.Z.; Guo, R.; Ma, X.R. Polarization reflection distribution characteristics of wakes on the sea surface. Appl. Opt. 2022, 61, 7748–7756. [Google Scholar] [CrossRef]
- Zhang, X.X.; Wu, Z.S.; Su, X. Influence of Breaking Waves and Wake Bubbles on Surface-Ship Wake Scattering at Low Grazing Angles. Chin. Phys. Lett. 2018, 35, 32–35. [Google Scholar] [CrossRef]
- Pena, B.; Muk-Pavic, E.; Thomas, G. An approach for the accurate investigation of full-scale ship boundary layers and wakes. Ocean Eng. 2020, 214, 107854. [Google Scholar] [CrossRef]
- Zong, S.G.; Chen, B.; Zhang, X.; Duan, Z.; Yang, S.; Li, X. Laser forward and backward scattering characteristics and experimental study of bubbles in ship wake. Ocean Eng. 2024, 63, 1795. [Google Scholar] [CrossRef] [PubMed]
- Liu, H.; Zhang, Y.; Wei, Y.; Mu, Z.; Yang, Y.; Farooq, M.S. Characteristics and mechanisms of the zigzag and spiral movement of rising bubbles in still water. Appl. Opt. 2023, 13, 6500. [Google Scholar] [CrossRef]
- Sun, X.; Cai, M.; Wang, J.; Liu, C. Numerical simulation of the kelvin wake patterns. Appl. Sci. 2022, 12, 6265. [Google Scholar] [CrossRef]
- Sun, X.; Cai, M.; Ding, J. A GPU-Accelerated method for 3D nonlinear kelvin ship wake patterns simulation. Appl. Sci. 2023, 13, 12148. [Google Scholar] [CrossRef]
Figure 1.
False wake confrontation form:(1) Wake junction; (2) Wake junction; (3) Wake junction; (4): Wake junction.
Figure 1.
False wake confrontation form:(1) Wake junction; (2) Wake junction; (3) Wake junction; (4): Wake junction.

Figure 2.
Annular wake confrontation form: (1) Wake junction.

Figure 3.
Program diagram of photon-simulated motion.

Figure 4.
The backscattering echo characteristics under different number densities: (a) the change diagram of backscattering signal; (b) peak signal changes.
Figure 4.
The backscattering echo characteristics under different number densities: (a) the change diagram of backscattering signal; (b) peak signal changes.

Figure 5.
Backscattering echo characteristics under different thicknesses: (a) backscattering signal change diagram; (b) peak signal changes.
Figure 5.
Backscattering echo characteristics under different thicknesses: (a) backscattering signal change diagram; (b) peak signal changes.

Figure 6.
Backscattering echo characteristics under different bubble size changes: (a) backscattering signal change diagram; (b) peak signal changes.
Figure 6.
Backscattering echo characteristics under different bubble size changes: (a) backscattering signal change diagram; (b) peak signal changes.

Figure 7.
Bubble imaging characteristics under different bubble number densities: (a) 105 m−3; (b) 106 m−3; (c) 107 m−3; (d) 108 m−3; (e) 109 m−3.
Figure 7.
Bubble imaging characteristics under different bubble number densities: (a) 105 m−3; (b) 106 m−3; (c) 107 m−3; (d) 108 m−3; (e) 109 m−3.


Figure 8.
Bubble imaging characteristics under different thickness of bubble layer: (a) 0.1 m; (b) 0.3 m; (c) 0.5 m; (d) 0.7 m.
Figure 8.
Bubble imaging characteristics under different thickness of bubble layer: (a) 0.1 m; (b) 0.3 m; (c) 0.5 m; (d) 0.7 m.


Figure 9.
Bubble passive imaging characteristics under different bubble size changes: (a) 40 μm; (b) 60 μm; (c) 80 μm; (d) 300 μm; (e) 400 μm;(f) 500 μm.
Figure 9.
Bubble passive imaging characteristics under different bubble size changes: (a) 40 μm; (b) 60 μm; (c) 80 μm; (d) 300 μm; (e) 400 μm;(f) 500 μm.


Figure 10.
System construction of the detection and receiving module: (a) overall design of the detection system; (b) physical picture of laboratory pool and equipment.
Figure 10.
System construction of the detection and receiving module: (a) overall design of the detection system; (b) physical picture of laboratory pool and equipment.

Figure 11.
Laser detection test system in pool.

Figure 12.
One-cycle echo curve of wake and water background.

Figure 13.
Flow chart of signal processing method.

Figure 14.
The image processing flow chart.

Figure 15.
Comparison of background signals between bubbles and water bodies: (a) original waveform; (b) waveform after integral output.
Figure 15.
Comparison of background signals between bubbles and water bodies: (a) original waveform; (b) waveform after integral output.

Figure 16.
Multi-period echo signal image.

Figure 17.
Change in maximum gray value. (a) unprocessed image; (b) gaussian filtering adaptive thresholding; (c) multi-frame accumulation; (d) final processing diagram.
Figure 17.
Change in maximum gray value. (a) unprocessed image; (b) gaussian filtering adaptive thresholding; (c) multi-frame accumulation; (d) final processing diagram.

Disclaimer/Publisher’s Note: The statements, opinions and data contained in all publications are solely those of the individual author(s) and contributor(s) and not of MDPI and/or the editor(s). MDPI and/or the editor(s) disclaim responsibility for any injury to people or property resulting from any ideas, methods, instructions or products referred to in the content. |
© 2024 by the authors. Licensee MDPI, Basel, Switzerland. This article is an open access article distributed under the terms and conditions of the Creative Commons Attribution (CC BY) license (https://creativecommons.org/licenses/by/4.0/).
Share and Cite
MDPI and ACS Style
Zong, S.; Zhang, X.; Duan, Z.; Yang, S.; Chen, B. Research on Laser Dual-Mode Fusion Detection Method of Ship Wake Bubbles. Appl. Sci. 2024, 14, 3695. https://0-doi-org.brum.beds.ac.uk/10.3390/app14093695
AMA Style
Zong S, Zhang X, Duan Z, Yang S, Chen B. Research on Laser Dual-Mode Fusion Detection Method of Ship Wake Bubbles. Applied Sciences. 2024; 14(9):3695. https://0-doi-org.brum.beds.ac.uk/10.3390/app14093695
Chicago/Turabian StyleZong, Siguang, Xin Zhang, Zike Duan, Shaopeng Yang, and Bao Chen. 2024. "Research on Laser Dual-Mode Fusion Detection Method of Ship Wake Bubbles" Applied Sciences 14, no. 9: 3695. https://0-doi-org.brum.beds.ac.uk/10.3390/app14093695
Note that from the first issue of 2016, this journal uses article numbers instead of page numbers. See further details here.