
Mathematical Modeling of SOIC Package Dynamics in Dielectric Fluids during High-Voltage Insulation Testing

Electrical and Computer Engineering Department, University of Puerto Rico Mayagüez, Mayagüez, PR 00681, USA
*
Author to whom correspondence should be addressed.
Appl. Sci. 2024, 14(9), 3693; https://0-doi-org.brum.beds.ac.uk/10.3390/app14093693
Submission received: 19 February 2024
/
Revised: 16 April 2024
/
Accepted: 23 April 2024
/
Published: 26 April 2024
(This article belongs to the Special Issue Disruptive Trends in Automation Technology)
Abstract
:The efficient testing and validation of the high-voltage (HV) insulation of small-outline integrated circuit (SOIC) packages presents numerous challenges when trying to achieve faster and more accurate processes. The complex behavior these packages when submerged in diverse physical media with varying densities requires a detailed analysis to understand the factors influencing their behavior. We propose a systematic and scalable mathematical model based on trapezoidal motion patterns and a deterministic analysis of hydrodynamic forces to predict SOIC package misalignment during automated high-voltage testing in a dielectric fluid. Our model incorporates factors known to cause misalignment during the maneuvering of packages, such as surface tension forces, sloshing, cavity formation, surface waves, and bubbles during the insertion, extraction, and displacement of devices while optimizing test speed for minimum testing time. Our model was validated via a full-factorial statistical experiment for different SOIC package sizes on a pick-and-place (PNP) machine with preprogrammed software and a zero-insertion force socket immersed in different dielectric fluids under controlled thermal conditions. Results indicate the model achieves 99.64% reliability with a margin of error of less than 4.78%. Our research deepens the knowledge and understanding of the physical and hydrodynamic factors that impact the automated testing processes of high-voltage insulator SOIC packages of different sizes for different dielectric fluids. It enables improved testing times and higher reliability than traditional trial-and-error methods for high-voltage SOIC packages, leading to more efficient and accurate processes in the electronics industry.
1. Introduction
The automated testing and validation of high-voltage (HV) integrated circuits (ICs) has enabled unprecedented growth and efficacy in the power electronics industry. Despite the advances made in the last decade, there still exist multiple avenues that hold promise in further improving the testing processes of HV reinforced insulating barrier IC packages [1]. The demand for efficient testing methods for electronic devices operating at voltages up to 20 kV has experienced significant growth in recent years, particularly in low-profile power electronics devices [2,3]. The prevention of arcing in the narrow gaps of small-outline integrated circuit (SOIC) packages during high-voltage tests is an essential requirement to meet the International Electrotechnical Commission (IEC) VDE 0884-11 standard [4]. This necessity has heightened the interest in efficient testing methods for the introduction of new-generation insulating materials. Controlled HV testing of small components has required submerging the device under test (DUT) in a dielectric fluid to prevent electric arcs [5]. However, optimizing the maneuverability of small components under such conditions is a challenging task due to the myriad of factors that come into play when attempting to predict their dynamic behavior [6].
Recent research in electronics manufacturing and testing has made significant strides, particularly in dielectric fluids and IC manipulation studies. Azmi et al. studied the breakdown voltage of dielectric oils and underscored the superior performance of FR3 over mineral and vegetable oils in high-voltage applications [7]. Haegele et al. complemented this finding with research on the aging of natural vegetable oils, demonstrating that oils like FR3 possess greater dielectric strength and better dissipation factors, albeit with susceptibility to changes due to humidity, oxidation, and viscosity over time [8]. As for integrated circuit testing, Kamath et al. delved into the resilience of insulators in FR3 fluid, a crucial step in preventing electrical arcing and IC damage [2].
Likewise, the employment of pick-and-place machines in the manipulation of electronic components has been the focus of numerous studies in technical literature, underscoring the importance of precision, timelines, and speed engineering algorithm manipulation [9,10,11,12,13,14]. Parallel advancements in micromanipulation technologies have also helped improve the field. Masood et al. worked on the development of thermodynamic microgrippers, which have played a pivotal role in precise component placement within fluids [15]. Their work sparked further interest in precision studies, such as those led by Nally et al., who explored the integration of vision systems in pick-and-place systems for parallel system assembly [16].
Together, these studies highlight the crucial need for ongoing innovation and refinement in high-voltage IC testing methods, underscoring the importance of material properties, precision engineering, and advanced test methods for reliable and efficient IC test and electronic systems development. The previously reviewed studies, however, do not provide information on how to establish a speed at which a package can travel in a dielectric fluid without exceeding the maximum allowed misalignment to guarantee successful insertion into the test socket or for successful removal, preventing detachment from the pneumatic holder.
Our research addresses the challenges posed by the automation of the manufacturing and validation processes, especially in SOIC package handling capable of withstanding high stresses. The proposed study aims to improve the efficiency and accuracy of high-stress testing methods by addressing the complex hydrodynamic interactions that develop during the movement of these packages in dielectric fluids and optimizing the testing process.
We addressed the problem of establishing the maximum speed at which a DUT can be displaced to prevent exceeding the maximum misalignment allowed for SOIC packages during automated insertion and removal from a zero-insertion force (ZIF) socket immersed in a dielectric fluid. Our approach was to understand and quantify the factors affecting such a misalignment, focusing on the interactions occurring during the DUT movement into, inside, and out from the fluid. We characterized stress forces, splashes, cavity formation, and surface waves that limit the speed and precision of their manipulation. We hypothesize that it is possible to predict the resulting misalignment based on an analysis of the physical properties of the dielectric fluid and its interaction with the SOIC packages.
This research used a methodology that involves the creation of an innovative mathematical model for the automated testing of SOIC packages in dielectric fluids, integrating mechanical and hydrodynamic aspects with standardized test procedures and thorough reliability assessments. It includes a comprehensive evaluation of the insertion, extraction, and displacement processes for SOIC packages in various dielectric fluids. The methodology involves the construction of a specialized automated mechanical platform designed for precision testing, incorporating thermal control of the dielectric fluids. It also involves meticulous data collection and the application of comprehensive statistical methods, such as analysis of variance and frequency distribution, through a full factorial experimental design to confirm the validity of the model.
This research is an important step forward in high-voltage IC testing, particularly in automated SOIC package handling in dielectric fluids. This study achieves an exceptional reliability of 99.64% with a margin of error of less than 4.78%. This study is notable for the implementation of a forward automated system that achieves vertical movements at a speed of 0.2882 m/s and is characterized by its ability to consistently manipulate packages quickly and accurately. In addition, this research contributes significantly to the standardization of calculations for optimum test speeds and highlights the limitations of high-speed package handling.
The rest of this document is organized as follows: Section 2 establishes the theoretical foundations for the model. Section 3 describes the development of the mathematical model for hydrodynamic force analysis. The following section discusses the statistical model validation and the results from the model application and assesses model consistency and repeatability. The final sections compare misalignment speeds across various models and summarize the essential conclusions and implications.
2. Mathematical Preliminaries
In this section, we present the mathematical concepts used for the scalable formulation leading to the generation of the proposed mathematical model.
2.1. Effects of Dielectric Fluids
The physical properties of dielectric fluids, such as surface tension, mass density, volume, temperature, and viscosity, can significantly impact the dynamics of packages undergoing a submerged high-voltage testing process. This statement takes particular significance for small-outline integrated circuit (SOIC) packages, as even small shifts have the potential to cause misalignment before they reach their intended position. Dielectric fluids undergo molecular property changes due to the pressure exerted by the surface topology of a device under test (DUT). Although there is no static friction between a solid and a liquid, even a small force can result in a transfer of momentum with slight acceleration, causing the fluid’s velocity to increase linearly with depth [8].
2.1.1. Interfacial Tension
Molecular attraction at the solid–liquid interfaces, particularly between the DUT and the dielectric fluid’s surface, causes interfacial tension (IFT). Surface tension influences several factors, including the dielectric fluid’s characteristics, environmental conditions, viscosity–temperature coefficient (VTC), and the DUT’s contact area.
Surface tension induces fluid movement, generating additional reflected forces acting both normally and tangentially on the device’s surface. The excess reflected forces introduce surface energy, which gradually causes the DUT to deviate from its initial position [17].
Two main factors, the drag coefficient (or resistance) and the drag force the device exerts on the fluid, influence the flow around a SOIC package. The friction factor represents the ratio between the fluid’s kinetic energy per unit volume of the SOIC and the drag force exerted per unit area:
where represents the force resulting from the fluid’s motion, A is the characteristic area of the wet surface projected on a plane perpendicular to the fluid’s approach velocity, and denotes the characteristic kinetic energy per unit volume [18]. is obtained as
where represents the fluid’s approximate external velocity and represents its density.
2.1.2. Dynamics of the Conservation of Mass and Momentum
The mass, density, and volume dynamics directly influence the behavior of an IC package submerged in a dielectric fluid. Unlike the DUT, the dielectric fluid can change its shape, but the volume of liquid displaced by the DUT remains constant. As the DUT mass remains constant, the product of density and volume also remains unchanged. When the fluid changes direction upon contact with the moving DUT, a force acts from the center to the corners of the DUT where the fluid bends [19]. To calculate the displaced fluid amount, multiply the device’s submerged volume (V) by the fluid’s density (). Laminar turbulence occurs and bends the fluid at contact points where the displaced fluid exceeds the device’s contact angles by 180 degrees, altering the device’s original position. Determining the force that the DUT can withstand before misalignment occurs is crucial.
Various factors determine the resulting thrust force on the IC. These include the device’s weight, the interaction between the friction coefficient and fluid pressure in the horizontal direction, and the frictional forces that oppose rectilinear movement. This analysis requires a flow control model in a coordinate axis system, as referenced in [20,21,22]. Figure 1a shows a model that analyzes the dielectric flow around the base of a SOIC package, illustrating the force variation from laminar flow as the package moves within the fluid. Similarly, Figure 1b demonstrates the interaction between the laminar flow and the lower IC surface during downward movement. A grid representation of the lower part of the IC enables the identification of consecutive velocity and pressure values, which aids in solving the steady-state incompressible Navier–Stokes equations by treating the flow as compressible [23]. Each analysis yields a new speed, which helps to determine the consecutive values of the resulting forces. The force in the x direction is equivalent to the rate of mass change, as expressed in Equation (3),
where and are speeds in a defined position.
In a collision between the DUT and the dielectric fluid, the impulse (J) acting on the DUT is equal to the change in the device’s linear momentum in time and can be expressed as the area under the curve of the function [24]. The impulse (J) is given by
Utilizing Newton’s second law of motion [25], the net force acting on an object is determined as the summation of all vector forces applied to it, expressed by the following equation:
where the net force () in the DUT is directly associated with the change in fluid momentum over time (t). Evaluating the momentum between the initial moment and the final moment in Equation (4), we obtain the change in fluid momentum :
The momentum remains constant if no external forces act over the DUT. Internal forces () can change the momentum on parts of the system, but they cannot change the total momentum of the entire system.
The strain rate in a fluid over time depends on the discrete applied shearing stress and its relation to the velocity gradients. This relationship is given by
Here, the product of the mass of the device (m) and its velocity () at a specific time (t) determines the momentum of the fluid, which can be expressed through three scalar values representing the vector relationships along the X, Y, and Z axes. Figure 1c shows a staggered grid model that stores velocity components at its center. Pressure differences between corner nodes drive the rate of mass change in this configuration. Each grid analysis yields a new speed, which helps determine the successive values of the resulting forces. The force in the X direction is equivalent to the rate of mass change, written as:
where and are speeds in a defined position. Speed change in the X direction and the force in the Y direction are analogous to the mass change rate from the speed change in the Y direction, shown below:
The individual resultant force for the flow grid model is given by
Hence, the total force exerted on the fluid equals the momentum change rate through the DUT volume and can be calculated with Equation (11).
where and are speeds in a defined time range. Analysts reviewed each grid to derive new speeds and consecutive values of resulting forces. The rate of mass change determines the forces acting in the x and y directions. Consequently, the momentum rate of change through the DUT volume dictates the total force on the fluid, which comprises three vector components in the velocity direction. The total force equals the sum of these forces:
Here, the device’s base area exerts the machine force () on the fluid. The fluid exerts the buoyant force () on the device’s area in contact with it. Similarly, the fluid pressure exerts the drag force () on the device’s contour. Vectors and oppose the velocity and are represented with a negative sign as:
where is the fluid density and is the DUT volume, is the maximum velocity along the Z-axis, is the fluid friction coefficient, and A is the device’s area in contact with the fluid.
The resulting force on the Z-axis depends on the weight in the vertical mechanism parallel to the central axis of the screw, the horizontal friction coefficient in the screw, and the forces opposing linear motion [26]. Figure 2 illustrates the variables and parameters involved in the vertical load movement of our load model using the lead-screw drive [27]. A stepper motor provides the required torque to move the load through the lead screw against the thrust load on the ball nut. The necessary torque needed to move the load is given by
where represents the torque against the external force and is the torque against the friction force. Hence, the required basic torque can be expressed as
Isolating () from (16), we obtain the machine force on the Z-axis, given as
where is the lead screw pitch (m), is the friction coefficient on the sliding surface, m is the overall load mass (Kg), and g is the gravity 9.81 m/s2.
2.2. Electronic Components Assembly
In the advanced electronic component assembly industry, automated machinery places surface-mount devices (SMDs) using pick-and-place machining centers. Testing industrial isolation SOIC packages focuses on aligning components and preventing disturbances during their three-dimensional navigation. Precisely positioned nozzles, aided by vacuum systems for suction pressure, meticulously transport surface-mount components. Typically, the production team maintains a clean, disturbance-free environment. In the industrial process of testing SOIC package isolation, The primary focus in testing SOIC package isolation is on component alignment and disturbance prevention while maneuvering within a dielectric fluid [11]. An integrated vision system with cameras ensures accuracy, validating the correct placement of devices in Cartesian X and Y coordinates.
2.2.1. Assembly in the Presence of Dielectric Fluids
Performing procedures in the presence of a dielectric fluid is crucial in the high-voltage testing process of small-outline integrated circuit (SOIC) packages. Optimizing such an operation necessitates a predictive model for assessing package misalignment when manipulated by a pick-and-place system. Figure 3 illustrates a model of a high-voltage (HV) testing setup for SOIC packages inserted into and extracted from a zero insertion force (ZIF) socket submerged in dielectric fluid. Figure 3 shows a model depicting the high-voltage (HV) testing setup, where a system inserts and extracts SOIC packages into and from a zero-insertion force (ZIF) socket submerged in dielectric fluid.
When an automatic pick-and-place machine transports an integrated circuit through a dielectric fluid, the DUT encounters additional forces influenced by various factors such as IC volume, fluid characteristics, travel speed, and reached depth. Upon submergence, the fluid’s viscosity reduces the cohesion between the nozzle and the DUT. This viscosity effect primarily applies to the thin region adjacent to the solid boundary (surface layer), where forces are significant.
Higher viscosity in a dielectric fluid creates a large surface layer next to the IC, increasing the fluid’s surface tension from the device’s edges to its center. Higher viscosity indicates lowest fluidity, but this fluidity increases with rising temperature. The changes in fluid behavior due to temperature affect the forces exerted on the DUT.
Friction building up on the IC surface can cause turbulent flow between the pin spaces, around the device’s encapsulation, and at the junction between the nozzle and the DUT. This phenomenon arises due to the device’s shape and the changes in fluid pressure. Energy builds up unevenly at the device’s edges, sometimes overcoming the vertical resistance that maintains alignment and altering the device’s horizontal position in both the X and Y components [28].
2.2.2. Physical Characteristics of SOIC Packages
We selected three different SOIC packages to meet the research requirements, adhering to the dimensions and specifications set by the Solid State Technology Association (JEDEC 300 mil). Table 1 list the physical and physic characteristics of three models of selected SOIC packages (small-outline package plus the number of pins).
2.2.3. Physical Characteristics of Selected Dielectric Fluids
The physical properties of dielectric fluids, such as viscosity, surface tension, and density, significantly affect the performance of HV testing processes. FR3 vegetable oil (Plymount, MN, USA), DPMS (DMS-T23) silicone (Morrisville, PA, USA), and DTE-150 (LVO-330) mineral oil (Irving, TX, USA) are industrial electrical insulators with similar densities and surface tensions [29,30,31]. The kinetic viscosity directly affects the mobility of a DUT submerged in a dielectric fluid, particularly when there are temperature variations. Generally, as the temperature increases, the kinetic viscosity of the fluid tends to decrease. This reduction in viscosity enhances the mobility of the DUT in the fluid, as a lower viscosity implies less resistance to the movement of the DUT within the fluid. To maintain a consistent viscosity of the dielectric fluid during tests, the temperature was controlled at 25 °C ± 0.25 °C. This control was achieved using a C206T temperature controller, equipped with a 6.56 FT sensor and a 20 Watts/120 VAC halogen bulb for heating [32]. Once the dielectric fluid reached the target temperature, it consistently stayed within this range, eliminating the need for an additional cooling system. Table 2 details the characteristics of the chosen dielectric fluids, allowing us to evaluate the device under mobility test with three different viscosity ranges.
3. Mathematical Model Development
In this section, we conduct an analytical assessment of the trapezoidal movement pattern to ascertain the SOIC package’s trajectories, speed, acceleration, and test duration. Subsequently, we perform a deterministic analysis of the hydrodynamic forces and physical factors influencing the SOIC package’s positional deviation when immersed in a dielectric fluid.
3.1. Motion Profile Analysis of the Characterization
Developing mathematical models that combine mass and momentum conservation principles for energy conservation in movements through varying densities requires a comprehensive analysis of the trapezoidal movement pattern [33]. Such analysis is pivotal in understanding SOIC package trajectories, considering essential factors like speed, acceleration, and test time. It also requires a deterministic evaluation of dielectric fluids’ physical and dynamic properties. This evaluation leads to an examination of hydrodynamic forces and physical dependencies. These factors determine how a SOIC package moves and positions itself in a dielectric fluid.
The nozzle holds the package at its original position along the Z-axis, where the analysis begins. Figure 4 illustrates the complete time–speed trapezoidal motion pattern for the entire process divided in twenty stages represented by the Roman numbers (I–XX). The detailed analysis examines the device’s insertion and extraction displacements along the Z-axis, which the nozzle holds. The movement sequence involves first moving downwards through the air, then submerging into the dielectric fluid until reaching the upper surface of the zero-insertion force (ZIF) socket. The insertion process slows down and continues moving until the ZIF socket activates and stops it.
Subsequently, the process allocates a specific time to release the SOIC package and then moves the Z-axis back to the ZIF socket’s surface at a reduced speed. Once in position, the system increases the speed to the maximum allowed and then halts again upon reaching the home position. For extracting the SOIC package from the ZIF socket, the system replicates the same operational sequence in reverse order. A programmed speed ratio, tailored to the distance between each step, governs each travel time, featuring instant transitions with constant acceleration or deceleration. While inserting and removing the package are the most critical movements for the IC, technicians must remove the nozzle from the dielectric fluid to conduct high-voltage tests. Figure 5 showcases the trapezoidal motion pattern for either the insertion or extraction of the SOIC package selected from the twenty process stages represented by the Roman numbers.
The insertion or extraction procedure requires a total time (), which includes the sum of the downward travel time (), the upward travel time (), and a waiting period () to activate or deactivate the pneumatic system that releases or retains the SOIC package. Each downward or upward travel phase is segmented into periods with constant transitions, resulting in five distinct travel periods in each direction. The total time for each completed characterization process is 2. In a single characterization process, the total travel distance equals twice the sum of the descent distance and the ascent distance .
A mathematical analysis of the trapezoidal pattern for downward travel requires motion with a constant acceleration function , where X is the final position, is the initial velocity, is the time interval, V is the final velocity, and a is the acceleration to evaluate each segment [34]. Table 3 and Table 4 show the equations of the intervals covered and accelerations obtained.
The total distance () required to complete a test corresponds to the sum of four distances traveled on the Z-axis. Each vertical run covers a distance of 78.994 mm. This comprises a 75.819 mm path from the Z-axis origin to the top surface of the ZIF socket, along with a 3.175 mm path for inserting or removing the SOIC package into the ZIF socket. The distance covered at maximum speed is the sum of distances , , and , while the ZIF socket operating distance is the sum of distances and . The equation for the total distance traveled is as follows:
Replacing the values obtained from the motion trapezoidal pattern, we obtained a total distance traveled as a function of time–speed, as shown in Equation (19):
The total time required to complete a test is equal to the sum of the partial times , , and , as shown below:
3.2. Behavioral Analysis of Forces Exerted on DUT
Analyzing the forces acting on the SOIC package, especially near its contour, the complexity increases due to the variety of forces encountered in different fluid environments.
To understand a device’s behavior in different fluids, we must deduce the forces acting during its linear displacement. Understanding these forces helps determine the SOIC package’s maximum permissible speed while maintaining its alignment [35].
Table 5 lists the mechanical and physical parameters necessary for force analysis in the Z-axis. The impact of forces in the dielectric fluid requires considering the friction coefficients , obtained from Equations (22) and (23), and Reynold’s number , obtained from Equation (21).
Table 6 and Table 7 provide a breakdown of the Reynold numbers for each medium through which the SOIC packages moved and the corresponding coefficients of friction.
For force analysis exerted on the DUT, we maintained a constant maximum speed in two different mediums (air and dielectric fluid), each with varying densities. Assuming near-zero instantaneous acceleration concerning the displacement of the SOIC package, we analyzed the resulting forces during its trajectory and the associated energy losses for each density, including transitions between different fluids. Figure 6 shows the force models we developed for each medium, detailing how we moved the SOIC package and facilitating the analysis of static and dynamic force behaviors.
The force analysis depicted in Figure 6 reveals a model for the initial moment without vertical movement in Figure 6a. In this scenario, the machine force (), drag force (), and normal force (N) are all zero. Therefore, the initial suction force () must be equal to or greater than the weight of the SOIC package ().
The resulting force, considering the machine force (), acceleration, and an initial velocity of zero, is given by Equation (24):
Here, the normal force (N) results from multiplying the air density (), gravity acceleration (g), and the volume of the SOIC package base (). The drag force () depends on the normal force, and we multiply it by the friction coefficient ().
To determine the maximum velocities for each medium, we use Newton’s second law for force analysis and apply the principle of conservation of energy to symmetric temporal translation [36]. In this case, the Z-axis moves vertically, holding a SOIC package under suction pressure.
The drag force exerted by the fluid medium depends on the square of the velocity and the area of the SOIC package () in contact with the dielectric fluid, given by Equation (25):
By substituting the drag force into Equation (24), we can derive the maximum speed for downward displacement in the air, as shown in Equation (26):
We considered the velocity as an absolute value and denote its direction with the suffix and .
Moving on to Figure 6b, which represents a constant velocity, zero acceleration, and downward displacement in a dielectric fluid, we obtained Equation (27):
Here, the buoyant force (B) is equal to the dielectric fluid density () multiplied by gravity acceleration (g) and by the volume of the SOIC package base (). The drag force () is proportional to the buoyant force and the friction coefficient ().
The maximum velocity () for downward displacement in the dielectric fluid can be determined using Equation (28):
In the context of upward displacement in the dielectric fluid, as depicted in Figure 6c, the drag force () exhibits an inverse direction about the flotation force, acting only over the upper areas of the SOIC package (excluding the area under the nozzle ). This results in Equation (29):
By substituting the equivalent values for the drag force, the maximum speed for upward displacement in the dielectric fluid can be expressed using Equation (30):
Behavioral Analysis of Suction Force
The minimum suction force () required to securely hold the SOIC package during vertical movement, as described in Equation (31), is directly linked to several factors. These include the mass of the SOIC package (), the acceleration due to gravity (g), the linear machinery acceleration (), a minimum safety factor () typically set at 1.5 or 2.0 (which accounts for the secure holding of rigid surfaces with minimal porosity), the nozzle diameter of 3.607 mm, and the reciprocal of the drag coefficient () of the dielectric fluid [37]. The formula for calculating the minimum suction force is given as follows:
The maximum linear machinery acceleration obtained was 40.77 m/s2. For the experimentation and analysis, a minimum safety factor of 1.5 was selected.
Table 8 presents the values of the pneumatic line’s minimal pressure and the corresponding suction force necessary to ensure the secure attachment of the SOIC package to the nozzle.
After determining the suction force values, we substituted them into Equations (26), (28) and (30) to calculate the maximum speed of continuous displacement along the Z-axis during testing.
The results of these calculations are presented in Table 9, which provides the maximum speed values required for transporting the DUT through two different media, namely air and oil. These speed values account for constant acceleration and are essential for the testing process.
To calculate the maximum speed () needed to close the ZIF socket, we applied a force to the spring-loaded mechanism until the spring shifted to a position that corresponds to the total distance , as shown in Figure 5. We can determine the magnitude of this force using Equation (32), where denotes the spring’s elasticity constant, following Hooke’s law [38].
The work performed by the spring (), as calculated in Equation (33), is directly proportional to the potential energy () stored in the spring. It is important to note that this calculation neglects energy losses due to vibration.
The potential energy () stored in the spring, as expressed in Equation (34), is proportional to the square of the maximum speed used to close the ZIF socket ().
The equation for determining the maximum speed required to close the ZIF socket, , is derived from equating the work performed by the spring () to the potential energy () stored in the spring, as shown in the equation below:
Using the mechanical specifications of the ZIF socket, a force of 1.7 Kgf, equivalent to 16.67 N, is required for compression. Applying Newton’s law for forces, where force equals mass times acceleration due to gravity, we find a mass of 0.0044 Kg.
To determine the spring constant (K) of the ZIF socket, the mechanical specifications indicate a force of 0.39 N (40 gmf) per pin. In the case of the 28-pin ZIF socket model, the total applied force is 11 N for a travel distance of 0.003 m. Substituting these values into Equation (32), we find that the elasticity constant of the ZIF socket is equivalent to 9.485 Kg/s2. By substituting these values into Equation (36), we determine the maximum operating speed of the ZIF socket to be:
4. Behavioral Analysis of Surface Tension, Capillarity, Cavitation, and Splash
Dynamic surface tension affects the splatter. It increases during surface expansion and decreases as waves move in the newly formed interface [39]. Further analysis of surface tension strength, along with considerations of capillarity, cavitation, and splash effects, enabled the establishment of a more precise mathematical model. This model can now predict deviations with different DUT sizes, various dielectric fluids with other characteristics, and different operational speeds of pick-and-place machines.
4.1. Behavioral Analysis of Surface Tension Force
The force that exists due to the surface tension of the dielectric and the forces that arise from the contact of a DUT when immersed in the dielectric fluid can generate significant deviations in the final insertion position of the SOIC package. The force between the DUT and the surface of the dielectric fluid changes as the size of the DUT increases, the temperature varies, the impact velocity increases, and the physical characteristics of the dielectric make it denser. The surface tension force depends on the device’s side length , its width , the capillarity , and the surface tension coefficient . Surface tension force equation is given by Equation (37).
Table 10 shows the values of the net surface tension force values on SOIC packages when they are submerged in the dielectric fluid.
4.2. Cavitation and Capillarity Analysis
Cavitation during the insertion of the SOIC package into the dielectric fluid at the initial impact speed could lead to the formation of splashes at the edges of the SOIC package. However, cavity formation becomes dependent on the physical properties of the SOIC package, the pin contours, the wettability of the material, and the impact speed. Using approximations of the Froude model that describe the surface behavior of the dielectric fluid when it receives disturbances at the moment of contact with an object, we analyzed each of the SOIC packages concerning the maximum operating speed of the pick-and-place machine [40]. The nondimensional Froude’s number is given by , where is the maximum velocity at the moment of contact with the dielectric fluid, g is the gravity acceleration, and D is the equivalent diameter of SOIC package. The Froude numbers exhibit variation across different SOIC packages, with values of 0.8946 for the 16-pin, 0.8561 for the 20-pin, and 0.8175 for the 24-pin.
The air cavity’s hydrodynamics and the device’s geometry, resulting from vertical immersion, exhibit relatively low Froude numbers near the cavity (). However, the nozzle holding the SOIC package prevents the air cavity on the DUT from completely closing. Therefore, analyzing the effects of viscosity and surface tension near the air cavity closure due to capillarity on the SOIC package’s surface using the Weber model [41]. We evaluated the role of surface tension and the drag force of the capillarity on the device’s surface as follows:
where is the dielectric fluid density, D is the equivalent diameter of the SOIC package, is the surface tension coefficient, and is the maximum velocity of the pick-and-place machine. Table 11 shows the nondimensional values of capillarity at the surface of SOIC packages when they change between the air interface and the dielectric fluid.
We used the values in Table 11 to predict the cohesion between the surfaces of different SOIC packages and a similar dielectric fluid. This capillary action contributes to the formation of microdroplets and bubbles. We deduced that the maximum capillary action depends on the dielectric’s viscosity below a certain microunit threshold, allowing negligible cavitation.
4.3. Splash Analysis
To calculate the percentage and splash threshold of the dielectric fluid, we need to relate the surface tension and inertial forces, taking into account the viscosity’s impact. By applying Equation (40), we can obtain the splash percentage (% Splash). Furthermore, the nondimensional Ohnesorge number (Oh), as defined in Equation (41), allows us to relate surface tension with viscous and inertial forces. This correlation estimates the splash threshold constant , which we can calculate using Equation (42), as modeled by Brown (2008) [42].
Table 12 shows the dimensionless values of the percentage of the splash and dimensionless values of the splash threshold between the air interface and the dielectric fluid when making contact with the base area of the SOIC package.
Drawing on Murphy’s comparative analysis of different oils, we compared the splash percentages of dielectric fluids [43]. Our findings indicate that the splash heights range approximately from 0.533 m to 1.974 m.
5. Results and Analysis
We present the results obtained to establish the correlation between the final position of a SOIC package manipulated in a dielectric fluid and its vertical travel speed during pick-and-place machine-assisted tests. These experimental results determine the probability distribution of the observed profiles, showcasing the repeatability, reproducibility, and robustness of the overall setup employed in this study.
5.1. Statistical Validation of Samples
To validate our proposed solution, we first examined the behavior of the extracted data and identified the relationships between variables. We performed 450 measurements in total across three different SOIC packages and three different dielectric fluids. For each possible combination, we completed 50 measurements and reported the sample deviations for each set in X and Y coordinates. To identify the direction of measurements, we assigned a negative sign to deviations to the left on the X-axis and the front on the Y-axis. We assigned implicit positive values to deviations to the right on the X-axis and backward on the Y-axis. The model did not permit deviations in the Z direction, so we did not consider them in the analysis.
Figure 7 shows boxplots of the X and Y axes, respectively, illustrating the median, the highest significance percentiles, and the minimum and maximum values of the deviation of the SOIC packages in Cartesian X and Y coordinates for each type of dielectric fluid.
In each boxplot, the ends of the vertical lines indicate the minimum and maximum data values. The Points outside the extremes indicated by the symbol (*), present outliers up to a maximum of 1.5 times the interquartile range. We observed a conservative quartile concentration trend around the maximum alignment point in the box plots, with minimal variations in the upper and lower quartiles not exceeding 0.1 mm. The SOP16 packages showed minor deviations from other SOIC packages but did not maintain symmetric behavior across different dielectric fluids. Conversely, SOP24 packages had a symmetrical deviation ratio in various dielectric fluids and a higher concentration of deviations than SOP16 and SOP20 packages. Significantly, we recorded the lowest concentration of deviations with the dielectric fluid FR3. The higher friction coefficient and greater contact area of SOP24 with the dielectric fluid likely caused a thinner cohesion layer and higher surface tension at the edges.
5.2. Consistency and Repeatability
We estimated the overall reliability of the results by evaluating them at a confidence level of 95% or higher, using the acceptable internal consistency indicator. Cronbach’s alpha showed an overall reliability of 99.64%, confirming the high reliability of the collected data. Figure 8 and Figure 9 show the frequency values within the deviation range of the SOIC packages on a set of histograms with the variance dispersion correlation at 25% of the total deviation range.
The histogram analysis of Figure 8 revealed a Gaussian curve with a center frequency trend and uniform dispersion around most results. Notably, dielectric fluid FR3 exhibited a higher center alignment frequency for SOP16 packages, while SOP24 packages showed the lowest center alignment frequency.
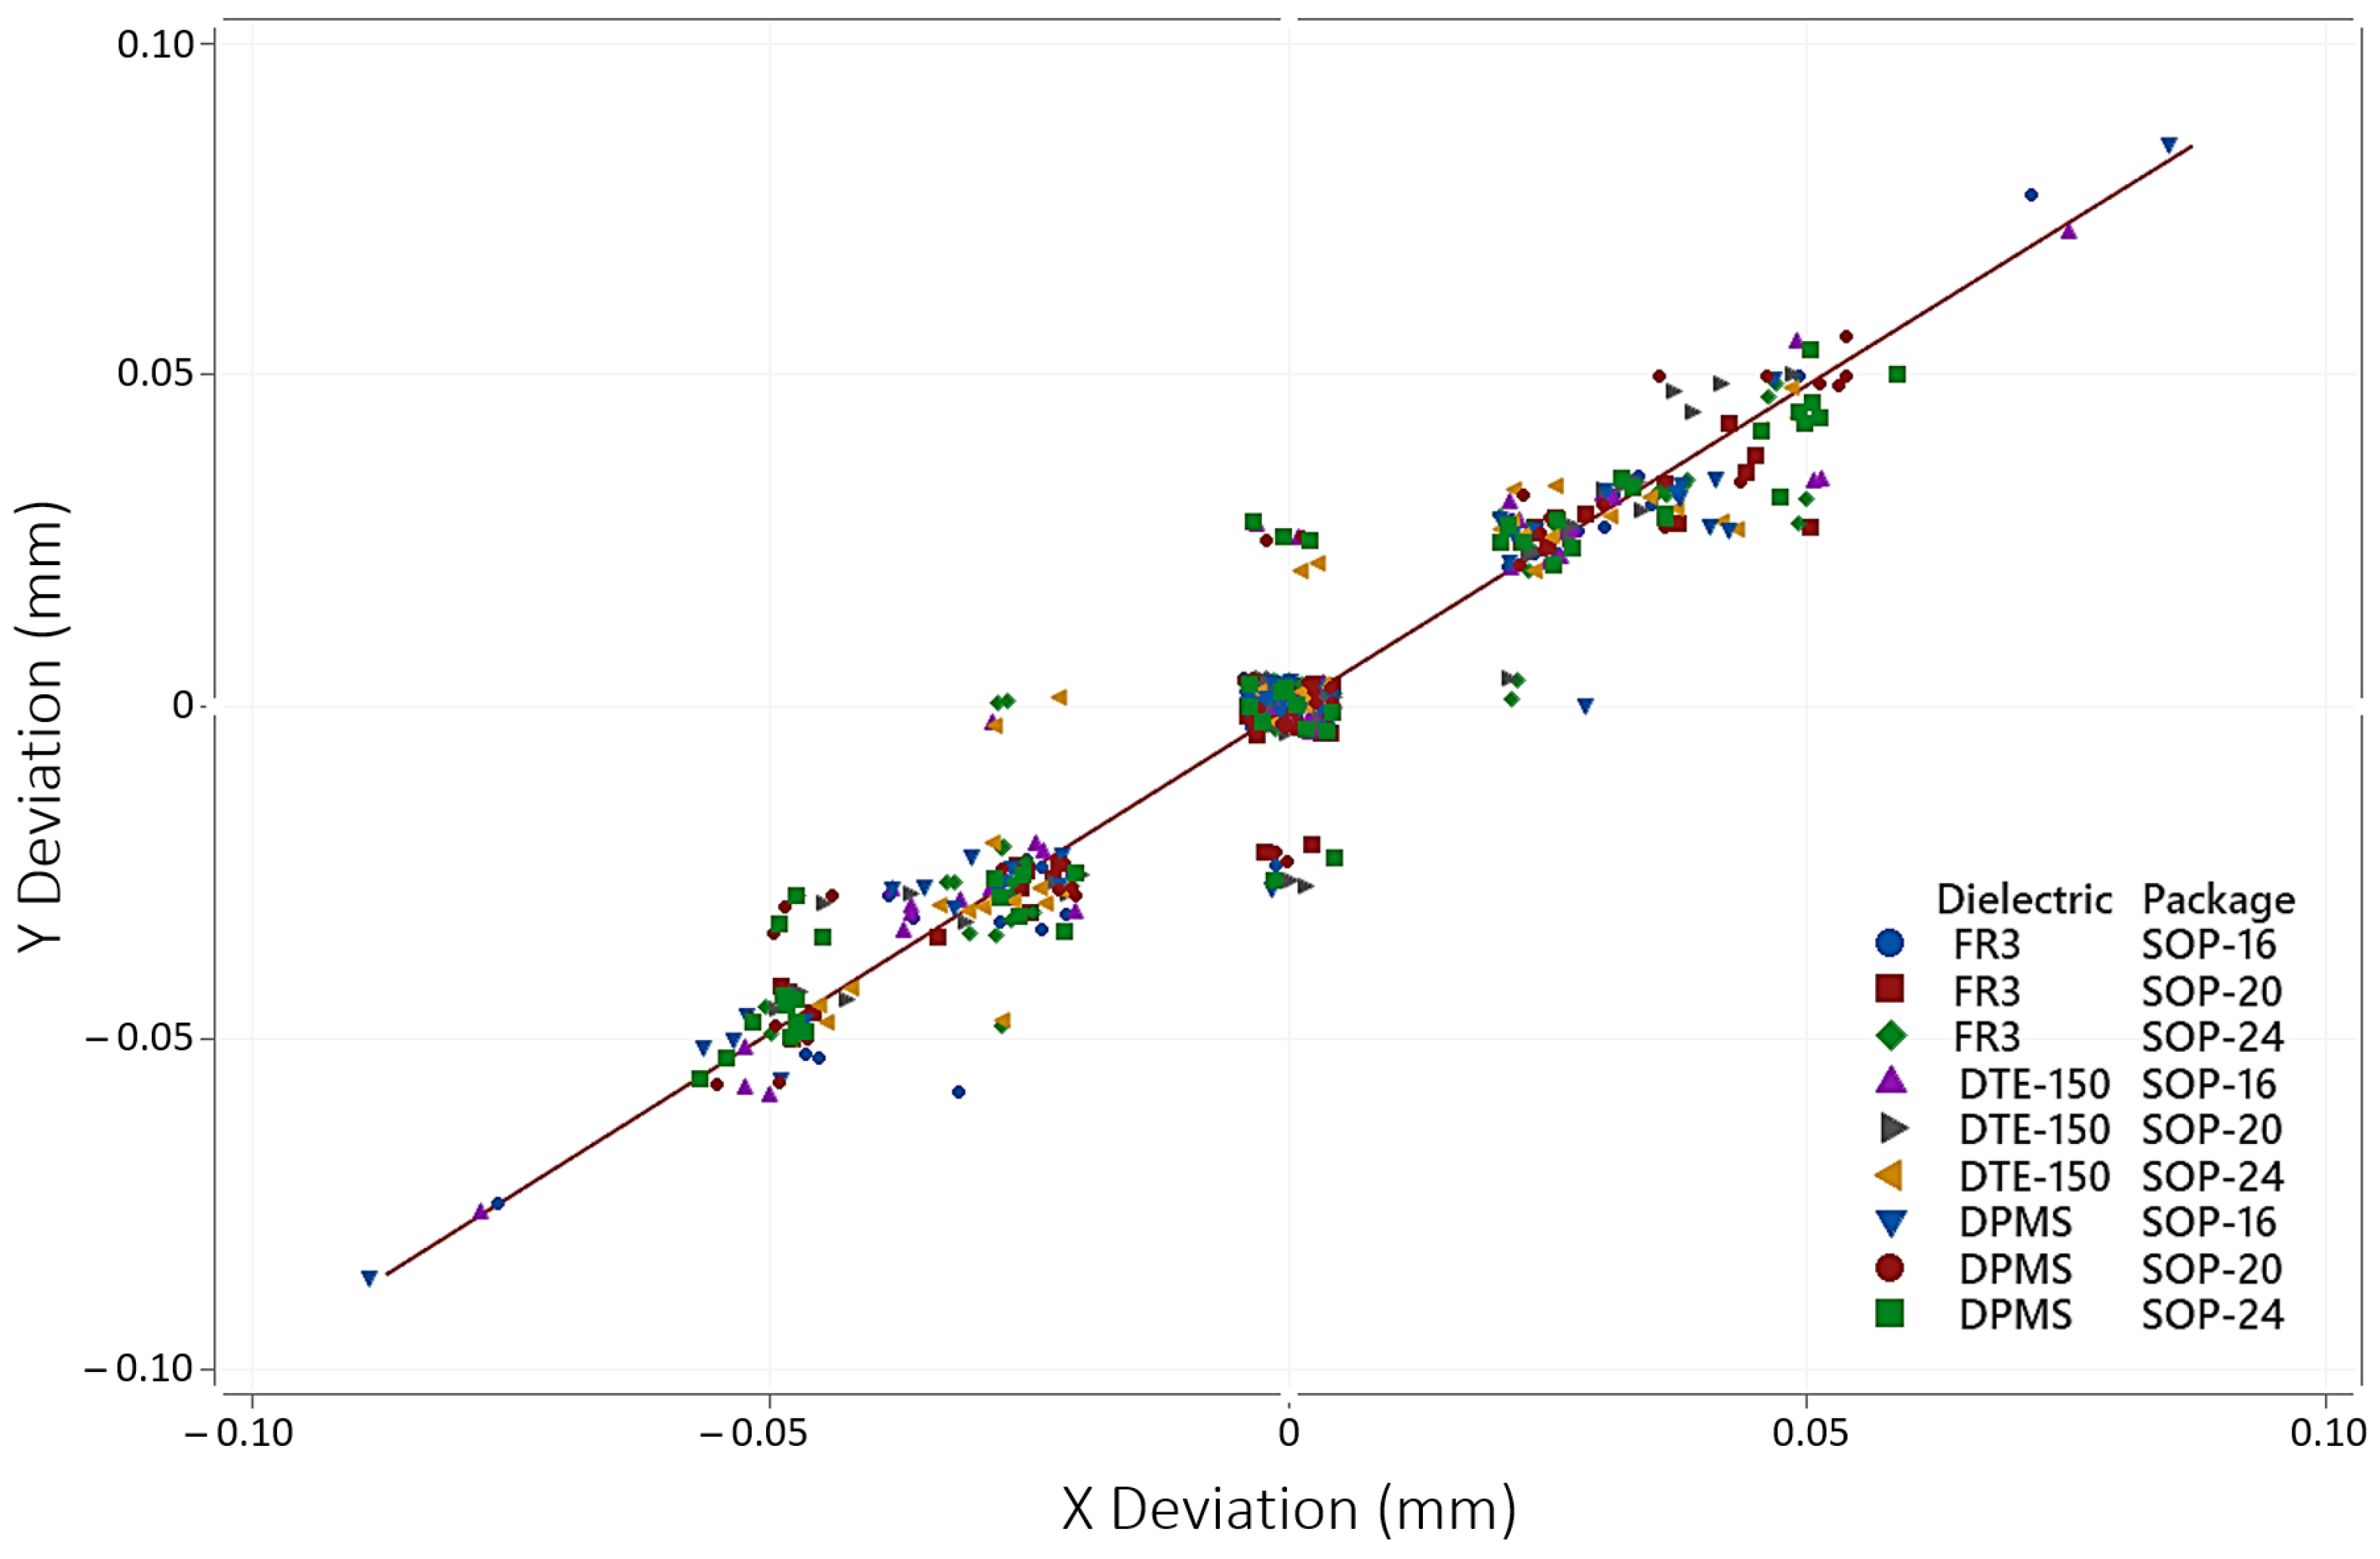
Examining the dispersion matrix plot in Figure 9, we observed linear correlations between deviations in both negative and positive directions. Median and mode results for each sample set consistently equaled zero. To assess data consistency, we determined the sample arithmetic mean, maximum, and minimum deviation values and sampled standard dispersion around the mean, standard deviation, median, and mode for each set of samples, thereby reducing limitations.
We observed that the SOP24 packages had the lowest misalignment values at the minimum and maximum end points relative to the SOP16 and SOP20 packages. However, their standard deviations recorded in tests on all dielectric fluids were the largest. We also observed that SOP16 packages had the highest maximum and minimum misalignment values for the DPMS dielectric fluid and the highest misalignment range in all tested dielectrics. The testing results of the SOP20 packages were compared and recorded as the lowest standard deviation for the FR3 dielectric fluid.
5.3. Misalignment Velocity Analysis
Our factorial analysis determined that the relative standard error margin was less than 4.78%, ensuring an overall reliability of 99.64%. As shown in Figure 10, the pick-and-place machine achieved a maximum test speed of 0.288 m/s. We found the average deviation to be 0.0711 mm, which is about 25.14%, significantly lower than the error tolerance limit of 0.2829 mm. Our probability assessments revealed that the mean velocity probability for misalignment is 0.832 m/s, and the median probability for maintaining the IC within 0.2829 mm alignment at maximum velocity is 1.5466 m/s. We identified that dielectric fluids with lower viscosity, such as FR3, DTE-150, and PDMS, allow better alignment of ICs at maximum speeds of 1.778 m/s, 1.727 m/s, and 1.499 m/s, respectively.
Figure 11 shows the cumulative deviation statistics of a SOIC package model as it moves through a specific dielectric fluid. We calculated the maximum deviation using the test pick-and-place machine’s maximum velocity. We then compared these data with the permitted maximum alignment on both the X and Y axes.
We determined each set’s maximum alignment speed by multiplying the deviation frequencies with the test’s velocity, assuming linear dispersion correlation.
The results obtained present margins of relative standard errors lower than 4.78%, as shown in Figure 12. It was observed that the SOP24 package presented more deviations in the test with DPMS dielectric fluid. The SOP20 package maintained the most stable behavior, with the least deviation in the different dielectric fluids.
5.4. Additional Parameters Analyzed during the Tests
We observed no perceptible levels of splashing in the dielectric fluid during the SOIC package insertion. Dielectric fluid dripped and leaked during nozzle removal and testing of the SOIC package. We compared the dielectric fluid losses for every 150 tests with about 19.89 mL of FR3, 34.1 mL of DTE-150, and 51.14 mL of DPMS.
We observed that during the release of the SOIC package from the nozzle after testing, the DPMS dielectric fluid exhibited higher adhesion to the surface, in contrast to FR3, which exhibited less adherence and prevented the IC’s release due to its weight.
We detected the presence of dielectric fluid in the vacuum pneumatic lines after each set of tests. However, these minimal levels of dielectric fluid did not obstruct the airflow.
6. Conclusions
We have presented the development of a systematic and scalable mathematical model to predict SOIC package misalignment during automated high-voltage IC testing in a dielectric fluid, achieving an impressive reliability of 99.64%, with a margin of error below 4.78%. This model comprehensively analyzes mechanical and hydrodynamic factors, including the crucial aspects of misalignment during the insertion and extraction of SOIC packages from ZIF sockets.
This study furthered the knowledge in the development of an energy model for high-voltage test speed calculation that seeks to improve the handling of SOIC packages in dielectric fluids in an advanced automated system, offering vital information on the rate-limiting hydrodynamic effects and precision in handling of SOIC packages.
A thorough analysis of the physical properties of dielectric fluids, including viscosity, surface tension, and density, was conducted to understand their influence on the misalignment experienced by the packages during the insertion and removal process. The proposed configuration was evaluated consistently across three types of certified dielectric fluids (FR3 vegetable oil, DPMS silicone, and DTE-150 mineral oil) and different SOIC packages, which included SOP16, SOP20, and SOP24, aligned to JEDEC’s standard MC-012 [44], significantly defining the understanding of fluid dynamics and ensuring the reliability and repeatability of the results.
This study introduced novel knowledge by analyzing the forces acting on SOIC packages in air and dielectric fluid environments, including the interface between these two mediums. It developed a model to quantify energy losses in each environment where SOIC packages operate. This research highlighted the advantages and limitations of various trapezoidal motion patterns, particularly in high-speed operations, emphasizing their potential to expedite automated high-voltage testing processes.
This research also explored the mechanics of the ZIF socket and the potential effects of cavitation and splash formation when inserting the SOIC package into the dielectric fluid. This study evidenced that the DUT geometry and fluid properties significantly influence these phenomena.
This study applied Cronbach’s alpha for robust statistical reliability validation, effectively confirming Gaussian distribution patterns and linear deviation correlations. It also analyzed and comprehensively evaluated misalignment probabilities, analyzing factors such as surface tension, sloshing, cavity formation, and bubble dynamics during DUT handling.
This study represents a significant contribution to the semiconductor industry in the field of high-voltage IC testing, providing an advanced model for predicting SOIC package misalignment with a resource-efficient approach that outperforms traditional trial-and-error models, improving the automated handling and validation of high-voltage isolation tests for SOIC packages.
Author Contributions
Conceptualization, Y.A.A. and M.J.; methodology, M.J.; writing—original draft, Y.A.A.; review and editing, Y.A.A. and M.J.; experimentation, Y.A.A.; data treatment and statistical analyses, Y.A.A.; tables and figures preparation, Y.A.A. All authors have read and agreed to the published version of the manuscript.
Funding
This research was supported in part by Texas Instruments, Inc. under the UPRM-TI Collaborative Program. Any opinions, findings, conclusions, or recommendations expressed in this article are those of the authors and do not necessarily reflect the views of the sponsor.
Institutional Review Board Statement
Not applicable.
Informed Consent Statement
Not applicable.
Data Availability Statement
The data presented in this study are openly available in [Data Testing deviation HV-SOIC.csv] at [https://github.com/YAAMNAY/Data_SOIC_DF_deviation.git] (accessed on 29 March 2024).
Conflicts of Interest
The authors declare no conflicts of interest. The authors declare that this study received funding from Texas Instruments, Inc. under the TI-UPRM Partnership. The funder was not involved in the study design, collection, analysis, interpretation of data, the writing of this article or the decision to submit it for publication.
References
- Bonifield, T. High-Voltage Isolation Quality and Reliability for amc130x; SSZY024; Texas Instruments Incorporated: Dallas, TX, USA, 2016. [Google Scholar]
- Kamath, A.; Soundarapandian, K. High-Voltage Reinforced Isolation: Definitions and Test Methodologies; Texas Instruments White Paper; Texas Instruments Incorporated: Dallas, TX, USA, 2014. [Google Scholar]
- Thawani, V.; Reghunathan, A. Fully Integrated Signal and Power Isolation—Applications and Benefits; SLYY112; Texas Instrument Incorporated: Dallas, TX, USA, 2017. [Google Scholar]
- Bonifield, T. Enabling High Voltage Signal Isolation Quality and Reliability; Application Note SSZY028; Texas Instruments, Inc.: Dallas, TX, USA, 2017. [Google Scholar]
- Geng, J. The development of high-voltage repetitive low-jitter corona stabilized triggered switch. Rev. Sci. Instrum. 2018, 89, 044705. [Google Scholar] [CrossRef] [PubMed]
- Kamath, A.; Bhardwaj, N.; Soundarapandian, K. Understanding Failure Modes in Isolators; Texas Instruments Incorporated: Dallas, TX, USA, 2018. [Google Scholar]
- Azmi, K.; Jamil, M.; Ahmad, M. Breakdown voltage characteristics of RBD Palm Olein and Envirotemp FR3 mixture under quasi-uniform electric field. In Proceedings of the 2011 IEEE Colloquium on Humanities, Science and Engineering, Penang, Malaysia, 5–6 December 2011; pp. 421–424. [Google Scholar]
- Haegele, S.; Vahidi, F.; Tenbohlen, S.; Rapp, K.; Sbravati, A. Investigation of interfacial surface creep breakdown at oil-pressboard interfaces in natural ester liquid and mineral oil. In Proceedings of the 2017 IEEE 19th International Conference on Dielectric Liquids (ICDL), Manchester, UK, 25–29 June 2017; pp. 1–5. [Google Scholar]
- Bourbonnais, F.; Bigras, P.; Bonev, I. Minimum-time trajectory planning and control of a pick-and-place five-bar parallel robot. IEEE/ASME Trans. Mechatron. 2015, 20, 740–749. [Google Scholar] [CrossRef]
- Bai, L.; Yang, X.; Gao, H. Corner Point-Based Coarse–Fine Method for Surface-Mount Component Positioning. IEEE Trans. Ind. Inform. 2018, 14, 877–886. [Google Scholar] [CrossRef]
- Gokulnath, A.; Chandrakumar, S.; Sudhakar, T. Open Source Automated SMD Pick-and-Place Machine. Procedia Comput. Sci. 2018, 133, 872–878. [Google Scholar]
- Hesse, C.; Deubel, H. Advance planning in sequential pick–and–place tasks. J. Neurophysiol. 2010, 104, 508–516. [Google Scholar] [CrossRef] [PubMed]
- Li, X.; Yang, X.; Gao, L.; Su, Z.; Wei, X.; Lv, Z.; Liang, J.; Li, H.; Fang, F. Rapid Measurement and Identification Method for the Geometric Errors of CNC Machine Tools. Appl. Sci. 2019, 9, 2701. [Google Scholar] [CrossRef]
- Hagel, O. Electronic Device and Method of Making the Same Using Surface Mount Technology. U.S. Patent Application 20190059160, 21 February 2019. [Google Scholar]
- Masood, M.; Saleem, M.; Khan, U.; Hamza, A. Design, closed-form modeling and analysis of SU-8 based electrothermal microgripper for biomedical applications. Microsyst. Technol. 2019, 25, 1171–1184. [Google Scholar] [CrossRef]
- Nally, A.; VanNorden, J.; Urquhart, J. Robotic Placement Machine for Optical Bonding, System and Method of Use Thereof. US20120234459A1, 6 February 2018. [Google Scholar]
- Kalil Coelho, Y. Pore-scale modeling of oil mobilization trapped in a square cavity. IEEE Lat. Am. Trans. 2016, 14, 1800–1807. [Google Scholar] [CrossRef]
- Crowe, C.T. Multiphase Flows with Droplets and Particles; CRC Press: Boca Raton, FL, USA, 2011; pp. 67–93. [Google Scholar]
- Huh, C.; Scriven, L. Hydrodynamic model of steady movement of a solid/liquid/fluid contact line. J. Colloid Interface Sci. 1971, 35, 85–101. [Google Scholar] [CrossRef]
- Vaudor, G. A consistent mass and momentum flux computation method for two phase flows. Application to atomization process. Comput. Fluids 2017, 152, 204–216. [Google Scholar] [CrossRef]
- Özkaya, N.; Leger, D.; Goldsheyder, D.; Nordin, M.; Özkaya, N.; Leger, D.; Goldsheyder, D.; Nordin, M. Impulse and momentum. In Fundamentals Of Biomechanics: Equilibrium, Motion, and Deformation; Springer: New York, NY, USA, 2017; pp. 253–278. [Google Scholar]
- Langtangen, H.; Mardal, K.; Winther, R. Numerical methods for incompressible viscous flow. Adv. Water Resour. 2002, 25, 1125–1146. [Google Scholar] [CrossRef]
- Kumar, M.; Kumar, R. On some new exact solutions of incompressible steady state Navier–Stokes equations. Meccanica 2014, 49, 335–345. [Google Scholar] [CrossRef]
- Gresho, P.; Sani, R.; Engelman, M. Incompressible Flow and the Finite Element Method: Advection-Diffusion and Isothermal Laminar Flow; John Wiley & Sons: Hoboken, NJ, USA, 1998; pp. 707–847. [Google Scholar]
- Welty, J.; Rorrer, G.; Foster, D. Fundamentals of Momentum, Heat, and Mass Transfer; John Wiley & Sons: Hoboken, NJ, USA, 2020; pp. 398–488. [Google Scholar]
- Pritschow, G. Ball screw drives with enhanced bandwidth by modification of the axial bearing. Cirp Ann. 2013, 62, 383–386. [Google Scholar] [CrossRef]
- Omron, Industrial Automation. Technical Explanation for Servomotors and Servo Drives. Servo TGE21. Available online: https://www.ia.omron.com/support/guide/14/introduction.html (accessed on 1 December 2023).
- Devauchelle, O. Stability of bedforms in laminar flows with free surface: From bars to ripples. J. Fluid Mech. 2010, 642, 329–348. [Google Scholar] [CrossRef]
- Cargill Inc. Envirotemp FR3 SDS Fluid, Datasheet; Cargill Inc.: Plymount, MN, USA, 2017; Available online: https://vantran.com/wp-content/uploads/2020/12/Envirotemp-FR3-SDS.pdf (accessed on 29 March 2024).
- Gelest Inc. DMS-T23 High Temperature Silicone Heat Transfer Fluid, D. Datasheet; Gelest Inc.: Morrisville, PA, USA, 2014; Available online: https://s3.amazonaws.com/gelest/sds/DMS-T23_GHS+US_English+US.pdf (accessed on 29 March 2024).
- Exxon Mobil Corporation. Mobil DTE Mineral Oil Extra Heavy, IP-346. Datasheet; Exxon Mobil Corporation: Irving, TX, USA, 2016; Available online: https://msds.exxonmobil.com/Download.aspx?ID=1005960&docFormat=PDF (accessed on 29 March 2024).
- Inkbird Tech. Heating Output Temperature Controller C206T User Manual; Inkbird Tech. C.L: Shenzhen, China, 2016; pp. 1–10. Available online: https://data2.manualslib.com/pdf6/141/14053/1405273-inkbird/c206t.pdf?40b598a40d1f1d87461d5e3702627575&take=binary (accessed on 29 March 2024).
- Voss, W. A Comprehensible Guide to Servo Motor Sizing; Copperhill Media: Spring, TX, USA, 2007. [Google Scholar]
- William, M. Quantifying Measurement. In University Physics; Morgan & Claypool Publishers: San Rafael, CA, USA, 2016; Volume 1, pp. 105–150. [Google Scholar]
- EADmotors. Linear Stepper with Threaded Screw LA23ECK-N200U. Datasheet; EADmotors: Dover, NH, USA, 2014; pp. 23–24. Available online: https://www.electrocraft.com/files/legacy/ead_step.pdf (accessed on 29 March 2024).
- Scheck, F. Mechanics: From Newton’s Laws to Deterministic Chaos; Springer: Berlin/Heidelberg, Germany, 2014. [Google Scholar]
- Volodymyr, S. Modeling of Bernoulli gripping device orientation when manipulating objects along the arc. Int. J. Adv. Robot. Syst. 2018, 15, 1729881418762670. [Google Scholar]
- Pluta, Z.; Hryniewicz, T. A developed version of the Hooke’s law. Int. Lett. Chem. Phys. Astron. 2013, 2, 49–59. [Google Scholar] [CrossRef]
- Richardson, E. The impact of a solid on a liquid surface. Proc. Phys. Soc. 1948, 61, 352. [Google Scholar] [CrossRef]
- Yan, H. Cavity Dynamics in Water Entry at Low Froude Numbers; Cambridge University Press: Cambridge, UK, 2009. [Google Scholar]
- Bormashenko, E. Wetting of flat gradient surfaces. J. Colloid Interface Sci. 2018, 515, 264–267. [Google Scholar] [CrossRef] [PubMed]
- Brown, A.; Jepsen, R.; Yoon, S. Modeling Large-Scale Drop Impact: Splash Criteria and Droplet Distribution; Sandia National Lab. (SNL-NM): Albuquerque, NM, USA, 2008. [Google Scholar]
- Murphy, D. Splash behavior and oily marine aerosol production by raindrops impacting oil slicks. J. Fluid Mech. 2015, 780, 536. [Google Scholar] [CrossRef]
- JEDEC’s Standard MC-012; Solid State Product Outline MS-012 Standard; Plastic Dual Small Outline Gull Wing, 1.27 mm Pitch Package. JEDEC: Arlington, VA, USA, 2020. Available online: https://www.jedec.org/system/files/docs/MS-012G-02.pdf (accessed on 22 April 2024).
Figure 1.
Analysis of linear momentum: (a) pressure coefficient and velocity contours, (b) IC isometric model with laminar flow fluid behavior, and (c) resulting force from stream function by the pressure and speed grid model.
Figure 1.
Analysis of linear momentum: (a) pressure coefficient and velocity contours, (b) IC isometric model with laminar flow fluid behavior, and (c) resulting force from stream function by the pressure and speed grid model.

Figure 2.
Vertical movement of a load using a lead-screw drive.

Figure 3.
High-voltage testing manipulation model.

Figure 4.
Trapezoid movement pattern: time–speed complete.

Figure 5.
Trapezoid movement pattern: time–speed.

Figure 6.
(a) Analysis for SOIC package moving down in the air, (b) air–dielectric fluid interface, and (c) SOIC package moving up in a dielectric fluid.
Figure 6.
(a) Analysis for SOIC package moving down in the air, (b) air–dielectric fluid interface, and (c) SOIC package moving up in a dielectric fluid.

Figure 7.
Boxplot of X and Y axes SOIC packages deviation on dielectric fluid.

Figure 8.
Histogram with a normal curve of SOIC packages on dielectric fluids.

Figure 9.
Correlation of dispersion matrix plot: X and Y axes deviation.

Figure 10.
Maximum velocity for testing SOIC packages aligned.

Figure 11.
Accumulated deviation in the results obtained.

Figure 12.
Descriptive statistics of the relative standard errors.


Table 1.
SOIC packages’ physical and physic characteristics.
| SOIC Package | Length mm | Width mm | Height mm | Equivalent Diameter mm | Area mm2 | Volume mm3 | Mass | Weight N |
|---|---|---|---|---|---|---|---|---|
| SOP-16 | 10.49 | 10.64 | 2.65 | 10.57 | 111.68 | 296.61 | 1.36 × | 1.33 × |
| SOP-20 | 12.60 | 10.64 | 2.65 | 11.54 | 134.13 | 355.60 | 4.99 × | 4.89 × |
| SOP-24 | 15.60 | 10.64 | 2.65 | 12.65 | 166.00 | 440.81 | 6.35 × | 6.23 × |
Table 2.
Constants of the physical characteristics of dielectric fluids.
| Dielectric Medium | Density | Viscosity at | Surface Tension |
|---|---|---|---|
| Air | 1.17 | 16.92 | N/A |
| FR3 | 922.99 | 40.00 | 23.99 |
| DTE-150 | 856.00 | 150.00 | 22.26 |
| DPMS | 967.99 | 350.00 | 21.10 |
Table 3.
Equations of the intervals covered.
| Stage | Downward Period Distance Covered | Stage | Upward Period Distance Covered |
|---|---|---|---|
| I | XVI | ||
| II | XVII | ||
| III | XVIII | ||
| IV | XIX | ||
| V | XX |
Table 4.
Equations of acceleration or deceleration on trapezoid pattern.
| Stage | Accel–Decel | Stage | Accel–Decel | Stage | Accel–Decel |
|---|---|---|---|---|---|
| I and XX | III and XVIII | V and XVI |
Table 5.
Summary of parameters’ Z-axis characteristics.
| Symbol | Description | Value | Units |
|---|---|---|---|
| T | Motor torque on the Z-axis | 0.8054 | N·m |
| Lead screw pitch | 0.01 | m | |
| Friction coefficient on the sliding surface | 0.15 | ||
| m | Overall load mass | 1 | Kg |
| Machine force on the Z-axis from Equation (17) | 318 | N | |
| j | Rotor inertia | 1.172 | Kg·m2 |
| Revolutions per second | 0.547 | rev/s | |
| Angular acceleration | 43,373.56 | rad/s2 | |
| Maximum linear velocity on the Z-axis | 0.288 | m/s | |
| Air travel distance | 0.045 | m | |
| Oil travel distance | 0.030 | m | |
| Final travel distance in the oil | 0.003 | m | |
| Total travel distance | 0.078 | m | |
| Nozzle contact end diameter | 0.0036 | m | |
| Nozzle contact end suction area | m2 | ||
| Nozzle contact end cylinder area | 3.02 | m2 | |
| Measured maximum suction pressure | 9997.40 | Pa·N/m2 | |
| Maximum suction force is equal | 0.102 | N |
Table 6.
Reynold’s number for each media and SOIC package.
| SOIC Package | Dielectric Medium | |||
|---|---|---|---|---|
| Air | FR3 | DTE-150 | DPMS | |
| SOP-16 | 211.04 | 70,222.13 | 17,366.60 | 8416.66 |
| SOP-20 | 230.48 | 76,689.88 | 18,966.13 | 9191.87 |
| SOP-24 | 252.74 | 84,095.12 | 20,797.52 | 10,079.44 |
Table 7.
Friction coefficients for each media and SOIC package.
| SOIC Package | Dielectric Medium | |||
|---|---|---|---|---|
| Air | FR3 | DTE-150 | DPMS | |
| SOP-16 | 0.788 | 0.423 | 0.447 | 0.464 |
| SOP-20 | 0.760 | 0.422 | 0.445 | 0.461 |
| SOP-24 | 0.732 | 0.421 | 0.442 | 0.458 |
Table 8.
Minimum suction force and vacuum pressure for each SOIC package.
| Dielectric Medium | SOIC Package | Minimum Suction Force N | Vacuum Pressure N/m2 |
|---|---|---|---|
| SOP-16 | 0.0138 | 458.78 | |
| AIR | SOP-20 | 0.0471 | 1560.70 |
| SOP-24 | 0.0613 | 2031.89 | |
| SOP-16 | 0.0239 | 791.59 | |
| FR3 | SOP-20 | 0.0790 | 2617.87 |
| SOP-24 | 0.0999 | 3309.28 | |
| SOP-16 | 0.0227 | 753.53 | |
| DTE-150 | SOP-20 | 0.0754 | 2496.94 |
| SOP-24 | 0.0955 | 3162.83 | |
| SOP-16 | 0.0220 | 727.74 | |
| DPMS | SOP-20 | 0.0729 | 2414.89 |
| SOP-24 | 0.0925 | 3063.13 |
Table 9.
Maximum Z-axis velocity calculated (downward and upward).
| Dielectric Medium | SOIC Package | Downward m/s | Upward m/s |
|---|---|---|---|
| SOP-16 | 29.735 | 18.132 | |
| AIR | SOP-20 | 26.581 | 30.197 |
| SOP-24 | 27.820 | 30.757 | |
| SOP-16 | 1.073 | 1.257 | |
| FR3 | SOP-20 | 1.721 | 1.955 |
| SOP-24 | 1.741 | 1.925 | |
| SOP-16 | 1.055 | 1.235 | |
| DTE-150 | SOP-20 | 1.697 | 1.928 |
| SOP-24 | 1.720 | 1.901 | |
| SOP-16 | 0.922 | 1.080 | |
| DPMS | SOP-20 | 1.472 | 1.673 |
| SOP-24 | 1.494 | 1.652 |
Table 10.
Surface tension force (N/m) for each dielectric and SOIC package.
| SOIC Package | Dielectric Medium | ||
|---|---|---|---|
| FR3 | DTE-150 | DPMS | |
| SOP-16 | 39.929 | 43.957 | 49.561 |
| SOP-20 | 37.127 | 40.805 | 46.058 |
| SOP-24 | 35.025 | 38.528 | 43.431 |
Table 11.
Capillarity for each dielectric and SOIC package.
| SOIC Package | Dielectric Medium | ||
|---|---|---|---|
| FR3 | DTE-150 | DPMS | |
| SOP-16 | |||
| SOP-20 | |||
| SOP-24 | |||
Table 12.
Splash threshold and sloshing percentage for selected dielectric fluid interfaces and SOIC packages.
Table 12.
Splash threshold and sloshing percentage for selected dielectric fluid interfaces and SOIC packages.
| Dielectric Medium | SOIC Package | Splash Percentage (%) | Splash Threshold |
|---|---|---|---|
| SOP-16 | 0.169 | 0.063 | |
| FR3 | SOP-20 | 0.168 | 0.110 |
| SOP-24 | 0.210 | 0.167 | |
| SOP-16 | 0.184 | 0.064 | |
| DTE-150 | SOP-20 | 0.184 | 0.112 |
| SOP-24 | 0.230 | 0.170 | |
| SOP-16 | 0.200 | 0.065 | |
| DPMS | SOP-20 | 0.202 | 0.114 |
| SOP-24 | 0.252 | 0.174 |
Disclaimer/Publisher’s Note: The statements, opinions and data contained in all publications are solely those of the individual author(s) and contributor(s) and not of MDPI and/or the editor(s). MDPI and/or the editor(s) disclaim responsibility for any injury to people or property resulting from any ideas, methods, instructions or products referred to in the content. |
© 2024 by the authors. Licensee MDPI, Basel, Switzerland. This article is an open access article distributed under the terms and conditions of the Creative Commons Attribution (CC BY) license (https://creativecommons.org/licenses/by/4.0/).
Share and Cite
MDPI and ACS Style
Aparicio, Y.A.; Jimenez, M. Mathematical Modeling of SOIC Package Dynamics in Dielectric Fluids during High-Voltage Insulation Testing. Appl. Sci. 2024, 14, 3693. https://0-doi-org.brum.beds.ac.uk/10.3390/app14093693
AMA Style
Aparicio YA, Jimenez M. Mathematical Modeling of SOIC Package Dynamics in Dielectric Fluids during High-Voltage Insulation Testing. Applied Sciences. 2024; 14(9):3693. https://0-doi-org.brum.beds.ac.uk/10.3390/app14093693
Chicago/Turabian StyleAparicio, Yohan A., and Manuel Jimenez. 2024. "Mathematical Modeling of SOIC Package Dynamics in Dielectric Fluids during High-Voltage Insulation Testing" Applied Sciences 14, no. 9: 3693. https://0-doi-org.brum.beds.ac.uk/10.3390/app14093693
Note that from the first issue of 2016, this journal uses article numbers instead of page numbers. See further details here.