Article

Research on the Effect of Structural Parameters on Cavitation Performance of Shear Hydrodynamic Cavitation Generator

1
College of Mechanical and Railway Transportation, Changzhou University, Changzhou 213000, China
2
Key Laboratory of Green Process Equipment of Jiangsu Province, Changzhou 213000, China
*
Author to whom correspondence should be addressed.
Submission received: 28 February 2024 / Revised: 19 April 2024 / Accepted: 23 April 2024 / Published: 25 April 2024
(This article belongs to the Special Issue Flow Analysis and Structural Control of Fluid Machinery)

Abstract

:
The method of cavitation is increasingly applied in water environmental protection. Based on the numerical simulation method, a study on the structural parameters of the shear-type hydrodynamic cavitation generators for wastewater treatment is proceeded. The internal flow field is described by employing the mixed multiphase flow model and the Zwart cavitation model. Experiments were conducted by applying the wastewater from a dyeing factory as the medium. The degradation rate of COD in water characterizes the cavitation performance of the hydrodynamic cavitation generator, and the rationality of the numerical simulation approach is validated. The findings indicate that different structural parameters have a great influence on the cavitation performance. The appropriate number of tooth rows creates a flow field with a greater vapor and velocity than the other parameters. The number of teeth in a single row, the outer diameter of the hydrodynamic cavitation generator and the tooth bevel angle also affect the cavitation performance to some extent, and there is an optimal value. The study provides a reference for the applicability of a numerical simulation of the flow field inside the hydrodynamic cavitation generator and the structural optimization of the rotary hydrodynamic cavitation generator.

1. Introduction

Cavitation is a complex fluid dynamic phenomenon involving multi-phase variation, turbulence, and compressibility [1,2]. At a certain temperature, when the local pressure inside a fluid falls below the saturated vapor pressure at that temperature, the microbubbles formed within the fluid are called cavitation bubbles [3]. The process from the inception to the development and ultimately the explosion of these cavitation bubbles is known as cavitation [4] in which an enormous amount of energy is generated and released, leading to corrosion and rusting of machine surfaces. The rational utilization of the energy brought about by the collapse of cavitation bubbles can be used in the field of organic matter degradation, wastewater treatment, sterilization, and toxicity, etc. [5]. Moreover, since it is a single physical movement inside the hydrodynamic cavitation generator, there will be no secondary pollution without the addition of other chemical reagents, which contributes its promising application.
Common modes of cavitation generation include ultrasonic cavitation and hydrodynamic cavitation. Ultrasonic cavitation uses ultrasonic vibration to cause local pressure fluctuations. When the ultrasonic energy is high enough to make the local pressure vibration drop below the saturated vapor pressure, cavitation will occur [6]. Since the ultrasonic cavitation effect occurs only in the pressure fluctuation near the surface, the efficiency of wastewater treatment in cavitation is low. The hydrodynamic cavitation creates a low-pressure, high-flow velocity state on the pipe through which the liquid passes to form cavitation [7]. The different shapes of the fluid domain will affect the velocity of the fluid, so the structure of the hydrodynamic cavitation generator will have a great impact on the cavitation performance.
There are many types of hydrodynamic cavitation generators, such as venture-type [8], orifice plate-type, vortex-type, rotary-type hydrodynamic cavitation generator, and so on. Among them, venture-type and orifice plate-type hydrodynamic cavitation generators have been widely studied due to their simple structure, and their basic principles are to reduce the fluid pressure by applying a constriction in the path of the moving fluid. The structural parameters of the Venturi tube were investigated using numerical simulation techniques [9,10]. It was found that when the throat diameter was slowly increased from 10 mm to 16 mm with same structural parameters, the gas content ratio increased and then decreased with the increase in the throat diameter. When the throat diameter reaches 14 mm, the gas content reaches the maximum value. If the throat diameter is too small, cavitation bubbles are not easily generated. If the throat diameter is too large, the pressure will be lower, resulting in lower cavitation performance. The effects of back pressure, number of holes, hole diameter, and aspect ratio of hole plates on cavitation were investigated in a study conducted by Yu B et al. [11] and Babu M J K et al. [12] using a combination of experimental and numerical simulation methods. The critical cavitation number is found to increase with the increase in back pressure. The cavitation number is a dimensionless number that describes the degree of cavitation. When the cavitation number is greater than the critical cavitation, cavitation does not occur, and vice versa. Therefore, it could be concluded that cavitation does not occur easily when the pressure increases.
The cavitation performance of the hole plate is influenced by parameters such as the number of holes, hole diameter, and aspect ratio. Additionally, the cavitation performance of multi-hole plates was found to exceed that of single-hole plates. Although the venturi and orifice plate hydrodynamic cavitation generators can achieve cavitation relatively easily, they are limited by parameters such as the opening rate and throat diameter ratio, resulting in the disadvantages of a small flow and difficulty in enlarging the structure size. Cavitation in a vortex hydrodynamic cavitation generator can be generated without moving parts. Numerical simulations of the absolute pressure in a vortex cavitation generator were performed by Wang Bao’e et al. [13]. The mass concentration of hydroxyl radicals generated by the vortex cavitation generator was detected with the methylene blue method, revealing that the inducer can create a negative pressure zone with low pressure in local areas where significant cavitation effects can be observed. However, it is noted that this generator is only applicable on a laboratory scale and is not suitable for practical application.
Composed of a stator and a rotor, the rotary hydrodynamic cavitation generator utilizes the centrifugal force and shear force from relative motion against the wall to induce cavitation. The rotor surface is designed with various types of grooves or protrusions to create localized high-speed flow regions. The advantages of the rotary hydrodynamic cavitation generator lie in its ability to induce cavitation continuously and efficiently, thereby enhancing cavitation efficiency and output, which contributes to its applicability for industrial production. Based on a high-precision compact difference scheme and the N-S equations, numerical models for the rotary hydrodynamic cavitation generator were established by Petkovšek et al. [14] and Badve P M et al. [15] to investigate the effects of parameters such as angle, speed, and pressure on the cavitation performance. Experimental visualization and numerical simulations [16,17] revealed that a tilt angle of 8° resulted in higher cavitation intensity, while higher rotational speeds led to more stable flow, higher number of vortices generated, and better cavitation effect. Designed by Yuan Huixin et al. [18,19,20], a toothed rotary hydrodynamic cavitation generator was simulated for its internal flow field using a hybrid multiphase flow model combined with the Zwart cavitation model. It was found that the cavitation rate of the square tooth was higher than that of the round tooth and the presence of the tooth side beveling angle improved the cavitation effect. It was discovered that the cavitation rate of the square tooth was higher than that of the round tooth, and the presence of tooth side angles enhanced the cavitation effects. However, the impact of structural parameters on cavitation performance has not been thoroughly studied. Based on these findings, a multiphase flow model for numerical simulations is established and the integrated experimental dye wastewater degradation tests are conducted in this paper to investigate the effects of structural parameters such as tooth row numbers, single tooth counts, generator outer diameter, and tooth face angle on cavitation performance. The research target is to optimize generator structure, which holds engineering significance for the application of rotary hydrodynamic cavitation generators in wastewater treatment.
The main contributions of this paper can be summarized as follows: (1) A numerical model of the shear hydrodynamic cavitation generator is established, and the applicability of the mixed multiphase flow model and the Zwart model to the shear hydrodynamic cavitation generator is verified by comparing the numerical simulation with the experimental results. (2) The influence of different structural parameters on the cavitation performance is investigated by numerical simulation. (3) The cavitation mechanism for shear-induced cavitation bubble generation is obtained by analyzing the diagrams of pressure and velocity clouds.
The paper is organized as follows: Section 2 establishes the structural model of the shear hydrodynamic cavitation generator, determines the methodology and boundary conditions of the numerical model, and verifies the accuracy of the numerical model experimentally. Section 3 investigates the effect of structural parameters such as the number of tooth rows, the number of teeth in a row, the outer diameter of the hydrodynamic cavitation generator, and the angle of the tooth surface on the cavitation performance, and Section 4 concludes.

2. Materials and Methods

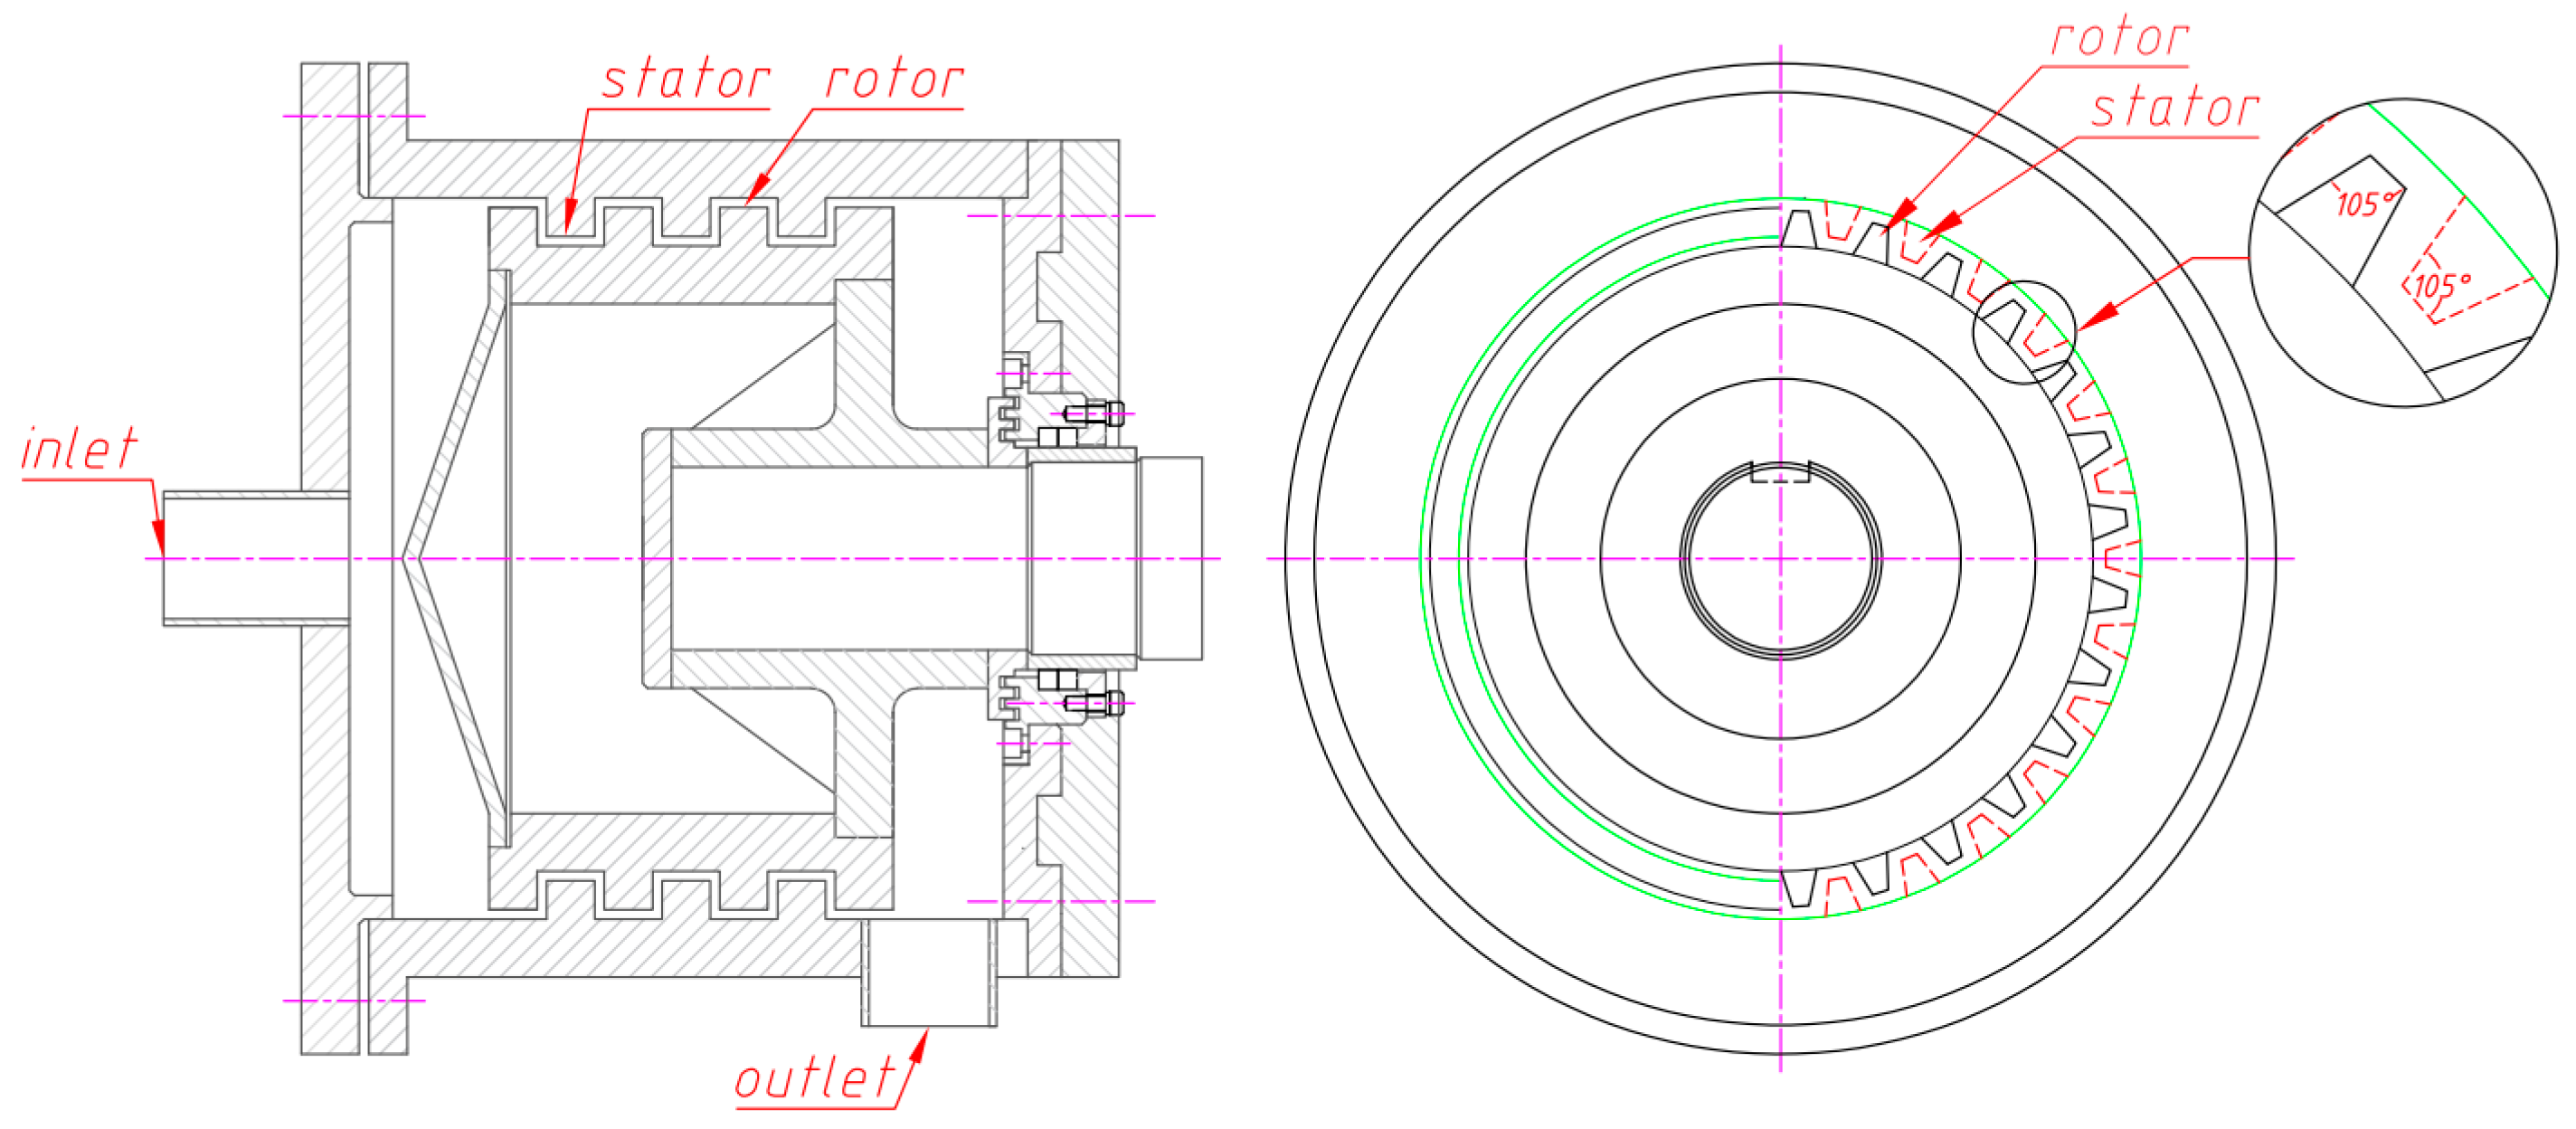
2.1. Structure of Shear Hydrodynamic Cavitation Generator

The structure of the shear hydrodynamic cavitation generators is shown in Figure 1, consisting of an inlet, rotated teeth, fixed teeth, and an outlet. The movable teeth are equipped with uniformly distributed square teeth. As the movable teeth rotate, the fluid velocity increases, creating a low-pressure zone between the movable and fixed teeth. If the pressure is low enough, cavitation will occur. The initial study parameters are set as follows: the inlet and outlet diameters of the fixed teeth are 30 mm, the outer diameter of the fixed teeth is 200 mm, and the inner diameter of the movable teeth is 176 mm. The number of tooth rows, teeth in a single row, and the outer diameter of the hydrodynamic cavitation generator are selected as the structural parameters for the study [21,22,23,24,25].

2.2. Numerical Models, Solution Methods and Boundary Conditions

2.2.1. Model Meshing

The mesh division of the fluid domain was performed using ICEM CFD v.2020r2 software. The fluid domain is divided into four parts: inlet (red part), fixed tooth domain (yellow part), rotated tooth domain (yellow part), and outlet (purple part). The rotated and fixed tooth surfaces are set as WALL. The fixed tooth region was connected to the inlet and outlet through interfaces, while the interface between the moveable and fixed teeth was established. Among them, the tetrahedral meshing method is applied for the simple structure of inlet and outlet, while the body meshing method is used for the more complex structure of movable and fixed teeth domain. Taking 3 rows of teeth as an example, the generated fluid area mesh is shown in Figure 2.
The mesh number independence validation method is as follows: To find the appropriate number of meshes, three models with different numbers of meshes were obtained by changing the maximum mesh size of the fluid domain. The results are shown in Table 1.
From the results of Table 1, when the number of meshes increases from 880,000 to 970,000, the cavitation bubble volume fraction increases by 0.01 and the time increases by 0.5 days. When the number of grids increases from 970,000 to 1,130,000, the cavitation bubble volume fraction remains unchanged, indicating that the number of grids no longer affects the calculation accuracy, while the time is increased by 3 days. Therefore, from the point of view of calculation efficiency, the hydrodynamic cavitation generator model with a grid number 966335 was finally chosen.

2.2.2. Turbulence Model

Cavitation flow is a complex gas–liquid two-phase flow process that satisfies the law of mass and momentum conservation. The Mixture model [26] is a simplified Eulerian model that can be used both for two-phase fluids with velocity differences between phases and for simulating vesicular flows. The simulated results match the experimental results. The model is based on the finite volume method to solve the mass and momentum conservation equations in the three-dimensional Cartesian coordinate system to couple the gas–liquid two-phase flow. The continuity equation and momentum equation [27] are as follows. However, when calculating the short-time cavitation flow, it must maintain the equilibrium on locally very small spatial scales due to the strong coupling between the liquid and gas phases, and Equation (6) can be satisfied.
(1)
Continuity equation:
T ρ m + · ρ m V m = 0
ρ m = k = 1 n α k ρ k
V m = k = 1 n α k ρ k V k ρ m
(2)
Momentum equation:
T ρ m V m + · ρ m V m V m = p + · μ m V m + V m T
+ ρ m g + F + · k = 1 n α k ρ k V d r , k V d r , k
μ m = k = 1 n α k μ k
V d r , k = V k V m
where t is the time, ρ m is the mixed-phase density, ρ k is the kth-phase density, V m is the weighted mass average velocity, n is the number of phases, p is the pressure gradient acting on a unit volume of fluid, V k is the kth-phase velocity, μ m is the viscosity of the mixture, g is the acceleration of gravity, F is the volume force, μ k is the kth-phase viscosity, and α k is the kth-phase volume fraction. V d r , k is the drift velocity for phase k , and is defined as the relative velocity between k phase velocity and the velocity of center of mass.
Turbulence is the main reason for transient cavitation [28]. In the shear hydrodynamic cavitation generators, the high-speed rotation of the rotated teeth will cause a change in the turbulent kinetic energy of the fluid inside the cavity. The Reynolds-averaged Navier–Stokes [29] (RANS) method is chosen for solving turbulence models, where turbulent motion is considered as a synthesis of time-averaged flow and instantaneous pulsating flow. This computational approach encompasses the standard k-ε model, the RNG k-ε model, and the realizable k-ε model.
The standard k-ε model is only suitable for simulating single-phase flow fields in a fully turbulent state, not for simulating cavitation with gas–liquid interactions. Although the RNG k-ε model considers gas–liquid two-phase flow, it cannot simulate the complete turbulent process and thus does not applicable to the cavitation model in this study.
The fluid inside a shear hydrodynamic cavitation generator has rotational shear, high turbulence, and complex pressure variations. The realizable k-ε model can predict the moderate intensity of the cyclonic flow and is more accurate for the calculating rotational flow, separation flow, and other cases [1]. Therefore, the turbulence model is chosen as the realizable k-ε model. Since the realizable k-ε model has a high degree of agreement with the cavitation model in this paper, and can accurately and completely simulate the fluid flow process inside the rotating hydrodynamic cavitation generator, the realizable k-ε model is selected in this paper. The control equations are as follows.
T ρ k + x i ρ k u i = x j μ + μ T σ k k x j + G k + G b ρ ε Y M + S k
t ρ ε + x i ρ ε u i = x j μ + μ T σ k ε x j
+ ρ C 1 S ε + ρ C 2 ε 2 k + v ε + C 1 ε ε k C 3 ε G b + S ε
C 1 = m a x 0.43 , S k S k + 5 ε
μ T = ρ C μ k 2 ε
where G k is the turbulent kinetic energy generated by the laminar velocity gradient, G b is the turbulent kinetic energy generated by buoyancy, Y M is the fluctuation in compressible turbulence generated by transition diffusion, C 1 ε , C 2 , and C 3 ε are constants of 1.44, 1.92, and 0.09, respectively, σ k and σ ε are 1 and 1.2, respectively, S k and S ε are the user-defined turbulence kinetic energy terms, and μ T is the vortex viscosity.

2.2.3. Cavitation Models

In addition to turbulence closure, the cavitation model equations need to be added to solve for the unknown covariates added due to the control equations in cavitation numerical calculations. The Zwart–Gerber–Belamri cavitation model based on the vapor phase volume fraction transport equation [30] is used, which controlling equations are shown in Equation (11) where m ˙ + and m ˙ represent the vaporization rate and condensation rate for mass exchange between the liquid and the vapor. The transport process of the gas–liquid two-phase during cavitation is controlled by varying m ˙ + and m ˙ to capture the phase change during cavitation.
α v T + α v u j x j = m ˙ + m ˙
m ˙ + = F v a p 3 α n u c 1 α v ρ v R 2 3 p v p ρ 1 , p p v m ˙ = F l i q u i d 3 α v ρ v R 2 3 p p v ρ 1 , p > p v
where α v is the vapor volume fraction, p v is the saturated water vapor pressure, 273.15 K water saturated vapor pressure is 2.34 kPa, and p is the local fluid pressure. If p > p v , water vapor condenses. If p p v , cavitation will occur. ρ v is the vapor density, α n u c is the gas nucleus volume fraction, which is taken as 0.0005, F v a p is the vaporization correction factor, which is taken as 50, F l i q u i d is the condensation correction factor, which is taken as 0.01, and R is the radius of the mononuclear cavitation bubble, which is taken as 10−6 m [31].

2.2.4. Boundary Conditions

The slip mesh divides the computational domain into two regions, rotation and stationary, and uses the interface boundary surface, which is suitable for more complex rotating flow. Then, combined with the flow state between the rotor and stator in the hydrodynamic cavitation generator, the mesh motion model is chosen as the MRF. The boundary conditions are set as follows: The inlet is set as a velocity inlet, while the outlet is selected as a pressure outlet. The boundary condition of a no-slip wall is used. The discrete formats of the pressure and momentum terms are staggered pressure (PRESTO) and first-order windward format, respectively. The PISO algorithm is employed for the coupling of the pressure–velocity field, where the first-order implicit scheme is used to time advance. The fluid is a mixture of gas and liquid water, with a controllable actual flow rate. The turbulence intensity is set to 5%, the rotor speed is stabilized at 1500 rpm, the rotation period is 0.03–0.04 s, the step size is taken as 0.001 s, and the number of iteration steps is 2000. The calculations are initialized so that the computational domain is filled with a stationary fluid, by which two-phase flow calculations are performed. During the calculation process, the cavitation bubble volume fractions on the surface of the rotated and fixed teeth are monitored. The initial parameters were set according to Table 2.
The transient gas-phase cloud diagrams of the 2-row teeth rotary hydrodynamic cavitation generator were analyzed in Fluent. The time points of 0.01 s, 0.10 s, 0.20 s, 0.50 s, 0.60 s, 0.70 s, and 0.80 s were selected as the analysis nodes.
In the gas phase contour plots at each time node as shown in Figure 3, cavitation occurs on the trailing edge of the rotated tooth. With the numerical simulation time progressing, the cavitation occurrence area on the trailing edge of the rotated tooth gradually expands and stabilizes after 0.60 s. Therefore, the gas volume fraction on the trailing edge of the rotated teeth is selected as the standard to measure the cavitation effect with the steady state time set at 0.80 s.

2.2.5. Validation of Numerical Model

Firstly, a numerical simulation is conducted on the influence of treatment volume on the cavitation effect of the hydrodynamic cavitation generator. The impact pattern of handling capacity on the aeration effect of the aerator is studied using numerical simulation. By changing the handling capacity, the axial velocity of the fluid inside the aerator is essentially altered. With the rotational speed held constant, handling capacities of 0.5 m3/h, 1.0 m3/h, 1.5 m3/h, and 2.0 m3/h are selected in the simulation process. With the inlet cross-sectional diameter d = 30 mm, the inlet cross-sectional area is calculated to be 0.0007 m2, resulting in inlet velocities of 0.2 m/s, 0.4 m/s, 0.6 m/s, and 0.8 m/s, respectively.
As shown in Figure 4, at a speed of 1500 rpm, the volume fraction of cavitation bubbles decreases with the increase in treatment volume. It can be observed from Figure 5 that increasing the treatment volume leads to an increase in the inlet velocity, resulting in an increase in the axial velocity in the cavitation chamber and the radial velocity between teeth. This decrease in the time for the fluid to stay in each shear layer per revolution causes some fluid to reach the outlet without cavitation occurring in the cavitation chamber, thereby affecting the formation of cavitation bubbles.
The rotational speed of the moving teeth varies while the initial parameters remain unchanged. During the numerical simulation, it was found that the local pressure in the hydrodynamic cavitation generator cannot be reduced below the saturated vapor pressure of the liquid at speeds below 1200 rpm. Therefore, the hydrodynamic cavitation generator hardly produces cavitation bubbles. When the rotational speed exceeds 2000 rpm, the increase in the volume fraction of cavitation bubbles is not obvious. Therefore, the rotational speeds of 1200 rpm, 1400 rpm, 1600 rpm, and 1800 rpm were chosen to compare the effect of different rotational speeds on the volume fraction of cavitation bubbles. The results are shown in Figure 6.
As shown in Figure 6, the volume fraction of cavitation bubbles increases with the increase in rotational speed at a treatment capacity of 1 m3/h. For Figure 7, the cavitation bubbles in the hydrodynamic cavitation generator occur with the fluid under high-speed rotation. Therefore, the higher the rotational speed, the higher the centrifugal force generated by the rotated teeth due to rotation. This results in a higher fluid flow rate inside the hydrodynamic cavitation generator, which results in a higher volume fraction of cavitation bubbles. Thus, the cavitation effect of the hydrodynamic cavitation generator increases with increasing speed within a convinced range.
Secondly, experiments are conducted to study the influence of treatment volume on the COD degradation rate to verify the accuracy and applicability of the numerical simulation results. A shear-type hydraulic cavitation performance test platform was constructed in the laboratory, using the printing and dyeing wastewater as the experimental subject. The cavitation performance of the cavitation device was reflected by measuring the difference in COD concentration in the printing and dyeing wastewater before and after cavitation, with the COD content of the samples determined using EPA-approved standard methods [32]. The experimental results were used to assess the applicability and accuracy of the numerical simulation method.
The experimental device is shown in Figure 8. The device is an open loop, consisting of a water tank, a booster pump, a frequency converter, a flow meter and a shear hydrodynamic cavitation generator. At the water reservoir, the tank supplies the booster pump with enough water to ensure that both the booster pump casing and suction line are filled with water before the pump is started. The booster pump and flow meter are used to pressurize the wastewater and control the inlet velocity of the hydrodynamic cavitation generator. The frequency converter is used to change the speed of the rotated teeth. The hydrodynamic cavitation generator, consisting of rotated and fixed teeth, generates cavitation bubbles to degrade the COD content of the wastewater. As shown in Figure 9, wastewater is stored in a tank and pressurized from the bottom by a booster pump. It then flows through a flowmeter into a hydrodynamic cavitation generator for treatment. After treatment, the wastewater returns to the tank, forming an open loop. The rotational speed is controlled by the variable frequency drive set at 1500 rpm.
Before the experiment, the printing and dyeing wastewater was diluted based on the COD liquor detection range. The initial COD content was measured using the COD liquor. Simultaneously, the rotational speed of the shear hydrodynamic cavitation generator was adjusted to 1500 rpm for pre-rotation to test equipment safety and venting. Subsequently, the printing and dyeing wastewater was added to the tank for cavitation degradation of COD in the water. Once the rotor stabilized, samples were taken at the sampling port to measure the COD content in the wastewater after cavitation treatment, and the samples were taken uniformly at a treatment time of 10 min. The comparison was made with the COD content in the wastewater before cavitation to validate the pattern of COD degradation effectiveness through cavitation and confirm the accuracy of numerical simulation. The COD degradation rate is briefly given here:
Once the rotor stabilized, the samples were taken at the sampling port to measure the COD content in the wastewater after cavitation treatment, and the samples were taken uniformly at a treatment time of 10 min.
η = 1 δ C O D δ C O D
As shown in Figure 10, with an increase in the treatment volume, the degradation rate of COD in the printing and dyeing wastewater decreases, indicating a deterioration in cavitation effectiveness. The increase in treatment volume actually accelerates the fluid’s inlet velocity, especially the axial velocity of the fluid, leading to an increase in the inter-tooth radial velocity. Consequently, the residence time of the fluid within the cavity decreases, resulting in a decrease in cavitation effectiveness. During the collapse of cavitation bubbles, there is inevitably energy wastage that is not completely utilized for COD degradation. Additionally, the quality of wastewater, involving gas and impurity content, also affects the efficiency of COD degradation. This is why the experimental results exhibit a similar trend to the numerical simulation results, while with lower COD degradation efficiency compared to the volume fraction of cavitation bubbles. Thus, the accuracy of the numerical model and methodology is validated.

3. Experiments and Results

3.1. Influence of Structural Parameters on Cavitation Performance

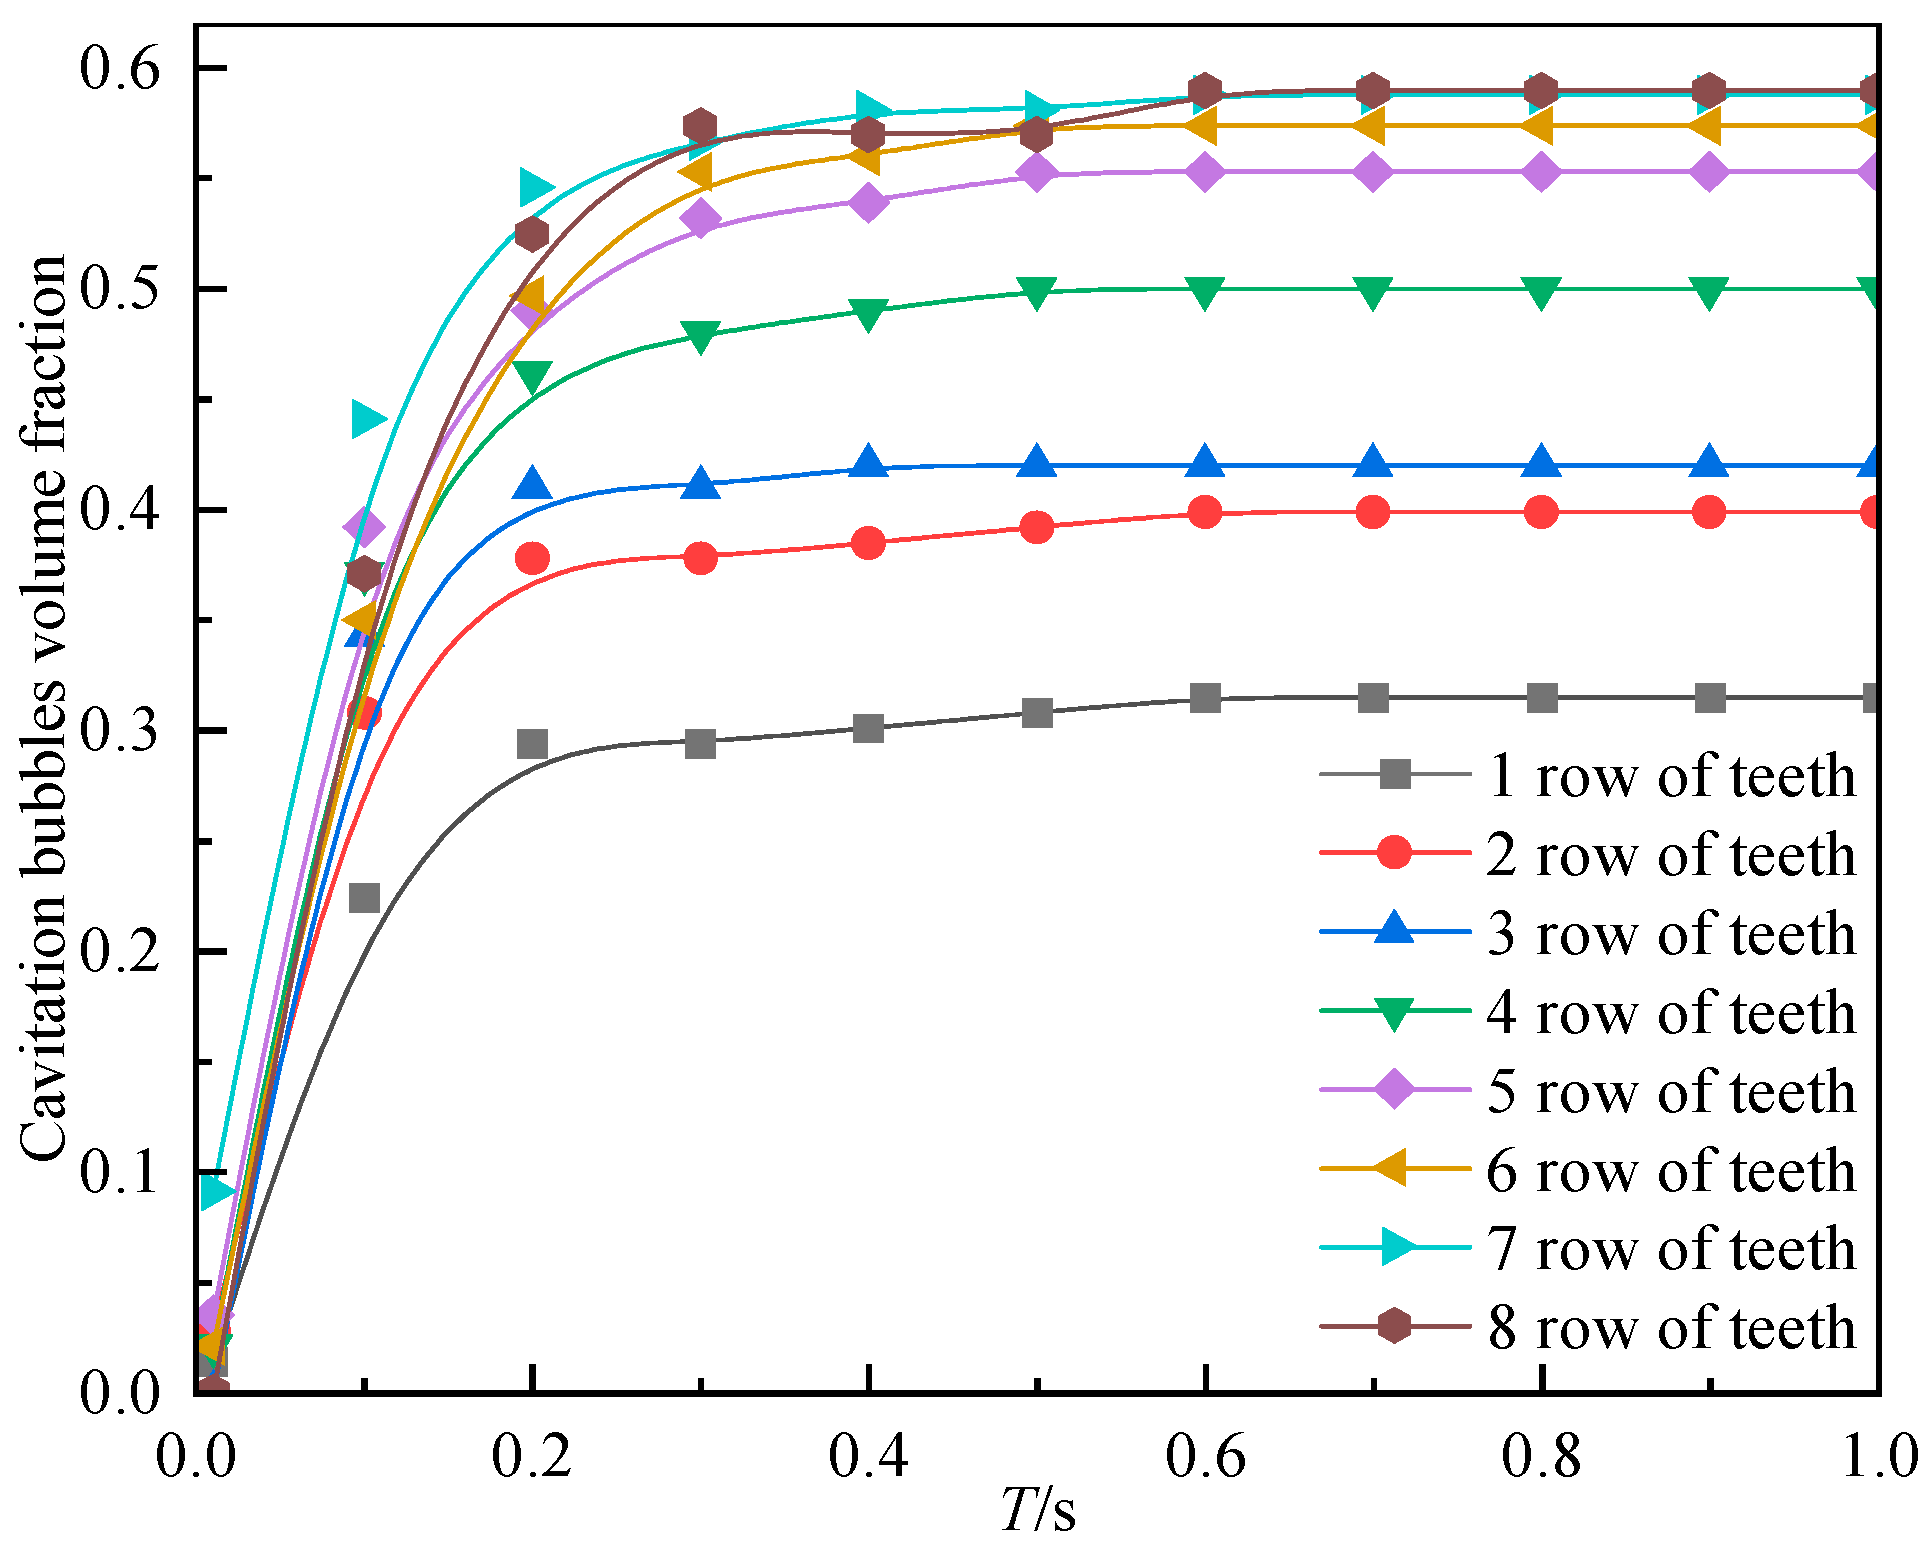
3.1.1. Number of Teeth Rows

The shear hydrodynamic cavitation generator with 1~8 rows of teeth rows were selected to study the influence of the number of teeth rows on the cavitation performance of the hydrodynamic cavitation generator. The results are shown in Figure 11.
The gas phase volume fraction in Figure 11 increases with the increase in the number of tooth rows, reaching a point of no significant increase when it reaches eight rows of teeth. Pressure is the decisive factor in the generation and collapse of cavitation bubbles. The pressure contour plots of different tooth row numbers in Figure 12 indicate that the shear hydrodynamic cavitation generator exhibits a relatively large low-pressure region. The cross-shearing between the moving and stationary teeth leads to a change in the shearing velocity between them, resulting in the occurrence of a low-pressure area between the rotated and fixed teeth and creating a favorable environment for the generation of cavitation bubbles. As the tooth rows increase, the fluid region between the teeth expands, rendering a decrease in static pressure of the fluid and an enlargement of the negative pressure region within the cavitation inducer. Consequently, the cavitation occurrence area expands, thereby enhancing the cavitation performance of the inducer with an increasing number of tooth rows. However, when the number of tooth rows reaches eight as shown in Figure 12, there is a relatively long distance from the inlet to the outlet section, creating a low-pressure field (highlighted in the red box in Figure 12) independent from the inlet velocity and outlet resistance. This stable low-pressure field provides favorable conditions for the stable generation of cavitation bubbles. Therefore, the best cavitation effect is achieved when the number of tooth rows reaches eight, without the need for further increasing the number of tooth rows, while satisfying the requirements of cavitation.

3.1.2. Number of Teeth in A Single Row

For a clearer comparison, while ensuring that the size of the teeth remains constant, single gear teeth numbers of 5, 10, 15, 20, and 25 were selected to study their impact on the cavitation performance of the hydrodynamic cavitation generator. As shown in Figure 13, the cavitation performance of the hydrodynamic cavitation generator is optimal when the single gear teeth number is 15. when the number of teeth exceeds 15 in the cavitation inducer of the same size, the decrease in cavitation performance is attributed to the reduction in fluid flow space between each tooth as the number of teeth increases. This results in a decrease in the cavitation occurrence area renders a deterioration in cavitation effectiveness. Conversely, when the number of teeth is less than 15, the continuous reduction in the number of teeth causes a decrease in shear velocity between the tooth sides. As a result, the low-pressure region cannot be generated, resulting in a decline in cavitation effectiveness. The degree of cavitation varies greatly for the structure difference in the hydrodynamic cavitation generator between the fluid domains. This change in cavitation is a very complex fluid dynamic result.

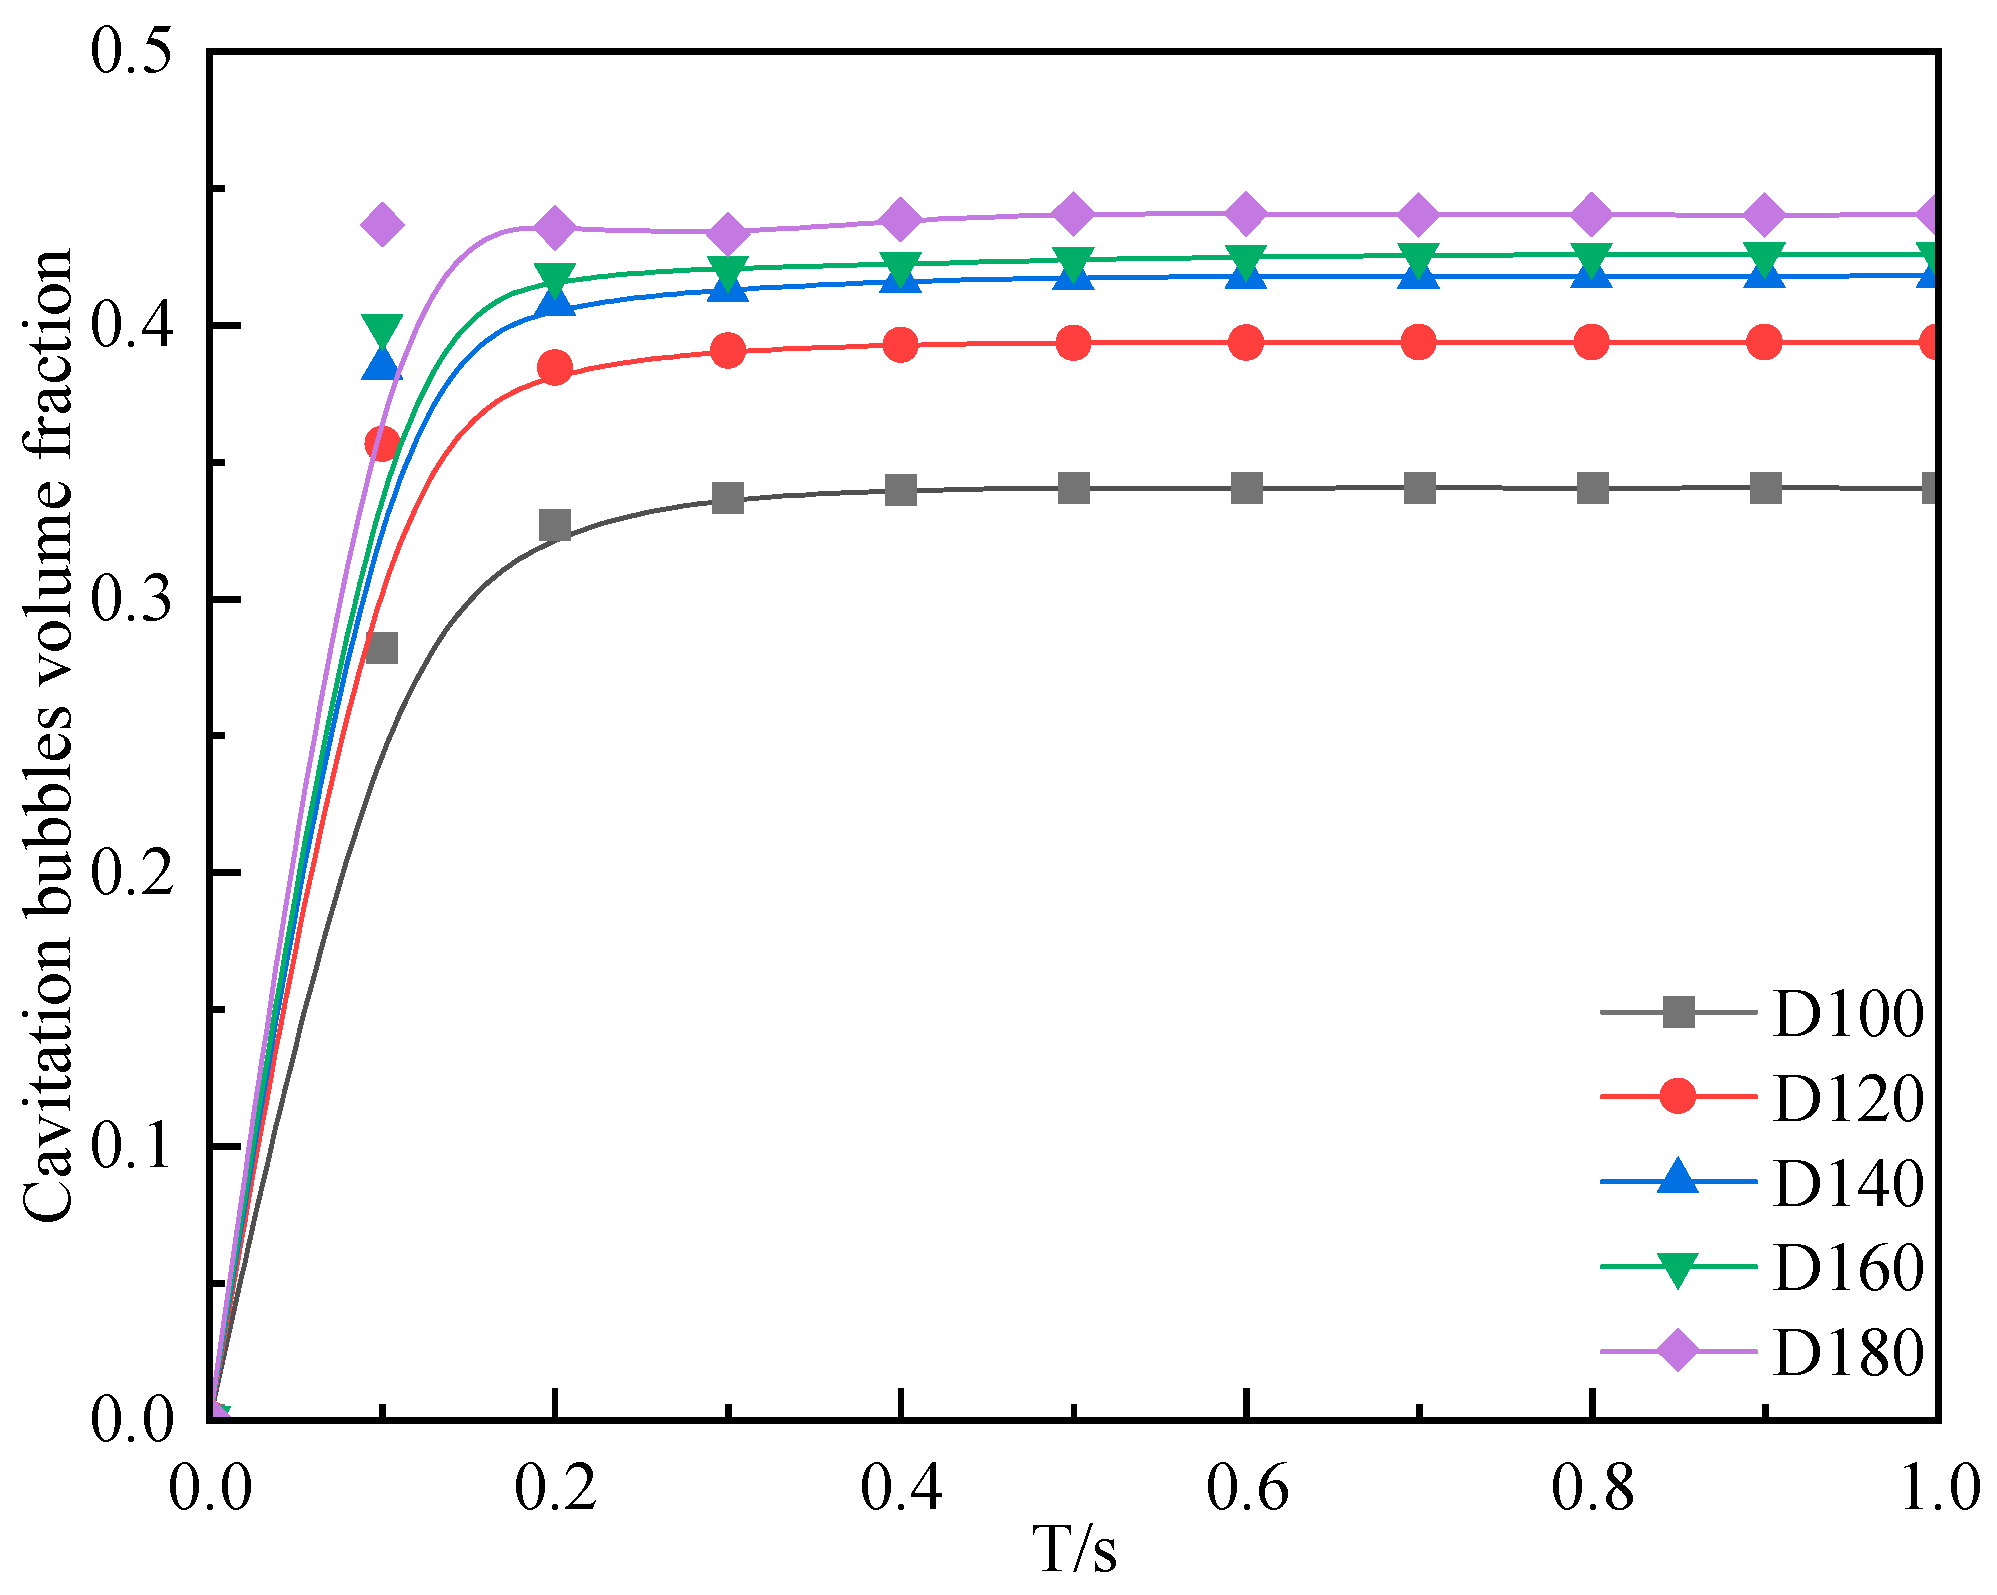
3.1.3. Outer Diameter of Hydrodynamic Cavitation Generator

With the tooth row number set at 3 and 10 teeth per row, the impact of the hydrodynamic cavitation generator’s cylinder diameter on cavitation performance was investigated by maintaining the size of each tooth unchanged and selecting the tooth outer diameters as D100, D120, D140, D160, and D180.
As shown in Figure 14 and Figure 15, the volume fraction of cavitation bubbles increases with the increase in the outer diameter of the fixed gear. With the increase in the outer diameter of the fixed gear, the centrifugal force acting on the hydrodynamic cavitation generator increases [33], leading to an increase in the relative velocity between the rotated and fixed gears. This increase in relative velocity results in a higher shear force, creating more low-pressure zones and enhancing cavitation performance. It is indicated that centrifugal force can induce the formation of more aeration bubbles. Furthermore, as the outer diameter of the hydrodynamic cavitation generator increases, the circumferential speed increases when the speed is constant, which means that the shear speed increases. Consequently, a larger outer diameter of the hydrodynamic cavitation generator leads to better cavitation effects. However, it is crucial to consider that the size of mechanical equipment should not be expanded without limitations when considering energy consumption and processing convenience.

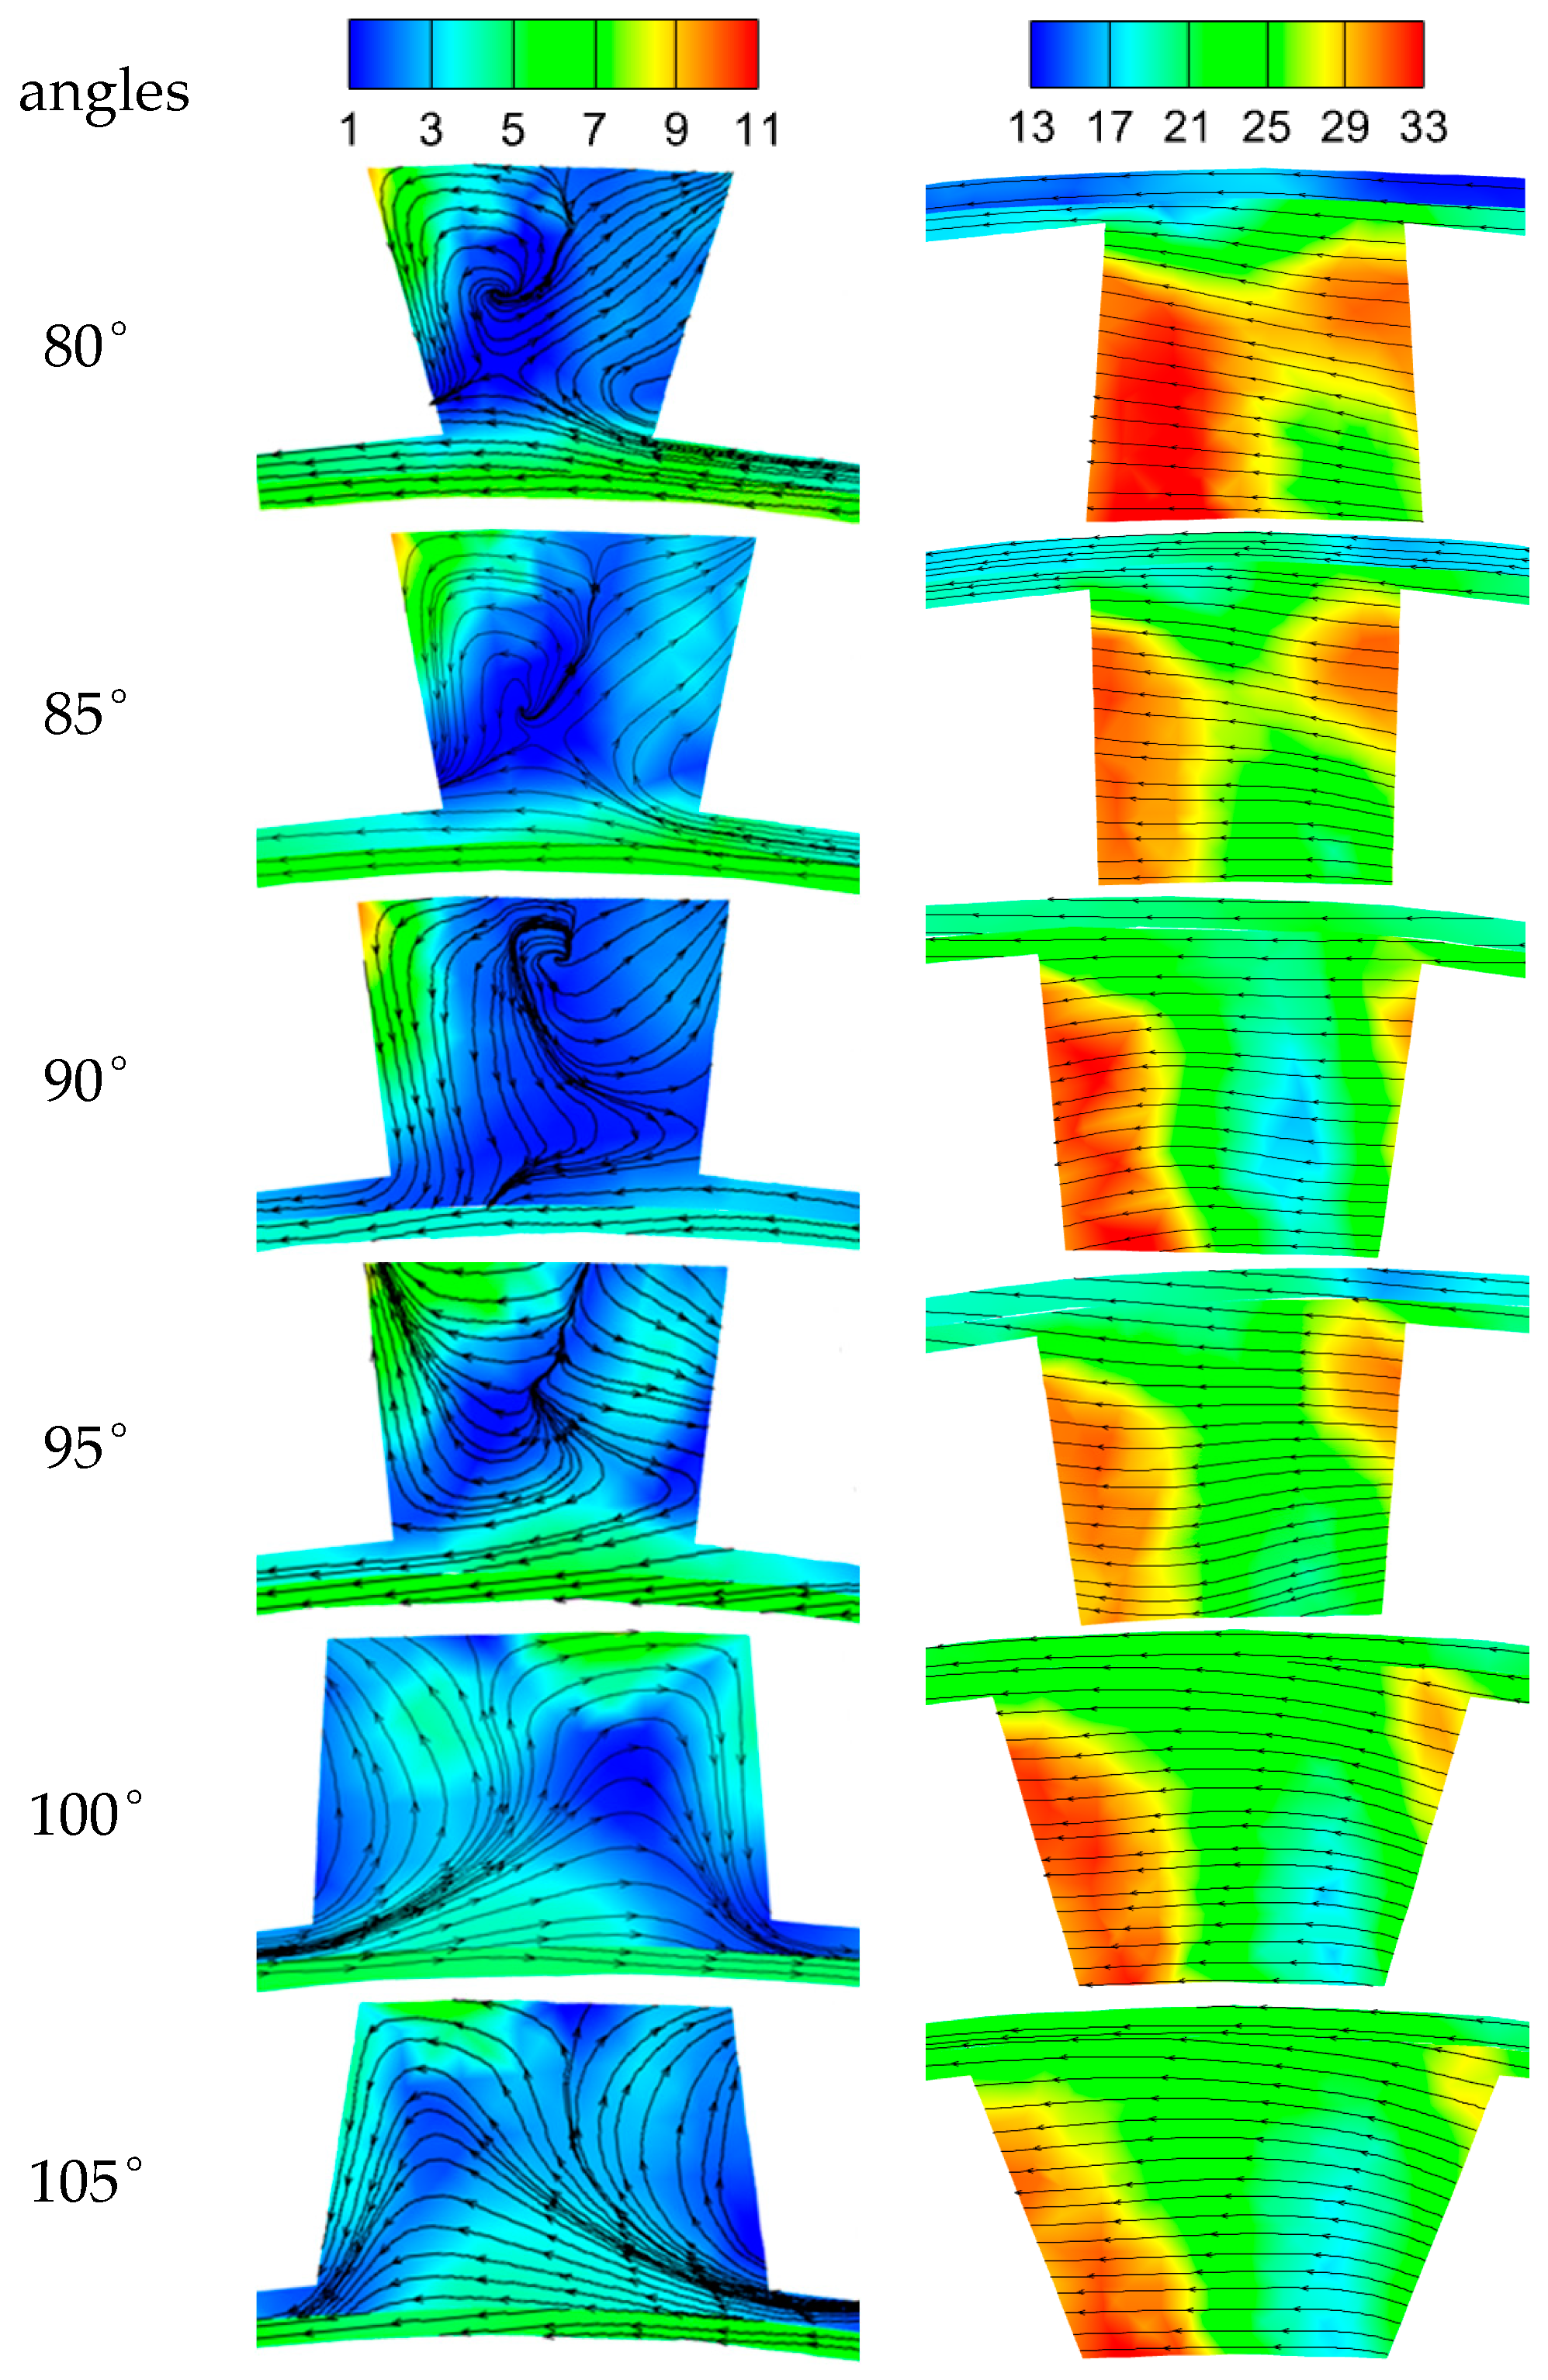
3.1.4. Tooth Bevel Angle

When the tooth bevel angle (as shown in Figure 1) is 75° or below, interference occurs between the moveable and fixed teeth, preventing the occurrence of cavitation. Therefore, 80°, 85°, 90°, 95°, 100°, and 105° are chosen as six different movable tooth inclination angles to study the influence of different angles on the cavitation performance of the hydrodynamic cavitation generator.
From Figure 16 and Figure 17, it can be observed that as the tooth surface inclination angle increases, the velocity between fixed teeth increases, and the velocity distribution becomes more stable, leading to the generation of more cavitation bubbles. With the increasing angle, the velocity on the outer side of the moveable teeth flow region increases, while the velocity on the inner side decreases, creating a noticeable velocity difference. This enlargement of the low-pressure region between moveable teeth creates favorable conditions for the generation of cavitation bubbles.
The velocity cloud in Figure 18 reveals that, as the rotated teeth rotate, the shear velocity within the fluid domain between the rotated and fixed teeth varies with different degrees of overlap. When the rotated and fixed teeth are on the same axis, the shear velocity is lower (indicated by a smaller red area in the cloud map). When the rotated and fixed teeth are completely off the same axis, the shear velocity increases (indicated by a larger red area in the cloud map). It can be inferred that the relative motion between the rotated and fixed teeth causes a variation in shear velocity, i.e., the greater the shear velocity, the larger the volume fraction of cavitation bubbles. Generally, the generation of cavitation bubbles is influenced by the shear velocity between the rotated and fixed teeth.

4. Conclusions

By establishing a numerical model of the hydrodynamic cavitation generator and numerically simulating its internal flow field, the pressure field, the velocity field and the cavitation bubble volume fraction were analyzed. The effects of different structural parameters on the cavitation performance were investigated in this study. The following conclusions are drawn from this study:
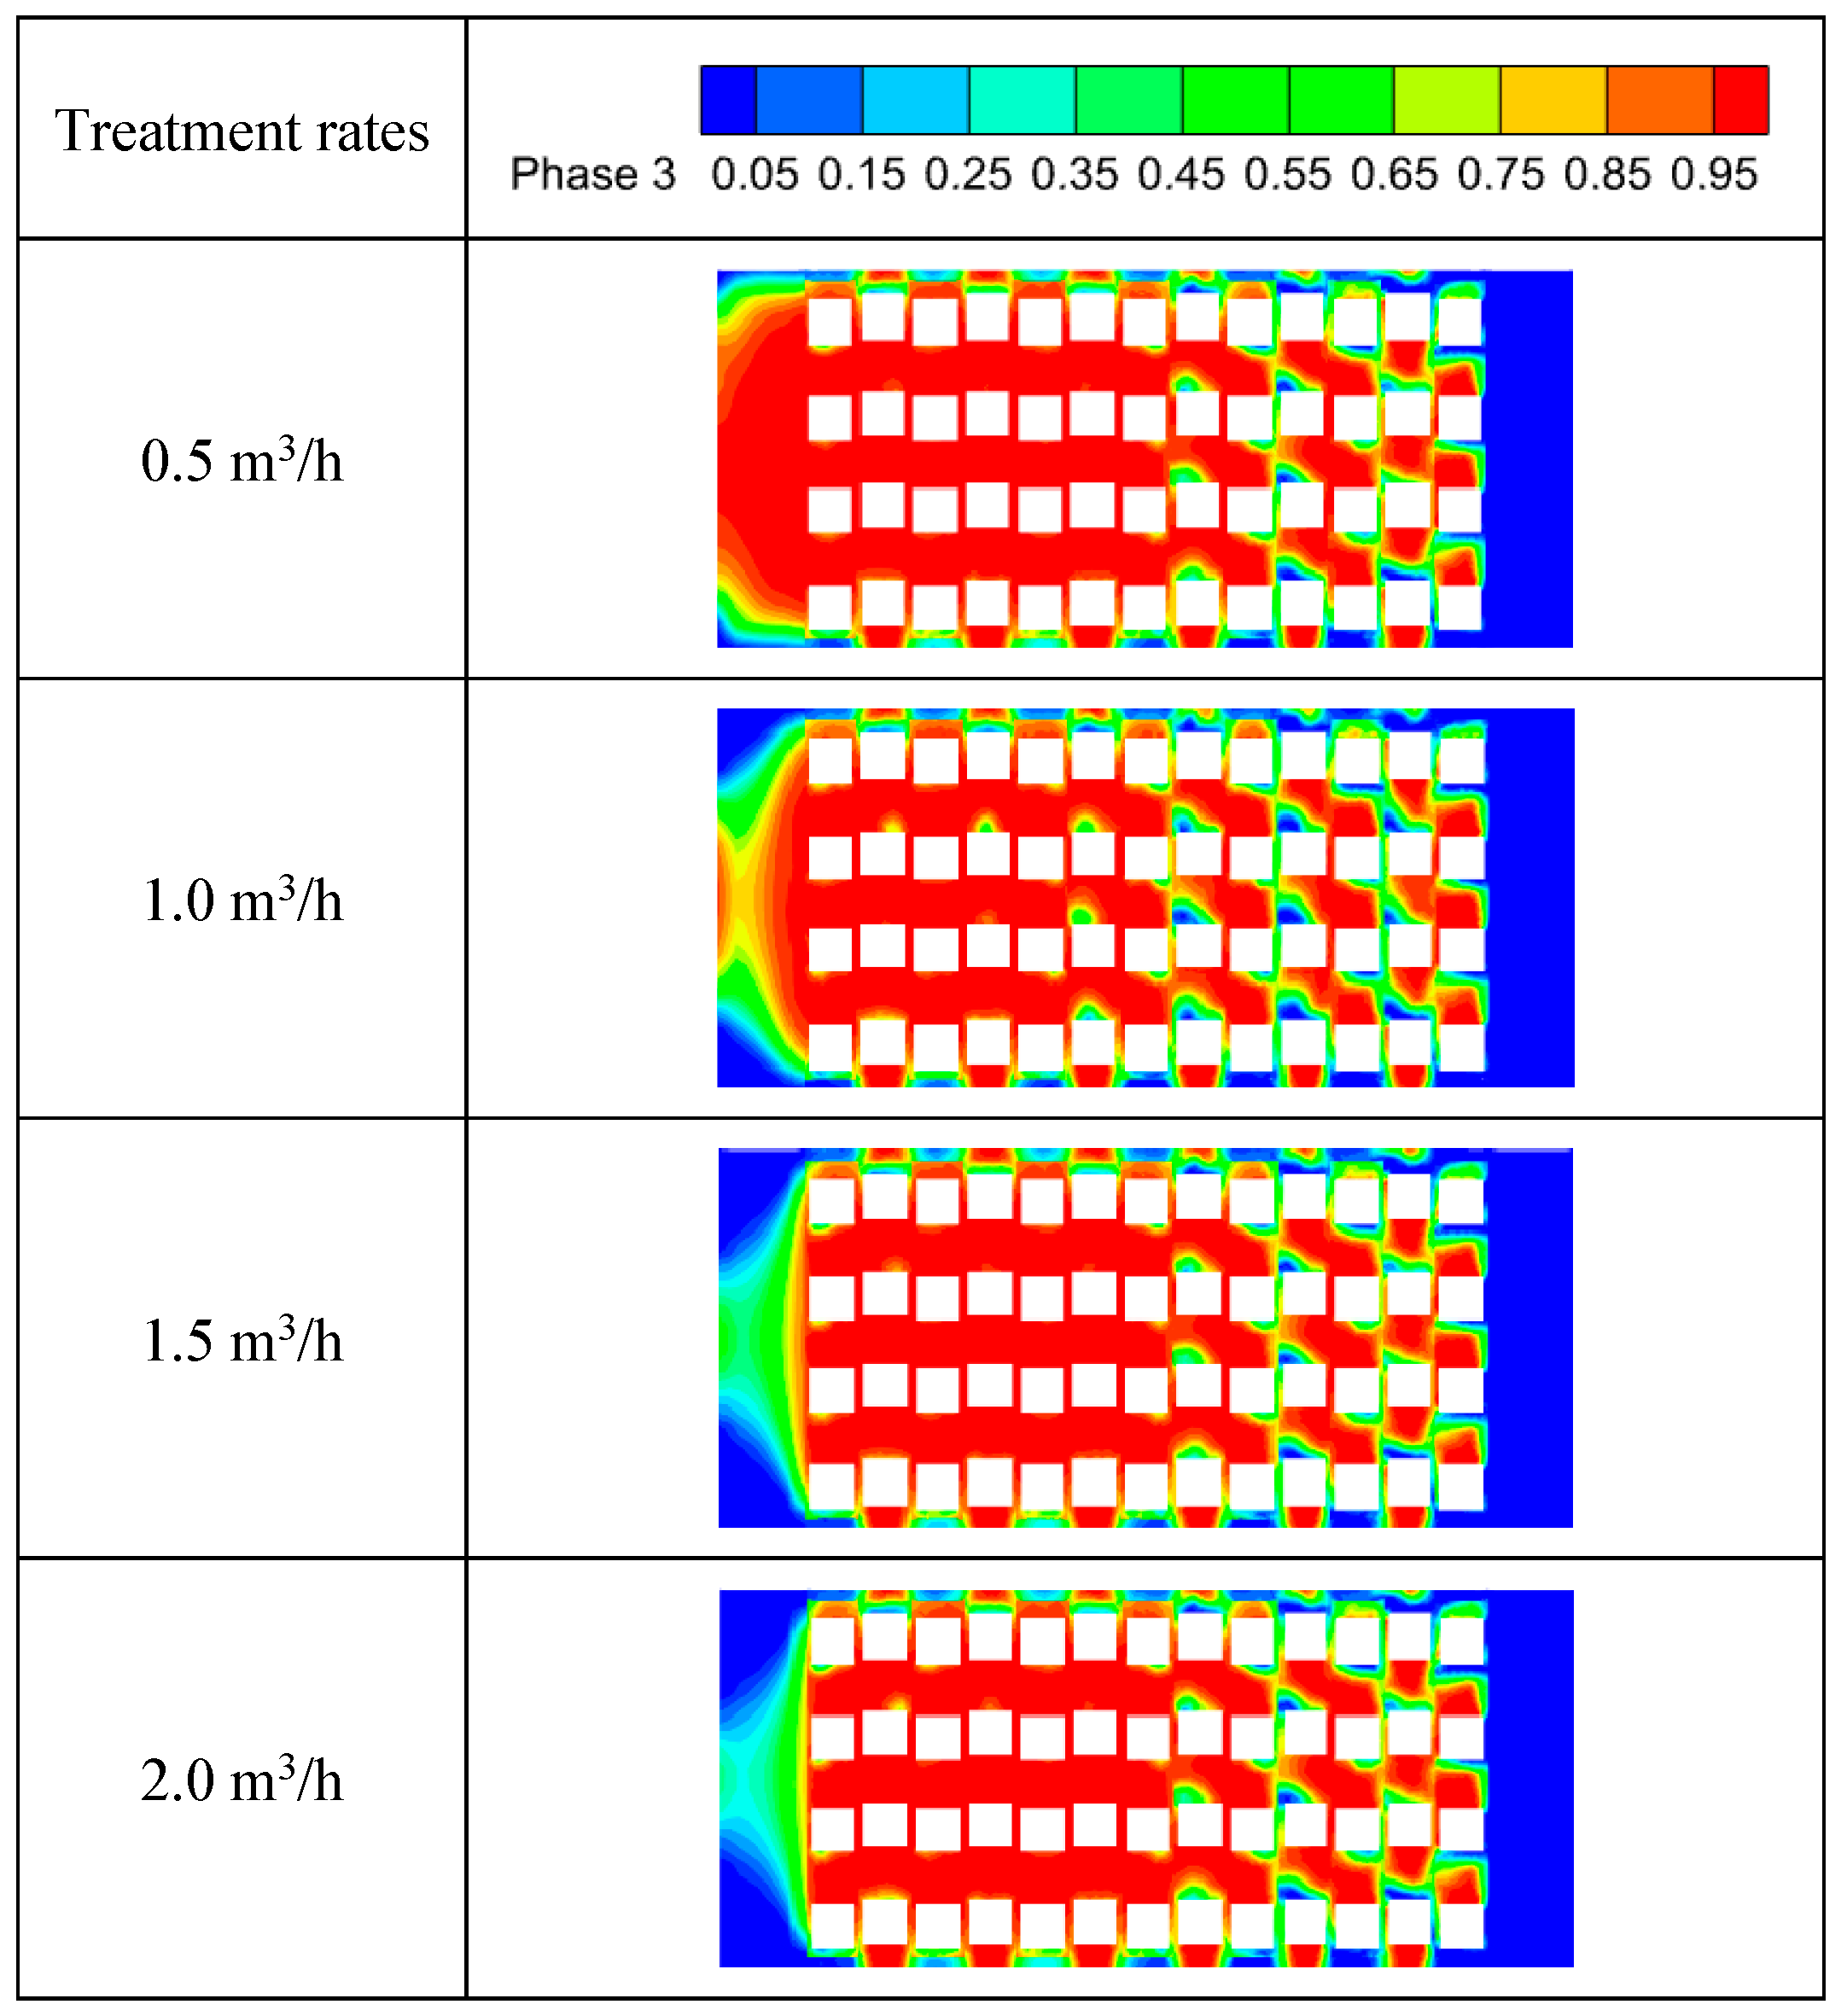
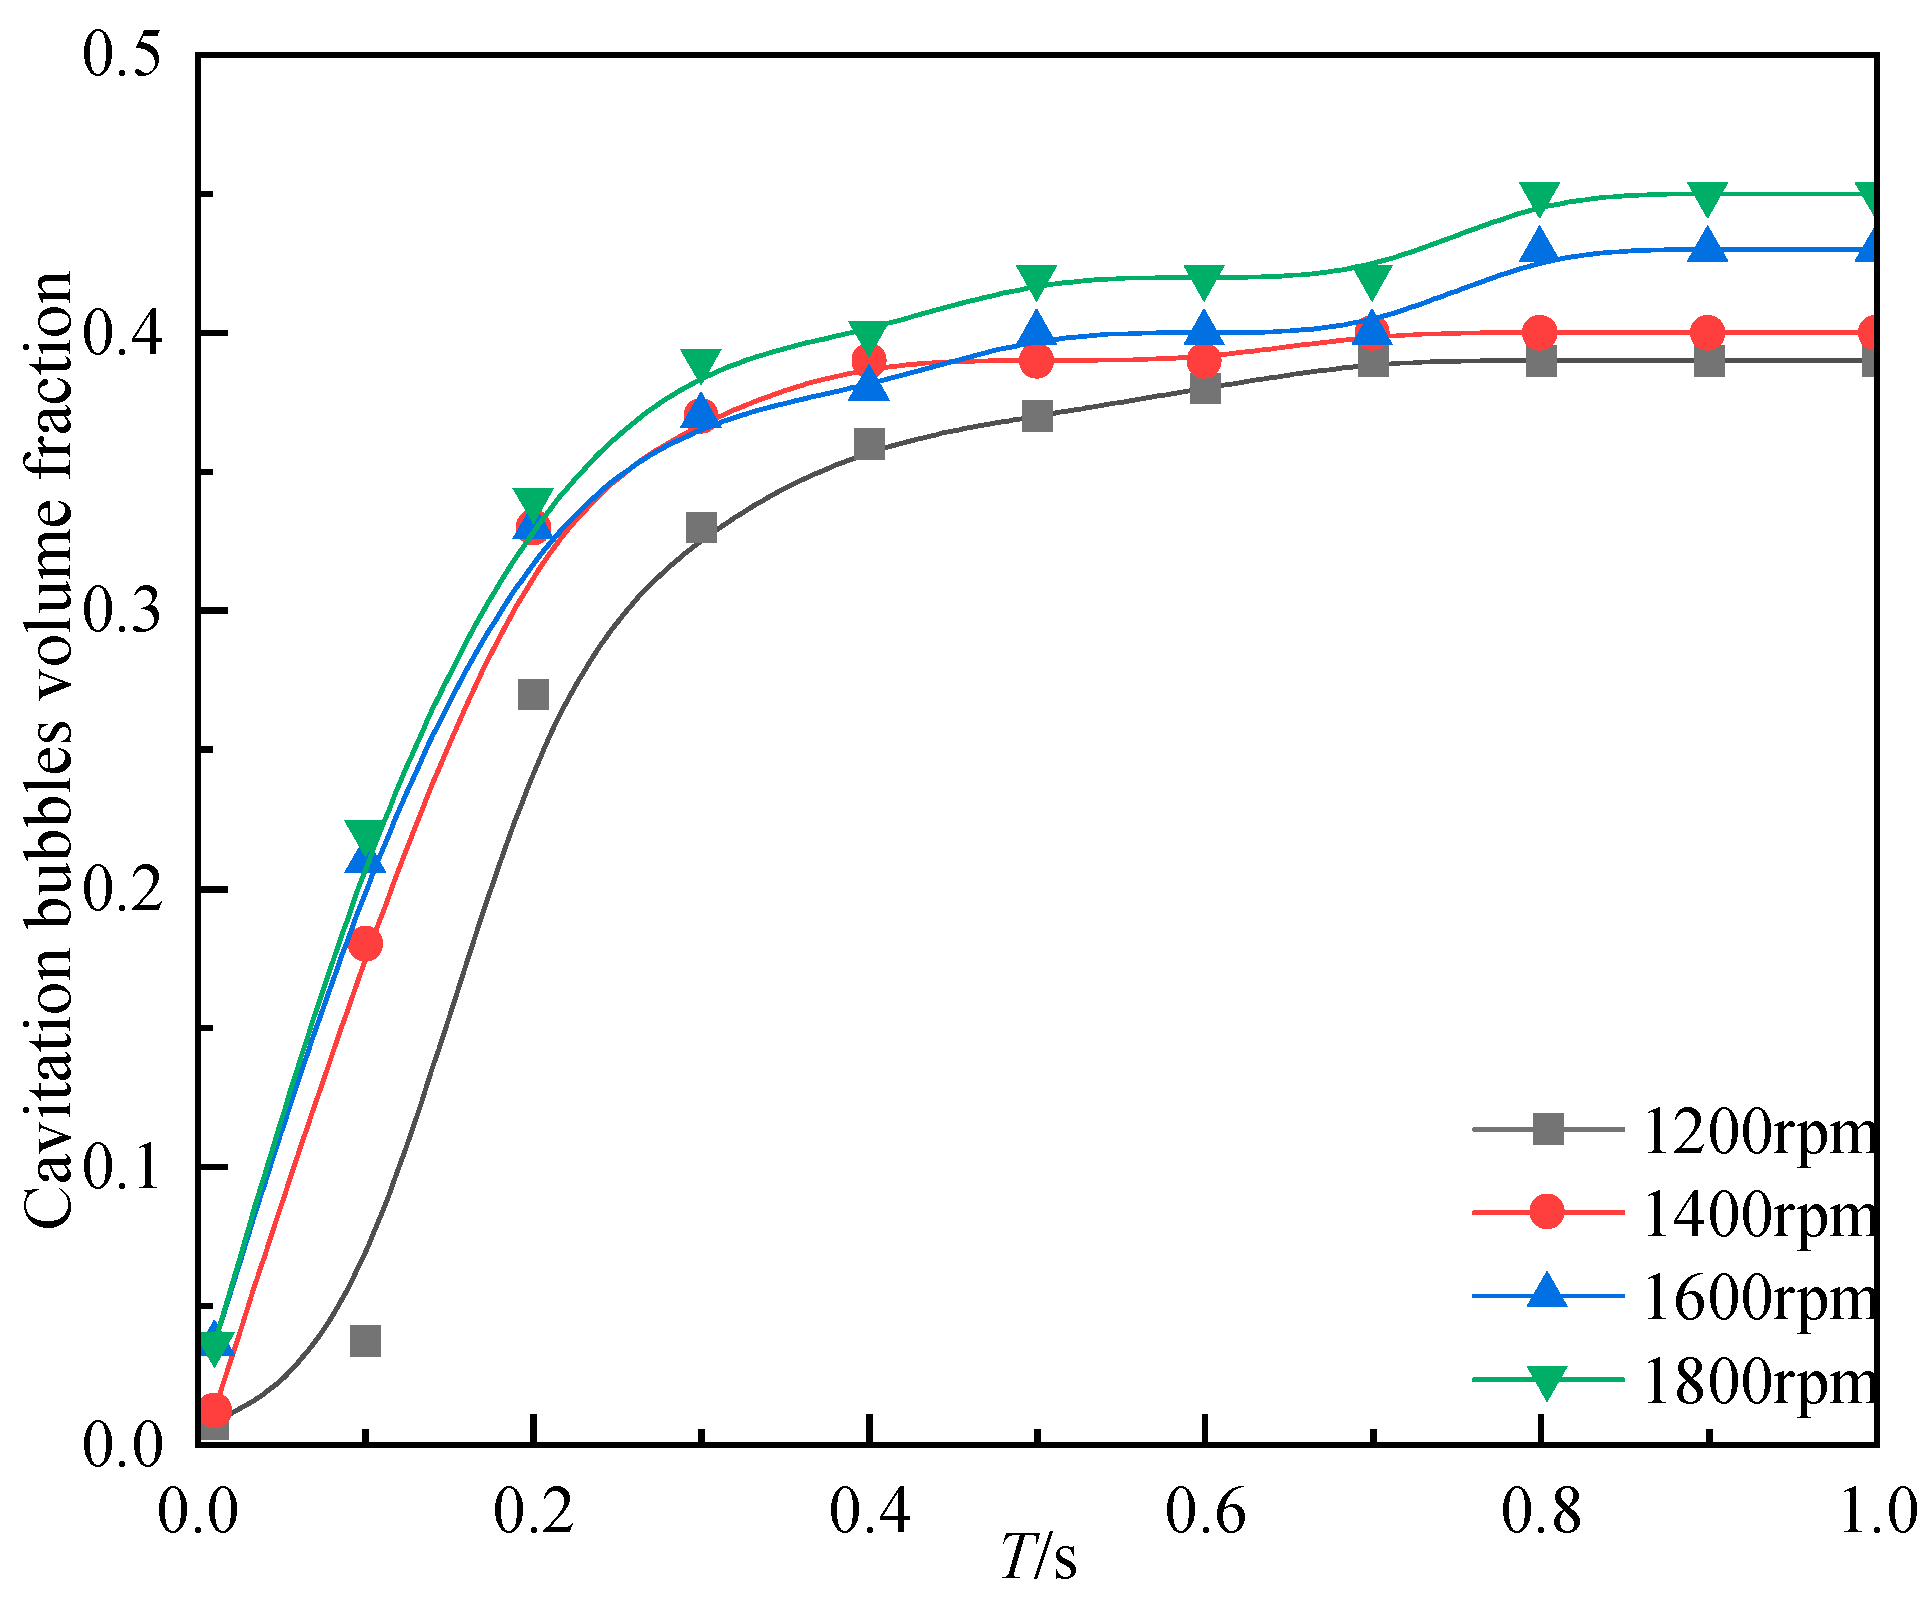
  • A novel shear hydrodynamic cavitation generator is designed to solve the problem of wastewater treatment. The moving and fixed teeth of the cavitation generator are crossed, not pairs of teeth. The numerical model was established based on the mass conservation equation and momentum conservation equation, and the Mixture model, realizable k-ε turbulence model, and Zwart cavitation model were used to describe the internal flow field. Experiments were conducted using wastewater from a printing and dyeing plant as the medium, among which the degradation rate of COD in water is taken to characterize the cavitation feature of the device. It was found that the cavitation performance increased with the increase in rotational speed. The cavitation performance decreases as the treatment volume increases. Thus, the applicability and accuracy of the mixture multiphase flow and Zwart cavitation model for the shear-type hydrodynamic cavitation generator were validated.
  • The laws governing the effect of different structural parameters on the cavitation performance are compared. Different structural parameters have a significant impact on the cavitation performance of the cavitation inducer with the number of teeth rows exerting the most noticeable influence. As the number of tooth rows increases, the volume fraction of cavitation bubbles rises. Once the number of tooth rows reaches eight, a stable low-pressure field forms inside the cavity, resulting in a stable cavitation performance. Conversely, an increase in the tooth number in a single row reduces the flow space for fluid within the cavitation inducer, leading to a decrease in cavitation performance. Furthermore, an increase in the outer diameter of the cavitation inducer enhances its centrifugal force, causing an increase in circumferential velocity and consequently increasing the shear velocity between teeth, thereby improving cavitation performance. The presence of tooth tilt alters the location of cavitation bubble generation between teeth, facilitating cavitation action on the fluid. Additionally, with an increase in the tilt angle, the low-pressure area between teeth enlarges, leading to a corresponding increase in cavitation performance.
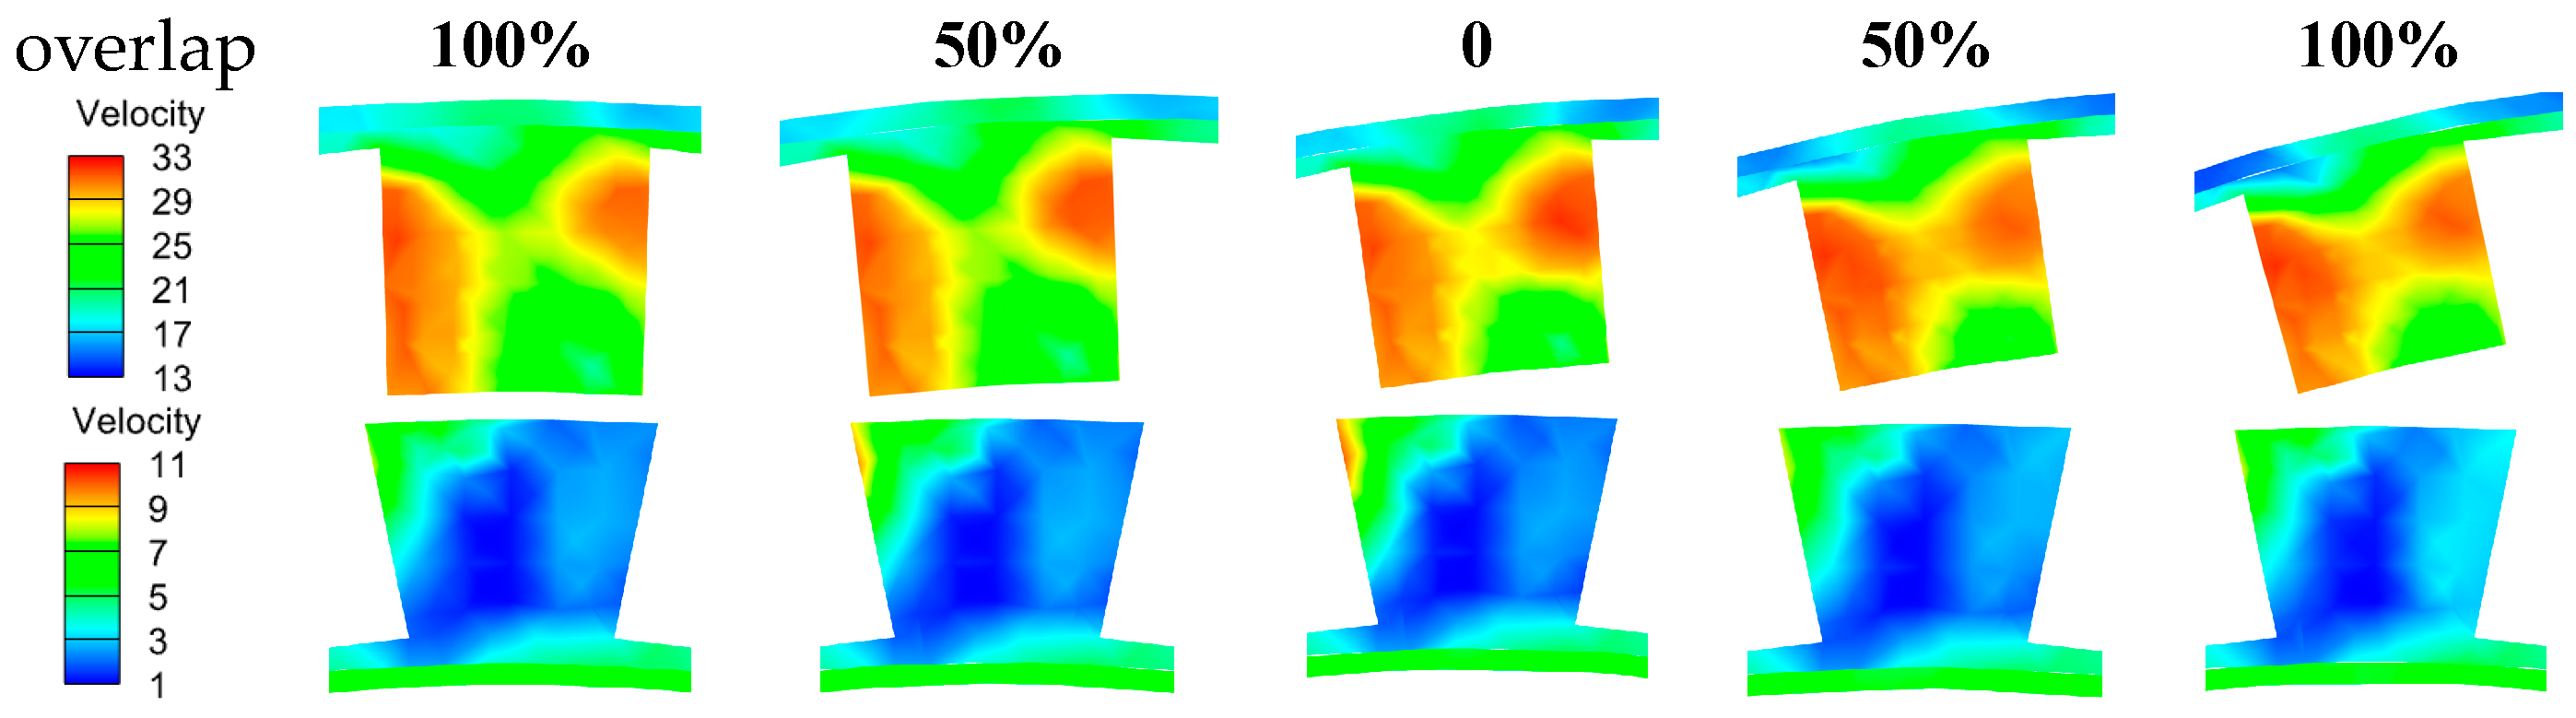
  • The cavitation between the rotated teeth is mainly formed by the centrifugal force field under extremely strong negative pressure. The cavitation between the fixed teeth by the fluid caused by the high-speed rotation of the circumferential velocity increases, bringing an increase in the shear velocity between the rotated and fixed teeth; the static pressure decreases, resulting in a localized negative pressure between the teeth and the formation of cavitation. Therefore, the size of the flow space of the fluid in the hydrodynamic cavitation generator has a great impact on the hydrodynamic cavitation generator effect as well as its shape.

Author Contributions

Conceptualization, F.L., M.T. and X.Z.; methodology, F.L., M.T. and S.H.; software, F.L., M.T. and F.Z.; validation, F.L. and M.T.; formal analysis, F.L., M.T. and S.H.; investigation, F.L., M.T. and X.Z.; resources, F.L. and M.T.; data curation, F.L., M.T. and S.Z.; writing—original draft preparation, M.T.; writing—review and editing, F.L. and M.T.; supervision, F.L.; project administration, F.L.; funding acquisition, F.L. All authors have read and agreed to the published version of the manuscript.

Funding

This work was supported by grants from the Jiangsu Provincial Graduate Student Research and Practice Innovation Program Project (Grant No. YPC23020152), the University Natural Science Research (Grant No. 19KJA430004) and the National Natural Science Foundation of China (Grant No. 52206041).

Institutional Review Board Statement

Not applicable.

Informed Consent Statement

Not applicable.

Data Availability Statement

The data that support the findings of this study are available from the corresponding author upon reasonable request. The data are not publicly available due to privacy.

Conflicts of Interest

The authors declare no conflicts of interest.

References

  1. Li, D.; Wen, J.; Ge, N.; Han, G.; Zhu, Y.; Wang, C. Study of the Mechanism of Cavitation in Inner-Hole Rotating cavitators. J. Phys. Conf. Ser. 2023, 2660, 012038. [Google Scholar] [CrossRef]
  2. Hong, F.; Xue, H.; Yuan, X.; Wang, L.; Tian, H.; Ye, L.; Jia, J.; Ying, D.; Huang, Y. Numerical investigation on the hydrodynamic performance with special emphasis on the cavitation intensity detection in a Venturi cavitator. Process Saf. Environ. Prot. 2023, 175, 212–226. [Google Scholar] [CrossRef]
  3. Shi, H.; Zhang, H.; Geng, L.; Qu, S.; Wang, X.; Nikrityuk, P.A. Dynamic behaviors of cavitation bubbles near biomimetic surfaces: A numerical study. Ocean. Eng. 2024, 292, 116628. [Google Scholar] [CrossRef]
  4. Zhou, Z.; Li, Q.; Liang, T.; Gong, S. The Numerical Simulation of Cavitation Phenomenon in a Venturi Tube. J. Phys. Conf. Ser. 2022, 2364, 012051. [Google Scholar] [CrossRef]
  5. Sun, X.; Park, J.J.; Kim, H.S.; Lee, S.H.; Seong, S.J.; Om, A.S.; Yoon, J.Y. Experimental investigation of the thermal and disinfection performances of a novel hydrodynamic cavitation reactor. Ultrason.-Sonochemistry 2018, 49, 13–23. [Google Scholar] [CrossRef] [PubMed]
  6. Bapir, S.A.; Manmi, K.M.; Saeed, R.K.; Dadvand, A. Oscillation of an ultrasonically driven gas bubble in an asymmetric confined domain. Int. J. Mech. Sci. 2024, 265, 108861. [Google Scholar] [CrossRef]
  7. Fedorov, K.; Dinesh, K.; Sun, X.; Soltani RD, C.; Wang, Z.; Sonawane, S.; Boczkaj, G. Synergistic effects of hybrid advanced oxidation processes (AOPs) based on hydrodynamic cavitation phenomenon—A review. Chem. Eng. J. 2022, 432, 134191. [Google Scholar] [CrossRef]
  8. Wilson, D.A.; Pun, K.; Ganesan, P.B.; Hamad, F. Geometrical Optimization of a Venturi-type Microbubble Generator using CFD Simulation and Experimental Measurements. Designs 2021, 5, 4. [Google Scholar] [CrossRef]
  9. Guan, X.; Zhang, Q.; Wang, Z. Numerical simulation of venturi type cavitator. Energy Chem. Ind. 2021, 42, 77–82. [Google Scholar]
  10. Wiraputra, I.G.; Edikresnha, D.; Munir, M.M. Generation of Submicron Bubbles using Venturi Tube Method. J. Phys. Conf. Ser. 2016, 739, 012058. [Google Scholar] [CrossRef]
  11. Yu, B.; Fu, P.F.; Zhang, T.; Zhou, H.C. The influence of back pressure on the flow discharge coefficients of plain orifice nozzle. Int. J. Heat Fluid Flow 2013, 44, 509–514. [Google Scholar] [CrossRef]
  12. Babu MJ, K.; Gowda GJ, C.; Ranjith, K. Numerical Study on Performance Characteristics of Multihole Orifice Plate. IOP Conf. Ser. Mater. Sci. Eng. 2018, 376, 012032. [Google Scholar] [CrossRef]
  13. Wang, B.; Zhang, R.; Li, Y.; Lian, X.; She, Z. Flow field simulation of a novel cyclonic vortex cavitator and the removal effect of this cavitator on hygromycin in wastewater. J. Environ. Eng. 2022, 16, 1490–1496. [Google Scholar]
  14. Petkovšek, M.; Zupanc, M.; Dular, M.; Kosjek, T.; Heath, E.; Kompare, B.; Širok, B. Rotation generator of hydrodynamic cavitation for water treatment. Sep. Purif. Technol. 2013, 118, 415–423. [Google Scholar] [CrossRef]
  15. Badve, M.P.; Alpar, T.; Pandit, A.B.; Gogate, P.R.; Csoka, L. Modeling the shear rate and pressure drop in a hydrodynamic cavitation reactor with experimental validation based on KI decomposition studies. Ultrason.-Sonochemistry 2015, 22, 272–277. [Google Scholar] [CrossRef] [PubMed]
  16. Liu, H.; Xu, Y.; Wang, Z.; Zhang, J.; Wang, J. Experimental and numerical simulations to examine the mechanism of nozzle geometry affecting cavitation water jets. Geoenergy Sci. Eng. 2024, 233, 212511. [Google Scholar] [CrossRef]
  17. Xu, Y.; Liu, H.; Wang, Z.; Zhang, J.; Wang, J. Analysis of the Effects of Nozzle Geometry on the Cavitation Water Jet Flow Field Using Orthogonal Decomposition. Iran. J. Sci. Technol. Trans. Mech. Eng. 2024, 48, 119–132. [Google Scholar] [CrossRef]
  18. Yuan, H.; Wang, Y.; Fu, S.; Zhou, L.; Zhang, Y.; Wu, M. Influence of tooth inclination angle on the performance of toothed disk cavitator. J. Chang. Univ. (Nat. Sci. Ed.) 2020, 32, 45–52. [Google Scholar]
  19. Yuan, H.; Lu, J.; Zhou, L.; Fu, S.; Wang, Y. Cavitation performance of a toothed disk cavitator. Chem. Eng. 2021, 49, 48–55. [Google Scholar]
  20. Lu, J. Study on the Cavitation Performance of a Toothed-Cylinder Toothed-Side Shear Cavitator. Ph.D. Thesis, Changzhou University, Changzhou, China, 2022. [Google Scholar]
  21. Petkovšek, M.; Mlakar, M.; Levstek, M.; Stražar, M.; Širok, B.; Dular, M. A novel rotation generator of hydrodynamic cavitation for waste-activated sludge disintegration. Ultrason.-Sonochemistry 2015, 26, 408–414. [Google Scholar] [CrossRef]
  22. Liu, Y.; Li, X.; Chen, T.; Wang, G.; Huang, B. Numerical computational study of rotary cavitator with internal hole. J. Beijing Inst. Technol. Beijing China 2017, 37, 1–4+14. [Google Scholar]
  23. Gong, Y.J.; Zhan, J.M.; Li, T.Z. Numerical investigation of the effect of rotation on cavitating flows over axisymmetric cavitators. J. Hydrodyn. Ser. B 2016, 28, 431–441. [Google Scholar] [CrossRef]
  24. Pham, V.D.; Ahn, B.K.; Park, C.; Kim, G.D.; Moon, I.S. Numerical study of cavitator angle effect on ventilated super cavitating flow. Eng. Appl. Comput. Fluid Mech. 2023, 17, 2215297. [Google Scholar]
  25. Yu, D.; Wei, Y.; Wang, C.; Xia, W.; Lu, J.; Zhang, W. Experimental investigation on interaction modes and geometric features of two ventilated cavities. Ocean. Eng. 2022, 264, 112479. [Google Scholar] [CrossRef]
  26. Mirzaei, M.; Jensen, P.A.; Nakhaei, M.; Wu, H.; Zakrzewski, S.; Zhou, H.; Lin, W. A hybrid multiphase model accounting for particle agglomeration for coarse-grid simulation of dense solid flow inside large-scale cyclones. Powder Technol. 2022, 399, 117186. [Google Scholar] [CrossRef]
  27. Sadeghi, M.; Sontti, S.G.; Zheng, E.; Zhang, X. Computational fluid dynamics (CFD) simulation of three–phase non–Newtonian slurry flows in industrial horizontal pipelines. Chem. Eng. Sci. 2023, 270, 118513. [Google Scholar] [CrossRef]
  28. Zhou, J.; Andersson, M. An analysis of surface breakup induced by laser-generated cavitation bubbles in a turbulent liquid jet. Exp. Fluids 2020, 61, 242. [Google Scholar] [CrossRef]
  29. Van Gent, P.L.; Van Oudheusden, B.W.; Schrijer, F.F. Determination of mean pressure from PIV in compressible flows using the Reynolds-averaging approach. Exp. Fluids 2018, 59, 41. [Google Scholar] [CrossRef]
  30. Geng, L.; Escaler, X. Assessment of RANS turbulence models and Zwart cavitation model empirical coefficients for the simulation of unsteady cloud cavitation. Eng. Appl. Comput. Fluid Mech. 2020, 14, 151–167. [Google Scholar] [CrossRef]
  31. Ezekoye, D.; Zheng, Z.Y.; Wu, J. Numerical implementation and verification of the Zwart-Gerber-Belamri cavitation model with the consideration of thermodynamic effect. J. Phys. Conf. Ser. 2024, 2707, 012135. [Google Scholar] [CrossRef]
  32. Gujar, S.K.; Agarkoti, C.; Bhat, A.; Gogate, P.R.; Sharma, A.; Mishra, B.R.; Singh, D. Coupled cavitation and AOPs treatment of Primene-JMT containing wastewater. J. Environ. Chem. Eng. 2023, 11, 109284. [Google Scholar] [CrossRef]
  33. Zhao, T.; Jv, X.; Chen, G. Effect of mill diameter and filling rate on centrifugal force of steel balls. J. Anshan Univ. Sci. Technol. 2003, 26, 41–43. [Google Scholar]
Figure 1. Schematic structure of shear hydrodynamic cavitation generator.
Applsci 14 03676 g001
Figure 2. Schematic diagram of the hydrodynamic cavitation generator mesh model.
Applsci 14 03676 g002
Figure 3. Gas-phase cloud diagram.
Applsci 14 03676 g003
Figure 4. Volume fraction of cavitation bubbles at different treatment rates (n = 1500 rpm).
Applsci 14 03676 g004
Figure 5. Cloud diagram of cavitation bubble distribution at different treatment volume (n = 1500 rpm).
Applsci 14 03676 g005
Figure 6. Variation in cavitation bubble volume fraction with time at different rotational speeds (Q = 1 m3/h).
Applsci 14 03676 g006
Figure 7. Cloud diagram of the distribution of cavitation bubbles at different rotational speeds (Q = 1 m3/h).
Applsci 14 03676 g007
Figure 8. Experimental setup for cavitation performance testing.
Applsci 14 03676 g008
Figure 9. Flow chart of the experiment: 1 water tank; 2 ball valve; 3 centrifugal pump; 4 rotor flow meter; 5 tank; 6 shear hydrodynamic cavitation generator; 7 ball valve; 8 electric motor.
Applsci 14 03676 g009
Figure 10. Effect pattern of treatment volume on degradation rate of COD in printing and dyeing wastewater.
Applsci 14 03676 g010
Figure 11. Volume fraction of cavitation bubbles for different number of teeth rows.
Applsci 14 03676 g011
Figure 12. Pressure clouds at 0.8 s for different teeth rows. (a) 1 row of teeth (b) 2 row of teeth (c) 3 row of teeth (d) 4 row of teeth (e) 5 row of teeth (f) 6 row of teeth (g) 7 row of teeth (h) 8 row of teeth.
Applsci 14 03676 g012
Figure 13. Number of teeth in a single row versus cavitation bubble volume fraction.
Applsci 14 03676 g013
Figure 14. Cloud plot of cavitation bubble volume fraction distribution for different cylinder diameters.
Applsci 14 03676 g014
Figure 15. Variation in cavitation bubble volume fraction with time for different fixed tooth outer diameter.
Applsci 14 03676 g015
Figure 16. Variation rule of cavitation bubble volume fraction with tooth inclination angle.
Applsci 14 03676 g016
Figure 17. Velocity cloud for different tooth bevel angles.
Applsci 14 03676 g017
Figure 18. Velocity cloud of 85° tooth bevel angle.
Applsci 14 03676 g018
Table 1. Mesh number independent verification.
Maximum Mesh Size (mm)MeshesCavitation Vesicle Volume FractionCalculate Time (Days)
2.28759130.356.5
2.19663350.367
2.011254570.3610
Table 2. Initial parameter settings.
Rotation SpeedHydrodynamic Cavitation Generator DiameterSingle Row of Teeth HeightPitchNumber of Teeth in a RowNumber of Rows
1500 rpm200 mm10 mm2 mm272
Disclaimer/Publisher’s Note: The statements, opinions and data contained in all publications are solely those of the individual author(s) and contributor(s) and not of MDPI and/or the editor(s). MDPI and/or the editor(s) disclaim responsibility for any injury to people or property resulting from any ideas, methods, instructions or products referred to in the content.

