1. Introduction
As modern mining engineering continues developing, the use of mine fill as an important support technology has received increasing attention [
1]. This scrutiny pertains to the selection and evaluation of the materials used for fill, which are pivotal in dictating the fill’s quality and the overall mining safety [
2,
3,
4,
5,
6,
7]. Within China’s coal mining industry, which is a significant contributor to the nation’s ore resource pool, the choice and application of fill materials are integral to both the mining operations and the fill processes [
8,
9,
10,
11].
In closed/closing coal mines, the main remaining recoverable resources are usually pillars, such as main roadway protection pillars and rise-and-dip protection pillars. These pillars are surrounded by networks of vacant roadways and disused spaces. Recovering these pillars via the caving method may undermine their stability and encourage the accumulation of water and gas, hence jeopardizing safety. To counteract this, the implementation of sophisticated fill methods is proposed to restore integrity to the vacated areas, thus enabling the safe extraction of the pillar resources. This approach has been shown to enhance the safety quotient of mining procedures significantly [
12,
13]. However, the use of traditional gangue-based pastes as fill materials has been linked to complications in subsequent coal processing stages, potentially degrading the extracted coal’s quality. In contrast, paste fillers derived from coal bases circumvent such issues [
14], suggesting their broader applicability and value in the industry.
Ultrasonic inspection is a non-destructive examination method that has been extensively utilized for the evaluation of material characteristics and the monitoring of quality, being favored for its efficiency, rapid execution, and preservation of the test subject’s integrity. Attention has increasingly been given to this method in the study of fill materials in recent times. By means of ultrasonic inspection, critical parameters such as the velocity of sound, density, and materials’ elastic modulus have been acquired, enabling the assessment of their physico-mechanical attributes [
15,
16,
17,
18,
19,
20]. Consequently, a scientific foundation for the selection and enhancement of fill materials has been provided. Additionally, the capability of ultrasonic inspection to track variations and defects in materials has been confirmed, delivering an immediate insight into the operational condition of fill structures and supporting the safeguarding and dependability of fill procedures [
21,
22,
23,
24,
25,
26,
27].
The intent of the current investigation is to determine the interplay between the velocity of ultrasonic p-wave and the strength of fill materials composed of coal aggregates, with the materials’ performance being appraised through ultrasonic methods. Critical to this inquiry was the examination of ultrasonic p-wave velocity features within the materials, through which an understanding of the connection between internal structures and overall performance was unveiled, offering a scientific foundation for the materials’ selection. Additionally, the research has aided in the enhancement of fill engineering’s quality and dependability, as well as the promotion of advancements and innovations in mining engineering and technology through the exploration of ultrasonic inspection’s application to coal based materials [
28,
29,
30,
31,
32,
33,
34,
35,
36].
2. Experimental Procedures
The fill materials based on coal aggregates were prepared based on coal grains discharged from coal washing in Shuiliandong coal mine in Binzhou County, Shannxi Province, China; these were used as a primary material. To construct the paste-like fill material, two additional ingredients were incorporated: high water content substances and cement, which were mixed with the coal particles, as shown in
Figure 1. The physical and mechanical properties of coal have been delineated in
Table 1.
2.1. Characteristics of Experimental Raw Materials
2.1.1. Coal Grains
Underground raw coal, retrieved from the Shuiliandong coal mine, serves as the primary experimental substance. It undergoes elementary crushing and screening before being amalgamated with a high-water substance and cement to fabricate the coal based paste fill material. The utilization of raw coal as a filler is selected to capitalize on resource efficiency and preclude wastage. Furthermore, when coal particles are employed as the principal component, procurement expenditures are diminished, particularly in mining operations where gangue is deficient. Moreover, the coal utilized in the fill process is reclaimed through secondary mining post-fill, thereby eliminating resource wastage. The properties of coal are listed in
Table 2 and
Table 3.
The data in
Table 4 present the relative contents of various main minerals in coal samples. The analysis of these elements is crucial for comprehending the coal grains’ material characteristics and their subsequent application in industrial production.
2.1.2. Characteristics of High-Water Materials
Two constituents form the high-water materials referenced in sources [
37,
38,
39]: material A and material B. Comprising sulfoaluminate cement clinker, a suspending agent, and a super retarder, material A is the primary composition. Conversely, material B is mainly constructed of plaster and lime, along with a suspending agent and a rapid-setting hardening accelerator. Their unique behavior upon mixing with water distinguishes these materials. Individual mixing of either material A or B with water yields a slurry that remains unset. Nonetheless, a rapid solidification occurs when these components are merged. This unique solidification property is crucial for coal based paste fill materials. The introduction of sulfoaluminate into these materials accelerates the solidification, imparting a measure of strength to the resultant cementitious substances. This expedited solidification is vital for the enhancement of the coal based paste fill materials’ efficiency and stability. The primary chemical constituents of the high-water material are listed in
Table 5 and
Table 6.
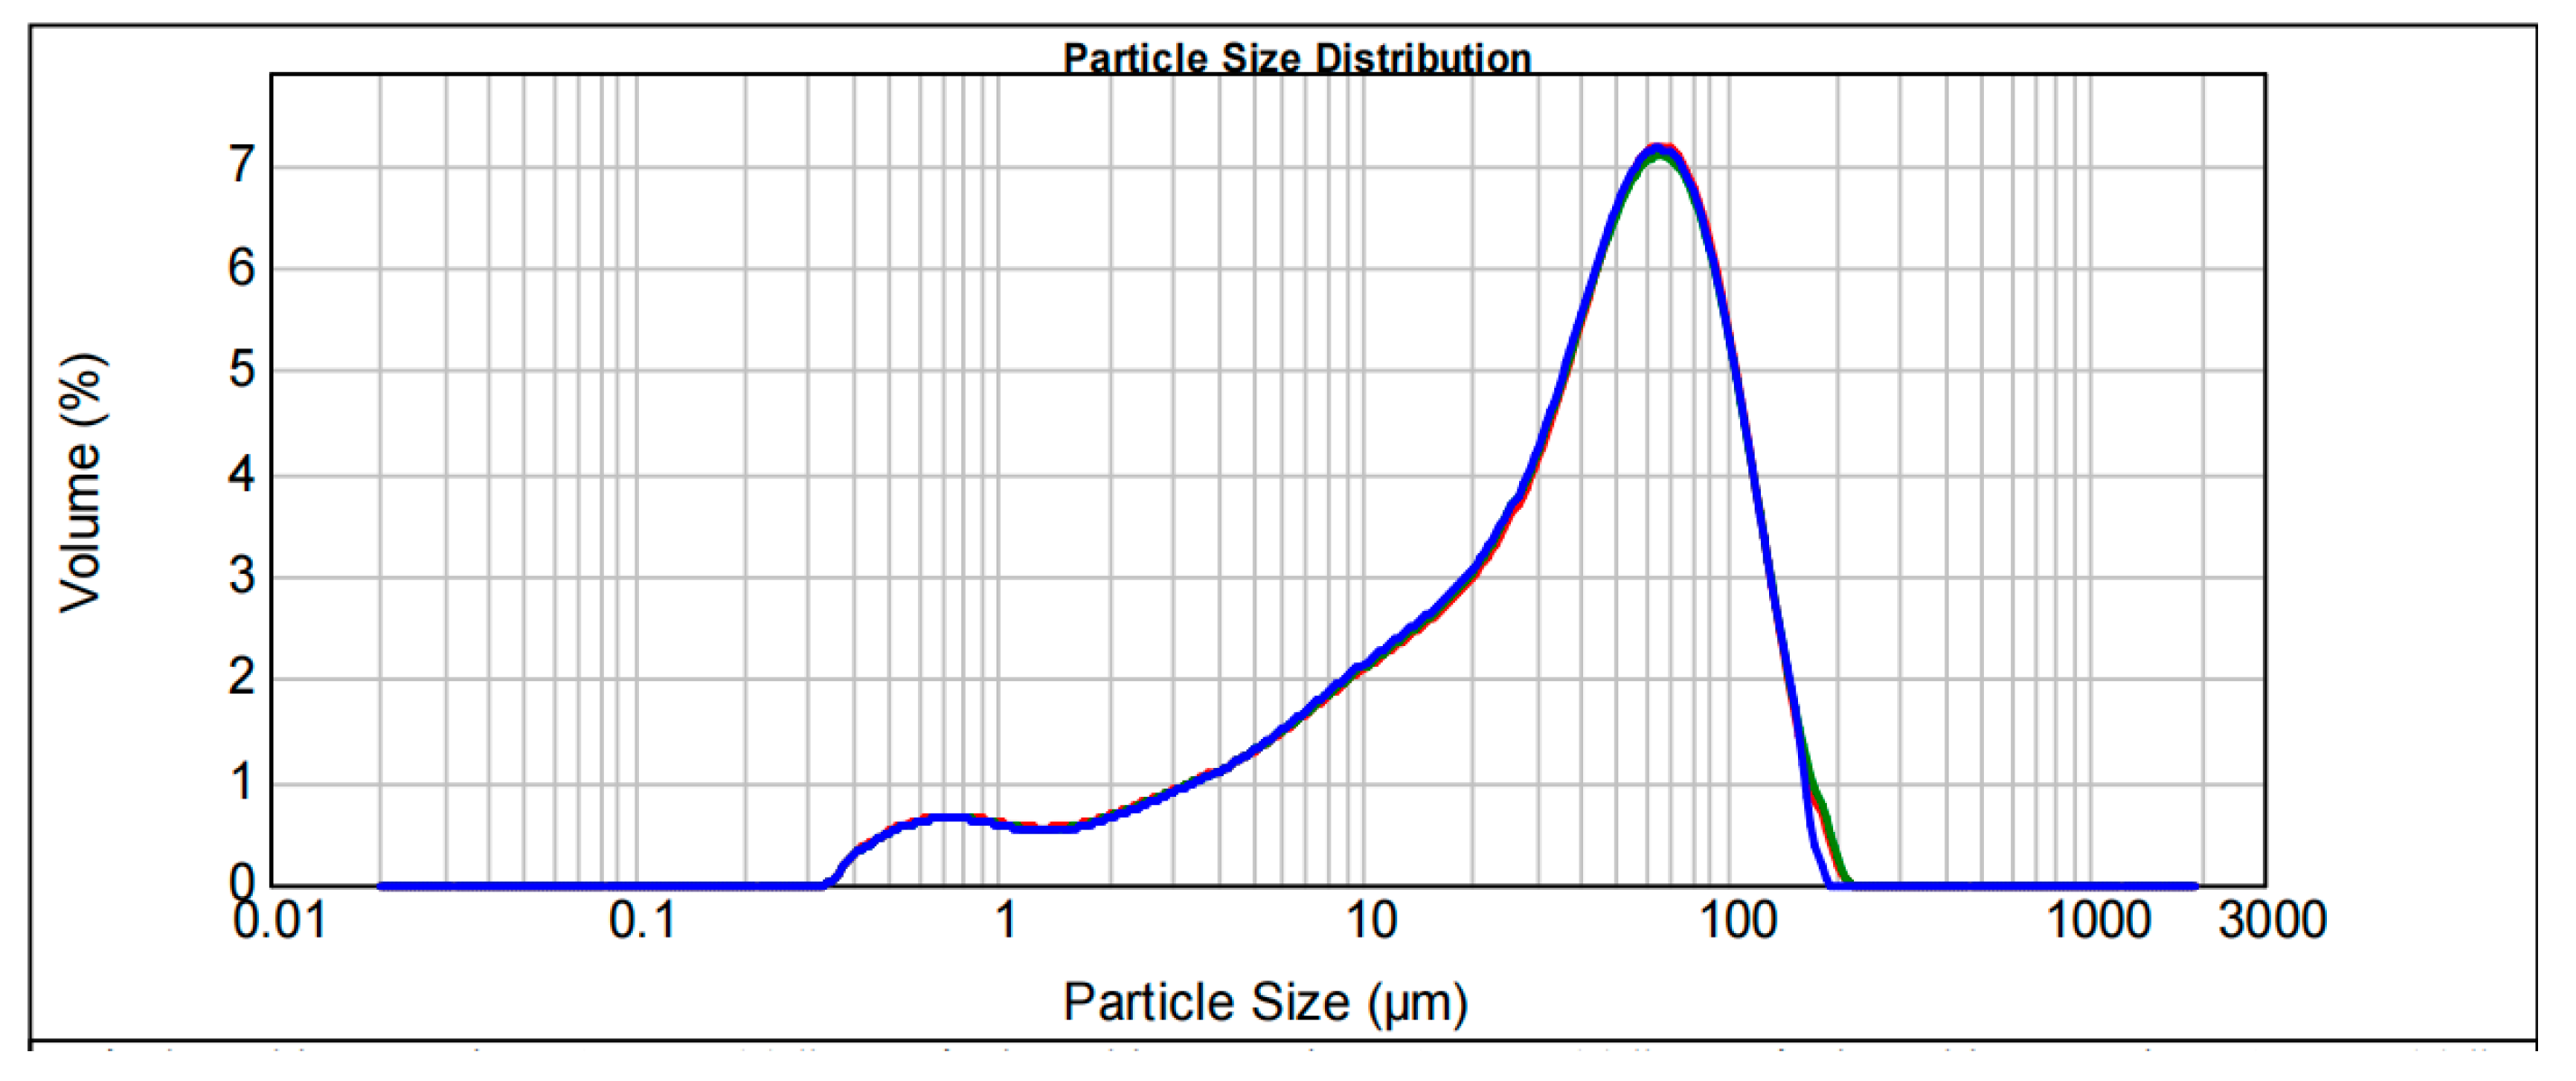
As shown in
Figure 2 and
Figure 3, the blue line in the figures are the results of the first particle size scanning results, the red lines and green lines are the second and third respectively, and the particle size of high-water materials is mainly between 1 and 100 μm. Specifically, the particle size mostly falls within the range of 10 μm to 100 μm, constituting the major proportion of the overall distribution. It is observed that there exists a relatively clear centralized trend, indicating that this range accommodates the majority of particle sizes. The density of the fill can be effectively enhanced by smaller particle sizes, leading to a reduction in particle voids and thereby improving the material’s uniformity and stability.
2.1.3. Characteristics of Cement
The additive chosen for the coal based paste fill materials was 42.5# ordinary Portland cement. Its chemical composition, which contributes to enhanced strength, stability, and durability of the fills, is vital for the safety and efficiency of coal mining operations.
Table 7 contains a summary of the cement’s chemical composition.
These components are noted to participate in the hydration reaction during the specimen preparation phase and are responsible for forming solidified structures. Their contents and ratios also influence the physical and chemical attributes, along with the engineering performance, of the cement. Therefore, the chemical constituents of the cement are meticulously controlled and understood, which is critical for the cement’s optimal selection and utilization.
As shown in
Figure 4, the blue line in the figures are the results of the first particle size scanning results, the red lines and green lines are the second and third respectively, and the particle size of cement is mainly between 1 and 100 μm. Specifically, the particle size mostly falls within the range of 10 μm to 100 μm, in which the particles are finer. In the filling process, these smaller particles can be more easily filled, thereby improving the fluidity of the filling material. Furthermore, the smaller particles possess a larger surface area, which can enhance the contact area of the reaction material. As a result, the reaction speed can be accelerated, aiding in the improvement of the strength and stability of the material.
2.2. Specimen Preparation Procedures
Materials such as material A, material B, water, cement, and powdered coal grains are all weighed dry and to reset conditions before each measurement during the preparation process. These materials are weighed to the exact mix proportions designated for the experiments. The subsequent step involves blending the weighed materials, where they are mixed thoroughly to ensure uniformity and hydration, with precautions taken to avoid moisture loss.
- (i)
The procedure incorporates steps of weighing, mixing, and mold filling: after a homogeneous mix is achieved, the coal based cemented backfill materials are transferred into molds. Prior to this, the mold’s inner surface is coated evenly with a lubricant to aid in later specimen release.
- (ii)
The vibration and demolding processes involve careful handling to ensure specimen density and integrity. After pouring, the slurry vibrates on the machine for half a minute. After vibration, the molds are smoothed and placed in a curing chamber, where they remain for seven days before the demolding is conducted. Due to their fragility in the early curing stages, the specimens are handled delicately to avoid damage.
- (iii)
Curing involves placing the specimens in a YH-60B curing box (Cangzhou Huaheng test Instrument Co., Ltd., Cangzhou, China) post-demolding, where they are kept under a controlled environment at 25 °C and a relative humidity exceeding 98% for the entire 7-day preparation period. Standard specimens are carefully prepared in nine separate material mix ratios, yielding five specimens each, resulting in 45 standard specimens in total. These specimens are all subjected to a standard curing regimen before testing begins.
Figure 5 illustrates the testing procedure in detail.
3. Orthogonal Test Schemes and Test Results
3.1. Orthogonal Design of Experiment
Pretests were designed to establish the particle sizes of coal aggregates within the specified ranges of ≤2 mm, ≤5 mm, and ≤10 mm. Concurrently, the appropriate content limits for high-water material, cement, and water are identified. Within the total mass composition (constituting 100%), the content of high-water material, cement, and water were determined to be in the ranges of 3.0% to 6.0%, 15% to 25%, and 27% to 35%, respectively. In devising the mix proportions, both the mechanical robustness and the cost-effectiveness of the fill materials were taken into account, ensuring an equilibrium between the mechanical properties and economic advantages of the resulting samples.
The orthogonal test table was employed to settle on various proportion combinations of high-water material, cement, and water for the field application of coal aggregate-based fill materials at the Shuiliandong coal mine, while the total mass was maintained at 100%. This methodical approach to design offers precise and scientific guidance for the preparation of the fill materials, aligning the production process with the actual requirements and simplifying subsequent analyses and computations.
Factors P
A, P
B, P
C, and P
D were assigned to represent the particle size of coal grains, the proportion of high-water material, the proportion of cement, and the proportion of water, respectively, as indicated below in
Table 8.
3.2. Ultrasonic Experimental Design
Ultrasonic waves are commonly used in various applications such as non-destructive testing and flaw detection of concrete components in engineering. The propagation characteristics of p-waves in ultrasonic waves are applied to analyze cracks in concrete components based on the received wave data. By using this principle, similar experiments were conducted on coal based filling materials to investigate the variation of wave velocity in coal based filling materials [
40].
The water temperature for the tests was regulated to approximately 26 °C. The materials, once prepared, were blended, agitated, and decanted into the standard triplet mold. This was followed by placing the mold on a vibrator to extricate air from the slurry, enhancing the density of the resultant fill samples. After setting in the mold and reaching an initial solidity, the samples were demolded and placed in a standard curing box. On the 28th day, the samples were extracted for the measurement of ultrasonic p-wave velocity, as referenced in [
41,
42]. Following this, the uniaxial compressive and shear strengths were tested, with the data recorded in
Table 2. The equipment utilized in these tests included a standard triplet mold with dimensions of 70.7 mm × 70.7 mm × 70.7 mm, a curing box (model YH-60B), a HICHANCE HC-U81 ultrasonic concrete detector (Tianjin Kean Instrument Technology Co., Ltd., Tianjin, China), and an MTS electro-hydraulic servo testing machine (Shandong Wanchen testing machine Co., Ltd., Jinan, China) for strength assessment.
Figure 6 illustrates the testing process, while
Table 9 details the parameters of the ultrasonic detector.
Relevant literature [
27,
28,
29] has confirmed that pressure waves, when tested on cohesive materials, travel more rapidly and penetrate more deeply than SH and SV waves, leading to the selection of pressure waves for the focus of this research.
The procedure for measuring the ultrasonic p-wave velocity of the fill bodies was adapted from the test method used for concrete. It consisted of placing a standard specimen between two transducers coated with a coupling agent. One transducer acts as the transmitter of the acoustic pulse, while the other serves as the receiver. The receiver documents the time taken for the waves to travel from the transmitter, through the specimen, and back to the receiver, denoted as the arrival time (T). The ultrasonic p-wave velocity (V) within the specimen is then calculated using the formula V = L/T, where L is the long axis of the sample.
For precise results, each sample underwent three tests, recording the arrival time for each. The arithmetic mean of these three results was computed and taken as the final ultrasonic p-wave velocity.
The initial readings from the ultrasonic detector were then processed on a computer. This measurement method is instrumental in evaluating the sound wave propagation speed through the fill bodies to assess the quality and performance of the materials under different mixing ratios.
3.3. Experimental Data and Analysis
Table 10 reveals that within the coal based paste fill materials, the ultrasonic p-wave velocity, compressive strength, and shear strength ranged from 1.596 to 2.357 km/s, 0.330 to 5.521 MPa, and 0.135 to 1.388 MPa, respectively. The wide distribution of these parameters suggests a considerable variation in p-wave velocity and strength among the different samples.
Table 11 displays the outcomes of the range analysis conducted on the experimental data. The range analysis utilizes the R value to gauge the impact level of a factor on the samples, with a higher R value signifying a more substantial influence. Consequently, based on the R values, the factors were ranked in descending order of influence on the ultrasonic p-wave velocity as P
D, P
B, P
C, and P
A, with factor P
D being identified as the primary influence.
4. The Correlation between the Strength and Ultrasonic P-wave Velocity
For the examination of the physical characteristics of coal based paste fill materials, emphasis was placed on the relationship between ultrasonic p-wave velocity and both compressive and shear strengths. This relationship was probed using correlation analysis, which sought to elucidate the connection between acoustic features and mechanical robustness, offering valuable insights for practical applications.
The correlation coefficient, particularly the Pearson correlation coefficient, was employed to quantify the linkage between variables during the correlation analysis. This coefficient ranges from −1 to 1, with values close to 1 (−1) indicating a strong positive (negative) correlation, while a coefficient near 0 suggests no correlation.
4.1. Correlation between Compressive Strength and P-wave Velocity
The ultrasonic p-wave velocities and compressive strengths measured in nine groups of mix proportions are plotted in
Figure 7.
Figure 7 highlights a simultaneous increment in ultrasonic p-wave velocity and sample strength, peaking in the fifth group of mix proportions. It was observed that at this peak, the ultrasonic p-wave velocity and compressive strength reached 2.357 km/s and 5.521 MPa, respectively.
The correlation between ultrasonic p-wave velocity and compressive strength was visualized in a heatmap depicted in
Figure 8. The coloration of the ellipses in the heatmap corresponds to the correlation coefficients’ signs, with red ellipses denoting a positive correlation. Ellipses that appear more elongated indicate a stronger correlation. It was found that the correlation coefficient between the ultrasonic p-wave velocity and compressive strength stood at 0.82, denoting a potent positive correlation. Hence, it is suggested that higher ultrasonic p-wave velocities in the coal based paste fill materials typically accompany higher compressive strengths, and vice versa.
4.2. The Correlation between the Shear Strength and Ultrasonic P-wave Velocity
Similarly,
Figure 9 shows that the ultrasonic p-wave velocity trends in harmony with the shear strength of the fill bodies. In the initial groups, an increase in shear strength was mirrored by an upsurge in ultrasonic p-wave velocity. Both metrics reached their zenith in the fifth group before simultaneously tapering off. A subsequent rise was noted following a minor dip in the seventh group of tests.
The correlation coefficient between ultrasonic p-wave velocity and shear strength, as showcased in
Figure 10, is 0.69. This coefficient indicates a positive correlation, signifying that samples with higher ultrasonic p-wave velocities tend to display greater shear strengths, while those with lower velocities tend to have reduced shear strengths.
5. Influences of Mix Proportions of Materials on the Ultrasonic P-wave Velocity
The orthogonal test outcomes underwent analysis of variance (ANOVA) to assess the significance of variations in test data due to different influencing factors, as demonstrated by the mean values. The significance of differences among various factors was evaluated to ascertain their impact on the data’s variability, with findings presented in
Table 12. In ANOVA, factor P
D’s variance was minor and, when treated as an error term, its impact on the dependent variable was minimized.
Results from the ANOVA indicated that factors PB and PD have certain effects on ultrasonic p-wave velocity within a specific range, whereas factor PC’s effect was marginal. Variance values revealed that factor PD’s influence on the ultrasonic p-wave velocity surpasses that of factor PB, positioning water content as the predominant factor affecting velocity in the specimens.
6. Parametric Analysis Model of Ultrasonic P-wave Velocity
6.1. Variation of Characteristic Parameters under the Influences of Single Factors
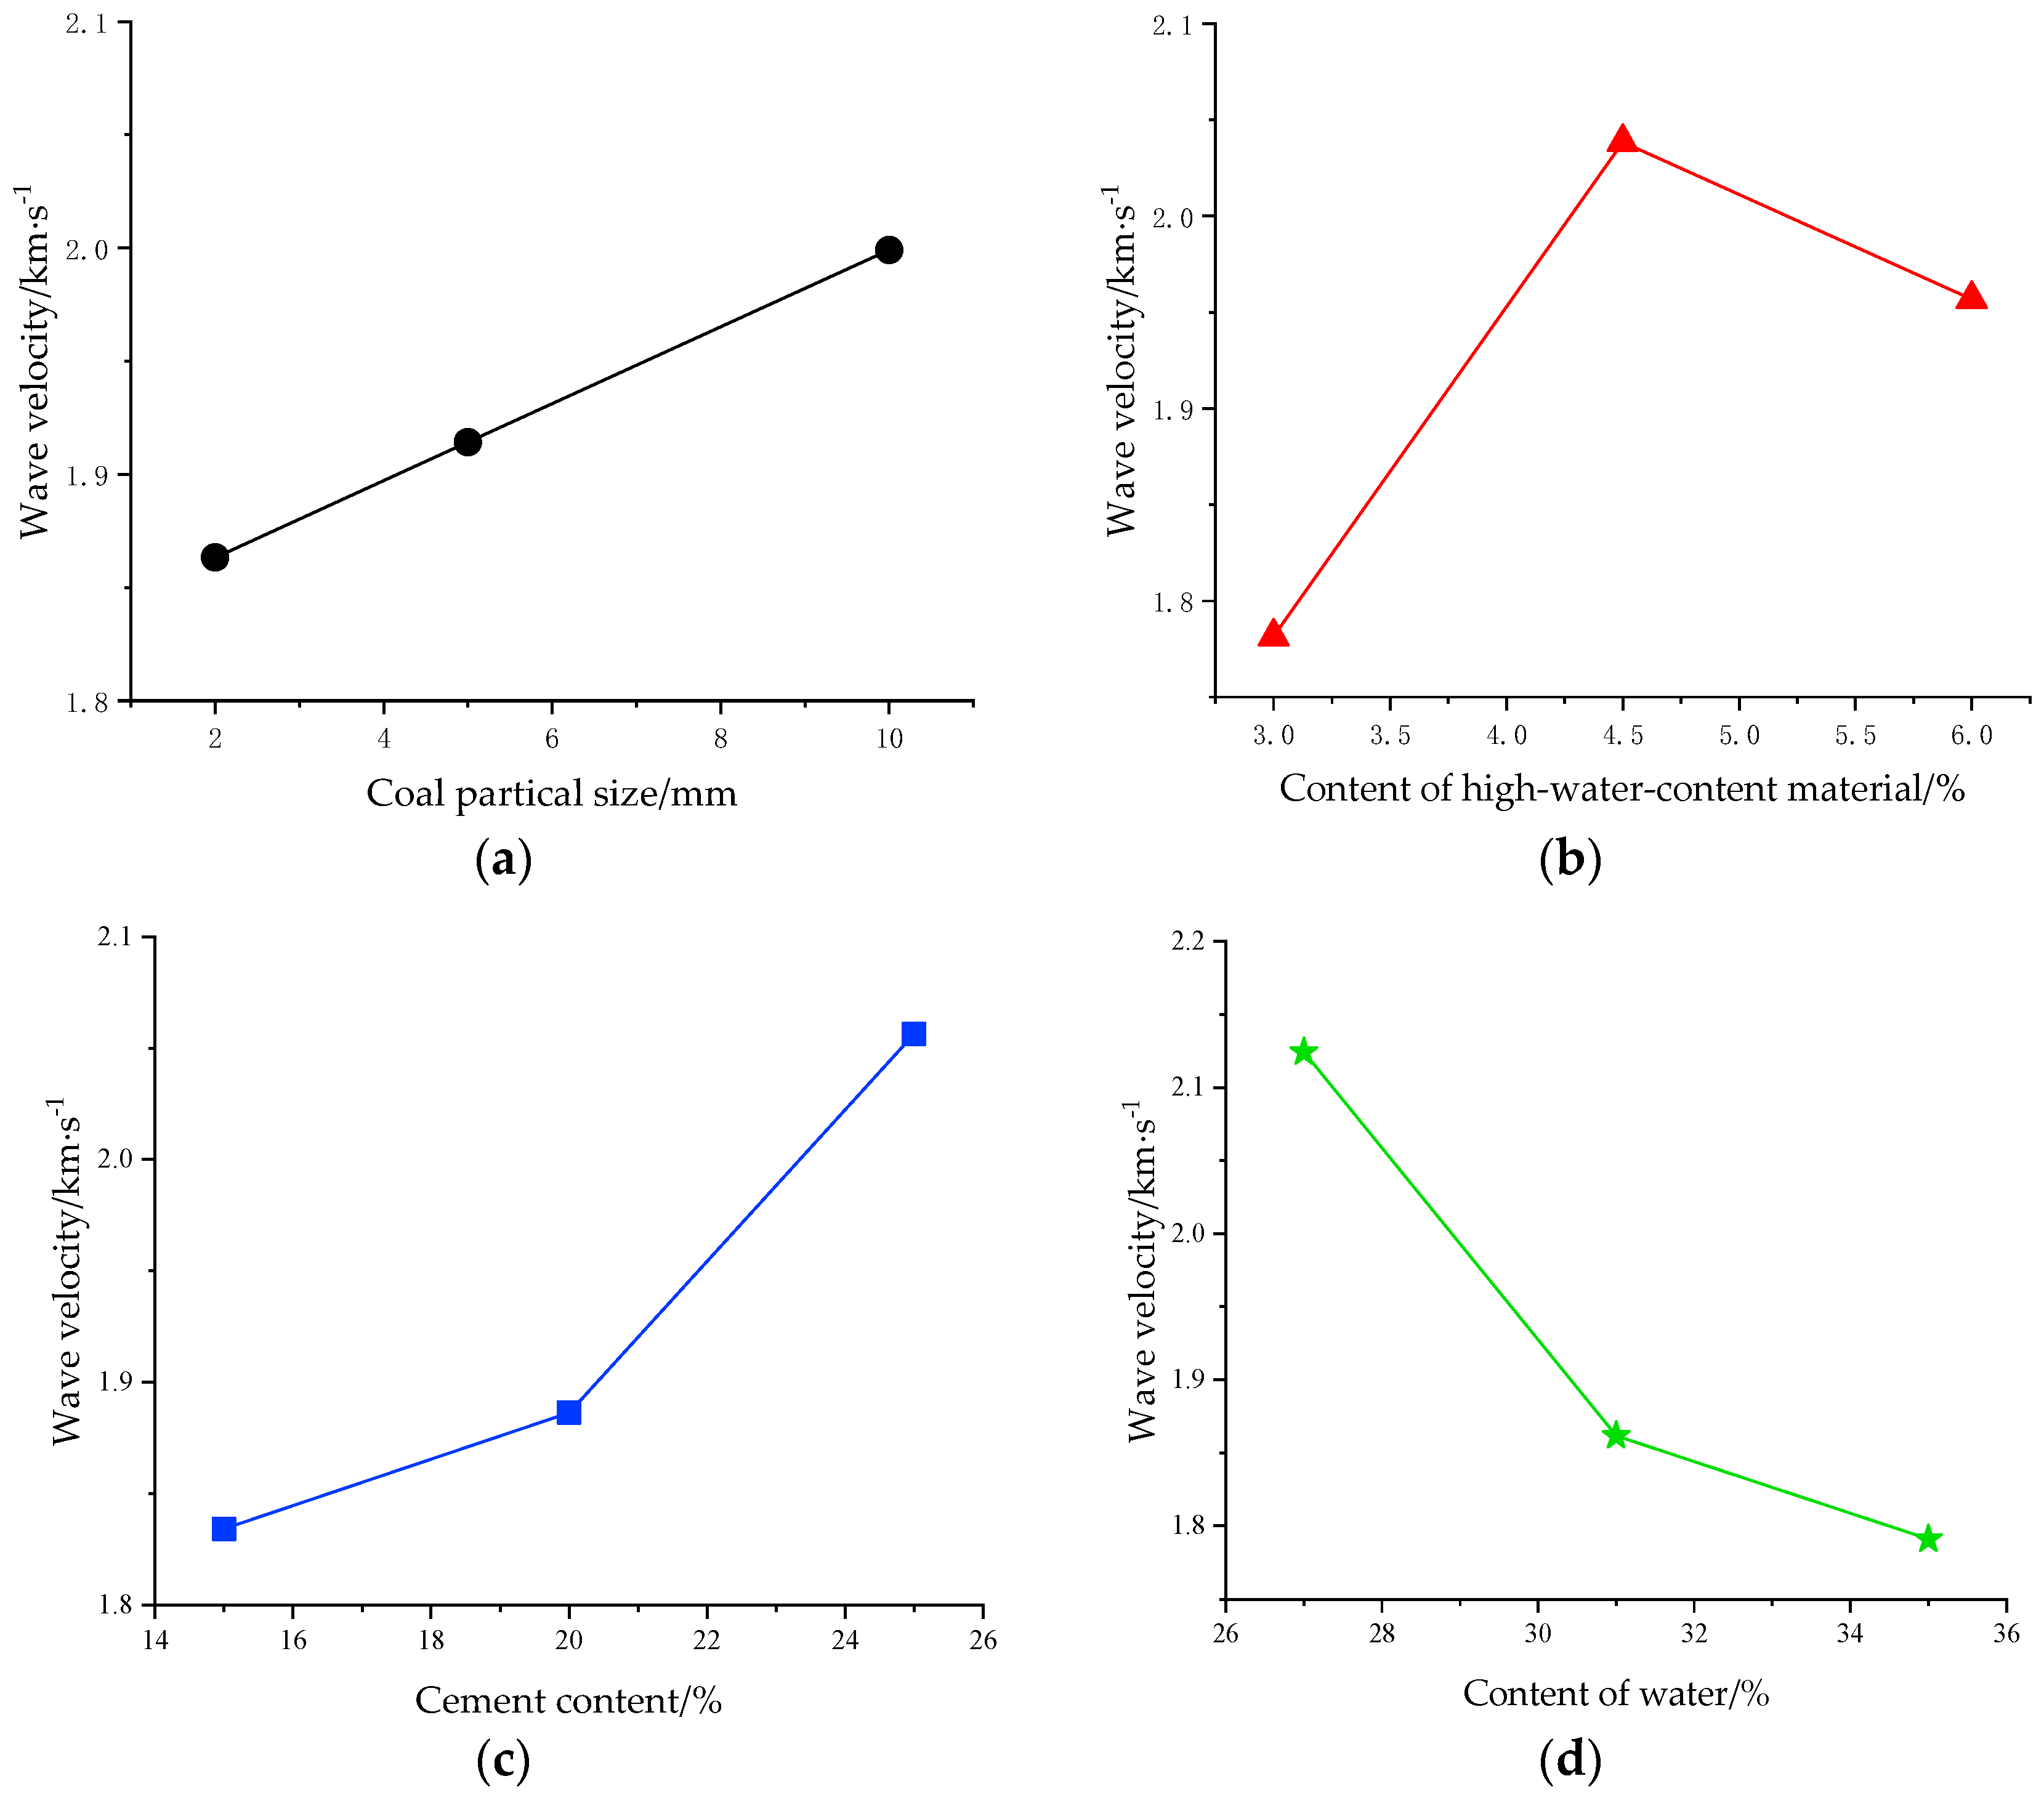
Single-factor influences on the ultrasonic p-wave velocity of the fill materials were investigated by testing samples with varied mix proportions. Based on pre-experimental data, three data points that exhibit better performance, lower economic costs, representativeness, and sufficient dispersion were selected for studying the trends and formula fitting.
Figure 11 depicts these effects, showing that the ultrasonic p-wave velocity tends to increase with the increments of factors P
A and P
C, peaks and then diminishes with increasing factor P
B and steadily declines with rising factor P
D.
6.2. Parametric Predictive Model
The relationships between the ultrasonic p-wave velocity and factors P
A, P
B, P
C, and P
D were deduced by fitting the curves shown in
Figure 11, with outcomes tabulated in
Table 13.
These fitted relationships exhibited that ultrasonic p-wave velocity and factor P
B have a quadratic polynomial relationship, while relationships with factors P
A, P
C, and P
D are exponential. From this, the fitting curves for the four factors were constructed, as illustrated in
Figure 12.
6.3. Establishment of the Predictive Model
Utilizing the identified relationships between ultrasonic p-wave velocity and various influencing factors, and in adherence to the principles for devising a multi-parameter linear model, a predictive model encapsulating the characteristic parameters of the fill materials was formulated and is denoted as Formula (1).
The myriad of test findings related to the characteristic parameters dictated that Equation (1) undergo a multiple linear regression analysis, from which the association of ultrasonic p-wave velocity with diverse determinants was derived and is articulated in Formula (2).
The independent variable interval of the fitted wave velocity prediction equation is 0 < v1 < 10; 3 < v2 < 6; 15 < v3 < 25; 27 < v4 < 35. In this interval, the predicted equation fits the actual measured wave velocity to a high degree.
6.4. Verification of the Synthetic Forecasting Model
Verification of Formula (2) involved preparing slurries and samples with two distinct mix proportions, as listed in
Table 14, and measuring their ultrasonic p-wave velocities. Predictions from the model were then compared to actual test values documented in
Table 15.
The analysis confirmed the model’s high predictive accuracy, with relative errors for various indices spanning from 4.250% to 5.580% and an average error of 4.915%.
7. Conclusions
The process of working with coal based cemented backfill materials involved steps of weighing, mixing, and transferring the homogenized mixture into molds. Prior to this transfer, a lubricating liquid was applied to the mold’s inner layer to aid in the specimen’s release.
Correlation analysis demonstrated a robust positive relationship between wave velocity and compressive strength, with a correlation coefficient of 0.87. A similar positive correlation was found with shear strength, measured by a correlation coefficient of 0.65. The descending order of factors affecting ultrasonic p-wave velocity, as shown by ANOVA results, was PD, PB, PC, and PA, highlighting water content and coal particle size as key influencing factors.
The ultrasonic p-wave velocity’s mathematical relationships with factors PA, PB, PC, and PD were quantified and fitted. Factor PB was associated with a quadratic polynomial relationship, whereas factors PA, PC, and PD were linked to exponential relationships. The established comprehensive predictive model, based on the multiple regression equation, yielded ultrasonic p-wave velocity data with an average error of 4.915% when compared to empirical test data.
Ultrasonic waves are commonly used in various applications such as non-destructive testing and flaw detection of concrete components in engineering. The propagation characteristics of p-waves in ultrasonic waves are applied to analyze cracks in concrete components based on received wave data. By using this principle, similar experiments were conducted on coal based filling materials to investigate the variation of wave velocity in coal based filling materials using ultrasonic waves. This study serves as a theoretical foundation for future underground applications.
Author Contributions
Conceptualization, B.A. Resources, B.A. Writing—original draft, C.C. Writing—review and editing, B.A., J.S. and C.C. Investigation, C.C., J.R. and J.L. Formal analysis, C.C., J.R. and J.W. Funding acquisition, B.A. and J.L. Data curation, J.S., C.C. and J.W. Supervision, B.A. and J.L. Validation, J.S., W.B. and J.W. All authors have read and agreed to the published version of the manuscript.
Funding
This research was funded by the National Natural Science Foundation of China [52274117 and 52274080], the Excellent Youth Fund of the Education Department of Hunan Province [Grant No. 21B0487], the Xinjiang Key Research and Development Special Project (No. 2022B03028-3, 2023B03009-1) and the Natural Science Foundation of Jiangsu Province (No. BK20210499).
Institutional Review Board Statement
Not applicable.
Informed Consent Statement
Not applicable.
Data Availability Statement
The original contributions presented in the study are included in the article, further inquiries can be directed to the corresponding author.
Conflicts of Interest
Authors Jinfang Ren and Wenting Bai were employed by the company Binxian Shuiliandong Coal Mine Co., Ltd. Author Jinfang Ren was employed by the company Shandong Energy Group Northwest Mining Co., Ltd. The remaining authors declare that the research was conducted in the absence of any commercial or financial relationships that could be construed as a potential conflict of interest.
References
- Yosoon, C. Recent Advances in Smart Mining Technology. Appl. Sci. 2023, 13, 3726. [Google Scholar] [CrossRef]
- Weng, Z.Q. Research on compressive strength of concrete based on ultrasonic detection. Jiangxi Build. Mater. 2023, 3, 52–55. [Google Scholar]
- Hong, Z.J.; Li, Z.H.; Du, F.; Xu, L.; Zhu, C. Experimental investigation of the mechanical properties and large-volume laboratory test of a novel fill material in mining engineering. Geomech. Geophys. Geo-Energy Geo-Resour. 2023, 9, 46–59. [Google Scholar] [CrossRef]
- Doven, G.A.; Pekrioglu, A. Material Properties of High Volume Fly Ash Cement Paste Structural Fill. J. Mater. Civ. Eng. 2005, 17, 686–693. [Google Scholar] [CrossRef]
- Carnogursky, A.E.; Fall, M.; Haruna, S. Strength development and self-desiccation of saline cemented paste backfill. Environ. Sci. Pollut. Res. Int. 2024, 31, 14894–14911. [Google Scholar] [CrossRef] [PubMed]
- Li, D.; Fan, Y.; Dong, X.; Ma, X.; Liu, P. Mechanical Properties and Hydration Mechanism of Coal Flotation Tailing Cemented Fill Materials. Minerals 2023, 3, 389. [Google Scholar] [CrossRef]
- Santos, L.A.; Matsumoto, R.; Freitas, F.D.S.; Santos, M.A.C. Geophysical Characterization and Attenuation Correction Applied for Hydrate Bearing Sediments in Japan Sea. Minerals 2023, 5, 655. [Google Scholar] [CrossRef]
- Rankine, M.R.; Sivakugan, N. Geotechnical properties of cemented paste backfill from Cannington Mine, Australia. Geotech. Geol. Eng. 2007, 25, 383–393. [Google Scholar] [CrossRef]
- Kopytov, A.; Starodubtsev, S. Application of Paste Backfill Mining Technology on the example of Daizhuang Coal Mine (China). Bull. Kuzbass State Tech. Univ. 2023, 2, 86–91. [Google Scholar] [CrossRef]
- Sha, Z.; Pu, H.; Xu, J. Dynamic Deformation and Failure Characteristics of Deep Underground Coal Measures Sandstone: The Influence of Accumulated Damage. Minerals 2022, 12, 1589. [Google Scholar] [CrossRef]
- Wang, K.; Hu, Y.; Yang, K. Experimental evaluation of rock disintegration detection in drilling by a new acoustic sensor method. J. Pet. Sci. Eng. 2020, 9, 195–206. [Google Scholar] [CrossRef]
- Shikoku, I.A.; Dunayeva, N.E. Ultrasound methods and means for examination of physical and mechanical properties of rocks. IOP Conf. Ser. Earth Environ. Sci. 2018, 6, 194–199. [Google Scholar]
- Kowalczyk, J.; Jósko, M.; Wieczorek, D.; Sędłak, K.; Nowak, M. The Influence of the Hardness of the Tested Material and the Surface Preparation Method on the Results of Ultrasonic Testing. Appl. Sci. 2023, 13, 9904. [Google Scholar] [CrossRef]
- Wang, D.D. Mechanical Properties of Coal Slime Based pre Fill Cementitious Material and its Application. Master’s Thesis, Hunan University of Science and Technology, Xiangtan, China, 2022; pp. 1–83. [Google Scholar]
- An, B.F.; Wang, D.D.; Pang, J.L. Physical simulation for surrounding rock deformation and coal pillar bearing characteristics of fill recovery room coal pillar. Rock Soil Mech. 2020, 12, 3979–3986. [Google Scholar]
- Yang, K.; Zhao, X.Y.; He, X. Experimental study on the ratio of coal based solid waste fill materials. Shanxi Coal 2021, 04, 2–6. [Google Scholar]
- Ning, J.G.; Liu, X.S.; Shi, X.S. Study on cement-coal refuse backfill structure model of mining goaf in underground mine. Coal Sci. Technol. 2015, 12, 23–27. [Google Scholar]
- Khandani, F.S.; Atapour, H.; Rad, M.Y.; Khosh, B. An experimental study on the mechanical properties of underground mining backfill materials obtained from recycling of construction and demolition waste. Case Stud. Constr. Mater. 2023, 18, e02046. [Google Scholar] [CrossRef]
- Ally, A.N.; Blanche, M.M.; Nana, U.J.P.; Grâce, M.M.; François, N.; Pettang, C. Recovery of Mining Wastes in Building Materials: A Review. Open J. Civ. Eng. 2021, 11, 379–397. [Google Scholar] [CrossRef]
- Li, X.W.; Zhao, X.Y.; Cheng, L.C. Experimental study on strength and detormation characteristics of gangue cemented backfill under optimal grading conditions. Saf. Coal Mines 2020, 5, 78–82. [Google Scholar]
- An, B.F.; Cui, C.H.; Ren, J.F.; Wang, D.D.; Wang, J.L.; Yi, Q.M. Experimental Research into the Ultrasonic P-Wave Velocity of Coal Slime Based Backfill Material. Appl. Sci. 2023, 13, 11043. [Google Scholar] [CrossRef]
- Xu, J.L.; Xuan, D.Y.; Zhu, W.B. Current situation and prospect of fill mining technology. Min. Technol. 2011, 3, 24–30. [Google Scholar]
- Zhu, J.M.; Ma, W.W.; Xu, J.H. Study on fill materials and remining technology of mined-out area in small coal mines. Met. Mine 2012, 3, 10–14. [Google Scholar]
- Dong, J.Y.; Yang, J.H.; Yang, G.X. Experimental study on ratio of similar materials based on orthogonal design for model tests. China Coal Soc. 2012, 1, 44–49. [Google Scholar]
- Tian, Z.; Liu, J.; Tang, H.; Ma, W.; Tao, P.; Dong, Z.; Hu, J. Petrophysical Acoustic Characterization of Weathered Granite: A Case Study of Mesozoic Granites in the Coastal Area of Fujian Province, China. Minerals 2023, 4, 514. [Google Scholar] [CrossRef]
- Liu, W.S.; Zhang, Y.F.; Zhang, H.L. Study on working and strength characteristics of paste fill materials. Bull. Ceram. 2015, 4, 1116–1120. [Google Scholar]
- Bao, T. Study on the method of using ultrasonic to diagnose the working stress of concrete members under axial compression. Master’s Thesis, Zhejiang Sci-tech University, Hangzhou, China, 2022; pp. 1–68. [Google Scholar]
- Chen, W.; Wu, L.; Zeng, Z.; Wan, W.; Liu, J.; Wu, X.; Peng, W.; Zeng, X.; Ren, Z.; Xie, S.; et al. Research on Uniaxial Compression Mechanics of Diorite under Flowing Acidic Solution Scouring. Minerals 2022, 12, 770. [Google Scholar] [CrossRef]
- Li, M. Experimental study on influencing factors of ultrasonic velocity in coal. Master’s Thesis, Henan Polytechnic University, Jiaozuo, China, 2014; pp. 1–86. [Google Scholar]
- Khalilidermani, M.; Knez, D. Comparing Artificial Intelligence Algorithms with Empirical Correlations in Shear Wave Velocity Prediction. Appl. Sci. 2023, 13, 13126. [Google Scholar] [CrossRef]
- Wang, Y.G.; Ju, G.G.; Chen, B.B. Experimental study on the influence of coupler on ultrasonic test of coal sample. Henan Polytech. Univ. (Nat. Sci. Ed.) 2016, 2, 173–177. [Google Scholar]
- Tai, J.L.; Sultan, M.T.H.; Łukaszewicz, A.; Shahar, F.S.; Tarasiuk, W.; Napiórkowski, J. Ultrasonic Velocity and Attenuation of Low-Carbon Steel at High Temperatures. Materials 2023, 16, 5123. [Google Scholar] [CrossRef]
- Chen, X.P.; Zhang, Z.J.; Zhou, H. Study on the influencing factors of rock P-wave velocity measurement. Eng. Surv. 2019, 2, 73–78. [Google Scholar]
- Max, K.; Gregor, S.; Steffen, M. Acoustic Emission analysis of a comprehensive database of wire breaks in prestressed concrete girders. Eng. Struct. 2022, 270, 114846. [Google Scholar]
- Zhang, M.; Fan, J.; Du, J.; Jiang, D.; Chen, J.; Yuan, Q.; Hao, L.; Wang, Y. Experimental study on effects of load damage precursor information and response characteristic of gas-containing coal for mining safety based on acoustic emission. Process Saf. Environ. Prot. 2024, 184, 993–1010. [Google Scholar] [CrossRef]
- Wang, Q.F.; Xie, W.; Zheng, Y.Y. Effect of Composition on basic properties of high-water materials. Sichuan Build. Mater. 2016, 5, 3–4. [Google Scholar]
- Feng, G.M.; Ding, Y.; Zhu, H.J. Experimental study on ultra-high water fill material and its structure for mining. China Univ. Min. Technol. 2010, 6, 813–819. [Google Scholar]
- Feng, G.M. Research on the superhigh-water packing material and fill mining technology and their application. China Univ. Min. Technol 2009, 35, 1963–1968. [Google Scholar]
- Li, H.G.; Wang, J.; Liu, K. Study on the relationship between longitudinal wave velocity and mechanical properties of overlying rock in Shendong Mining area. Min. Res. Dev. 2023, 8, 113–119. [Google Scholar]
- Xiang, J.Z.; Song, H.; Leng, M.H.; Gui, F.L. Effect of aggregate size on ultrasonic pulse velocity of pervious concrete. Concrete 2022, 10, 106–111. [Google Scholar]
- Hou, X.M.; Sun, M.; Zhang, Y.L. Comparison study of longitudinal wave velocity measured by vibration method and ultrasonic method. Vib. Shock 2021, 3, 264–269. [Google Scholar]
- Sun, B.; Li, X.; Cui, K.; Peng, N.; Hong, J.; Chen, R.; Jia, C. Study on the Characteristics of Damaged Sandstone in the Longshan Grottoes Using Water Chemistry and Freeze–Thaw Cycling. Minerals 2023, 3, 430. [Google Scholar] [CrossRef]
Figure 1.
Raw materials used in the tests.
Figure 1.
Raw materials used in the tests.
Figure 2.
The particle size distribution of material A (sulfoaluminate).
Figure 2.
The particle size distribution of material A (sulfoaluminate).
Figure 3.
The particle size distribution of material B (plaster).
Figure 3.
The particle size distribution of material B (plaster).
Figure 4.
The particle size distribution of cement.
Figure 4.
The particle size distribution of cement.
Figure 5.
Experimental flow chart.
Figure 5.
Experimental flow chart.
Figure 6.
Ultrasonic p-wave velocity measurement of specimens.
Figure 6.
Ultrasonic p-wave velocity measurement of specimens.
Figure 7.
Changes in the ultrasonic p-wave velocity and compressive strength under different mix proportions.
Figure 7.
Changes in the ultrasonic p-wave velocity and compressive strength under different mix proportions.
Figure 8.
Heatmap for the correlation coefficient between the ultrasonic p-wave velocity and compressive strength.
Figure 8.
Heatmap for the correlation coefficient between the ultrasonic p-wave velocity and compressive strength.
Figure 9.
Changes in the ultrasonic p-wave velocity and shear strength under different mix proportions.
Figure 9.
Changes in the ultrasonic p-wave velocity and shear strength under different mix proportions.
Figure 10.
Heatmap for the correlation coefficient between the ultrasonic p-wave velocity and shear strengths.
Figure 10.
Heatmap for the correlation coefficient between the ultrasonic p-wave velocity and shear strengths.
Figure 11.
The ultrasonic p-wave velocity in fill materials is analyzed under varying influential factors: (a) Influence of the particle size of coal grains. (b) Influence of the high-water material content. (c) Influence of the cement content. (d) Influence of the water content.
Figure 11.
The ultrasonic p-wave velocity in fill materials is analyzed under varying influential factors: (a) Influence of the particle size of coal grains. (b) Influence of the high-water material content. (c) Influence of the cement content. (d) Influence of the water content.
Figure 12.
For the wave velocity fitting curves of different factors. (a) Particle size of coal grains. (b) High-water material. (c) Cement. (d) Water content.
Figure 12.
For the wave velocity fitting curves of different factors. (a) Particle size of coal grains. (b) High-water material. (c) Cement. (d) Water content.
Table 1.
Orthogonal test factor table (designed by mass scale).
Table 1.
Orthogonal test factor table (designed by mass scale).
| Apparent Density/kg·m−3 | Moisture Content/% | Unidirectional Compressive Strength/MPa | Unidirectional Tensile Strength/MPa | Modulus of Elasticity/GPa | Poisson’s Ratio | Cohesive Force/MPa | Angle of Internal Friction/° |
|---|
| 1296.37 | 7.19 | 20.13 | 1.39 | 2.88 | 0.33 | 4.31 | 37.00 |
Table 2.
Physical properties of coal samples.
Table 2.
Physical properties of coal samples.
| Group | Apparent Density/kg·m−3 | Moisture Content/% |
|---|
| 1 | 1297.85 | 7.23 |
| 2 | 1301.59 | 6.76 |
| 3 | 1289.68 | 7.57 |
| Average | 1296.37 | 7.19 |
Table 3.
Mechanical properties of coal samples.
Table 3.
Mechanical properties of coal samples.
| Group | Uniaxial Compressive Strength/MPa | Uniaxial Tensile Strength/MPa | Elastic Modulus/GPa | Poisson’s Ratio | Cohesive Force/MPa | Internal Friction Angle/° |
|---|
| 1 | 23.79 | 1.58 | 3.09 | 0.34 | 4.31 | 37.00 |
| 2 | 24.27 | 1.41 | 2.97 | 0.29 |
| 3 | 17.35 | 1.77 | 2.58 | 0.37 |
| 4 | 16.46 | 1.31 | - | - |
| 5 | 18.79 | 0.89 | - | - |
| Average | 20.13 | 1.39 | 2.88 | 0.33 |
Table 4.
Relative contents of various main minerals in coal samples (mass fraction) %.
Table 4.
Relative contents of various main minerals in coal samples (mass fraction) %.
| Carbon | Hydrogen | Nitrogen | Sulfur | Oxygen | Moisture | Ash |
|---|
| 80.03 | 3.01 | 1.36 | 1.12 | 6.17 | 3.30 | 5.01 |
Table 5.
Chemical composition of high-water material A (mass fraction) %.
Table 5.
Chemical composition of high-water material A (mass fraction) %.
| SiO2 | Al2O3 | Fe2O3 | SO3 | TiO2 | K2O | Na2O | CaO | MgO |
|---|
| 14.13 | 27.14 | 42.52 | 3.87 | 2.65 | 7.73 | 0.97 | 0.88 | 0.11 |
Table 6.
Chemical composition of high-water material B (plaster) (mass fraction) %.
Table 6.
Chemical composition of high-water material B (plaster) (mass fraction) %.
| CaO | Al2O3 | Fe2O3 | SO3 | SiO2 | MgO | K2O | Na2O |
|---|
| 30.75 | 2.03 | 0.62 | 38.11 | 5.21 | 2.16 | 0.19 | 0.07 |
Table 7.
Chemical composition of cement (mass fraction) by %.
Table 7.
Chemical composition of cement (mass fraction) by %.
| SiO2 | Al2O3 | Fe2O3 | CaO | MgO | SO3 | K2O | Na2O | TiO2 |
|---|
| 22.53 | 5.31 | 4.72 | 61.71 | 2.08 | 2.17 | 0.82 | 0.37 | 0.29 |
Table 8.
Factors (designed in proportion to mass).
Table 8.
Factors (designed in proportion to mass).
| Levels | PA. Particle Size of Coal Grains | PB. Proportion of High-Water Material | PC. Proportion of Cement | PD. Proportion of Water |
|---|
| 1 | 0~2 mm | 3.00% | 15.00% | 27.00% |
| 2 | 0~5 mm | 4.50% | 20.00% | 31.00% |
| 3 | 0~10 mm | 6.00% | 25.00% | 35.00% |
Table 9.
Ultrasonic tester parameter setting.
Table 9.
Ultrasonic tester parameter setting.
| Measurement point spacing (mm) | 70.7 | Sampling period (μs) | 0.50 |
| Ultrasonic frequency (Hz) | 50 k | Zero sound correction (μs) | 12.50 |
| Emission voltage (V) | 500 | Aggregate | coal |
Table 10.
Summary of orthogonal test results.
Table 10.
Summary of orthogonal test results.
| Test Groups | Influencing Factors | Test Results |
|---|
| PA | PB | PC | PD | Wave Velocity/km·s−1 | Compressive Strength/MPa | Shear Strength/MPa |
|---|
| 1 | 2 | 3.00 | 15 | 27 | 1.826 | 2.387 | 0.537 |
| 2 | 2 | 4.50 | 20 | 31 | 1.873 | 2.455 | 0.748 |
| 3 | 2 | 6.00 | 25 | 35 | 1.891 | 0.333 | 0.135 |
| 4 | 5 | 3.00 | 20 | 35 | 1.596 | 1.393 | 0.484 |
| 5 | 5 | 4.50 | 25 | 27 | 2.357 | 5.521 | 1.388 |
| 6 | 5 | 6.00 | 15 | 31 | 1.790 | 1.879 | 0.565 |
| 7 | 10 | 3.00 | 25 | 31 | 1.922 | 2.888 | 0.591 |
| 8 | 10 | 4.50 | 15 | 35 | 1.886 | 1.806 | 0.281 |
| 9 | 10 | 6.00 | 20 | 27 | 2.190 | 3.601 | 0.690 |
Table 11.
Ranged analysis of test data.
Table 11.
Ranged analysis of test data.
| Factor | Ultrasonic P-wave Velocity/km·s−1 |
|---|
| PA | PB | PC | PD |
|---|
| k1 | 1.863 | 1.781 | 1.834 | 2.124 |
| k2 | 1.914 | 2.039 | 1.886 | 1.862 |
| k3 | 1.999 | 1.957 | 2.057 | 1.791 |
| R | 1.358 | 2.569 | 2.225 | 3.334 |
Table 12.
Analysis of variance of test data.
Table 12.
Analysis of variance of test data.
| Source of Variation | Sum of Squared Deviations | Degree of Freedom | Variance | F-Value | Fα 2 | Significant Level |
|---|
| A | 10.334 | 2 | 5.167 | 3.665 | F0.01(2,2) = 99
F0.05(2,2) = 19
F0.1(2,2) = 9
F0.25(2,2) = 3 | o 1 |
| B | 8.127 | 2 | 4.063 | 2.882 | - |
| C | 18.523 | 2 | 9.262 | 6.569 | o |
| Error e | 2.820 | 2 | 1.410 | - | - |
| Sum | 39.803 | - | - | - | - |
Table 13.
Fitting relationship.
Table 13.
Fitting relationship.
| Factor | Index | Fit Relation | General Formula | Degree of Fit R2 |
|---|
| Particle size of coal grains (PA) | Ultrasonic p-wave velocity | | | 0.99 |
| High-water material content (PB) | Ultrasonic p-wave velocity | | | 0.99 |
| Cement content (PC) | Ultrasonic p-wave velocity | | | 0.99 |
| Water content (PD) | Ultrasonic p-wave velocity | | | 0.99 |
Table 14.
Design of verification schemes.
Table 14.
Design of verification schemes.
| The Specimen Number | PA. Coal Particle Size/mm | PB. High-Water Material Content/% | PC. Cement Content/% | PD. Water Content/% |
|---|
| C1 | 0~6 | 3.80 | 23 | 29 |
| C2 | 0~4 | 5.20 | 18 | 32 |
Table 15.
Analysis of verification results.
Table 15.
Analysis of verification results.
| The Specimen Number | Materials | Wave Velocity/km·s−1 |
|---|
| 1 | 2 | 3 |
|---|
| C1 | Predicted values | 2.287 | 2.305 | 2.323 |
| Experimental values | 2.354 | 2.033 | 2.276 |
| Average error/% | 4.250% |
| C2 | Predicted values | 1.831 | 1.855 | 1.879 |
| Experimental values | 1.672 | 1.877 | 1.722 |
| Average error/% | 5.580% |
| Disclaimer/Publisher’s Note: The statements, opinions and data contained in all publications are solely those of the individual author(s) and contributor(s) and not of MDPI and/or the editor(s). MDPI and/or the editor(s) disclaim responsibility for any injury to people or property resulting from any ideas, methods, instructions or products referred to in the content. |
© 2024 by the authors. Licensee MDPI, Basel, Switzerland. This article is an open access article distributed under the terms and conditions of the Creative Commons Attribution (CC BY) license (https://creativecommons.org/licenses/by/4.0/).

 ,
, 


