1. Introduction
The rapid increase in the global population has resulted in an increased demand for beef [
1].
Figure 1, published by the Organization for Economic Co-operation and Development (OECD), shows beef consumption per capita by OECD countries during 2014–2021 [
2], wherein it is evident that beef consumption has been increasing annually owing to the rising demand.
Therefore, precision livestock farming (PLF) is actively being developed to ensure effective and efficient livestock production [
3]. PLF involves the development of monitoring systems for various livestock characteristics, including health and welfare [
4]. Analyzing livestock behavior in PLF is crucial because it enables the assessment of the current conditions of animals [
5]. Detecting the behavior of livestock not only aids in the real-time monitoring of animal health but also plays a crucial role in farm management. The ability to detect changes in behavior can act as an early indicator of potential health issues, enabling timely intervention and treatment. Additionally, it can assist in quickly identifying and addressing any stressors or discomforts experienced by the livestock. In particular, observing behaviors such as drinking, eating, and lying down can help determine the health status of livestock or diagnose diseases early [
6,
7]. However, monitoring livestock behavior requires substantial human resources and labor. Furthermore, the direct observation of livestock is unsustainable, as the observer’s attention inevitably decreases because of fatigue. Therefore, recent studies have focused on methods that enable observing livestock behavior without the need for continuous human monitoring.
Pavlovic et al. [
8] collected cow behavioral data through a neck-mounted three-axis accelerometer sensor and a jaw-mounted pressure sensor. Based on these data, they classified cow behaviors into three categories: ruminating, feeding, and others. Their classification model employed a convolutional neural network architecture and achieved an F1 score of 0.82, which indicates the good overall accuracy of the model. Similarly, Williams et al. [
9] classified “defecation” and “urination” behaviors using an accelerometer attached to the cows’ tails. They developed a classification model using the random forest algorithm, which is an ensemble algorithm that makes predictions by learning from numerous decision trees, and achieved
sensitivity (recall) and
precision scores of >86.7%. Methods that analyze cattle behavior based on sensor data are effective and exhibit high performance for livestock behavior classification. However, such sensor-based data collection methods necessitate the direct attachment of sensors to livestock, which can cause stress in the animals. Additionally, these sensors are susceptible to damage and contamination; therefore, farmers must periodically check them, which increases their workload [
10,
11].
In contrast to research based on sensor-based methods, some studies have determined livestock behavior using data obtained from 3D cameras. Chen et al. [
12] introduced an algorithm that uses the Intel RealSense depth camera and a support vector machine to detect aggressive behavior in pigs; the algorithm exhibited an accuracy of 97.5%. As noted in previous studies, employing 3D camera data under suitable conditions can result in high performance. However, 3D cameras are susceptible to direct sunlight, which hinders their outdoor use. Additionally, their range is limited as they can only capture data effectively within a specific range [
13]. Moreover, 3D cameras have lower resolutions and cost more than 2D RGB cameras, rendering their usage on livestock farms challenging [
14].
Therefore, some studies have analyzed livestock behavior using 2D image data. Zhang et al. [
15] proposed an algorithm that detects the behaviors of sows using image data and classifies them into “drinking”, “urination”, and “mounting” using the MobileNet model; the algorithm exhibited a
mean average precision (mAP) of 93.4%. Additionally, Wang et al. [
16] detected the estrous behavior of cows based on 2D image data using the you only look once v5 (YOLOv5) model, which achieved a
mAP of 94.3%. Such models that detect livestock behavior based on 2D image data have shown good performances. A significant advantage of these methods is that they enable analysis of various behaviors noninvasively [
17]. Moreover, 2D cameras have a wider field of view than 3D cameras and are relatively stable against direct sunlight, rendering them more suitable for applications on livestock farms. Therefore, this study proposes a system that detects cattle behavior using data collected with 2D RGB cameras. The proposed model was implemented using YOLOv7-E6E, an object detection algorithm. Additionally, we employed data augmentation techniques to mitigate the problem of insufficient data. By detecting cattle behavior in real time, this proposed system can significantly assist livestock farmers.
2. Materials and Methods
2.1. Data Acquisition
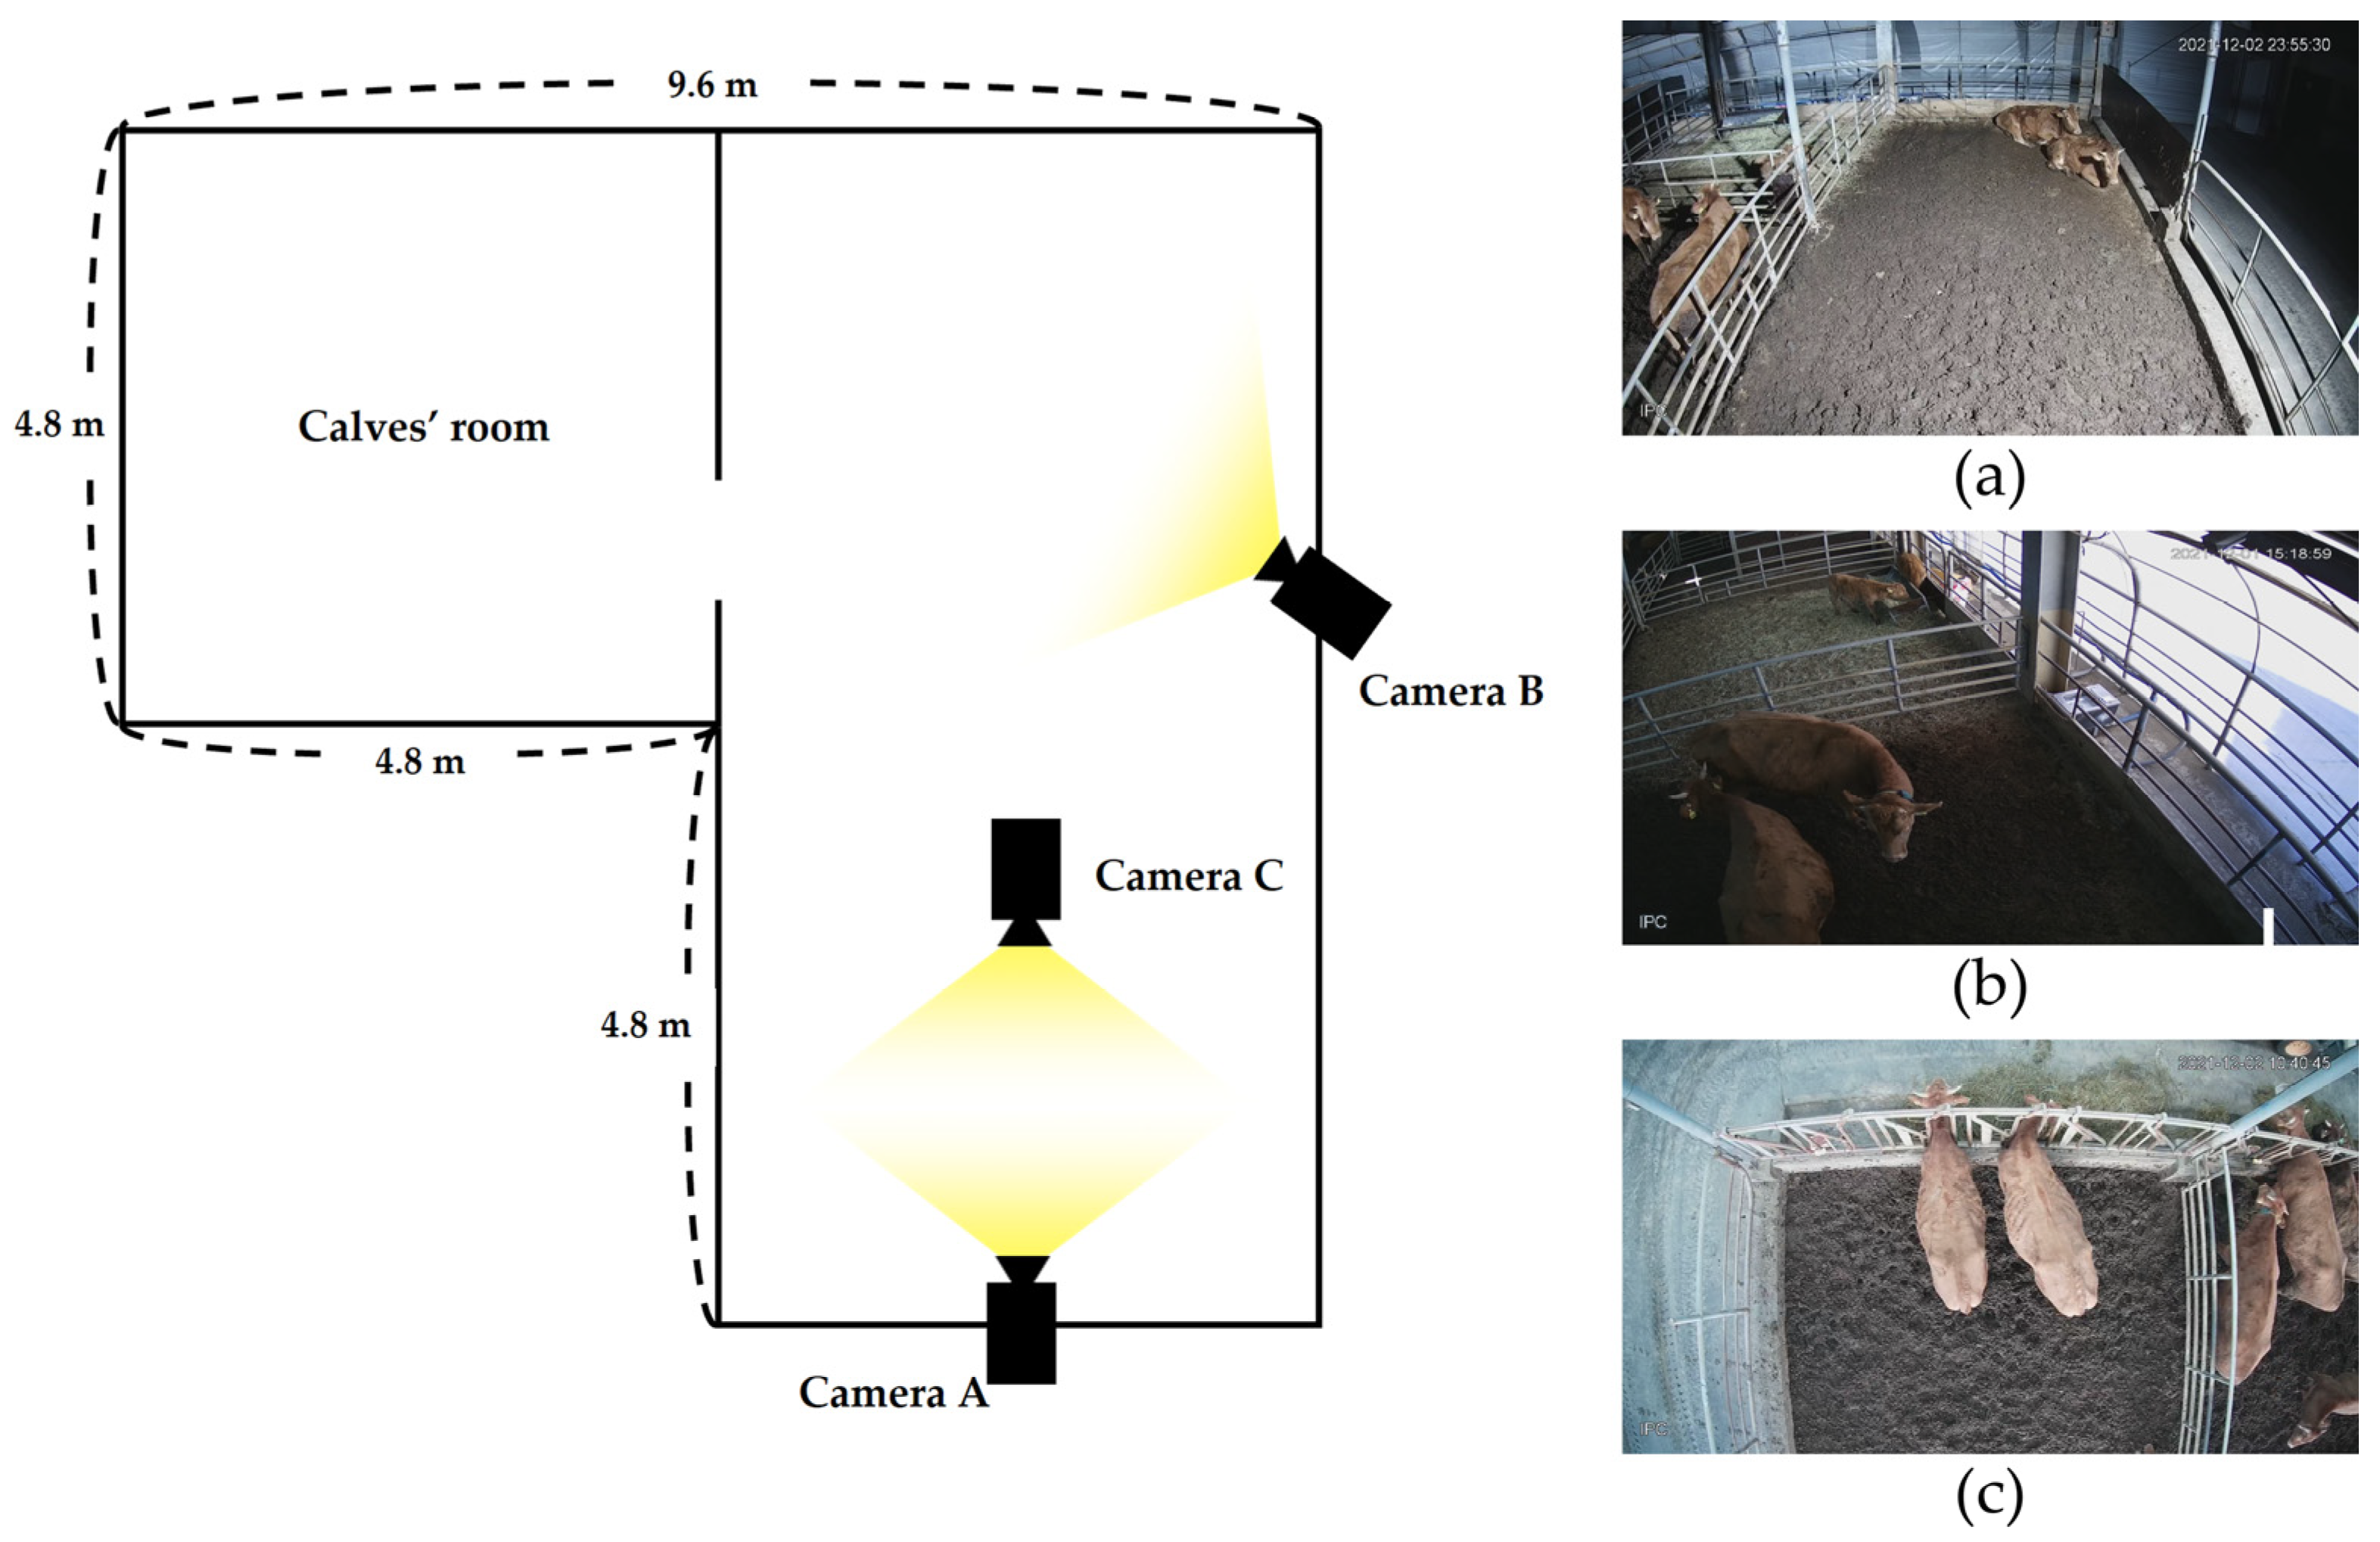
The data used for training and validating the proposed cattle behavior detection model were collected at the Gangwon State Livestock Research Institute, Hoengseong, Gangwon State, South Korea. The farm comprised two cows and two calves. Three cameras were installed to capture views from different angles and ensure diverse data collection. Employing data captured from various angles can enhance the generalizability of a model more than those captured from a single angle.
Camera A was installed above the feeding area at a 45° angle to capture the overall view of the pen, whereas Camera B was installed on the upper part of the side and primarily focused on the drinking area and calves’ room. Finally, Camera C was installed vertically above the feeding area to capture cattle feeding behaviors.
Figure 2 shows the overall structure of the pen and examples of the images captured by each camera.
This study employed network IP cameras (GB-CDX04, GASI) with a focal length in the range of 4.1–16.4 mm and featuring an automatic infrared (IR) function that enables image capture at night. The data captured with this camera were stored in the DAV video format at an HD (1280 × 720 pixels) resolution at 30 fps. The dataset included videos recorded over 264 h, in the period 1–11 December 2021, from different angles using these three cameras.
2.2. Image Extraction
In this study, 792 h of video was converted into images for input into the YOLOv7-E6E model. Image extraction was performed by analyzing the differences in histograms among frames rather than using fixed intervals. Extracting images at regular intervals may result in repetitive capture of the same image when the cow is stationary or makes minimal movements, and using such similar image data for deep learning model training can induce overfitting. Moreover, the cattle might exhibit unique behaviors between the intervals of the extracted frames, which will not be extracted. Therefore, this study employed an approach that extracts images using the histogram sum differences between frames.
Figure 3 shows examples of images extracted using the proposed approach.
The image extraction method used the following approach to determine frame differences: First, all frames were converted to grayscale, and the absolute gray-level sum of all pixels in each frame was calculated. Subsequently, the first frame was determined as the baseline frame, and the difference between its grayscale sum and that of the second frame was computed. If this difference was <30,000, the sum of the differences between the baseline frame and the third frame, which was the next frame, was calculated. This process continued until a frame whose grayscale value differed from that of the baseline frame by >30,000 was reached. Thereafter, it was extracted and set as the baseline frame, and the aforementioned process was repeated for all video frames.
Figure 4 shows the histograms of the first and second images selected from
Figure 3 and the differences between their histograms.
This study analyzed the differences in the gray-level sums to determine a threshold value wherein the difference in the gray-level sums of a frame showing a particular behavior and that showing a different behavior was 30,000. We set this as the threshold of the gray-level sum difference for image extraction.
This method enabled extracting more frames depicting active rather than minimal movement, such as during the rest period. Compared to extraction at constant frame intervals, this approach prevents the accumulation of multiple similar images and effectively extracts frames depicting unique behaviors. Using this method, 18,549 images were extracted at the same resolution as the videos (1280 × 720 pixels) and stored in the BMP format, which is a lossless and uncompressed image format.
2.3. Dataset Composition
To train the proposed object detection model, areas of the images showing specific behaviors were labeled with bounding boxes and the cattle behaviors were categorized into five classes: resting, communion, feeding, drinking, and eating. These five behavioral classes were further categorized into two groups: independent and interacting. Independent behavior included resting, drinking, and eating, which can be observed independently in cows and calves. Interacting behavior comprised communion and feeding behaviors, which involve interactions between cows and calves. Sample images depicting each behavior class are shown in
Figure 5. The behaviors for each class were classified as follows: Resting involved the cattle sitting with their bellies touching the ground. Communion involved the cow’s mouth touching the calf’s body, or vice versa. Feeding involved the calf placing its head on the cow’s teat and drinking milk. Drinking involved passing the entire head over the fence toward the water trough and drinking water. Finally, eating involved placing their heads in the feed trough.
Among the five behavior classes, this study focused on the communion class. Because cattle are social animals, the bond formation between cows and calves is crucial; cattle that lack adequate bonding experience stress. Interactions between cows and calves can strengthen this bond and potentially aid in calming calves [
18]. Therefore, bonding behavior is a vital indicator for analyzing cattle behavior.
After labeling, the data were divided into training, validation, and test sets in a ratio of 6:2:2. However, in a deep learning model, employing multiple images from a single video across different datasets can result in overfitting. Therefore, we ensured that the images extracted from a video were included in only one dataset to avoid duplicates among the training, validation, and test sets.
Table 1 presents the dataset configurations and
Table 2 lists the number of labels for each class.
2.4. Data Augmentation
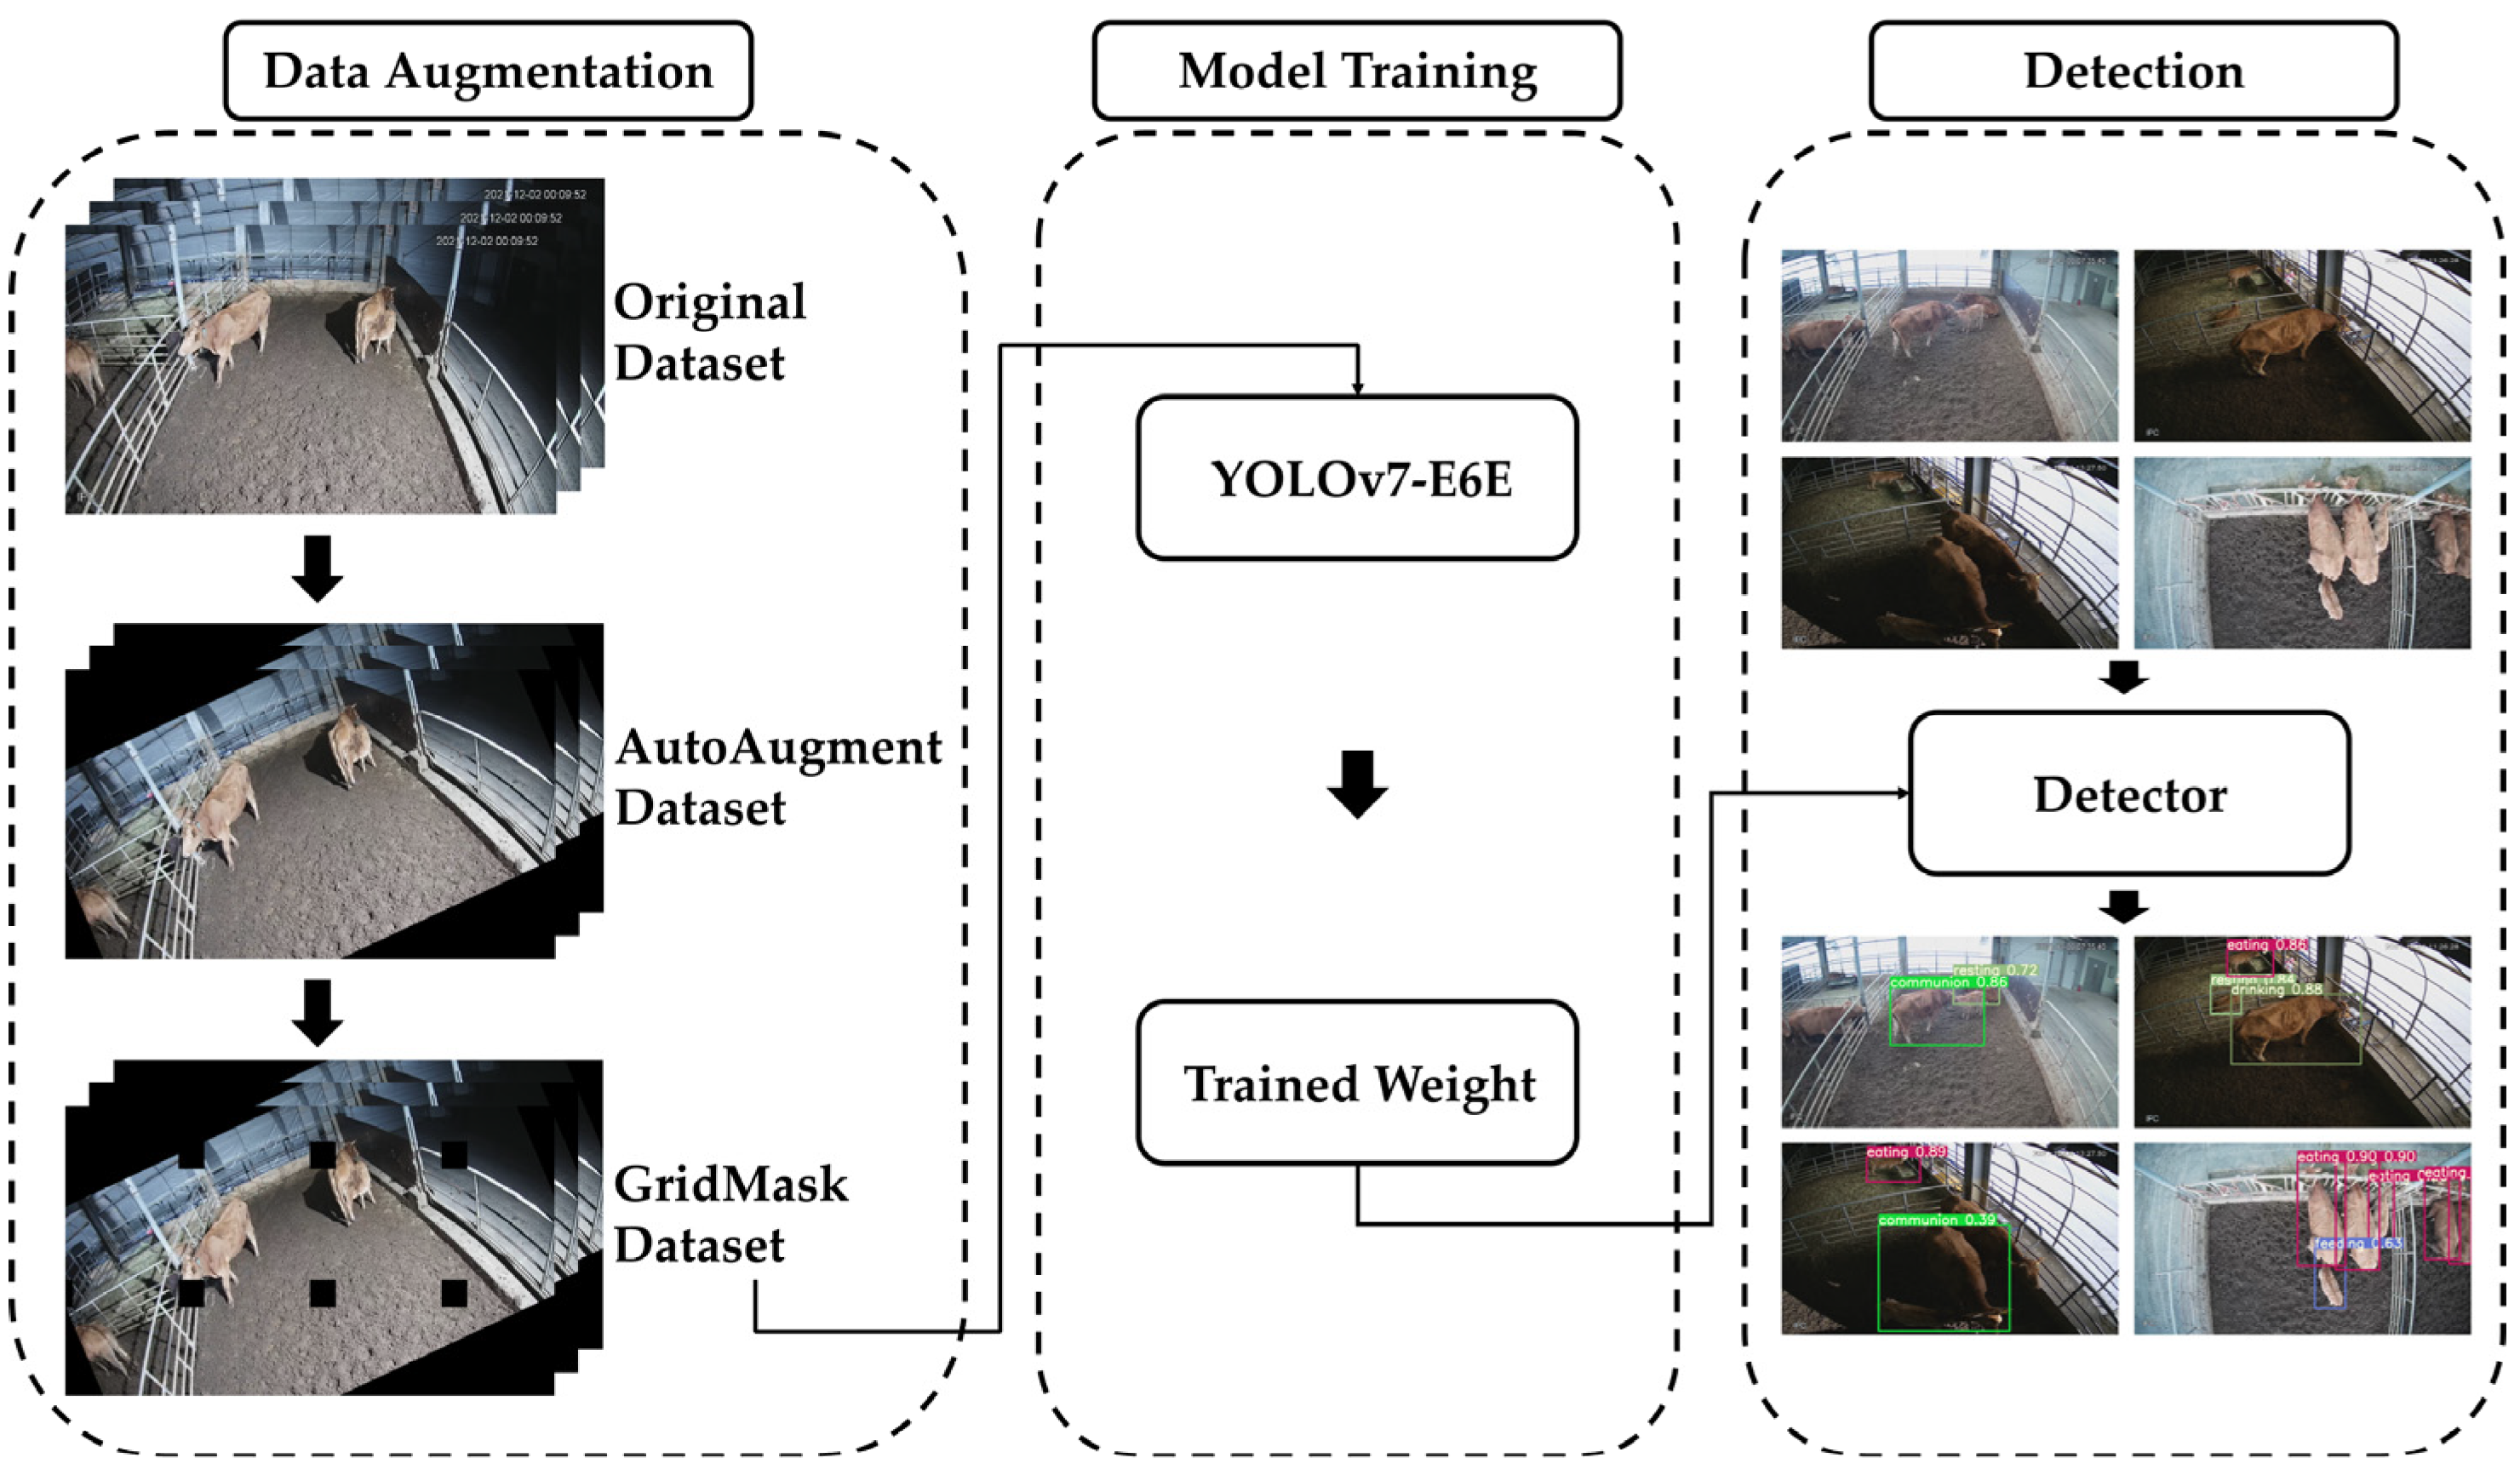
To ensure effective training of a deep learning model, high-quality data in large quantities are essential. However, the collection and labeling of such large datasets require significant time and labor. Therefore, this study used data augmentation techniques such as AutoAugment and GridMask.
AutoAugment employs a reinforcement learning algorithm trained on a specific dataset to determine the most effective augmentation policy [
19]. There exist 16 types of image augmentation methods: shearX (Y), translateX (Y), rotate, AutoContrast, invert, equalize, solarize, posterize, contrast, color, brightness, sharpness, cutout, and sample pairing. AutoAugment produces 25 pairs of techniques by combining two techniques from this list. The 25 pairs of generated techniques are applied with varying probabilities and intensity levels to introduce diverse modifications to the images, thereby enabling the model to become more robust to variations. This study compared the performances of the augmentation policies trained on the Cifar-10 and ImageNet datasets [
20,
21]. After data augmentation, the number of training images was increased by 25×, from 11,154 to 278,850.
Data augmentation methods such as cutout, hide-and-seek, and GridMask based on information removal encourage the object detection model to focus on learning from a variety of features of the object rather than relying solely on specific characteristics [
22,
23,
24]. This approach not only improves the model’s generalization performance but also enhances its robustness in diverse environments.
Among the data augmentation methods based on information removal, GridMask uniquely deletes rectangular areas uniformly and masks parts of the image to enhance the diversity of the training data. As a result, the model becomes more robust to various modifications and changes present within the dataset. Furthermore, integrating GridMask introduces randomness and unpredictability into the training phase, serving as a preventive measure against overfitting. It ensures the model remains effective when encountering previously unseen data.
In this study, GridMask was applied to 278,850 images that had been augmented using AutoAugment. GridMask was implemented with a 50% probability, ensuring that the augmentation process introduced a balanced mixture of obscured and unobscured images. The combination of these two augmentation techniques increases the diversity of the dataset and, consequently, the robustness and generalization performance of the object detection model.
2.5. Object Detection Using YOLOv7-E6E
In this study, we used the YOLOv7-E6E model for real-time recognition and classification of cattle behavior [
25]. The YOLOv7-E6E model is an advanced iteration of the basic YOLOv7 network, designed to enhance real-time object detection performance and reduce inference costs. It employs several techniques, which are described as follows: First, the model adopts the extended efficient layer aggregation network (E-ELAN), which addresses the limitations of ELAN [
26]. E-ELAN efficiently controls the gradient paths through the expansion, shuffle, and merge cardinalities. This enhances the training capability of the model even if many computation blocks are stacked.
Next, an auxiliary head generates fine and coarse labels based on the predictions of the lead head. The fine and coarse labels are used to train the lead and auxiliary heads, respectively. Through this bifurcated training approach, the model can achieve a balanced understanding of both detailed and comprehensive features, leading to performance improvements.
Additionally, training the Aux head for coarse labels enhances the model’s
recall performance. It is particularly useful in behavior analysis, where detecting subtle and diverse patterns of behavioral changes is crucial. Moreover, the YOLOv7-E6E model demonstrates better speed and accuracy compared to other methods. Therefore, this study deemed it suitable for real-time detection of cow behaviors.
Figure 6 illustrates the structure of the proposed YOLOv7-E6E model, and
Figure 7 shows the flowchart of cow behavior detection using the YOLOv7-E6E model.
This study employed a system comprising an Intel i9-10920X CPU @3.50 GHz and NVIDIA GeForce RTX 3090 GPU. The programming environment comprised Windows 10, Python 3.9.12, CUDA 11.8, PyTorch 1.11.0, and Torchvision 0.12.0.
2.6. Evaluation Metrics
This study used the
precision,
recall, and
mAP evaluation metrics to evaluate the proposed deep learning model.
Precision is the ratio of correctly detected objects to the total number of objects identified by a model.
Recall is the ratio of correctly detected objects by the model among the actual objects. Therefore, a high
precision value indicates that the model accurately identifies areas containing objects with minimal false detections, whereas a high
recall value indicates that the model rarely fails to detect the actual behavior of objects.
mAP, which is commonly used as a performance evaluation metric for object detection models, is the mean of the average
precision (AP) for each class based on an intersection over a union threshold of 0.5.
AP refers to the area under the
precision–recall (P–R) curve, which illustrates the change in
precision values under varying
recall levels.
True positive (TP) refers to instances wherein the model correctly identifies an object in an image, whereas false positive (FP) indicates the incorrect identification of an object that is absent. Finally, false negative (FN) indicates that the model fails to detect an object.
3. Results and Discussion
3.1. Original Dataset Results
First, to compare and evaluate the methods used in this study, we analyzed the performance of the model trained on the original dataset; the results are listed in
Table 3.
The results for the original image dataset showed that the performance for the communion and feeding classes was relatively lower than that for other classes. This performance degradation is attributed to the characteristics of these classes, as unlike the other classes, these classes involve interactions between cows and calves. The significantly low recall rate indicates that the model found it challenging to accurately detect the communion class, which was crucial for this study.
3.2. AutoAugment Dataset Results
As mentioned previously, communion is an important class for bond formation between cows and calves, which is essential for stress reduction among calves. Therefore, AutoAugment with the Cifar-10 and ImageNet policies was applied to the original image dataset to address the relatively low detection performance of the model for this class, and its performance was re-evaluated; the results are listed in
Table 4.
The results show that the application of the Cifar-10 and ImageNet policies improved the precision for each class by 0.3 and 1.0%, respectively, recall by 6.4 and 4.5%, respectively, and mAP by 2.3 and 2.9%, respectively. These results indicate that the size of the original image dataset was insufficient to effectively train the model on the object features. Thus, training on the image data generated using these augmentation policies enhanced the detection performance of the model.
Additionally, the ImageNet policy improved the performance more than the Cifar-10 policy. This is because the ImageNet policy is tuned for 1000 classes, which is more than that of Cifar-10, and enabled training the object detection model on a more diverse and robust training set.
3.3. GridMask Data Augmentation Results
The results in
Section 3.2 indicate that the ImageNet policy enhances performance more than the Cifar-10 policy. Therefore, GridMask was applied to the images augmented using the ImageNet policy with a 50% probability. The detection performances for training the model on data augmented using AutoAugment and GridMask are presented in
Table 5.
Compared with the original dataset, the precision decreased by 0.5%, recall increased by 9.2%, and mAP improved by 4.8%, indicating that GridMask enhanced the generalization performance of the detection model. Additionally, the model could recognize object features using only partial information regarding the object. Consequently, its object detection capability in various environments was improved. The integration of GridMask and AutoAugment enhanced the training dataset diversity, resulting in notable improvements in the model performance. However, owing to a 6.4% decrease in the precision score for the eating class, the precision for all classes dropped by 0.5%. The eating class labeled behaviors such as cows putting their heads through the feeding fence or placing a calf’s head inside the feed container. Therefore, the labels exhibited two distinct positions and shapes. By applying AutoAugment and GridMask, parts of the feed container and fence were obscured in the image transformations, preventing adequate model training on these behaviors. Therefore, cattle that did not exhibit any specific behavior were incorrectly detected as eating, which decreased the precision for the eating class.
Recall and
mAP are important metrics for livestock farming. Zheng et al. [
27] noted that high
recall and
mAP scores help effectively detect cattle. Additionally, a high
recall score for livestock behavior detection minimizes the non-detection rate of behaviors related to diseases or estrus. Thus, it is directly related to livestock health and ultimately affects the productivity of agricultural farms and is a crucial evaluation metric. The proposed detection model showed a 9.2% improvement in
recall when it was trained on data augmented using AutoAugment and GridMask compared to the original dataset. This improvement is expected to provide valuable information, potentially leading to a substantial increase in labor efficiency and reduced labor costs for farmers.
Figure 8 presents the detection results of the model with both AutoAugment and GridMask applied. Upon reviewing the detection outcomes of the model integrating these two augmentation techniques, it becomes evident that the synergy between AutoAugment and GridMask significantly enhances the model’s capability to detect and classify cattle behaviors accurately. The combined use of these techniques minimizes false detections and strengthens the recognition of diverse behaviors across various environmental conditions, resulting in clear and well-defined object detections. It not only demonstrates the efficiency of the combined augmentation strategies but also highlights the potential of our proposed model to reliably capture subtle cattle behaviors, offering a promising tool for applications in precision livestock farming.
Pavlovic et al. [
8] utilized tail-mounted accelerometers to classify cattle behavior, achieving a
sensitivity (recall) and
precision of over 86.7%. Williams et al. [
9] classified cattle behavior using accelerometer necklaces, achieving an average F1 score of 0.82. However, our study significantly differs from these approaches as we only used 2D RGB camera data and did not attach invasive sensors to the cattle. This approach not only simplifies the data collection process but also potentially reduces stress on the cattle. This study achieved a 93%
mAP, demonstrating the efficiency of using 2D RGB camera-based observations for high-accuracy cattle behavior detection.
This study proposed a cattle behavior detection model based on YOLOv7-E6E. Cattle behavior data were collected using 2D RGB cameras, and the model performance was enhanced by training it on the original data augmented through AutoAugment. Additionally, training on data augmented through GridMask decreased precision by 0.5% compared to the original dataset but increased the recall and mAP by 9.2% and 4.8%, respectively.
4. Conclusions
The livestock sector faces challenges due to a decreased labor force, increasing workloads, and heightened stress for farmers [
28]. In response, this study proposes a cattle behavior detection model utilizing 2D RGB cameras to automate and simplify monitoring processes within livestock farms. In this study, we enhanced model performance by 9.2% for
recall and 4.8% for
mAP using AutoAugment and GridMask compared to the original datasets. This automation can reduce the workload on farmers by providing real-time insights into cattle behavior and contributing to the early detection of health issues. It has the potential to significantly cut veterinary costs and reduce losses from livestock health problems. When estrus detection in cattle is considered, they exhibit increased activity, decreased resting, and reduced feed intake, which facilitates estrus detection through behavioral analysis [
29]. Employing PLF technology can yield up to EUR 2729 in annual economic benefits per farm over non-PLF methods [
30]. Thus, this research could contribute to sustainable livestock farming and profitability through reduced labor costs and increased livestock production.
This study has a limitation in that the
precision slightly decreased in the model trained on data augmented using AutoAugment and GridMask compared to that trained on the original data. Therefore, future studies should use images enhanced with AutoAugment and GridMask after filtering. Additionally, labels for objects whose features have disappeared or are heavily modified because of augmentation policies can be problematic. Removing these labels using a model trained only on the original data might resolve the performance decline. In addition, this study used data collected from a single farm with the same recording equipment, which could have resulted in model bias toward this specific farm, and its performance might not be adequately validated using data from other farms. To address these issues, we are installing different cameras, not limited to those used in this study, in various barns to collect data. In reviewing various studies on cattle behavior detection, Fuentes et al. [
31] employed the YOLOv3 model to detect 15 classes of cow behavior in 1920 × 1080 resolution images, achieving a
mAP of 78.8%. Similarly, Uchino and Ohwada [
32] achieved a
mAP of 91.5% utilizing the YOLOv5-L model for four classes at a resolution of 3840 × 2160. Our study has shown similar or higher performance despite utilizing lower resolutions. Thus, future experiments incorporating diverse angles, barn environments, and resolutions could mitigate model bias and enhance the model’s generalization performance.
In this study, our methodology utilized the sum of gray levels from the entire image. Recognizing the potential for further refinement, we consider exploring a more targeted approach for future research. Specifically, we aim to investigate the application of summing gray levels within designated regions of interest. This is particularly beneficial in scenarios where vital information is compromised by background noise or other distractive elements. Focusing on regions could alleviate such challenges, facilitating a more accurate feature extraction of the target object. This strategy holds promise in domains where the significance of certain image areas is paramount. For example, in precision livestock farming (PLF), zeroing in on segments of aerial images that capture active livestock could enhance model detection accuracy. As we progress, our goal is to refine this approach for image analysis and streamline its application, making it versatile enough for broader use across various fields. This evolution will involve developing and meticulously tuning the method to automate the process for enhanced efficiency and applicability.


