
Study on the Influence of Moisture Content and Void Ratio on the Disintegration of Red Clay

1
College of Civil Engineering and Architecture, Guilin University of Technology, Guilin 541004, China
2
Department of Construction Engineering, Guizhou Light Industry Technical College, Guiyang 550000, China
*
Author to whom correspondence should be addressed.
Appl. Sci. 2024, 14(9), 3652; https://0-doi-org.brum.beds.ac.uk/10.3390/app14093652
Submission received: 3 March 2024
/
Revised: 9 April 2024
/
Accepted: 10 April 2024
/
Published: 25 April 2024
(This article belongs to the Section Earth Sciences)
Abstract
:Guilin is a famous karst area, and currently the view that the disintegration of red clay will cause soil cave collapse is increasingly recognized. In order to study the influence of the coupling effect of moisture content and void ratio on the disintegration of red clay, different moisture contents and void ratios of Guilin red clay were placed on a self-made disintegration apparatus to record the real-time disintegration amount and observe the disintegration phenomenon. Images of the structural characteristics of soil were obtained by a scanning electron microscope (SEM). Additionally, nuclear magnetic resonance (NMR) was applied to analyze the distribution of water in both natural and saturated states. The results show that the disintegration rate of red clay decreases as the initial moisture content increases, but increases with the increase of void ratio. Both moisture content and void ratio affect the structural characteristics of red clay. When the moisture content remains constant, the soil changes from a three-peak to a two-peak structure as the void ratio increases. The total area and secondary peak area of the T2 spectrum increase, while the starting T2 value of the main peak shifts to the right and the area decreases. Meanwhile, the starting T2 value of the secondary peak shifts to the right and the area increases. When the void ratio remains constant, the starting T2 value of the main peak gradually shifts to the left and the area decreases as the moisture content increases. However, the starting T2 value of the secondary peak shifts to the right and the area decreases or first decreases and then increases. The disintegration rate does not exhibit a significant relationship with either pore volume or macropore volume. The combined water saturation shows a bilinear relationship with both the moisture content and void ratio, where it increases as the initial moisture content increases, but decreases as the void ratio increases, with a correlation coefficient of 0.9929. The disintegration rate has an exponential relationship with the combined water saturation, and it decreases as the combined water saturation increases, with a correlation coefficient of 0.9934.
1. Introduction
Red clay exhibits certain adsorption, ion exchange, and chemical activity due to the presence of a large amount of clay minerals during the weathering process. In addition, red clay has a special pore structure, which makes it prone to disintegrating when exposed to water, leading to various engineering geological disasters such as the collapse of soil caves [1,2], landslides [3,4,5], soil erosion [6], and tunnel collapse [7]. Guilin City is a world-famous karst and soil collapse area, with a large amount of red clay distributed. The view that the disintegration of red clay is an important factor causing soil collapse is increasingly recognized [8,9,10,11]. The disintegration of red clay is an important mechanism for the collapse of soil caves. However, the existing literature mainly focuses on the study of disintegration in residual soil, expansive soil, loess, etc., and there are few research results on the disintegration of red clay. The research reported so far is not deep enough. Therefore, this paper aims to investigate the disintegration characteristics of Guilin red clay under the coupled conditions of moisture content and void ratio.
Soil structure is an important characteristic of soil, which determines the physical, mechanical, and other properties of the soil [12]. Tan et al. [13], Zhang et al. [14], and Gao et al. [15] have found that soil structure has a significant impact on the disintegration characteristics of red clay, granite residual soil, and loess, neglecting the influence of moisture content on the disintegration of red clay. Gamble [16] and Yamaguchi et al. [17] considered that the variation in rock moisture content is a controlling factor for disintegration, without considering the influence of the structure of the rock and soil on the disintegration. Ruiz-Vera et al. [18] considered that the soil disintegration rate is closely related to the initial moisture content. Liu et al. [19] and Chen et al. [20] investigated the impact of varying moisture levels on the disintegration of Guilin red clay and granite residual soil. However, they did not adequately consider the pore structure of the soil–rock mass. He et al. [21], Li et al. [22], Xia et al. [23], and Tong et al. [24] have conducted experimental studies on the disintegration characteristics of granite, red clay, purple soil, and sandstone particle soil under different initial moisture contents and compactions. However, when explaining the disintegration mechanism, they discussed the two indicators separately, neglecting the influence of moisture content on soil structure. Li et al. [25] considered that compaction and moisture content are the fundamental causes of soil disintegration, and established the relationship between compaction, moisture content, and disintegration rate using effective porosity; however, only using compaction to describe the quality of soil structure cannot establish the influence of soil microstructure on the disintegration of red clay. ThyagarajT et al. [26] and N. Mokni et al. [27] considered that pore pressure and matric suction in the soil are the main controlling factors of unsaturated soil collapse. Lv et al. [28] used CT to test the crack changes during the mudstone disintegration process and found that tiny cracks in the mudstone are important flow paths for external water to enter the rock mass, but they ignored the transformative effect of mudstone swelling on the rock mass structure. Yang et al. [29] used scanning electron microscopy (SEM), nuclear magnetic resonance (NMR), and CT to observe the microstructure changes during the rock disintegration process and explore the relationship between pore structure and mudstone disintegration.
With the development of nuclear magnetic resonance (NMR) detection technology, the determination of soil moisture distribution and microstructure has also become increasingly mature. For example, Liu et al. [30] found that the pore distribution in the soft soil of Nansha is multi-porous, with small pore size and a bimodal distribution, with the pore size mainly concentrated between 0.1 and 20 μm. Jian et al. [31], through nuclear magnetic resonance experiments, found that the T2 distribution curve of expansive soil and kaolin clay moves to the right with the increase of moisture content, and the variation of the minimum relaxation time is not obvious, while the maximum relaxation time increases with the increase of moisture content. Wang et al. [32] used nuclear magnetic resonance technology to measure the microstructure of cohesive soil under different moisture content and compaction conditions, and found that cohesive soil with lower dry density contains more large pores, and the initial moisture content has a certain influence on the number of small pores. Wei et al. [33] found that the initial moisture content and dry density have important influences on the pore size and distribution of compacted clay, and the pore diameter increases first and then decreases with the increase of the initial moisture content, while the dry density inhibited the effect of initial moisture content on pore structure. An et al. [34] found that the micro-pores of residual granite soil slightly decrease with the number of dry–wet cycles, and the effective shear strength has a negative linear relationship with the pore volume content. Yu et al. [35,36] used nuclear magnetic resonance technology to explore the variation law of pore structure of expansive soil in salt solution. The scholars mainly focused on researching the distribution law of soil moisture (or the pore structure of saturated soil) using nuclear magnetic resonance technology. However, they did not conduct in-depth research on quantitative indicators such as the disintegration rate and pore structure characteristics obtained by applying NMR.
In terms of the mechanism of disintegration, the currently mainstream idea is that when the moisture content of red clay is relatively low [37,38,39,40], its disintegration mechanism is mainly due to the rapid entry of water molecules into the soil under the influence of matric suction. This leads to compression of gas in the closed pores, an increase in tensile stress in the closed cavity, rapid disintegration of the soil sample, and a large amount of gas escape. Additionally, the looser the soil structure due to a larger pore ratio, the weaker the interparticle bonding force, and the easier the disintegration of red clay. When the red clay contains more water [41,42,43,44], the matric suction is smaller, and pure water enters the soil slowly, the ion concentration in the diffusion layer first decreases, and the thickness of the diffusion layer increases the ‘wedge splitting’ effect of water molecules, leading to the ultimate disintegration of red clay. The higher the moisture content of the red clay, the larger the void ratio, the looser the contact between soil particles, the more large pores, and the faster the disintegration rate.
This article conducts a disintegration test on Guilin red clay to study the influence of moisture content and void ratio on the disintegration of red clay. The disintegration characteristics of red clay with different moisture contents and void ratios were observed using a self-made disintegration apparatus. A scanning electron microscope (SEM) was employed to obtain images of structure characteristics, and nuclear magnetic resonance (NMR) was used to obtain the distribution characteristics of water under natural and saturated states. The ‘right half point’ method was applied to determine the content of combined water under natural and saturated states of red clay. The relationship between the disintegration rate and the combined water saturation was comprehensively analyzed to provide a scientific basis for the evaluation and prevention of soil cave geological hazards by quickly estimating the disintegration rate of red clay.
2. Red Clay Disintegration Test
2.1. Sample Preparation and Experimental Setup
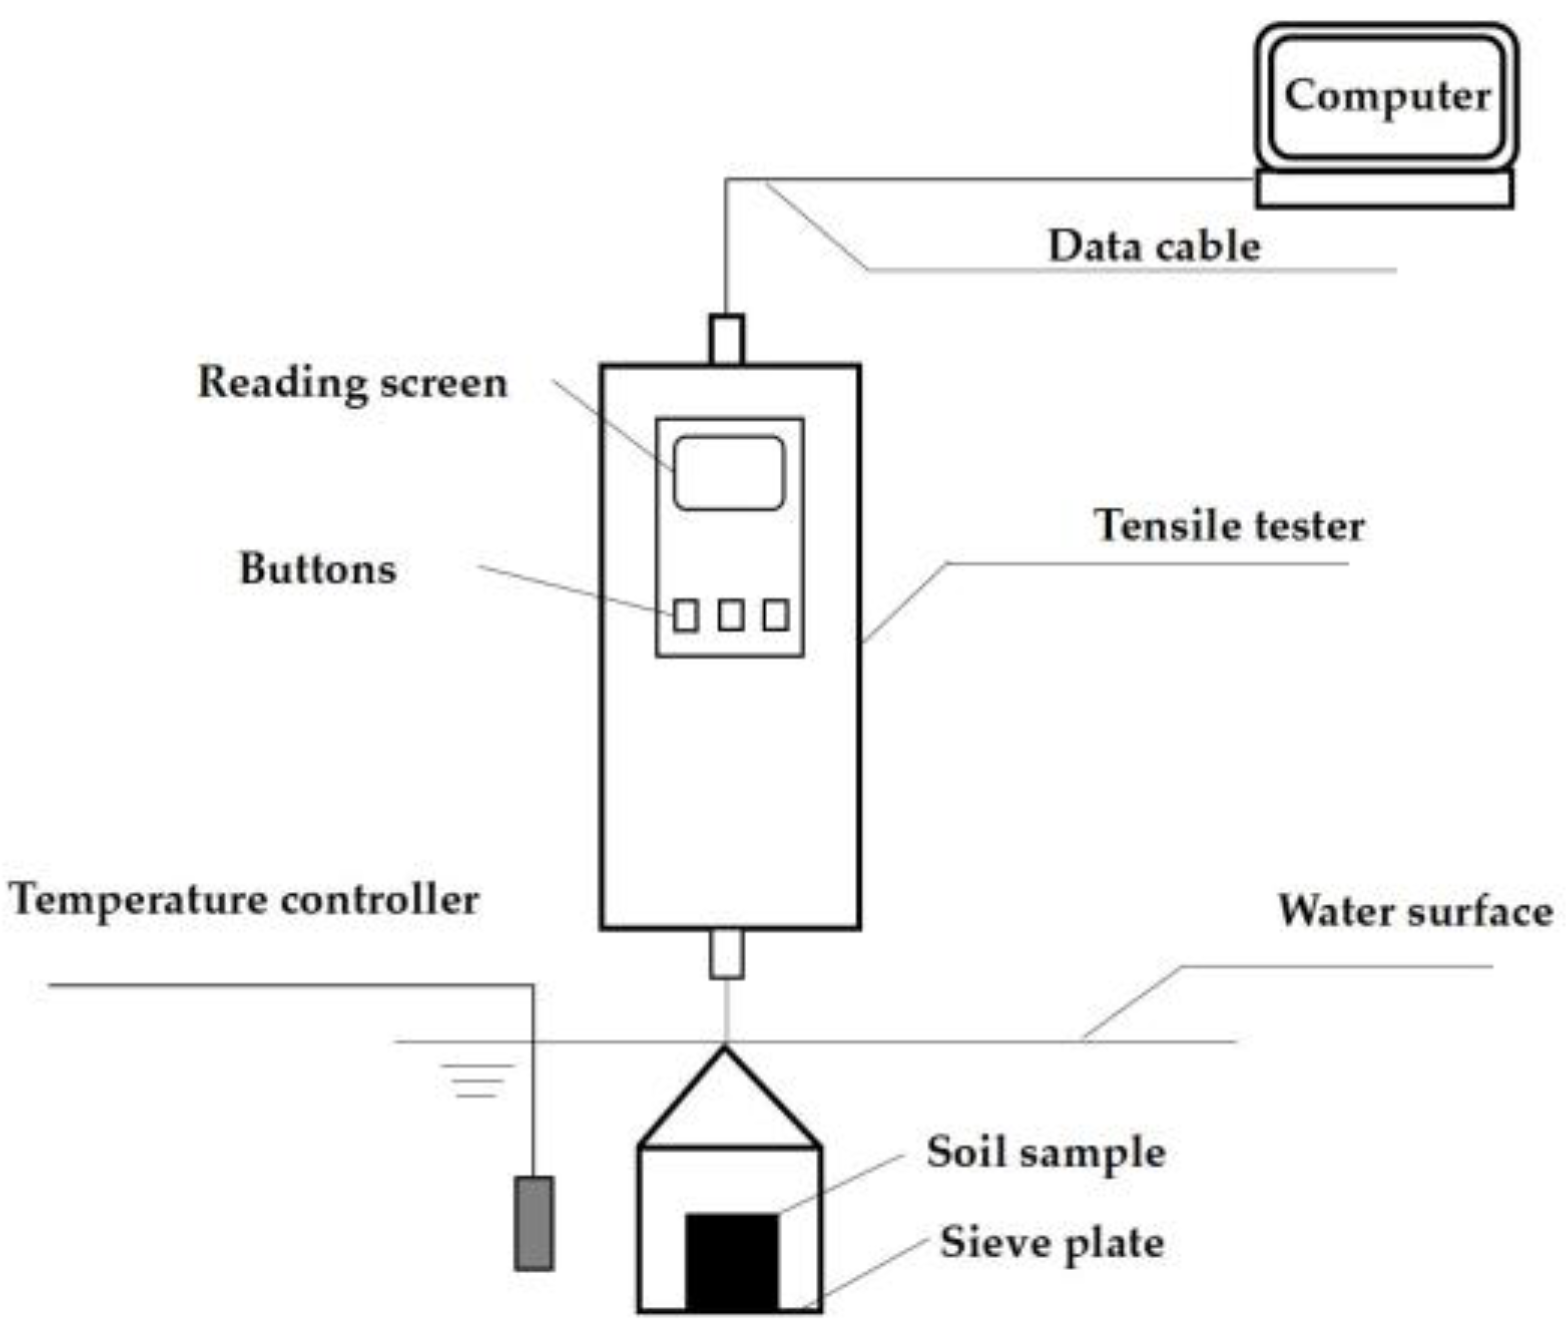
Red clay from the foundation pit of Guilin University of Technology’s new teaching building (Yanshan Campus) was collected, air-dried, purified, dried, and crushed. It was sieved through a 0.2 mm standard sieve and stored for later use. According to the collected geotechnical investigation reports, the natural moisture content of red clay in the Guilin area ranges from 24% to 31%. Therefore, four different initial moisture contents were set at 24%, 26%, 28%, and 30%, respectively. To conduct the experiment, an appropriate amount of purified water was added to the dry red clay to achieve the desired moisture content. These soils were prepared with three different void ratios of 1.0, 1.1, and 1.15, and four different moisture contents. A total of 12 groups of red clay samples were prepared for the disintegration test. The soil samples were cylindrical in shape, with a diameter of 60 mm, a height of 106 mm, and a volume of 300.0 cm3. The disintegration test apparatus was self-made and is shown in Figure 1. The sieve plate used to hold the soil sample was an 80 mm × 80 mm corrosion-resistant metal grid with a mesh size of 10 mm × 10 mm. A tensile tester was connected to a computer to record the residual mass of the soil sample after disintegration every second. To maintain a constant experimental temperature, a temperature controller was connected. The purified water used in the experiments was prepared by the YAZD-5 type electrothermal purified water sterilizer in the on-campus laboratory. The quality of purified water meets the third-level water standard specified by the People’s Republic of China. The conductivity of purified water is ≤0.50 mS/m, the content of oxidizable substances is ≤0.4 mg/L, and the residue after evaporation is ≤2.0 mg/L.
Once the preparation work was ready, the temperature controller probe was inserted into the middle of the water tank to test the temperature of the disintegration solution first. If the temperature of the disintegration solution was below 20 °C, the temperature compensation device would be automatically started. If the temperature of the disintegration solution was too high, the dissolution solution would be naturally cooled to the set value, and the temperature deviation controlled within ±0.5 °C. The tensile tester was zeroed after being started, and the soil sample was placed on the sieve plate. The change in soil sample mass was recorded every second with an accuracy of 1 g, while the phenomenon of disintegration was observed.
The disintegration rate and disintegration resistance index were calculated according to Formulas (1) and (2) respectively.
- υ represents the disintegration rate (g/s) of the soil sample between ti and ti+1;
- , represent the mass (g) of the soil sample at time ti and ti+1, respectively;
- ti, ti+1 represent the time (s) during the experiment;
- SI represents the disintegration resistance index (%);
- A0, represent the mass of the soil sample at the beginning and end of the disintegration process, respectively (g).
2.2. Disintegration Test Analysis
According to Table 1 and Figure 2, the disintegration test of red clay in pure water showed the following results:
When e = 1.0, except for the 24% red clay sample which undergoes disintegration, samples only absorb water and do not disintegrate. For the sample with ω = 24% and e = 1.0, a small amount of bubbles escape during disintegration, and the surface of the soil sample peels off in scales and fragments. The disintegration rate is 0.739 g/s. When ω ≥ 26%, no disintegration occurs even after 30 min.
When e = 1.1, the red clay with ω = 24% rapidly disintegrates into flakes and powder, with the disintegration liquid becoming turbid. The disintegration rate significantly increases to 1.769 g/s. The samples with ω = 26%, 28%, and 30% first experience weight gain and then undergo slow disintegration, with the soil forming blocks, debris, and flake-like peeling. The disintegration rates in the stable stage are 0.035 g/s, 0.029 g/s, and 0.002 g/s, respectively.
When e = 1.15, all groups of samples undergo disintegration. The red clay with ω = 24% shows intense disintegration in the form of flakes and powder, with a large amount of bubbles overflowing. The maximum disintegration rate reaches 2.813 g/s. The remaining groups of samples undergo relatively gentle disintegration, with the soil forming block-like and debris-like slow disintegration. The disintegration rates are 0.974 g/s, 0.036 g/s, and 0.055 g/s, respectively. The overall disintegration rate decreases as the initial moisture content increases.
Based on the analysis above, it can be concluded that the rate of disintegration in red clay is not only affected by the initial moisture content, but also significantly influenced by the soil’s void ratio. When the void ratio remains constant, the disintegration rate decreases as the moisture content of the red clay increases, resulting in a more gradual disintegration phenomenon. Conversely, when the moisture content is constant, the disintegration rate of red clay increases with an increase in void ratio, leading to a more intense disintegration phenomenon.
3. Microstructure Analysis of Red Clay
3.1. Electron Scanning Microscope Test
The scanning electron microscope (SEM) is a powerful tool for soil researchers as it provides a wide depth of field and strong stereoscopic effect, allowing for intuitive reflection of contact form and grain size of soil particles on the section. This facilitates the determination of microstructure morphology and microstructure parameters of soil [45,46]. However, SEM is not suitable for quantitatively describing the size and distribution of micro-pores inside the soil, nor can it study the moisture content in the pores. Additionally, the sampling and drying processes can easily disturb the sample. In this experiment, red clay was prepared into soil material according to the designed moisture content and compacted for 24 h. Different void ratio reshaped samples were then made using the compaction method. The reshaped samples were slowly cut into small pieces of 10 mm × 10 mm × 10 mm with a cutting knife and placed in a liquid nitrogen freezer for 30 min. After that, the samples were gently taken out with tweezers and vacuumed for 24 h to dry them. To reduce sample discharge, a layer of conductive material (gold) was uniformly plated on the surface of the soil samples. The samples were then placed in the scanning chamber of an S-3000N scanning electron microscope (SEM) for surface observation at a magnification of 10,000 times.
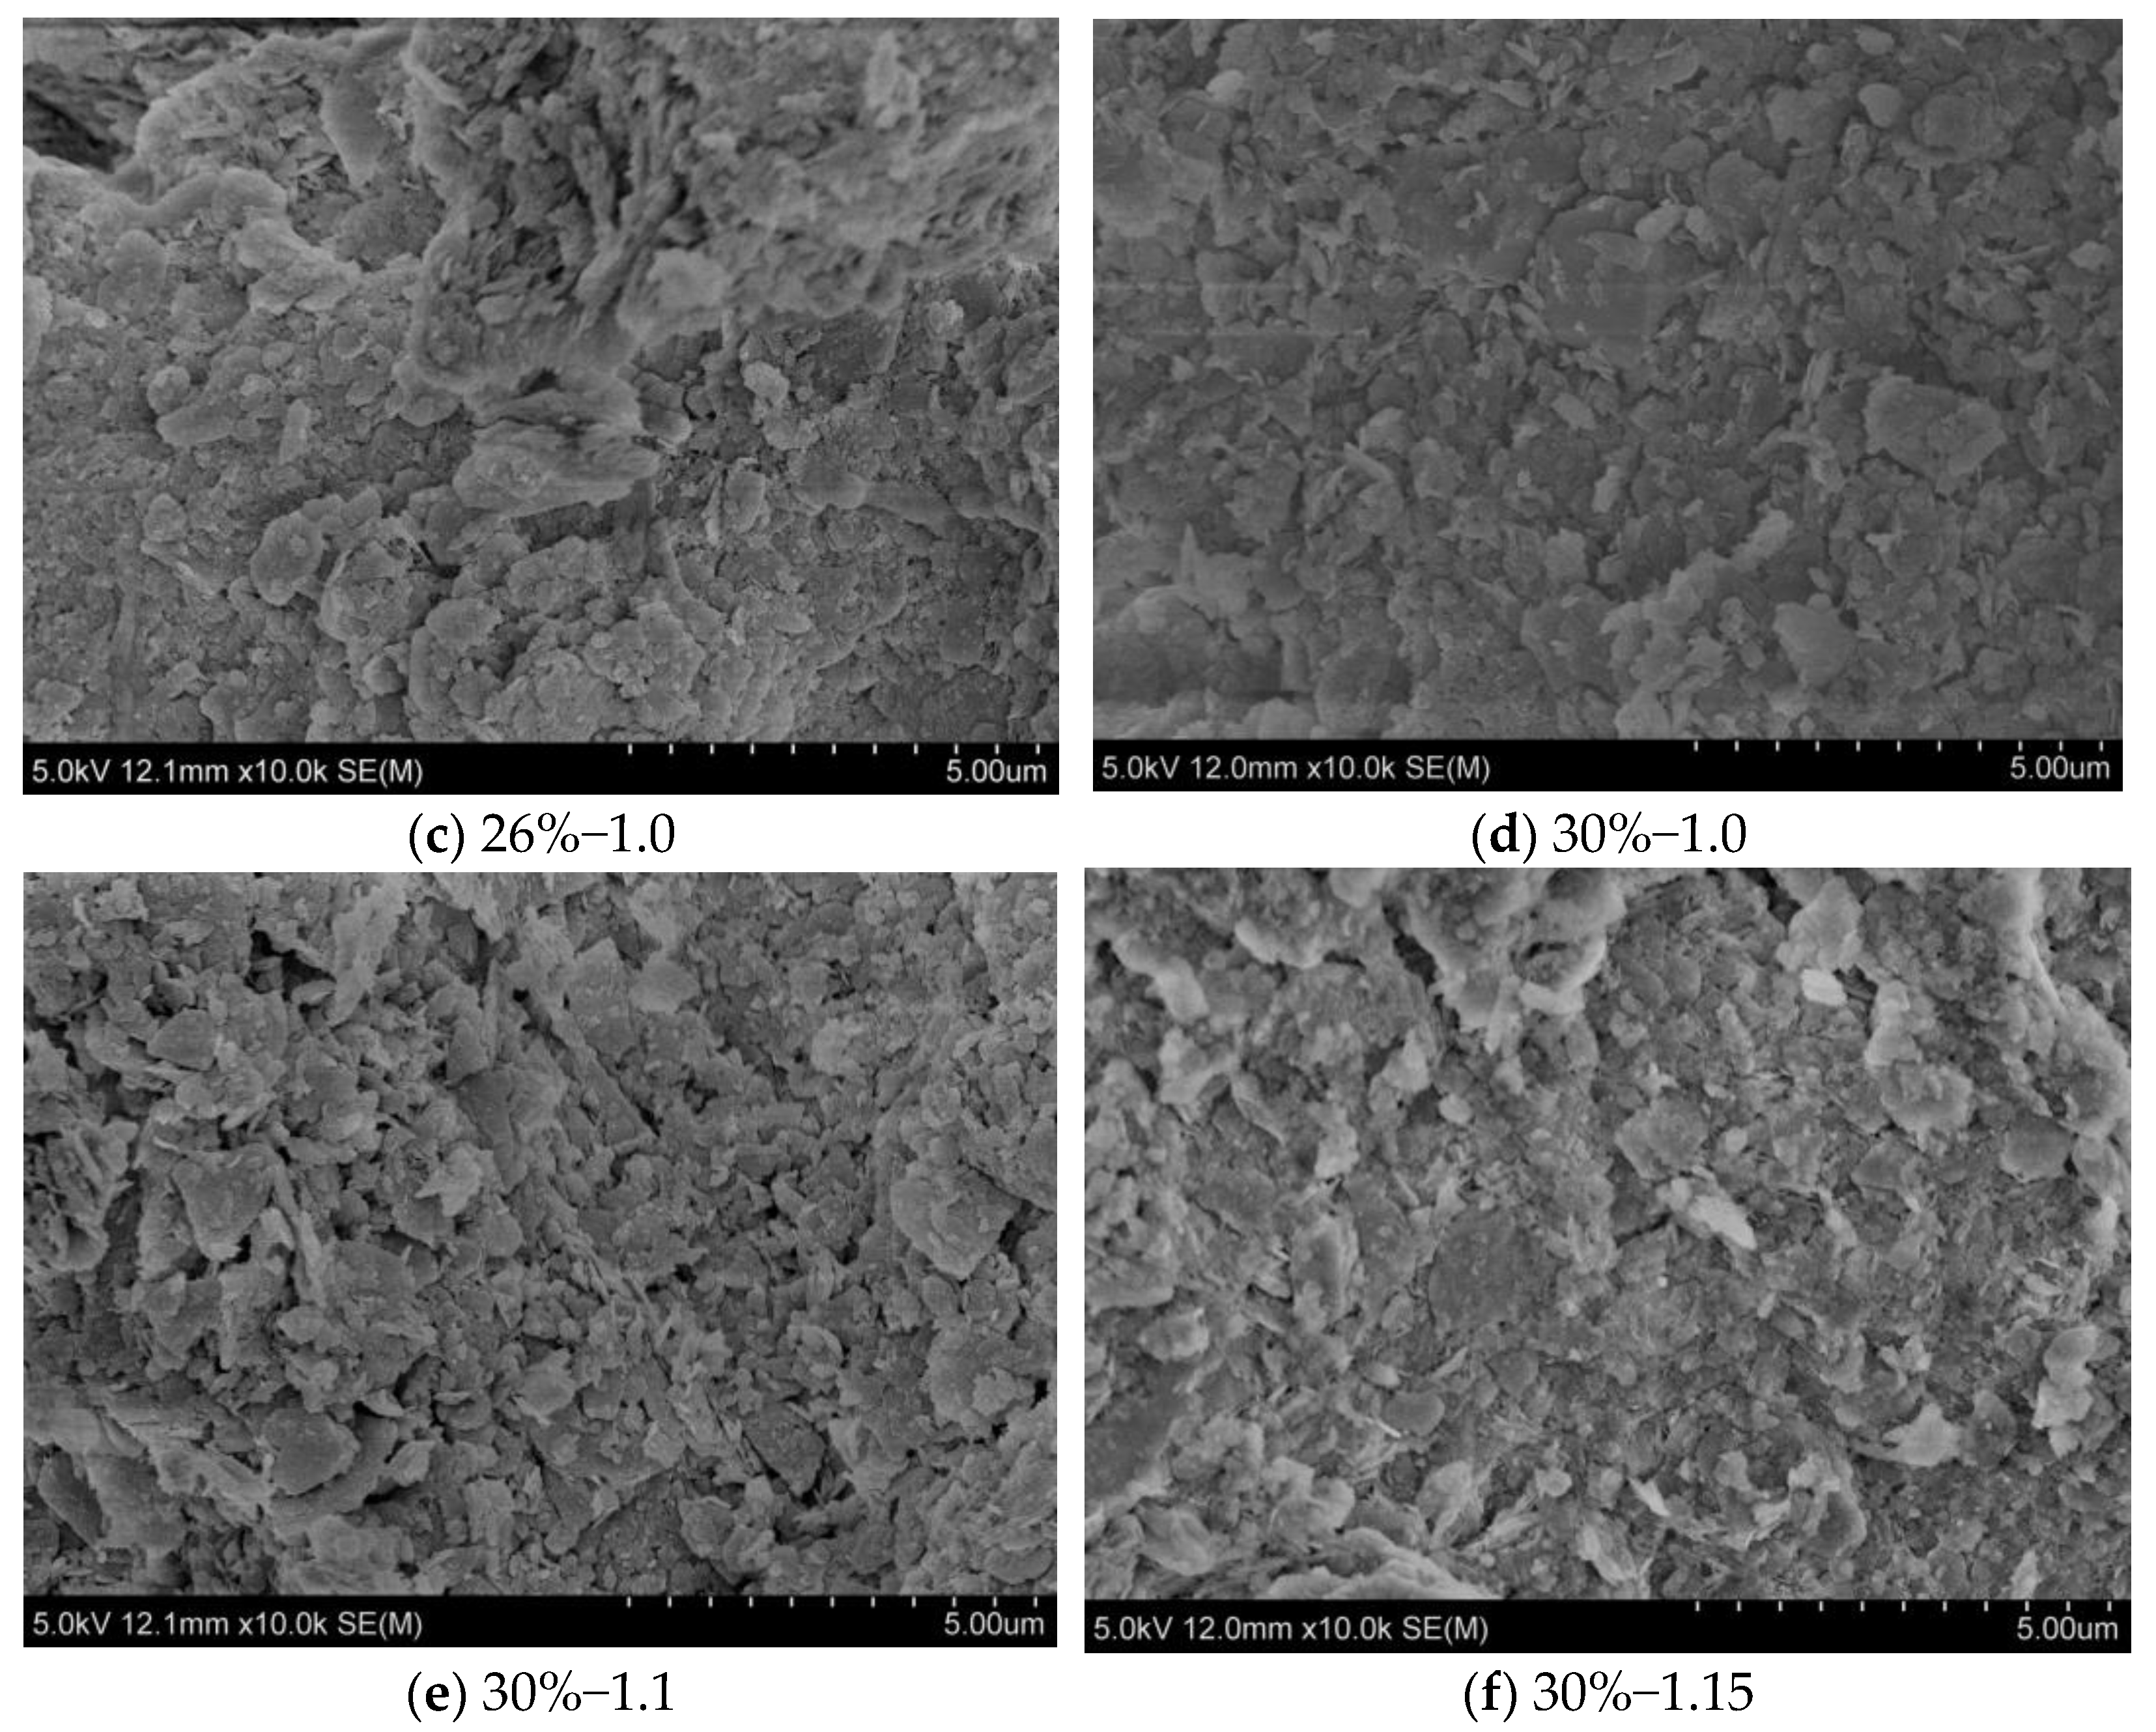
Figure 3 shows SEM images of soil samples partially magnified by 10,000 times. The red clay exhibits granular, lamellar, block-like, flocculent, and debris structures. The soil sample with ω = 24% and e = 1.0 consists of agglomerates of varying particle sizes, with less noticeable inter-aggregate pores. The agglomerates are closely connected in an edge-face and face–face manner, with poor arrangement orientation. The soil sample with ω = 24% and e = 1.15 comprises agglomerates with larger particle sizes and clearer interfaces. The granular structure is prominent, and small soil particles fill the gaps between larger units. The agglomerates are in contact with each other in an edge–edge and edge–face manner, forming a flocculent structure with weak connection, loose structure, and local voids. In the soil sample with ω = 26% and e = 1.0, layered and overlapped lamellar minerals are visible, along with local fine-grained structures. These lamellar minerals have good orientation and are mainly connected in a face–face manner. Fine-grained minerals are locally embedded in the lamellar structure, and the minerals are closely connected with poor pore connectivity. In the soil sample with ω = 30% and e = 1.0, numerous block-like structures with different particle sizes and a small amount of lamellar structures are observable, along with occasional larger granules. The particles are mainly in face–face contact, and a certain amount of small and a few large pores can be seen, belonging to block-like structures. In the soil sample with ω = 30% and e = 1.1, a large number of lamellar and flocculent structures are visible. The lamellar minerals are disordered with poor arrangement orientation, mainly in edge–edge contact, and some are in edge–face contact. The minerals have developed pores and good connectivity. In the soil sample with ω = 30% and e = 1.15, block-like and debris structures are visible, with minerals mainly in edge–edge contact and some in edge–face contact. Large pores are well developed and filled with a large amount of debris internally.
Comparing a, c, d and b, f, when e = 1.0, the contact between red clay particles is mostly face-to-face contact; however, in the 24% soil, the particles are larger and the pore size is also larger, with locally visible holes and a loose structure. In the 26% and 30% soil, the particles are smaller and more uniform, the pore size becomes smaller, and the connection is also tighter. When e = 1.15, the main contact between red clay particles is edge–face contact and edge–edge contact. Both particle size and pore size decrease with increasing initial water content. Comparing a, b, and d, e, f, it can be observed that, when ω = 24% and ω = 30%, both particle size and pore size increase with increasing void ratio, and the contact between particles transitions from face–face contact to edge–edge contact, indicating improved pore connectivity.
3.2. Nuclear Magnetic Resonance Test
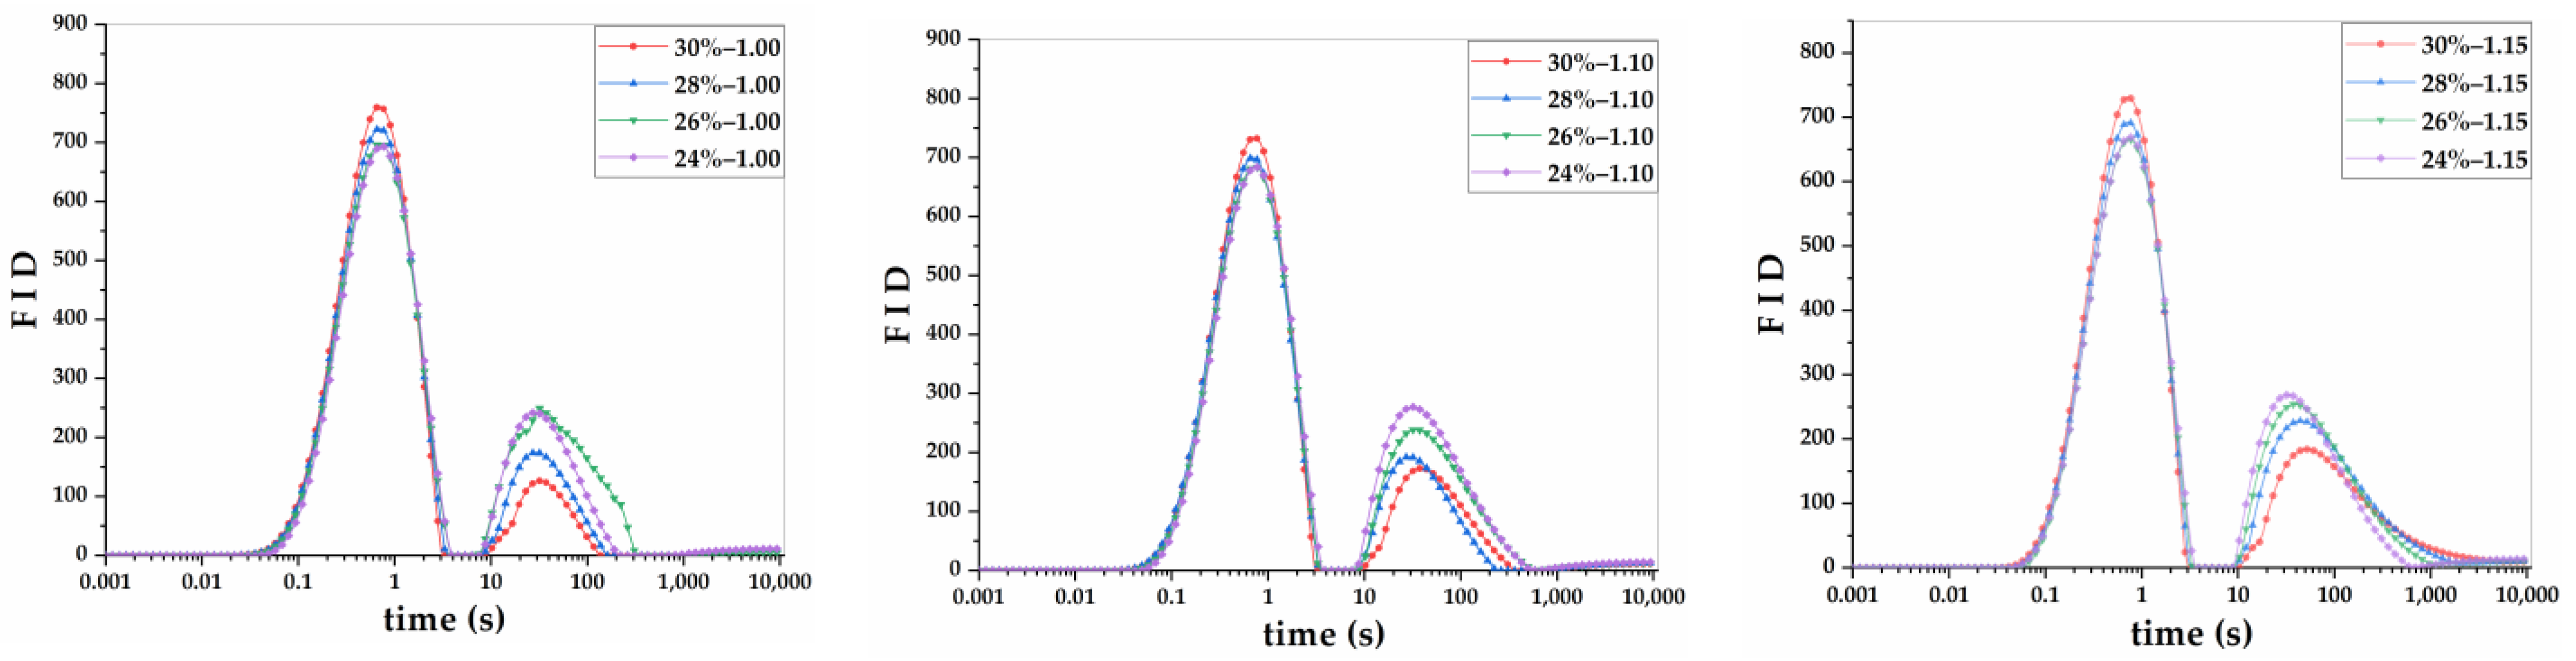
In order to obtain the water molecule existence state and pore size characteristics of reshaped red clay with different structural properties, the distribution of water molecules in the natural state and saturated state of each soil body was detected using the PQ-001-Mini-NMR nuclear magnetic resonance analyzer from Suzhou Newmai Company. The distribution law of water molecules with moisture content and void ratio and the pore structure characteristics of each soil sample were obtained.
Nuclear magnetic resonance (NMR) technology is a non-destructive detection technique used to study the content and distribution of hydrogen nuclei in materials. It is characterized by its accuracy, efficiency, and continuity, and the reliability of its test results is very high. The principle can be summarized as follows: First, a main magnetic field is applied to the soil sample to force the hydrogen nuclei to deviate and lose balance. Then, the interference of the main magnetic field is stopped, allowing the proton group to gradually return to equilibrium. The free induction decay (FID) curve of the nuclear magnetic signal is measured, and the transverse relaxation time distribution curve of the soil pore water is obtained through Fourier transformation. The peak area below this curve represents the content of water molecules in the soil sample; that is, the transverse relaxation time distribution curve can reflect the distribution characteristics of pore water in the rock and soil medium. According to the KST theory:
In the equation, T2B represents the free relaxation time, in milliseconds; T2S is the surface relaxation time, in milliseconds; T2D is the molecular diffusion relaxation time, in milliseconds; ρ2 is the transverse relaxation rate, which is related to the physical and chemical properties of the soil particle surface; S and V represent the surface area and volume of the pore where the pore water is located, respectively.
For pore water in the soil, T2B is much larger than T2S and T2D, so the effects of 1/T2B and 1/T2D on T2 can be ignored; that is,
Before conducting nuclear magnetic resonance (NMR) testing, dry red clay samples with initial moisture contents of 24%, 26%, 28%, and 30% were prepared. After being sealed for 48 h, 12 sets of reshaped samples with structural characteristics were compressed. To eliminate the influence of ferromagnetic materials on NMR experiments, a polytetrafluoroethylene ring cutter with an inner diameter of φ = 40 mm and a height of h = 20 mm was used. The NMR test first tested the samples in their natural state to obtain the presence of water molecules. Then, the former soil samples were saturated for 24 h using the vacuum saturation method, allowing water molecules to fill all the pores. At this point, the NMR results reflect the moisture distribution in the saturated soil samples, indicating the distribution of micro-pores in the soil.
When e = 1.0, all soils exhibit a triple-peak structure. The initial T2 value of the main peak in the nuclear magnetic attenuation curve gradually decreases from 0.0383 ms to 0.0059 ms as the water content increases. The small pore size gradually shifts to the left, and the peak width decreases from 3.5317 ms to 3.0341 ms. The main peak area decreases from 1252.88 to 1202.95, and the volume of small pores slightly decreases as the moisture content increases, indicating a tighter contact between soil particles. The initial T2 value of the secondary peak in the nuclear magnetic attenuation curve gradually increases from 8.0264 ms to 9.4379 ms as the moisture content increases. The large pore size gradually shifts to the right, and the area decreases from 112,113.92 to 70,347.09, followed by a small fluctuation. This accounts for more than 98% of the total pore volume, indicating that as the moisture content increases, the large pore size gradually increases and the pore volume gradually decreases. The total peak area decreases from 113,366.79 at ω = 24% to 71,033.06 at ω = 30%, and the total pore volume decreases significantly with increasing moisture content.
When e = 1.1, the soil structure is mostly bimodal, and the starting T2 value of the main peak of the T2 spectrum decreases slowly from 0.0488 ms to 0.0326 ms and then drops sharply to 0.0064 ms as the moisture content increases. The small pore size gradually shifts to the left, the peak width decreases from 3.5212 ms to 3.0336 ms, the main peak area decreases from 1225.51 to 1178.21, and the volume of small pores decreases with the increase of moisture content. The starting T2 value of the secondary peak of the nuclear magnetic attenuation curve gradually increases from 8.7036 ms to 9.4379 ms as the moisture content increases, and the large pore size gradually shifts to the right. The area decreases significantly from 158,449.4 to 108,691.54, accounting for more than 99% of the total pore volume. The total peak area gradually decreases from 159,674.91 to 109,869.75 as the moisture content increases. Compared with e = 1.0, the starting T2 value of the soil with the same moisture content gradually increases, and the ending T2 value remains basically unchanged. The small pore size increases within a small range, and the peak width slightly decreases. The increment of the secondary peak area is between 30,670.01 and 71,357.58, with a growth rate of 34.76% to 101.43%.
When e = 1.1, the soil structure is mostly bimodal. As the moisture content increases, the starting T2 value of the main peak of the T2 spectrum decreases slowly from 0.0488 ms to 0.0326 ms and then drops sharply to 0.0064 ms. The small pore size gradually shifts to the left, and the peak width decreases from 3.5212 ms to 3.0336 ms. The main peak area decreases from 1225.51 to 1178.21, and the volume of small pores decreases with the increase of moisture content. The starting T2 value of the secondary peak of the nuclear magnetic attenuation curve gradually increases from 8.7036 ms to 9.4379 ms as the moisture content increases, and the large pore size gradually shifts to the right. The area decreases significantly from 158,449.4 to 108,691.54, accounting for more than 99% of the total pore volume. The total area gradually decreases from 159,674.91 to 109,869.75 as the moisture content increases. When compared with e = 1.0, the starting T2 value of the soil with the same moisture content gradually increases, and the ending T2 value remains basically unchanged. The small pore size increases within a small range, and the peak width slightly decreases. The increment of the secondary peak area is between 30,670.01 and 71,357.58, with a growth rate of 34.76% to 101.43%.
When e = 1.15, the soil structure is bimodal. The starting T2 value of the main peak in the T2 spectrum decreases from 0.045 ms to 0.0277 ms as the moisture content increases. The peak width gradually decreases from 3.245 ms to 2.7723 ms. The small pore aperture gradually shifts to the left. The area of the main peak decreases from 1182.83 to 1143.23, while the area of the small pore decreases slightly with the increase of moisture content. The starting T2 value of the secondary peak increases gradually with the moisture content, and the peak area decreases from 157,098.56 at ω = 24% to 153,941.85 at ω = 28%, then rapidly increases to 179,888.55. This indicates that there is a critical moisture content for the volume of large pores, and the volume of large pores is the smallest near the critical moisture content, with the soil particles in the closest contact. The total pore volume follows the same trend as the volume of large pores, decreasing first and then increasing with the moisture content. Compared with e = 1.1, the main peak area of the T2 spectrum in soils with the same moisture content decreases slightly, while the secondary peak area increases significantly.
When the moisture content remains constant, the soil undergoes a transition from a three-peak structure to a double-peak structure as the void ratio increases. The starting T2 value of the main peak in the nuclear magnetic attenuation curve shifts to the right as void ratio increases, and the area of the main peak gradually decreases. The volume of small pores decreases slightly as void ratio increases, and the contact between soil particles becomes more compact. The starting T2 value of the secondary peak in the nuclear magnetic attenuation curve also shifts to the right as void ratio increases, and the area of the secondary peak increases significantly. The volume of large pores increases significantly, resulting in a gradual increase in pore volume and looser contact between soil particles.
Therefore, there is a strong correlation between the red clay structure and the distribution of pore sizes, as well as the void ratio and initial moisture content. When analyzing soil structure, it is important to take into account not only void ratio or moisture content, but also other structural characteristics. Focusing solely on these factors can result in an incomplete understanding of the soil’s properties and may lead to errors in explaining the relationship between disintegration rate and structural characteristics.
4. The Influence of Moisture Content and Void Ratio on Disintegration
Combining the results of NMR and disintegration tests, it is found that when the moisture content of red clay is constant, the disintegration rate increases with the increase of pore volume. Yet, when the difference in pore volume is not significant, the disintegration rate of red clay with different moisture contents is significantly different. The T2 spectrum area of 26%−1.1 is 142,880.66, with a disintegration rate of 0.055 g/s, while the T2 spectrum area of 28%−1.15 is 161,720.88, with a disintegration rate of 0.035 g/s. The disintegration rate decreases as the increase of pore volume. Thus, the secondary peak area of the T2 spectrum at 26%−1.1 is 141,704.67, and the disintegration rate is 0.055 g/s. Similarly, the secondary peak area of the T2 spectrum at 30%−1.15 is 179,888.55, and its disintegration rate is also 0.055 g/s. Although the volume of large pores increases, the disintegration rate does not increase significantly. It is evident the disintegration rate of red clay is not significantly correlated with pore volume or large pore volume.
The main physical change during the disintegration of red clay is the expansion of the diffusion layer thickness. In order to comprehensively consider the influence of moisture content and void ratio on the disintegration characteristics, both factors are transformed into ‘combined water saturation’ from the water distribution in soil. The combined water saturation refers to the ratio of the mass of combined water of red clay under the natural state to the mass of combined water under fully saturated state. Its formula is as follows:
- represents the combined water saturation (%);
- m1 is the mass (g) of combined water in its natural state;
- m is the mass (g) of combined water in its saturated state.
4.1. Distribution Law of Natural Soil Moisture
Figure 5 and Table 3 show the distribution of water molecules in various soil types with varying levels of moisture contents and void ratios under natural conditions.
According to Figure 5, it can be seen that the majority of soil water molecules in their natural state exhibit a bimodal distribution (except for the unimodal distributions at 24%−1.00, 24%−1.15, and 28%−1.10). When e = 1.0, the main peak area increases from 697.08 to 1041.81 as the moisture content increases, with increases of 13.6%, 12.8%, and 16.5% between adjacent moisture contents. When e = 1.1, the main peak area increases by 15.5%, 14.0%, and 14.1% as the moisture content increases. The main peak area is generally smaller than that of e = 1.0, mainly because as the void ratio increases, large pores gradually increase, the soil structure becomes looser, and more gravitational water is free in the large pores, while water is reduced in small pores. When e = 1.15, the main peak area increases as the moisture content increases. The increases between adjacent moisture contents are 13.1%, 14.5%, and 13.7%, respectively. These absolute value increases smaller than e = 1.1. In its natural state, soil contains both combined water and gravitational water in pores. The small pores are not entirely filled with combined water, while the large pores cannot be completely filled with gravitational water. Hence, the main peak or secondary peak area of the T2 spectrum cannot be used to determine the content of combined water in the soil.
4.2. Combined Water Saturation under Natural Conditions
According to the literature [47], there is a cutoff point on the transverse relaxation time T2 distribution curve. When the transverse relaxation time of the pore fluid is greater than the cutoff point, the fluid can flow freely; otherwise, it is combined fluid. Therefore, the content of combined water or free water in the soil can be determined by the cutoff point on the transverse relaxation time T2 distribution curve. The method of empirical judgment to define the T2 value at the midpoint between the highest and lowest points on the T2 distribution curve as the cutoff point is known as the ‘half point’ method. When the transverse relaxation time of the main peak is less than 10 ms, the T2 cutoff point can be taken near the ‘right half point’ of the main peak; when the main peak is greater than 10 ms, the T2 cutoff point can be taken near the ‘left half point’ of the main peak. Since the transverse relaxation time of Guilin red clay is all less than 10 ms, the ‘right half point’ method was taken to find the cutoff point.
According to Table 4 and the calculation results of combined water saturation, it is found that when the void ratio is constant, the combined water saturation increases with the increase of moisture content. When the moisture content is constant, the combined water saturation decreases with the increase of void ratio. Through the fitting display of origin8.0, it is found that the combined water saturation, initial moisture content, and void ratio has a high correlation. The adjusted R2 is 0.9929, indicating a good fitting effect. The fitting equation is:
- represents the combined water saturation degree (%);
- ω is the initial moisture content of the soil (%);
- e is the void ratio of the soil.
4.3. Disintegration Rate and Combined Water Saturation
As shown in Table 5 and Figure 6, when the moisture content is constant, the disintegration rate increases as combined water saturation increases. When e = 1.0, the disintegration rate of red clay decreases as combined water saturation increases, and the soil does not disintegrate when the combined water saturation is above 72.0%. When e = 1.1, all soils disintegrate, and the disintegration rate of red clay decreases as combined water saturation increases. When e = 1.15, all soils disintegrate, and the disintegration rate decreases first and then increases with the increase of combined water saturation. This abnormal phenomenon may be caused by the large pore volume in soils with high moisture content and high void ratio; the cohesion between adjacent soil particles is very weak, which easily disrupts stable state of soil. Through fitting with origin 8.0, the disintegration rate of red clay is exponentially related to the combined water saturation. The adjusted R2 is 0.8989, indicating a good fit. The fitting equation is:
5. Conclusions
SEM tests have shown that as moisture content increases while void ratio remains constant, the size of red clay particles decreases and pore size gradually decreases, resulting in tighter contact between soil particles. Conversely, when void ratio increases while moisture content remains constant, both red clay particles and pore diameter increase, transitioning from face-to-face contact to edge-to-edge contact and improving connectivity between pores, resulting in looser contact between particles.
The microstructural characteristics of red clay are influenced by the initial moisture content and void ratio. When the moisture content remains constant, the soil structure changes from a three-peak structure to a two-peak structure as the void ratio increases. The starting T2 value of the main peak on the nuclear magnetic attenuation curve gradually shifts to the right, and the area gradually decreases. The starting T2 value of the secondary peak gradually shifts to the right, and the area gradually increases, along with the total peak area. When e = 1.0 and 1.1, the starting T2 value of the main peak on the nuclear magnetic attenuation curve gradually shifts to the left, and the main peak area decreases. The starting T2 value of the secondary peak gradually shifts to the right, and the secondary peak area gradually decreases, along with the total peak area. When e = 1.15, the starting T2 value of the main peak on the nuclear magnetic attenuation curve gradually shifts to the left, and the main peak area decreases. The starting T2 value of the secondary peak gradually shifts to the right, and the secondary peak area and total peak area decrease first and then gradually increase.
Based on the T2 spectrum of nuclear magnetic resonance for red clay in both its natural and saturated states, the moisture content and void ratio of the red clay can be converted into ‘combined water saturation’ using the ‘right half point’ method. The combined water saturation increases with the increase of moisture content, decreases with the increase of void ratio, and , with the adjusted R2 at 0.9929, indicating a good fitting effect.
The disintegration rate of red clay is not significantly correlated with the total pore and large pore volume of the soil. However, it has an exponential relationship with the degree of combined water saturation. The fitting equation is , with the adjusted R2 at 0.9934, indicating a good fitting effect, and the disintegration rate decreases as the combined water saturation increases.
Author Contributions
The authors confirm their contributions to the paper as follows: study conception and design: H.W. and Z.L.; data collection: H.W. and Y.X.; analysis and interpretation of results: H.W., Y.L. and Y.X.; draft manuscript preparation: H.W., Z.L. and Y.X. All authors have read and agreed to the published version of the manuscript.
Funding
This research was funded by the National Natural Science Foundation of China (Grant No. 41867039 and Grant No. 52268055), the Guangxi Key Laboratory of Geomechanics and Geotechnical Engineering (No. 20-Y-XT-03), the Foundation Engineering of Technical Innovation Center of Mine Geological Environmental in Southern Area (No. CXZX2020002), and the Guangxi Science and Technology Program (No. 2022JJB160082).
Institutional Review Board Statement
Not applicable.
Informed Consent Statement
Not applicable.
Data Availability Statement
The datasets generated and analyzed during the current study are available from the corresponding author upon reasonable request. The data are not publicly available due to the data are part of an ongoing study.
Conflicts of Interest
The authors declare no conflicts of interest.
References
- Liu, Z.; Liang, J.; Zhou, J. Analysis of the development mechanism of soil caves in karst areas. J. Eng. Geol. 2004, 12, 45–49. [Google Scholar]
- Alavi-Nezhad, S.V.K.; Abad, A.; Tugrul, C.; Gokceoglu, D.; Jahed, A. Characteristics of weathering zones of granitic rocks in Malaysia for geotechnical engineering design. Eng. Geol. 2016, 200, 94–103. [Google Scholar] [CrossRef]
- Pradhan, A.; Kim, Y.T. Application and comparison of shallow landslide susceptibility models in weathered granite soil under extreme rainfall events. Environ. Earth Sci. 2015, 73, 5761–5771. [Google Scholar] [CrossRef]
- Qi, Y.; Jiang, P.; Liu, X. Influence of soil disintegration in water on slope stability. Chin. J. Geotech. Eng. 2020, 42 (Suppl. S2), 214–218. [Google Scholar]
- Qiu, Z.; Yang, Y.; Wu, Y. Experimental study on the disintegration characteristics of weakly weathered mudstone. Sci. Technol. Eng. 2014, 14, 266–269+273. [Google Scholar]
- Zhang, X.; Fan, H.; Yang, X. Study on the influence of bulk density and moisture content on the rate of static water erosion of sandy clay loam. Acta Pedol. Sin. 2013, 50, 214–218. [Google Scholar]
- Zuo, Q.; Wu, L.; Luo, T.; Bian, Y.; Tan, Y. Study on macroscopic failure characteristics and microscopic mechanism of Yaogu tunnel in Shanghai-Kunming high-speed railway. Hydrogeol. Eng. Geol. 2015, 42, 65–69. [Google Scholar]
- Huang, F.; Zhao, L.; Ling, T.; Yang, X. Rock mass collapse mechanism of concealed karst cave beneath deep tunnel. Int. J. Rock Mech. Min. Sci. 2017, 2017, 133–138. [Google Scholar] [CrossRef]
- He, K.; Jia, Y.; Chen, W.; Wang, R.; Luo, H. Evaluation of karst collapse risks induced by over-pumping and karst groundwater resource protection in Zao-zhuang region, China. Environ. Earth 2014, 2014, 3443–3454. [Google Scholar] [CrossRef]
- Haji, K.; Kamal, T. Hazards and mechanism of sinkholes on Kabudar Ahang and Famenin plains of Hamadan, Iran. Nat. Hazards 2010, 55, 481–499. [Google Scholar]
- Klimchouk, A.; Andrejchuk, V. Karst breakdown mechanisms from observations in the gypsum caves of the Western Ukraine: Implications for subsidence hazard assessment. Environ. Geol. 2005, 48, 336–359. [Google Scholar] [CrossRef]
- Liu, J.; Zhang, L. Microstructure and mechanical and strength performance of saline soil in chagan lake salt lake area. Salt Lake Res. 2014, 22, 60–67. [Google Scholar]
- Tan, J. Study on the Mechanism of Soil Layer Disintegration in Karst Areas with Full Coverage in Guangxi. J. Eng. Geol. 2001, 9, 272–276. [Google Scholar]
- Zhang, S.; Tang, H. Experimental study on weathering mechanism of unsaturated granite residual soil. Rock Soil Mech. 2013, 34, 1668–1674. [Google Scholar]
- Gao, J.; Yu, H.; Qian, Y. Experimental study on the characteristics of loess collapse. J. Yangtze River Sci. Res. Inst. 2014, 31, 146–150+155. [Google Scholar]
- Gamble, J.C. Durability-Plasticity Classification of Shales and Other Argillaceous Rocks. Ph.D. Thesis, University of Illinois, Urbana-Champaign, Champaign, IL, USA, 1971. [Google Scholar]
- Yamaguchi, H.; Yoshida, K.; Kuroshima, I. Slaking and Shear Properties of Mudstone. Rock Mech. Power Plants 1988, 24, 133–144. [Google Scholar]
- Ruiz-Vera, V.; Wu, L. Influence of sodicity clay mineralogy, prewetting rate and their interaction on aggregate stability. Soil Sci. Soc. Am. J. 2006, 70, 1825–1833. [Google Scholar] [CrossRef]
- Liu, B.; Wang, L.; Zhou, H.; Yang, B.; Xiao, W. Experimental Study on Disintegration of Guilin Red Clay. Sustainability 2023, 15, 7833. [Google Scholar] [CrossRef]
- Chen, Y.; Zhou, X.; Ai, X.; Zhou, M.; Zhao, Y.; Lan, Z. Disintegration Characteristics of Remolded Granite Residual Soil with Different Moisture Contents. Sustainability 2024, 16, 84. [Google Scholar] [CrossRef]
- He, X.; Liu, C.; Zhang, X.; Wu, C.; Weng, Z. Disintegration Characteristics of Highly Weathered Granite under the Influence of Scouring. Water 2024, 16, 496. [Google Scholar] [CrossRef]
- Li, S.; Wu, M.; Meng, J. Influence of compaction degree and initial water content on disintegration characteristics of red clay. J. Henan Univ. Sci. Technol. Nat. Sci. Ed. 2021, 42, 54–59+8. [Google Scholar]
- Xia, Z.; Zhang, L.; Niu, P. Influence of initial water content slope on disintegration characteristics of purple soil. J. Soil Water Conserv. China 2017, 15, 121–127. [Google Scholar]
- Tong, D.; Feng, D.; Huang, S. Experimental study on the collapse characteristics of compacted soil. Sci. Technol. Eng. 2018, 18, 129–136. [Google Scholar]
- Li, J.; Cui, S.; Tian, W. Characteristics of rainfall erosion and soil disintegration experiment on highway slopes. J. Chang. Univ. Nat. Sci. Ed. 2007, 2007, 23–26+49. [Google Scholar]
- Thyagaraj, T.; Das, A.P. Physico-chemical effects on collapse behaviour of compacted red soil. Géotechnique 2017, 67, 559–571. [Google Scholar] [CrossRef]
- Mokni, N.; Romero, E.; Olivella, S. Chemo-hydro-mechanical behaviour of compacted Boom Clay: Joint effects of osmotic and matric suctions. Géotechnique 2014, 64, 681–693. [Google Scholar] [CrossRef]
- Lv, Y.; Chen, T. CT observation and numerical simulation of mudstone disintegration process in water environment. China Harb. Eng. 2015, 35, 24–27+48. [Google Scholar]
- Yang, G.; Xie, D.; Zhang, C.; Pu, Y. CT detection of damage characteristics of coal rock mass. Mech. Pract. 1996, 1996, 19–20+23. [Google Scholar]
- Liu, Y.; Wu, J.; Xie, Z. Experimental study on microstructure characteristics of soft soil based on NMR and SEM. J. Guangdong Univ. Technol. 2018, 35, 49–56. [Google Scholar]
- Jian, Z.; Yu, H. Investigation of pore water distribution in fine-grained soil based on nuclear magnetic resonance technology. J. Luoyang Inst. Technol. Nat. Sci. Ed. 2023, 33, 40–44. [Google Scholar]
- Wang, H.; Wei, C.; Tian, H. Study on Microscopic Pore Testing of Viscous Soil Based on Nuclear Magnetic Resonance Technology. Geotech. Fundam. 2017, 31, 217–221. [Google Scholar]
- Wei, X. Hydraulic Path Dependence of Compacted Loess Shear Strength and Slope Stability Problems, 1st ed.; Guilin University of Technology Press: Guilin, China, 2021. [Google Scholar]
- An, R.; Kong, L.; Li, C. Strength attenuation and microstructure damage law of granite residual soil under hot and rainy climate. Chin. J. Rock Mech. Eng. 2020, 39, 1902–1911. [Google Scholar]
- Yang, Z.; Yu, H. Study on the effect of sodium chloride solution on the swelling force and pore distribution of expansive soil. J. Geotech. Eng. 2019, 41 (Suppl. S2), 77–80. [Google Scholar]
- Yu, H.; Ma, H.; Lei, J. Influence of sodium chloride solution on the swelling characteristics of expansive soil. Sci. Technol. Eng. 2020, 20, 14606–14611. [Google Scholar]
- Moriwaki, Y. Causes of Slaking in Argillaceous Materials. Ph.D. Thesis, University of California, Berkeley, Berkeley, CA, USA, 1975. [Google Scholar]
- Chugh, Y.; Missavge, R. Effect of Moisture on stratacontrol in coal Mines. Eng. Geol. 1981, 17, 241–255. [Google Scholar] [CrossRef]
- Terzaghi, K. Theoretical Soil Mechanics; Wiley: New York, NY, USA, 1943. [Google Scholar]
- Cepeda, A. An Experimental Investigation of the Engineering Behavior of Natural Shales. Ph.D. Thesis, University of Illinois, Urbana-Champaign, Champaign, IL, USA, 1987. [Google Scholar]
- Lu, H. Engineering Characteristics and Failure Mechanism of Soft Rock Slope Rock Mass in Badong Group. Ph.D. Thesis, Graduate School of Chinese Academy of Sciences (Wuhan Institute of Rock and Soil Mechanics), Wuhan, China, 2010. [Google Scholar]
- Che, W. Analysis of the Influence and Mechanism of Water Environment on the Engineering Properties of Sodium-Based and Calcium-Based Soils. Master’s Thesis, Northwest A&F University, Yangling of Shaanxi, Shaanxi, China, 2018. [Google Scholar]
- Pan, Y.; Liu, Z.; Zhou, C. Experimental study on water-induced disintegration characteristics of red layer soft rock and its Interface Model. Rock Soil Mech. 2017, 38, 3231–3239. [Google Scholar]
- Tang, D.; Sun, S. Geotechnical Engineering, 2nd ed.; Geological Publishing House: Beijing, China, 2005. [Google Scholar]
- Zhang, X.; Kong, L.; Guo, A. Variation law of micro-pore structure during compression process of structured clay based on SEM and MIP tests. Chin. J. Rock Mech. Eng. 2012, 31, 406–412. [Google Scholar]
- Xu, R.; Xu, L.; Duan, J. Optimization of influencing factors on microstructure morphology and quantitative analysis of soft clay. J. Cent. South Univ. Nat. Sci. Ed. 2016, 47, 2723–2729. [Google Scholar]
- Liu, W.; Xing, L. Nuclear Magnetic Resonance Logging; Petroleum Industry Press: Beijing, China, 2011. [Google Scholar]
Figure 1.
Self-made disintegration apparatus.

Figure 2.
Disintegration curves of various red clays in pure water.

Figure 3.
Scanning electron microscope images of some red clay soil samples.


Figure 4.
Free induction decay curves of saturated red clay.

Figure 5.
Free induction decay curves of natural-state red clay.

Figure 6.
The relationship between combined water saturation and disintegration rate.


Table 1.
Statistical table of disintegration rates of red clay samples in pure water.
| Initial Moisture Content | 24% | 26% | 28% | 30% | |||||
|---|---|---|---|---|---|---|---|---|---|
| Saturation (%) | Rate of Disintegration (g/s) | Saturation (%) | Rate of Disintegration (g/s) | Saturation (%) | Rate of Disintegration (g/s) | Saturation (%) | Rate of Disintegration (g/s) | ||
| Void ratio | 1.0 | 65.52 | 0.739 | 70.98 | 0 | 76.44 | 0 | 81.90 | 0 |
| 1.1 | 59.56 | 1.769 | 64.53 | 0.055 | 69.49 | 0.029 | 74.45 | 0.002 | |
| 1.15 | 56.97 | 2.813 | 61.72 | 0.974 | 66.47 | 0.035 | 71.22 | 0.055 | |
Table 2.
Summary of peak information of T2 spectrum curves for saturated samples.
| Moisture Content (%) | Void Ratio | The Main Peak | The Secondary Peak | The Third Peak | Total Peak Area | ||||||
|---|---|---|---|---|---|---|---|---|---|---|---|
| Starting T2 Value (ms) | End T2 Value (ms) | Peak Area | Starting T2 Value (ms) | End T2 Value (ms) | Peak Area | Starting T2 Value (ms) | End T2 Value (ms) | Peak Area | |||
| 24 | 1.00 | 0.0383 | 3.57 | 1252.88 | 8.0264 | 204.91 | 20,292.54 | 587.28 | 10,000 | 91,821.38 | 113,366.79 |
| 24 | 1.10 | 0.0488 | 3.57 | 1225.51 | 8.7036 | 10,000 | 158,449.4 | 159,674.91 | |||
| 24 | 1.15 | 0.0450 | 3.29 | 1182.83 | 9.4379 | 10,000 | 157,098.56 | 158,281.39 | |||
| 26 | 1.00 | 0.0064 | 3.57 | 1227.72 | 7.402 | 307.21 | 36,484.37 | 1431.46 | 10,000 | 33,862.72 | 71,574.81 |
| 26 | 1.10 | 0.0326 | 3.29 | 1175.99 | 8.7036 | 10,000 | 141,704.67 | 142,880.66 | |||
| 26 | 1.15 | 0.0574 | 3.29 | 1151.34 | 9.4379 | 10,000 | 153,941.85 | 155,093.19 | |||
| 28 | 1.00 | 0.0064 | 3.29 | 1211.39 | 8.7036 | 148.2 | 12,045.5 | 811.98 | 10,000 | 76,186.09 | 89,442.98 |
| 28 | 1.10 | 0.0064 | 3.29 | 1165.26 | 8.7036 | 222.19 | 16,813.82 | 636.82 | 10,000 | 102,087.78 | 120,066.86 |
| 28 | 1.15 | 0.0450 | 3.04 | 1137.65 | 9.4379 | 10,000 | 160,583.23 | 161,720.88 | |||
| 30 | 1.00 | 0.0059 | 3.04 | 1202.95 | 9.4379 | 126.04 | 7690.03 | 1035.32 | 10,000 | 63,343.03 | 72,236.01 |
| 30 | 1.10 | 0.0064 | 3.04 | 1178.21 | 9.4379 | 361.23 | 22,387.06 | 636.82 | 10,000 | 86,304.48 | 109,869.75 |
| 30 | 1.15 | 0.0277 | 2.8 | 1143.23 | 11.097 | 10,000 | 179,888.55 | 181,031.78 | |||
Table 3.
Summary of peak information of T2 spectrum curves for natural samples.
| Moisture Content (%) | Void Ratio | The Main Peak | The Secondary Peak | ||||||
|---|---|---|---|---|---|---|---|---|---|
| Starting T2 Value (ms) | End T2 Value (ms) | Peak T2 Value (ms) | Peak Area | Starting T2 Value (ms) | End T2 Value (ms) | Peak T2 Value (ms) | Peak Area | ||
| 24 | 1.00 | 0.00594 | 1.8679 | 610.9146 | 697.08 | ||||
| 24 | 1.10 | 0.00594 | 1.8679 | 581.0081 | 657.19 | 136.6716 | 10,000 | 0.0098 | 57.13 |
| 24 | 1.15 | 0.00594 | 1.8679 | 581.1894 | 649.91 | ||||
| 26 | 1.00 | 0.00594 | 1.8679 | 672.6039 | 791.97 | 5231.0993 | 10,000 | 0.1289 | 401.70 |
| 26 | 1.10 | 0.00594 | 1.8679 | 644.4348 | 759.32 | 3489.1012 | 10,000 | 0.2814 | 1169.2 |
| 26 | 1.15 | 0.00594 | 1.8679 | 626.7187 | 735.24 | 3783.4626 | 10,000 | 0.2718 | 1090.8 |
| 28 | 1.00 | 0.00594 | 2.0255 | 726.4200 | 893.58 | 3783.4626 | 10,000 | 0.0330 | 133.48 |
| 28 | 1.10 | 0.00594 | 2.0255 | 708.3817 | 866.21 | ||||
| 28 | 1.15 | 0.00594 | 2.0255 | 688.3959 | 841.59 | 2146.1412 | 10,000 | 0.1508 | 732.52 |
| 30 | 1.00 | 0.00594 | 2.1964 | 799.4056 | 1041.81 | 91.1589 | 690.5514 | 0.3447 | 110.94 |
| 30 | 1.10 | 0.00594 | 2.1964 | 755.6883 | 988.44 | 51.7092 | 283.3096 | 0.8112 | 110.32 |
| 30 | 1.15 | 0.00594 | 2.1964 | 742.1578 | 956.70 | 43.9760 | 261.2675 | 0.7209 | 87.63 |
Table 4.
‘Right half point’ and combined water saturation statistics table.
| Initial Moisture Content (%) | Void Ratio | Half-Point of Natural State | Integral Area of Combined Water in Natural State | Half-Point of Saturation State | Integral Area of Combined Water in Saturation State | Integral Area of Free Water in Saturation State | Combined Water Saturation |
|---|---|---|---|---|---|---|---|
| 24 | 1.00 | 1.36557 | 611.79 | 1.9698 | 998.29 | 112,368.50 | 61.28% |
| 24 | 1.10 | 1.34987 | 574.89 | 1.98423 | 992.36 | 158,682.55 | 57.93% |
| 24 | 1.15 | 1.33775 | 550.78 | 1.97718 | 968.15 | 157,313.24 | 56.89% |
| 26 | 1.00 | 1.41757 | 698.12 | 1.90246 | 968.71 | 70,606.10 | 72.07% |
| 26 | 1.10 | 1.41675 | 669.31 | 1.91512 | 959.48 | 141,921.18 | 69.76% |
| 26 | 1.15 | 1.40762 | 646.92 | 1.94936 | 950.03 | 154,143.16 | 68.09% |
| 28 | 1.00 | 1.47127 | 782.73 | 1.81833 | 966.80 | 88,476.18 | 80.96% |
| 28 | 1.10 | 1.45999 | 757.39 | 1.83971 | 939.67 | 119,127.19 | 80.60% |
| 28 | 1.15 | 1.45734 | 735.71 | 1.86865 | 945.35 | 160,775.53 | 77.82% |
| 30 | 1.00 | 1.55293 | 908.91 | 1.77622 | 984.96 | 71,251.05 | 92.28% |
| 30 | 1.10 | 1.55323 | 858.61 | 1.8195 | 974.33 | 108,895.42 | 88.12% |
| 30 | 1.15 | 1.53142 | 831.13 | 1.7999 | 959.75 | 180,072.03 | 86.60% |
Table 5.
Combined water saturation and disintegration rate statistics table.
| Initial Moisture Content (%) | Void Ratio | Combined Water Saturation (%) | Disintegration Rate (g/s) |
|---|---|---|---|
| 24 | 1.00 | 61.28 | 0.739 |
| 24 | 1.10 | 57.93 | 1.769 |
| 24 | 1.15 | 56.89 | 2.813 |
| 26 | 1.00 | 72.07 | 0 |
| 26 | 1.10 | 69.76 | 0.055 |
| 26 | 1.15 | 68.09 | 0.974 |
| 28 | 1.00 | 80.96 | 0 |
| 28 | 1.10 | 80.60 | 0.029 |
| 28 | 1.15 | 77.82 | 0.036 |
| 30 | 1.00 | 92.28 | 0 |
| 30 | 1.10 | 88.12 | 0.002 |
| 30 | 1.15 | 86.60 | 0.055 |
Disclaimer/Publisher’s Note: The statements, opinions and data contained in all publications are solely those of the individual author(s) and contributor(s) and not of MDPI and/or the editor(s). MDPI and/or the editor(s) disclaim responsibility for any injury to people or property resulting from any ideas, methods, instructions or products referred to in the content. |
© 2024 by the authors. Licensee MDPI, Basel, Switzerland. This article is an open access article distributed under the terms and conditions of the Creative Commons Attribution (CC BY) license (https://creativecommons.org/licenses/by/4.0/).
Share and Cite
MDPI and ACS Style
Wang, H.; Liu, Z.; Xie, Y.; Li, Y. Study on the Influence of Moisture Content and Void Ratio on the Disintegration of Red Clay. Appl. Sci. 2024, 14, 3652. https://0-doi-org.brum.beds.ac.uk/10.3390/app14093652
AMA Style
Wang H, Liu Z, Xie Y, Li Y. Study on the Influence of Moisture Content and Void Ratio on the Disintegration of Red Clay. Applied Sciences. 2024; 14(9):3652. https://0-doi-org.brum.beds.ac.uk/10.3390/app14093652
Chicago/Turabian StyleWang, Hongming, Zhikui Liu, Yongxiong Xie, and Yuantao Li. 2024. "Study on the Influence of Moisture Content and Void Ratio on the Disintegration of Red Clay" Applied Sciences 14, no. 9: 3652. https://0-doi-org.brum.beds.ac.uk/10.3390/app14093652
Note that from the first issue of 2016, this journal uses article numbers instead of page numbers. See further details here.