
Human Activity Recognition Based on Deep Learning Regardless of Sensor Orientation

1
College of Information Science and Technology, Jinan University, Guangzhou 510632, China
2
Guangdong Institution of Smart Education, Jinan University, Guangzhou 510632, China
*
Author to whom correspondence should be addressed.
Appl. Sci. 2024, 14(9), 3637; https://0-doi-org.brum.beds.ac.uk/10.3390/app14093637
Submission received: 18 March 2024
/
Revised: 21 April 2024
/
Accepted: 22 April 2024
/
Published: 25 April 2024
(This article belongs to the Section Computing and Artificial Intelligence)
Abstract
:In recent years, the continuous progress of wireless communication and sensor technology has enabled sensors to be better integrated into mobile devices. Therefore, sensor-based Human Activity Recognition (HAR) has attracted widespread attention among researchers, especially in the fields of wearable technology and ubiquitous computing. In these applications, mobile devices’ built-in accelerometers and gyroscopes have been typically used for human activity recognition. However, devices such as smartphones were placed in users’ pockets and not fixed to their bodies, and the resulting changes in the orientation of the sensors due to users’ habits or external forces can lead to a decrease in the accuracy of activity recognition. Unfortunately, there is currently a lack of publicly available datasets specifically designed to address the issue of device angle change. The contributions of this study are as follows. First, we constructed a dataset with eight different sensor placement angles using accelerometers and gyroscopes as a prerequisite for the subsequent research. Second, we introduced the Madgwick algorithm to extract quaternion mode features and alleviate the impact of angle changes on recognition performance by fusing raw accelerometer data and quaternion mode features. The resulting study provides a comprehensive analysis. On the one hand, we fine-tuned ResNet and tested its stability on our dataset, achieving a recognition accuracy of 97.13%. We included two independent experiments, one for user-related scenarios and the other for user-independent scenarios. In addition, we validated our research results on two publicly available datasets, demonstrating that our method has good generalization performance.
1. Introduction
In recent years, Human Activity Recognition (HAR) has gained massive attention [1] from researchers and the academic community due to its important role in various fields, including healthcare [2], sports monitoring [3], intelligent surveillance [4], gaming [5], and rehabilitation [6]. HAR systems have been developed to monitor and recognize human activities through the use of various wearable sensors [7] or vision-based [8] datasets such as images [9,10] and videos [11]. In the past decade, significant improvements have been made in wireless communication and sensor technology in terms of capacity, affordability, and energy efficiency, as well as in the rapid development of mobile communication devices. As a result, sensors such as accelerometers, gyroscopes, and magnetometers are now able to be embedded in mobile devices such as smart bracelets and watches for human activity recognition [1,2,7].
As a standard for evaluating the performance of HAR tasks, accuracy is one of the important metrics. For greater accuracy, existing research primarily categorizes sensor placement into two methods: multiple sensors fixed on various parts of the body [12,13], such as the wrists, ankles, and chest, or a single mobile device such as a smartphone placed in the user’s pocket [14,15]. The former provides more sensor data, leading to greater recognition accuracy, but is inconvenient and costly, while the latter is low-cost and convenient, but may not be as accurate. Another issue involves device angle changes during data collection. In [16], for example, the sensors were not easily fixed on the human body when participants were performing tasks such as running. When only a single mobile phone was placed in the participant’s pocket, the issue of device angle change was augmented due to the sensor not being physically fixed to the human body.
The issue of device angle change in sensors which can affect the accuracy of HAR tasks has always been present. Our goal here is to find a more robust method that can eliminate the impact caused by device angle changes. At present, there are several publicly available HAR datasets on the market, such as WISDM [14], UCI HAR [17], Opportunity [18], and others. These datasets are comprehensive, but lack the different angle orientation data needed to simulate real-life scenarios accurately. For example, users may have different habits when using the devices, and are able to freely adjust the angles and positions of the devices according to their preferences. Additionally, device angle fluctuations may vary among different users during movement [19].
Existing research has mainly focused on machine learning or deep learning model architectures, with limited emphasis on the sensor data specifically. This means that important sensor data information, such as gyroscope readings that indicate angle information, may be underutilized. In other words, these studies often input only raw data into their models and apply the same feature extraction strategy to all sensors. Several studies have pointed out that the angle information in gyroscopes is rich and valuable [20]. Typically, combining gyroscopes with accelerometers yields better results than using accelerometers alone. Therefore, effectively utilizing the angle information from gyroscopes is crucial for HAR tasks. In addition to the HAR field, gyroscope data play an important role in fields such as inertial navigation [21], virtual reality [22], robotics [23], and more. The Madgwick algorithm [24] has been proposed to address some of the issues associated with traditional attitude estimation algorithms, and is widely used in these fields. It calculates attitude by fusing data from accelerometers, gyroscopes, and magnetometers, then converts sensor data (including from accelerometers and gyroscopes) into attitude information. It is derived by minimizing the error in attitude estimation based on the difference between the sensor measurements and the expected measurements, thereby avoiding the need for accurate model parameters and noise statistics. Furthermore, this algorithm is based on quaternions, which effectively addresses the problem of attitude estimation in nonlinear systems [25] with low computational demands and good real-time performance.
Therefore, in this research we examined the impact of sensor orientation with sensors embedded in mobile devices such as smartphones during the execution of HAR tasks. The contributions of this study are outlined as follows. First, due to the lack of publicly available datasets specifically addressing the device angle change problem, we collected a dataset containing using accelerometer and gyroscope data, including various device angles. Second, the sensor data were fused, and superior results were achieved by concatenating the raw data with the fused data as input.
The rest of this article is structured as follows. Section 2 provides a review of related works. Section 3 introduces the datasets used in our research and presents our proposed application of the Madgwick algorithm along with a brief overview of our baseline method. Section 4 details the experimental setup, results, and analysis, demonstrating our method’s superiority. Finally, our findings are concluded in Section 5.
2. Related Works
The deviation of sensor installation position and angle caused by body movement during user motion has been a persistent problem, impacting the accuracy of human motion recognition. Researchers have made numerous efforts to address this issue over the past decade. For instance, Jennifer et al. [14] collected data from different users performing various actions by using the accelerometer sensor in a single mobile phone device. The device was placed in the user’s pants pocket. The researchers extracted 43 sets of handcrafted features and achieved high accuracy. Spinsante et al. [26] integrated motion sensors and utilized decision tree algorithms to evaluate activity monitoring models for preventing sedentary lifestyles in the workplace. They found that placing the mobile phone in the user’s thigh pocket yielded optimal results. However, there were limitations, such as inevitable angle deviation and device position deviation due to differences in user habits. To overcome these drawbacks, Morales et al. [19] proposed a method based on Principal Component Analysis (PCA) orthogonal transformation. This method eliminates the influence of angles by linearly transforming data from the accelerometer and gyroscope sensors into the same coordinate system.
When the device is placed in different orientations, the coordinate system of the device is different. Even during the execution of the same activity, the distribution of sensor data from different positions differs [27]. Sun et al. [28] considered the correlation among sensor data from varying positions based on human behavioral characteristics. They argued that combining sensor information from different positions can more effectively capture human motion traits, harness the latent information in the available data, and enhance behavior recognition accuracy. Janidarmian et al. [29] comprehensively identified ten major body parts (such as the upper arms, ankles, and chest) using accelerometer measurements. Nweke et al. [30] employed accelerometers and gyroscopes for recognition and found that the optimal results were obtained when sensors were positioned on the chest and wrist. Jayita Saha et al. [31] addressed the variance due to different hardware configurations and usage behaviors in terms of where the smartphone was kept.
However, the aforementioned studies all relied on laborious manual feature engineering. Deep learning algorithms have achieved remarkable success in domains such as image classification [32], object detection [33], and natural language processing [34], overcoming the limitations of traditional machine learning methods by automatically learning features from data [35]. Among these algorithms, Convolutional Neural Networks (CNNs) have proven to be a popular choice for extracting temporal features [36]. Cho et al. [37] introduced a 1D-CNN for classifier learning and refining test data. The 1D-CNN classifier method enhances activity recognition accuracy by refining test data during the prediction phase. Lee et al. [38] combined multiple CNN structures with varying kernel sizes to capture temporal features at different scales. However, using multiple-kernel CNNs incurs greater computational cost and can provide insufficient results. Xi et al. [39] addressed this by applying dilated CNNs to expand the receptive field without losing resolution. Shu et al. [40] proposed ESE-FN for activity recognition in an elderly population. ResCNN and SeNet are among the more complex CNN architectures that are able to tackle temporal problems. Ronald et al. [41] introduced iSPLInception, a resource-efficient model with high accuracy inspired by Inception-ResNet that caters to devices with limited resources. Mekruksavanich et al. [42] addressed the challenges of complex human activity recognition using a deep neural network with attention mechanisms. They demonstrated the superiority of deep residual networks for accurate activity recognition. Yan et al. [43] were able to enhance human activity recognition using a novel ResNet-like CNN model that integrates residual learning, achieving improved accuracy with significantly reduced parameters.
3. Methodology
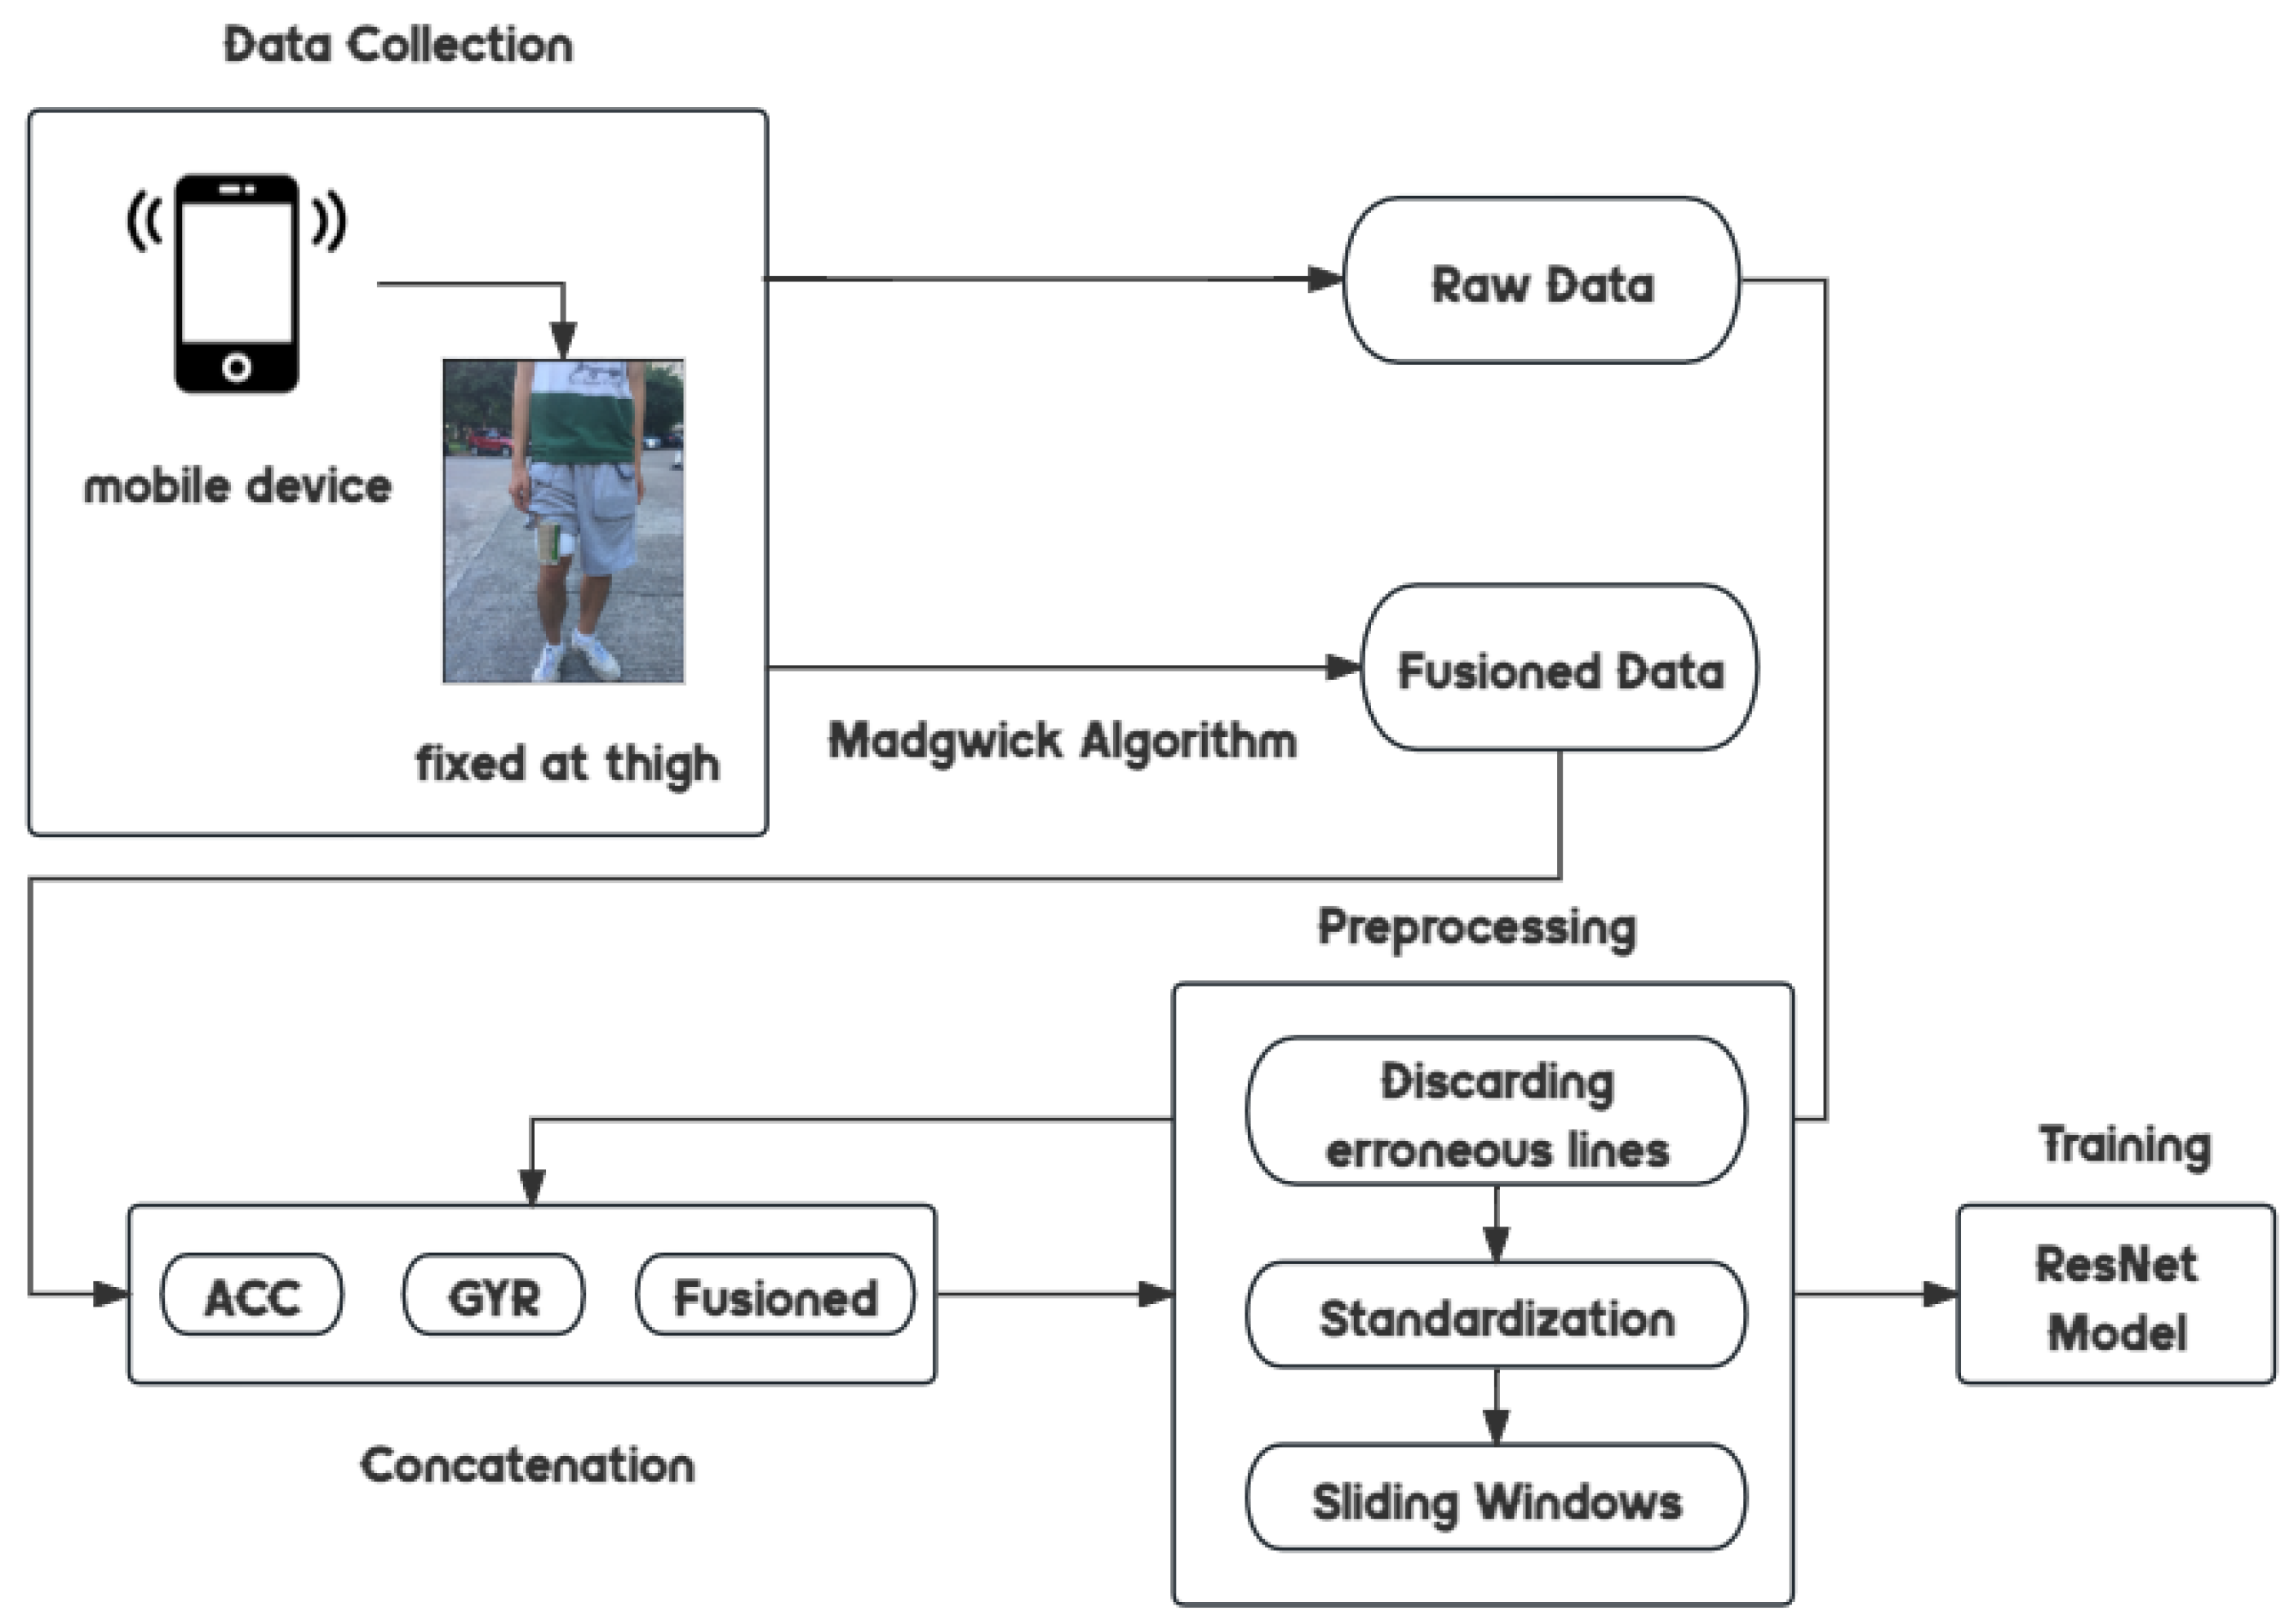
The proposed solutions discussed above do not explicitly account for the impact of the device angle change problem, primarily due to the datasets employed in these works lacking diverse angle information. Therefore, we embarked on an initiative to collect a dataset including different angles. We used the Madgwick algorithm to fuse our sensor data. To adapt to the data our work, we built an optimized ResNet-34 model to solve the device orientation change problem. In this section, we introduce the datasets used in our research and delve into the Madgwick algorithm and its optimization strategies, followed by an introduction to ResNet-34 and our refined version. The primary workflow of the entire study is illustrated in Figure 1.
3.1. Datasets
To enhance the robustness of the experimental comparison, three datasets were utilized: our dataset, and two publicly available datasets (WISDM [14] and UCI HAR [17]). This approach aimed to facilitate a more comprehensive evaluation. The following subsections provide an introduction to these three datasets.
3.1.1. Our Dataset
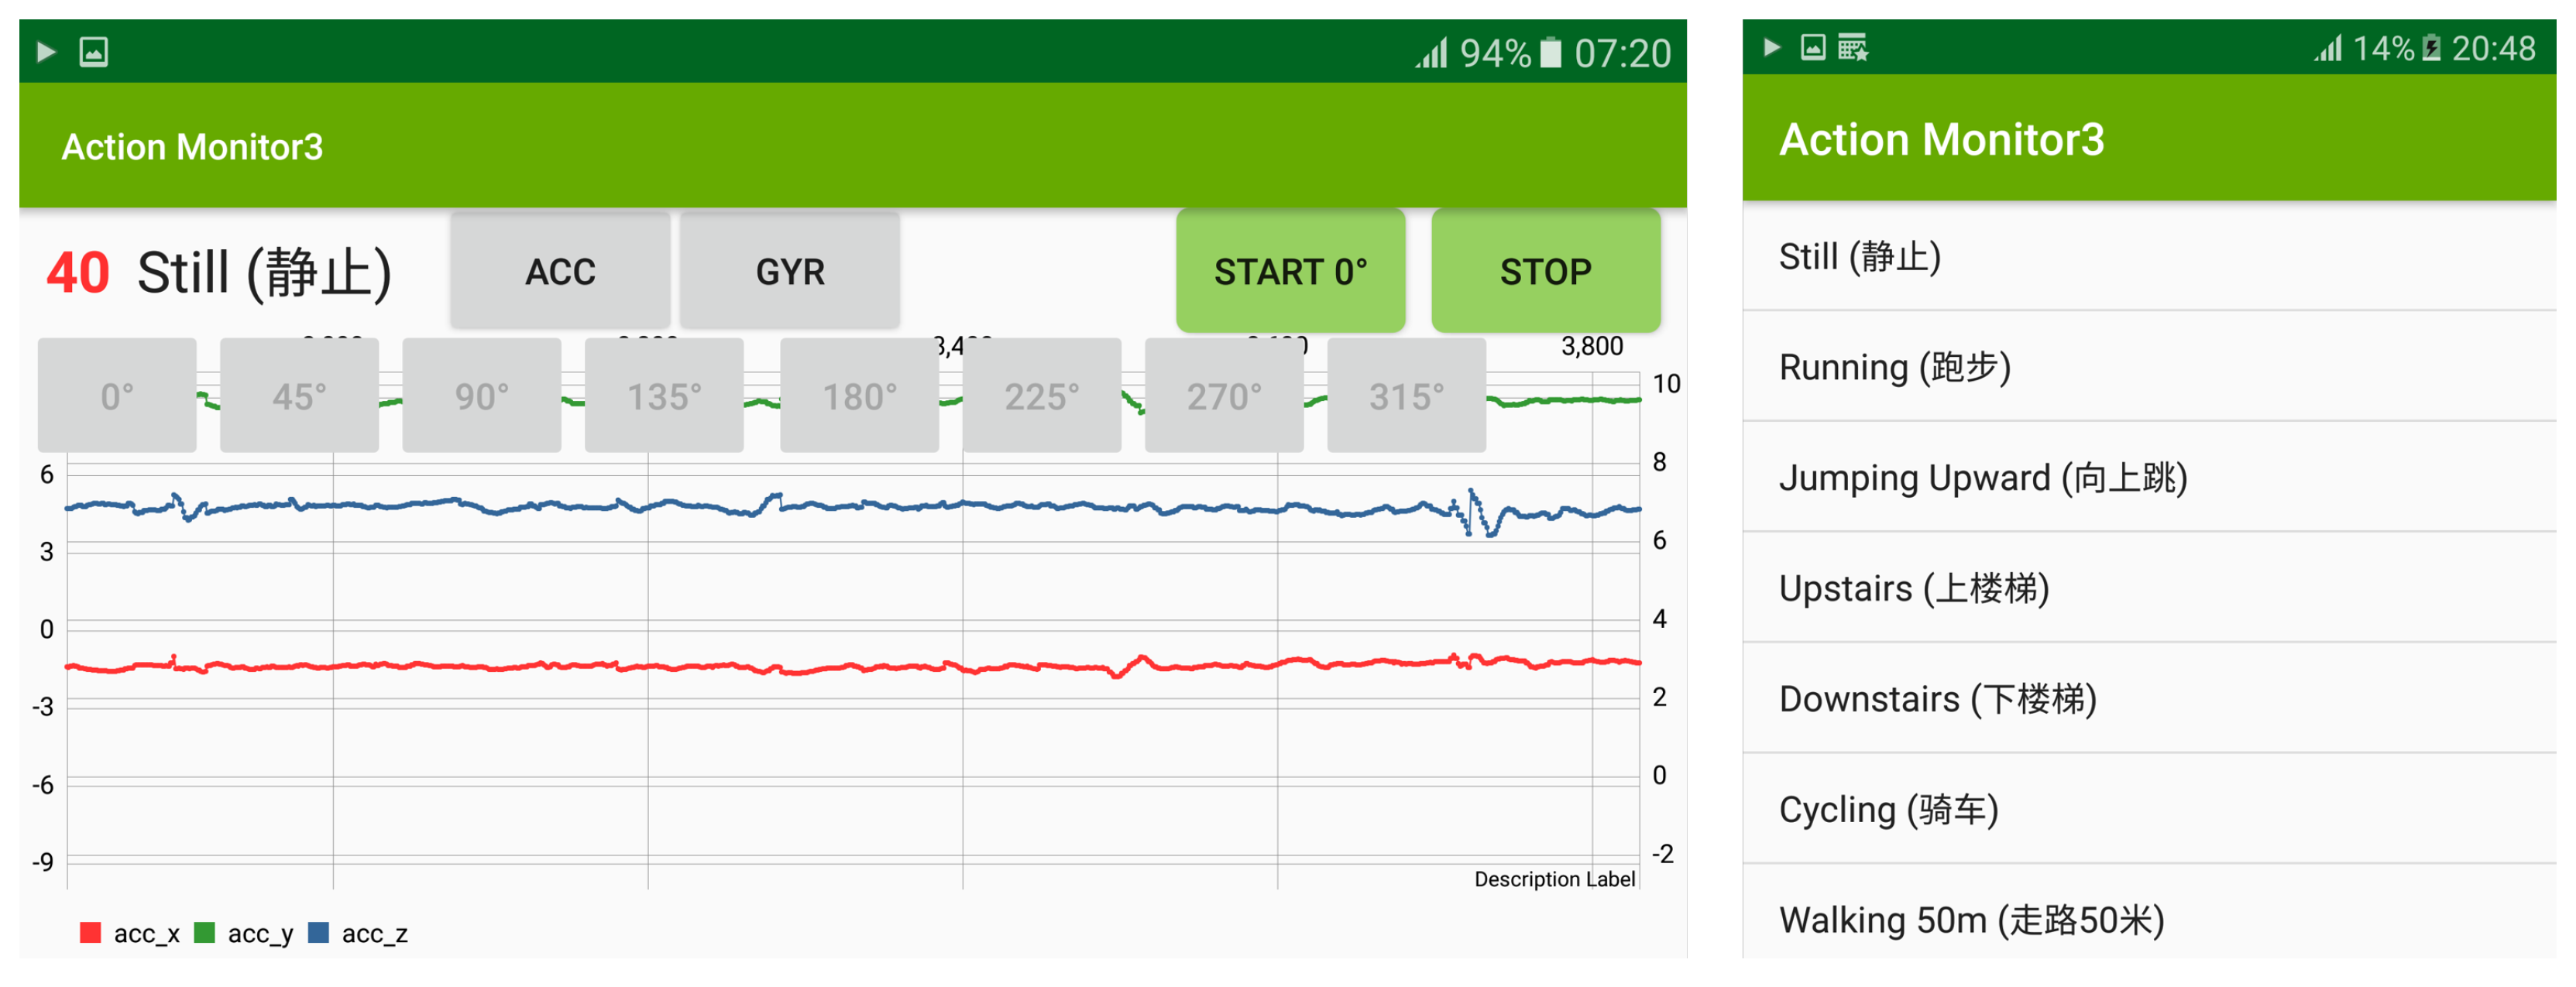
Our dataset was collected to overcome the limitations of publicly available datasets, which lack varied angle information. Data capture was conducted using a single mobile device equipped with an accelerometer and gyroscope and securely positioned on the participant’s midsection. The data were captured at a sampling rate of 1000 Hz and subsequently downsampled to 200 Hz. Our dataset was comprised of 31 college students who participated in seven daily activities (Still, Running, Jumping Upward, Upstairs, Downstairs, Cycling, and Walking 50 m). Our data collection platform is shown in Figure 2 as per our prescribed sequence, all while carrying the data-capturing devices. The distribution of our dataset is visually depicted in Figure 3.
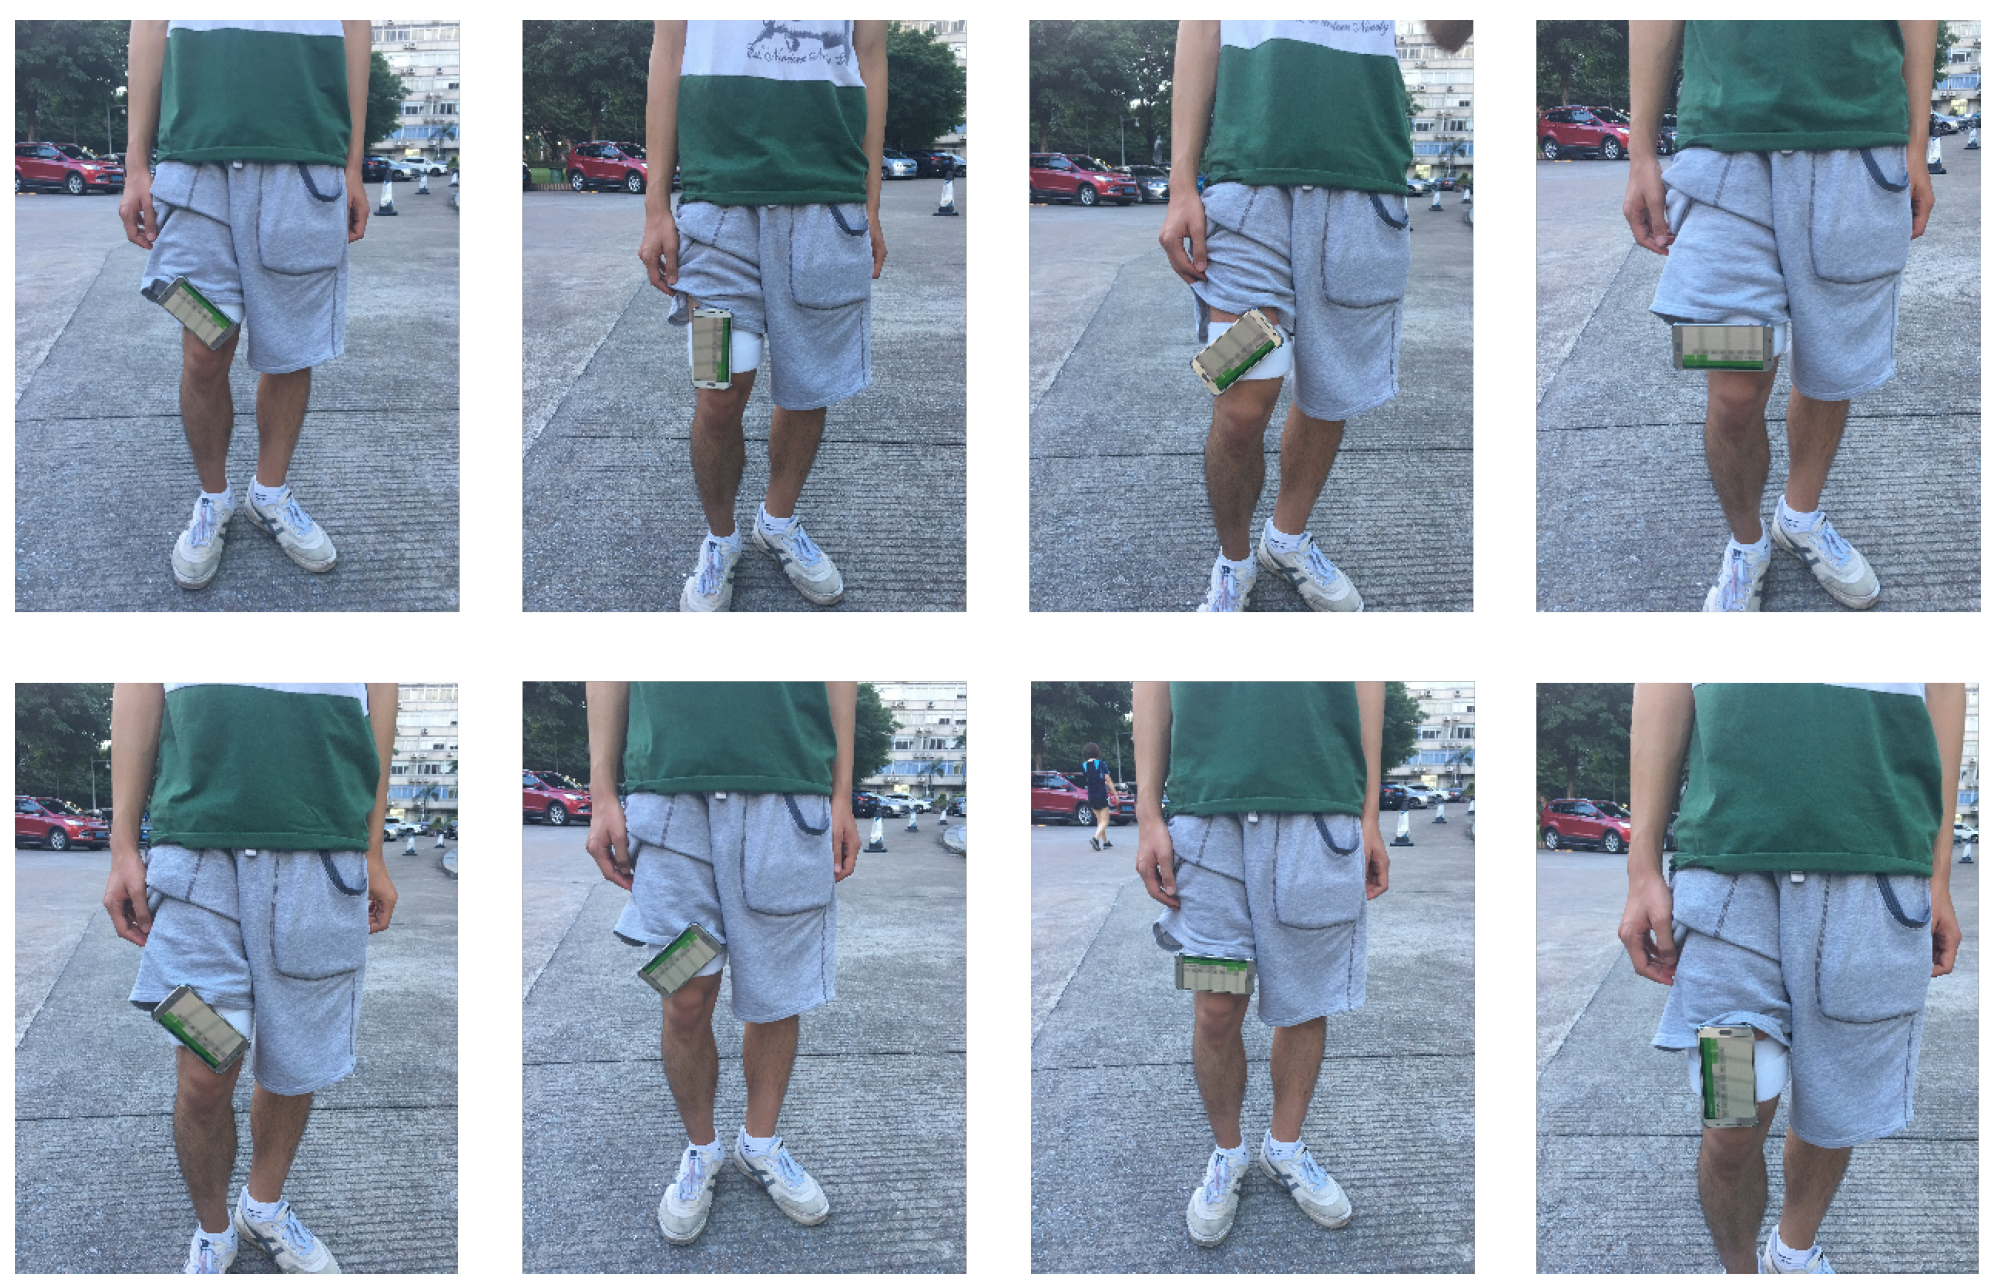
Participants were tasked with repeatedly performing these activities while carrying the fixed device at various angle orientations (0, 45, 90, 135, 180, 225, 270, and 315 degrees, as depicted in Figure 4) to collect accurate angular information. We divided the mobile device into eight orientations and fixed it to the front of the user’s thigh instead of freely placing it in the user’s pocket. After the data collection phase, our dataset was categorized into five distinct groups as outlined below: (a) ACC_0, representing data with only the accelerometer readings at the 0-degree angle; (b) ACC_All, representing data with accelerometer readings from all angles; (c) ACC+GYR_ALL (6D), representing data with accelerometer and gyroscope readings from all angles; (d) Fusioned (3D), representing data with accelerometer and gyroscope readings fused for all angles; and (e) ACC+GYR_ALL_Fusioned (9D), representing data with accelerometer and gyroscope readings fused for all angles and concatenated onto ACC+GYR_ALL.
The “ACC+GYR_ALL_Fusioned” feature requires further explanation. we integrated information from different sensors to provide more accurate estimates, with certain information being filtered or discarded. This information loss was typically used to address the uncertainties and noise associated with sensors. The accuracy and noise levels of the sensors directly impacts the performance of the fusion algorithm; if the accelerometer or gyroscope exhibits significant noise or inaccuracies, then the fused data may be affected by these issues as well. Combining these three types of data can help to comprehensively consider the device’s position, motion, and orientation information, thereby improving performance on motion recognition tasks. Such a combination offers a more holistic view of information, compensating for potential shortcomings in each sensor’s data.
After the waveform of the sensor data was analyzed, it was deduced that the cycles during participants’ motion lasted approximately 0.8 to 1.2 s. Figure 5 portrays an instance of a participant’s running waveform. Through careful adjustments, favorable results were obtained by employing a sliding window of 1.5 s with 50% overlapping.
3.1.2. WISDM [14]
The WISDM dataset was collected from accelerometer data of Android smartphones for use in activity recognition research. This dataset supports supervised learning tasks by monitoring users’ engagement in various daily activities such as walking, jogging, ascending/descending stairs, sitting, and standing. The data collection process involved users carrying Android smartphones and recording their acceleration data while performing specific daily activities. Before data collection, the research team obtained approval from the Institutional Review Board (IRB) of Fordham University due to the experimental nature involving human subjects and potential risks. Volunteer participants carried the smartphones in their front pants pockets during activities. For our task, we used raw data and set the sliding window to 80 (4 s).
3.1.3. UCI HAR [17]
In an experiment involving 30 volunteers aged between 19 and 48 years, six activities (walking, walking_upstairs, walking_downstairs, sitting, standing, laying) were performed while a Samsung Galaxy S II smartphone (Samsung Electronics, Suwon-si, Republic of Korea) was worn on the waist. The embedded accelerometer and gyroscope in the smartphone captured 3-axial linear acceleration and 3-axial angular velocity at a constant rate of 50 Hz. The dataset obtained from the experiments was randomly divided into two sets, with 70% of the volunteers used for generating the training data and 30% for the testing data.
To preprocess the sensor signals, noise filters were applied and the signals were sampled using a fixed-width sliding window of 2.56 s with a 50% overlap (128 readings per window). The sensor acceleration signal was then separated into body acceleration and gravity components using a Butterworth low-pass filter, assuming that the gravitational force has only low-frequency components. A filter with a cutoff frequency of 0.3 Hz was employed for this purpose. Finally, a feature vector was generated from each window by calculating variables from the time and frequency domains.
The details of the datasets and related settings are presented in Table 1.
3.2. Madgwick Algorithm
The Madgwick algorithm implementation incorporates magnetic distortion and gyroscope bias drift compensation [24]. This algorithm is based on quaternions, which effectively addresses the problem of attitude estimation in nonlinear systems while maintaining low computational demands and good real-time performance [44]. An object’s orientation is represented using a quaternion, denoted as
The unit quaternion is usually initialized as . The attitude adjustment gain parameter, denoted as , is used to control the fusion rate and noise compensation. Typically, it is set to a small positive value, e.g., .
To address the problem of device orientation change, data preprocessing was necessary. We preprocessed the accelerometer (acc) data and gyroscope (gyr) data, which included unit conversion and coordinate system adjustments. In addition, we aligned them with the coordinate system of the orientation quaternion q. The preprocessing of the magnetometer (mag) data, which we did not collect, made no difference.
The main steps of the Madgwick algorithm are as follows:
- a.
- Calculate the attitude update time step (), which depends on the update frequency of the attitude fusion.
- b.
- Update the orientation quaternion based on gyroscope measurements:where ⊗ denotes quaternion multiplication and , , represent the gyroscope’s 3-axial measurements.
- c.
- Correct the orientation quaternion using accelerometer and magnetometer measurements.
For this, first, the accelerometer and magnetometer measurements must be normalized to ensure that they are unit vectors:
where denotes the vector’s magnitude (length).
Next, the gravity’s reference direction needs to be calculated, which is derived from the current orientation quaternion q:
Then, the reference direction for the accelerometer and magnetometer is derived from the current orientation quaternion q and the normalized accelerometer and magnetometer measurements:
Next, it is necessary to calculate the error term error
where * denotes the quaternion’s conjugate.
Then, the cross-coupling term between the gyroscope and accelerometer is calculated:
along with the correction term correction:
Finally, the correction term correction is used to correct the rate of change of the orientation quaternion :
- d.
- Normalize the orientation quaternion q to ensure that it has a unit length of
The above steps are repeated while continuously updating the orientation quaternion q based on real-time sensor data in order to achieve attitude estimation.
3.3. Madgwick Algorithm Using Gradient Descent
In the Madgwick algorithm, quaternion-based rotation is used to correct the orientation. This involves constructing reference vectors based on accelerometer and magnetometer measurements, then correcting the difference between these vectors and the measured gravity vector [24,45]. As our dataset only included accelerometer and gyroscope sensors, gradient descent was used to minimize the error vector and update the quaternion values:
where f is a vector representing the error (residual). Equation (11) was used to calculate the difference between the current quaternion q and the accelerometer measurement. This error vector is the objective function of the gradient descent algorithm; we minimized this error through gradient descent. The Jacobian matrix j represents the partial derivatives of the error vector f with respect to the quaternion q. It describes how changes in the quaternion affect the error vector. During gradient descent, we updated the quaternion values in the direction of the negative gradient of the Jacobian matrix, gradually reducing the error.
Then, the direction of the quaternion update was calculated and normalized as follows:
where is the dot product between the transpose of the Jacobian matrix and the error vector, representing the direction of the quaternion update.
The gradient descent algorithm used here is an optimization method to minimize the objective function (in this case, the error vector) and find the variable values (in this case, the quaternion) that minimize the objective function. Gradient descent is an iterative method in which the values of the variables are updated in each iteration based on the gradient direction of the objective function in order to gradually approach the optimal solution.
3.4. Sensor Data Fusion
Applying the Madgwick algorithm to human activity recognition is not the novelty of this research; M. Zmitri et al. [46] used the Madgwick algorithm for feature extraction in their study. However, they extracted features such as the Euler angle (pitch, yaw, roll) features and quaternion features. In contrast, this study is based on extracting quaternion features and further integrating quaternion features with raw accelerometer data, effectively transforming accelerometer data into inertial acceleration data. The fusion process is shown in Figure 6. The advantage of this approach is that it utilizes the physical significance of the sensor data. The pseudocode for the algorithm is shown in Algorithm 1.
| Algorithm 1 Pseudocode for transforming accelerometer data into inertial acceleration. |
|
3.5. Optimized ResNet-34
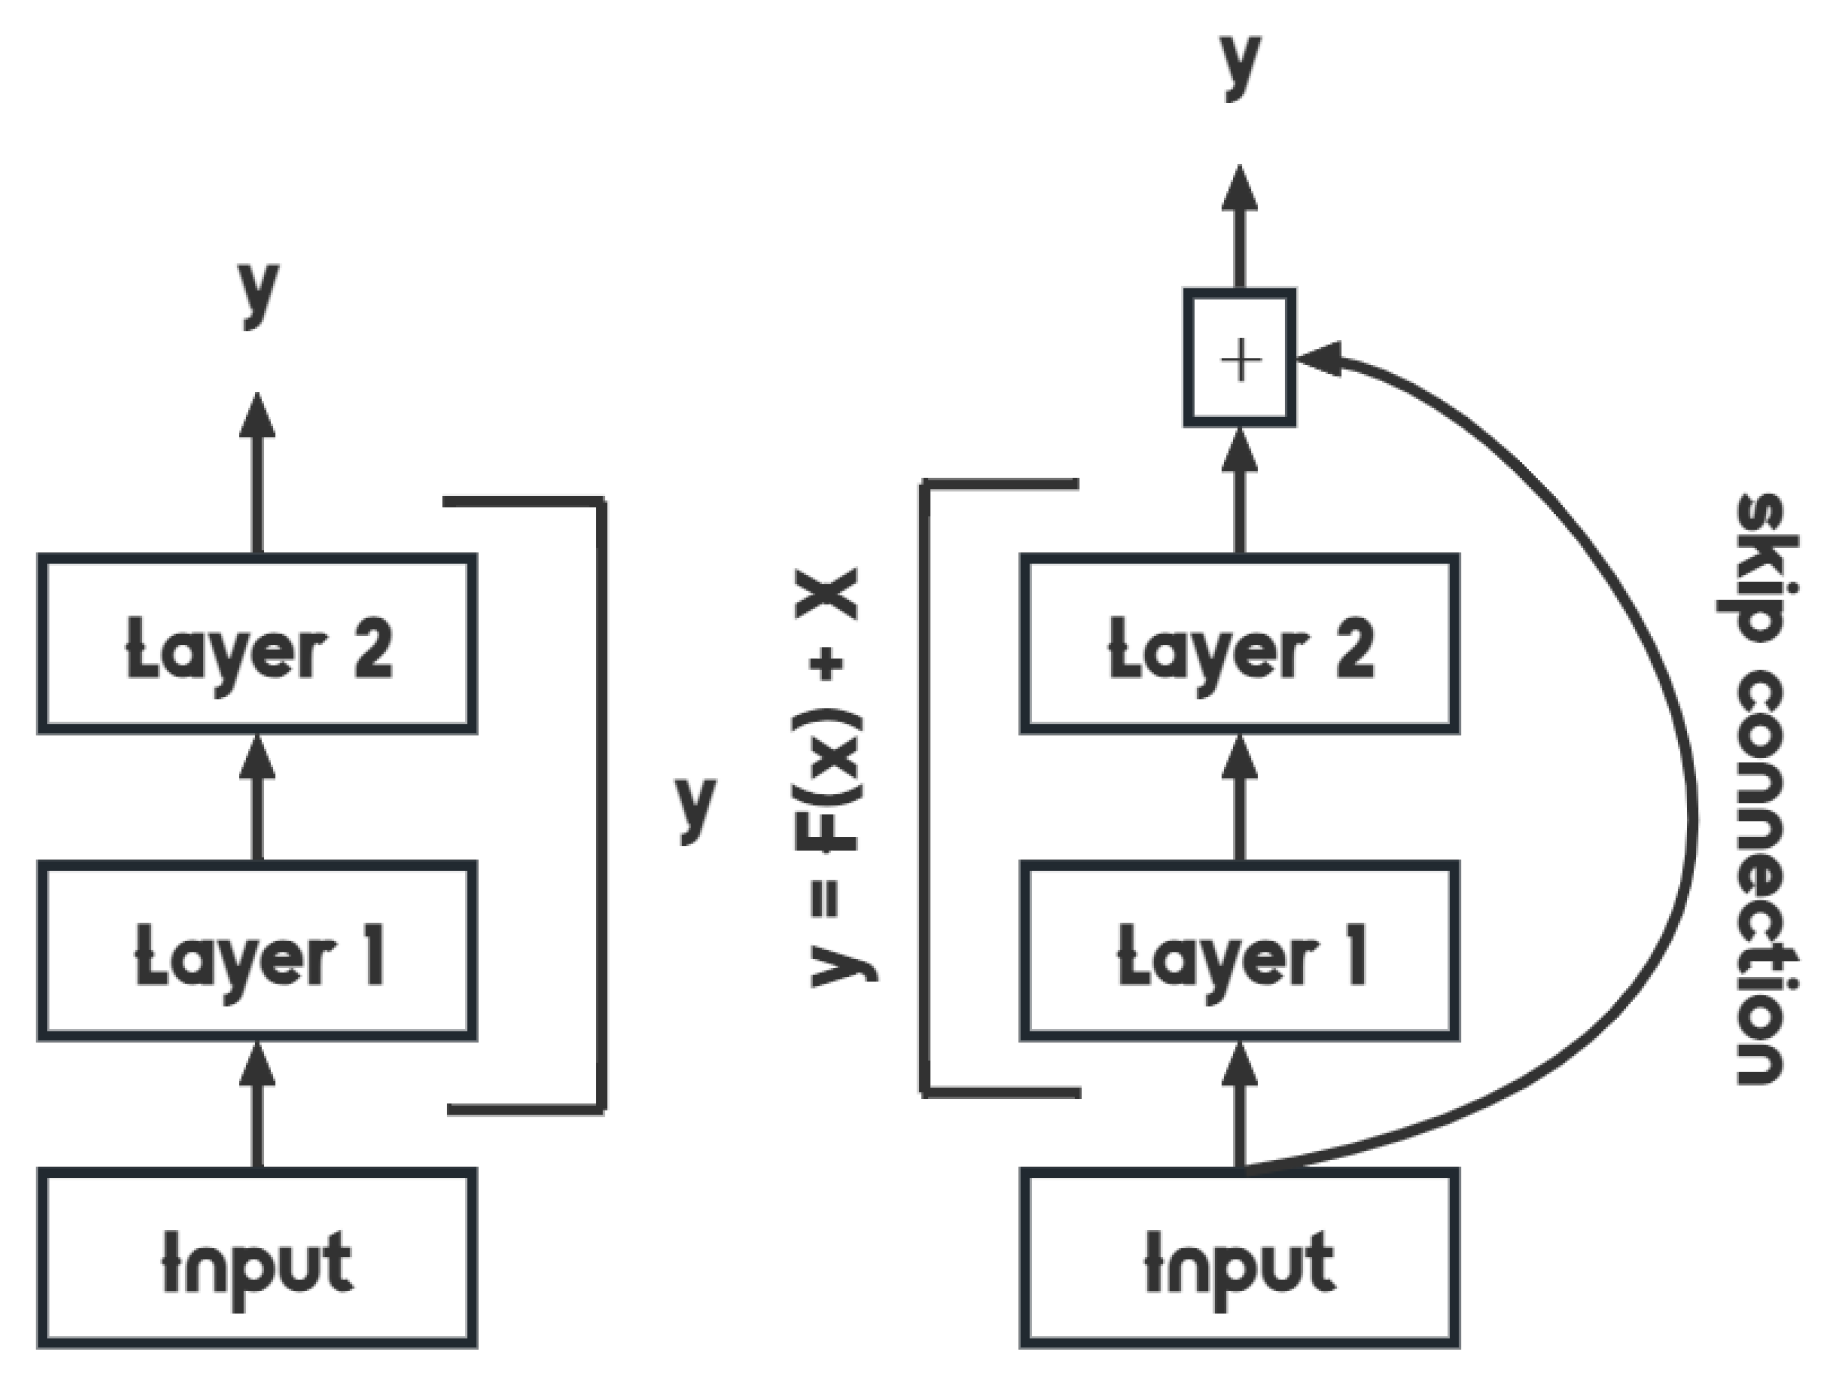
The residual building block forms the foundation of the ResNet-34 network, making up the majority of the network [47]. By incorporating a shortcut connection, the residual building block bypasses convolutional layers, effectively addressing the issue of gradient vanishing or exploding that can occur when neural networks become deeper. This approach allows for greater flexibility in constructing CNN structures, leading to improved recognition of daily human activities.
Figure 7 illustrates the layout of the fundamental unit, called the basic block, utilized for ResNet’s 34 layers. The residual building block encompasses convolutional layers (Conv), batch normalizations (BN), the rectified linear unit (ReLU) activation function, and a shortcut. The resulting output of the residual building block can be expressed as follows:
where F represents the residual function and x and y denote its input and output, respectively. The complete residual network is formed by combining the initial convolutional layer with multiple building blocks.
The typical ResNet-34 consists of 34 layers, including convolutional layers, batch normalization layers, activation functions, pooling layers, and a final fully connected layer for classification [48]. To enhance task adaptation, the ResNet-34 model was fine-tuned. A pooling layer, a flattening layer, three fully connected layers, and four dropout layers were incorporated after the final block. The output was produced through softmax. Table 2 illustrates the architecture of the model.
Additional layers were added to the original ResNet-34, primarily to reduce training instability, as discussed in Section 4. These added layers increase the complexity of the model, allowing it to capture more intricate patterns and representations within the input data. This enables the model to better distinguish between different human activities. The additional dropout layers help to mitigate overfitting by randomly dropping a fraction of neurons during training. This prevents the model from relying too heavily on specific neurons, which encourages the learning of more robust and generalizable features. The details of our model structure are shown in Figure 8.
4. Experimental Setup, Results, and Analysis
The evaluation indicators used in this experiment were accuracy, loss (sparse categorical cross-entropy), precision, and recall:
where TP (True Positive) represents the number of true positive samples, TN (True Negative) represents the number of true negative samples, FP (False Positive) represents the number of false positive samples, and FN (False Negative) represents the number of false negative samples.
4.1. Stability Testing
We trained the following models and data groups separately using EarlyStopping, with the patience set to 5. Here, “epoch” represents the number of training rounds required to converge with the patience set to 5. Remarkable outcomes were achieved by ResNet, which facilitated the training of highly intricate networks while simultaneously maintaining superior accuracy and quicker convergence speed compared to shallower networks [49].
Initially, the unaltered ResNet-34 architecture was chosen for the task. However, upon further observation it was determined that its effectiveness was unsatisfactory, as illustrated in Figure 9. The accuracy reached only 90.64%, with a loss of 0.3189. This discrepancy was attributed to substantial training oscillations, leading to challenging convergence that deviated from our expectations.
In comparison, as illustrated in Figure 10, the accuracy of the optimized ResNet-34 surged to 96.08%, with a loss of 0.1379. This modified configuration facilitated smoother convergence, aligning with our anticipated results. Next, we amalgamated data from all angles and applied the Madgwick algorithm to our dataset. This refinement resulted in an even flatter training curve, which propelled the validation accuracy to an impressive 96.65% and reduced the loss to 0.1475, as shown in Figure 11. This outcome highlights that the challenge posed by device angle change can be significantly mitigated through the synergistic fusion of accelerometer and gyroscope data facilitated by the Madgwick Algorithm. The confusion matrix is shown in Figure 12.
4.2. Deep Learning Baseline Analysis
In light of the potential randomness associated with single training, we opted for a five-fold cross-validation approach, utilizing the KFold method for experimentation. Three deep-learning baseline models were used for comparison. The results are detailed in Table 3.
The device angle change problem has a significant impact on the accuracy of human motion recognition. Upon comparing the first two columns of Table 3, namely, ACC_0 and ACC_All, noticeable trends emerge. When MLP was utilized, the accuracy decreased from 86.93% to 82.42%; similarly, employing CNN-2D resulted in a decrease from 91.25% to 89.62%. In the case of ResNet-34, despite observable fluctuations (the five-fold cross-validation accuracy and loss and the average confusion matrix are shown in Figure 13), the average accuracy declined from 92.08% to 91.14%.
The utilization of the optimized ResNet-34 resulted in an elevation in accuracy from 95.83% to 96.24%, showcasing minimal impact. This effect can be attributed to the greater volume of training data, enabling deeper networks to more comprehensively capture data features in the past.
As shown in the last row of Table 3, the optimized ResNet-34 outperformed other baselines; as model complexity increased, the influence of the angles gradually diminished and the accuracy remained steady at around 96%. After fusion, ResNet-34 and optimized ResNet-34 exhibited comparable results.
The performance of the MLP (Multi-Layer Perceptron) with the fused data was not as satisfactory as expected. The accuracy decreased from 87.49% to 80.12%. This decline in performance can be attributed to the fact that the fused data lose some of the original information that is advantageous for classification. Therefore, we concatenated the original data with the fused data, which proved effective (e.g., CNN-2D was marked by its highest result of 92.25%). The optimal outcome was demonstrated by the optimized ResNet-34, which achieved an accuracy of 97.13%. Details on its accuracy and loss per fold are shown in Figure 14.
4.3. User-Independent Analysis
To thoroughly validate the effectiveness of our approach in practical applications (i.e., ensuring accurate predictions when dealing with new user data), we divided the dataset containing 31 participants into distinct user groups at a ratio of 21:5:5. Specifically, 21 users were selected for the training set, five for the validation set, and an additional five for the test set. Table 4 shows the results.
Comparing the results from Table 3 and Table 4, it can be observed that there is no a significant difference in accuracy between MLP and CNN-2D. This observation was obtained after different users were divided into training, validation, and test sets and the results were compared to the dataset without user-specific divisions. The optimized ResNet-34 model showed a slight decrease in performance compared to the previous results; nevertheless, it remained the best-performing model, with an accuracy of 95.65%. A detailed comparison of the results is presented in Figure 15, where the solid lines represent user-independent data and the dashed lines represent user-dependent data.
Table 5 provides a detailed comparison between ResNet-34 and the optimized ResNet-34 on Fusioned (9D), including accuracy, loss, precision, recall, F1 score, and training time.
4.4. Analysis on Publicly Available Datasets
To further validate the generalization performance of both the fusion algorithm and the models, we conducted experiments on two major publicly available datasets, namely, WISDM and UCI HAR. The experimental outcomes are illustrated in Table 6.
As shown in Table 6, ResNet-34 outperformed CNN and MLP. On WISDM, the accuracy of the optimized ResNet-34 model was 96.33%, a 0.99% improvement from ResNet-34. On UCI HAR (12D), the accuracy of the optimized ResNet-34 model reached 92.08%, surpassing ResNet-34 (91.89%) and outperforming the non-fused approach (90.80%). Comparing the results on UCI HAR, UCI HAR (6D), and UCI HAR (12D), it is evident that simply fusing accelerometer and gyroscope data led to a slight decrease in accuracy; however, when employing the fused data as input features and concatenating these data with the original data, the performance surpassed that with the original data. This underscores the fusion algorithm’s capability to mitigate the device angle change problem.
5. Conclusions
In this paper, we collected a dataset by capturing varied angle information in order to overcome the limitations of publicly available datasets. The data collection process used a mobile device with accelerometer and gyroscope sensors, followed by a number of preprocessing steps. The dataset was categorized into groups based on sensor readings and angle orientations. We then compared the performance of the original ResNet-34 architecture with an optimized version. The optimized model showed improved convergence and accuracy. Next, we applied the Madgwick algorithm to fuse accelerometer and gyroscope data from different angles, resulting in smoother training curves and increased accuracy. Our results highlight the fusion algorithm’s effectiveness in mitigating the impact of the device angle change problem. Our approach was further validated on the publicly available WISDM and UCI HAR datasets. The results demonstrated the generalization performance of our approach, showcasing its effectiveness in different scenarios and on different datasets.
Author Contributions
Methodology, Z.H. and Y.S.; Software 1.0, Y.S.; Writing—original draft, Y.S.; Writing—review & editing, Z.H.; Project administration, Z.H. and Z.Z. All authors have read and agreed to the published version of the manuscript.
Funding
This work was supported by the Key Laboratory for Smart Education of the Guangdong Higher Education Institutes, Jinan University (2022LSYS003). The authors would like to express their great thanks to the data collection volunteers.
Institutional Review Board Statement
Not applicable.
Informed Consent Statement
Not applicable.
Data Availability Statement
Publicly available datasets were analyzed in this study. The WISDM data can be found at https://www.cis.fordham.edu/wisdm/dataset.php. The UCI HAR data can be found here at https://archive.ics.uci.edu/dataset/240/human+activity+recognition+using+smartphones. The private datasets presented in this article are not readily available because the data are part of an ongoing study. Requests to access the datasets should be directed to [email protected].
Conflicts of Interest
The authors declare no conflicts of interest.
References
- Dang, L.M.; Min, K.; Wang, H.; Piran, M.J.; Lee, C.H.; Moon, H. Sensor-based and vision-based human activity recognition: A comprehensive survey. Pattern Recognit. 2020, 108, 107561. [Google Scholar] [CrossRef]
- Wang, Y.; Cang, S.; Yu, H. A survey on wearable sensor modality centred human activity recognition in health care. Expert Syst. Appl. 2019, 137, 167–190. [Google Scholar] [CrossRef]
- Nguyen, L.N.N.; Rodríguez-Martín, D.; Català, A.; Pérez-López, C.; Samà, A.; Cavallaro, A. Basketball activity recognition using wearable inertial measurement units. In Proceedings of the XVI International Conference on Human Computer Interaction, New York, NY, USA, 7–9 September 2015; pp. 1–6. [Google Scholar] [CrossRef]
- Al-Nawashi, M.; Al-Hazaimeh, O.M.; Saraee, M. A novel framework for intelligent surveillance system based on abnormal human activity detection in academic environments. Neural Comput. Appl. 2017, 28, 565–572. [Google Scholar] [CrossRef] [PubMed]
- Bloom, V.; Makris, D.; Argyriou, V. G3D: A gaming action dataset and real time action recognition evaluation framework. In Proceedings of the 2012 IEEE Computer Society Conference on Computer Vision and Pattern Recognition Workshops, Providence, RI, USA, 16 July 2012; pp. 7–12. [Google Scholar] [CrossRef]
- Capela, N.; Lemaire, E.; Baddour, N.; Rudolf, M.; Goljar, N.; Burger, H. Evaluation of a smartphone human activity recognition application with able-bodied and stroke participants. J. Neuroeng. Rehabil. 2016, 13, 5. [Google Scholar] [CrossRef] [PubMed]
- Chen, K.; Zhang, D.; Yao, L.; Guo, B.; Yu, Z.; Liu, Y. Deep learning for sensor-based human activity recognition: Overview, challenges, and opportunities. Acm Comput. Surv. (Csur) 2021, 54, 1–40. [Google Scholar] [CrossRef]
- Romaissa, B.D. Vision-Based Human Activity Recognition: A Survey-Multimedia Tools and Applications; SpringerLink; Springer: Berlin/Heidelberg, Germany, 2020. [Google Scholar]
- Singh, T.; Vishwakarma, D.K. A deeply coupled ConvNet for human activity recognition using dynamic and RGB images. Neural Comput. Appl. 2021, 33, 469–485. [Google Scholar] [CrossRef]
- Mata, O.; Méndez, J.I.; Ponce, P.; Peffer, T.; Meier, A.; Molina, A. Energy savings in buildings based on image depth sensors for human activity recognition. Energies 2023, 16, 1078. [Google Scholar] [CrossRef]
- Franco, A.; Magnani, A.; Maio, D. A multimodal approach for human activity recognition based on skeleton and RGB data. Pattern Recognit. Lett. 2020, 131, 293–299. [Google Scholar] [CrossRef]
- Chung, S.; Lim, J.; Noh, K.J.; Kim, G.; Jeong, H. Sensor data acquisition and multimodal sensor fusion for human activity recognition using deep learning. Sensors 2019, 19, 1716. [Google Scholar] [CrossRef] [PubMed]
- Noori, F.M.; Riegler, M.; Uddin, M.Z.; Torresen, J. Human activity recognition from multiple sensors data using multi-fusion representations and CNNs. Acm Trans. Multimed. Comput. Commun. Appl. (Tomm) 2020, 16, 1–19. [Google Scholar] [CrossRef]
- Kwapisz, J.R.; Weiss, G.M.; Moore, S.A. Activity recognition using cell phone accelerometers. Acm Sigkdd Explor. Newsl. 2011, 12, 74–82. [Google Scholar] [CrossRef]
- Nan, Y.; Lovell, N.H.; Redmond, S.J.; Wang, K.; Delbaere, K.; van Schooten, K.S. Deep learning for activity recognition in older people using a pocket-worn smartphone. Sensors 2020, 20, 7195. [Google Scholar] [CrossRef]
- Maurer, U.; Smailagic, A.; Siewiorek, D.; Deisher, M. Activity recognition and monitoring using multiple sensors on different body positions. In Proceedings of the International Workshop on Wearable and Implantable Body Sensor Networks (BSN’06), Cambridge, MA, USA, 3–5 April 2006; pp. 4–116. [Google Scholar] [CrossRef]
- Anguita, D.; Ghio, A.; Oneto, L.; Parra, X.; Reyes-Ortiz, J.L. A public domain dataset for human activity recognition using smartphones. In Proceedings of the Esann, Bruges, Belgium, 24–26 April 2013; Volume 3, p. 3. [Google Scholar]
- Roggen, D.; Calatroni, A.; Rossi, M.; Holleczek, T.; Förster, K.; Tröster, G.; Lukowicz, P.; Bannach, D.; Pirkl, G.; Ferscha, A.; et al. Collecting complex activity datasets in highly rich networked sensor environments. In Proceedings of the 2010 Seventh International Conference on Networked Sensing Systems (INSS), Kassel, Germany, 15–18 June 2010; pp. 233–240. [Google Scholar] [CrossRef]
- Morales, J.; Akopian, D.; Agaian, S. Human activity recognition by smartphones regardless of device orientation. In Proceedings of the Mobile Devices and Multimedia: Enabling Technologies, Algorithms, and Applications 2014, San Francisco, CA, USA, 2 February 2014; Volume 9030, pp. 134–145. [Google Scholar] [CrossRef]
- Ito, C.; Cao, X.; Shuzo, M.; Maeda, E. Application of CNN for human activity recognition with FFT spectrogram of acceleration and gyro sensors. In Proceedings of the 2018 ACM International Joint Conference and 2018 International Symposium on Pervasive and Ubiquitous Computing and Wearable Computers, New York, NY, USA, 8 October 2018; pp. 1503–1510. [Google Scholar] [CrossRef]
- Fang, J.; Qin, J. Advances in atomic gyroscopes: A view from inertial navigation applications. Sensors 2012, 12, 6331–6346. [Google Scholar] [CrossRef]
- Desai, P.R.; Desai, P.N.; Ajmera, K.D.; Mehta, K. A review paper on oculus rift-a virtual reality headset. arXiv 2014, arXiv:1408.1173. [Google Scholar] [CrossRef]
- Chung, H.Y.; Hou, C.C.; Chen, Y.S. Indoor intelligent mobile robot localization using fuzzy compensation and Kalman filter to fuse the data of gyroscope and magnetometer. IEEE Trans. Ind. Electron. 2015, 62, 6436–6447. [Google Scholar] [CrossRef]
- Madgwick, S.O.; Harrison, A.J.; Vaidyanathan, R. Estimation of IMU and MARG orientation using a gradient descent algorithm. In Proceedings of the 2011 IEEE International Conference on Rehabilitation Robotics, Zurich, Switzerland, 11 August 2011; pp. 1–7. [Google Scholar] [CrossRef]
- Choukroun, D.; Bar-Itzhack, I.Y.; Oshman, Y. Novel quaternion Kalman filter. IEEE Trans. Aerosp. Electron. Syst. 2006, 42, 174–190. [Google Scholar] [CrossRef]
- Spinsante, S.; Angelici, A.; Lundström, J.; Espinilla, M.; Cleland, I.; Nugent, C. A mobile application for easy design and testing of algorithms to monitor physical activity in the workplace. Mob. Inf. Syst. 2016, 2016, 5126816. [Google Scholar] [CrossRef]
- Wang, Z.; Wu, D.; Gravina, R.; Fortino, G.; Jiang, Y.; Tang, K. Kernel fusion based extreme learning machine for cross-location activity recognition. Inf. Fusion 2017, 37, 1–9. [Google Scholar] [CrossRef]
- Sun, Z.; Ye, J.; Wang, T.; Huang, S.; Luo, J. Behavioral feature recognition of multi-task compressed sensing with fusion relevance in the Internet of Things environment. Comput. Commun. 2020, 157, 381–393. [Google Scholar] [CrossRef]
- Janidarmian, M.; Roshan Fekr, A.; Radecka, K.; Zilic, Z. A comprehensive analysis on wearable acceleration sensors in human activity recognition. Sensors 2017, 17, 529. [Google Scholar] [CrossRef]
- Nweke, H.F.; Teh, Y.W.; Alo, U.R.; Mujtaba, G. Analysis of multi-sensor fusion for mobile and wearable sensor based human activity recognition. In Proceedings of the International Conference on Data Processing and Applications, New York, NY, USA, 12 May 2018; pp. 22–26. [Google Scholar] [CrossRef]
- Saha, J.; Chowdhury, C.; Roy Chowdhury, I.; Biswas, S.; Aslam, N. An ensemble of condition based classifiers for device independent detailed human activity recognition using smartphones. Information 2018, 9, 94. [Google Scholar] [CrossRef]
- Li, S.; Song, W.; Fang, L.; Chen, Y.; Ghamisi, P.; Benediktsson, J.A. Deep learning for hyperspectral image classification: An overview. IEEE Trans. Geosci. Remote Sens. 2019, 57, 6690–6709. [Google Scholar] [CrossRef]
- Zhao, Z.Q.; Zheng, P.; Xu, S.t.; Wu, X. Object detection with deep learning: A review. IEEE Trans. Neural Netw. Learn. Syst. 2019, 30, 3212–3232. [Google Scholar] [CrossRef] [PubMed]
- Otter, D.W.; Medina, J.R.; Kalita, J.K. A survey of the usages of deep learning for natural language processing. IEEE Trans. Neural Netw. Learn. Syst. 2020, 32, 604–624. [Google Scholar] [CrossRef] [PubMed]
- Dara, S.; Tumma, P. Feature extraction by using deep learning: A survey. In Proceedings of the 2018 Second International Conference on Electronics, Communication and Aerospace Technology (ICECA), Coimbatore, India, 29–31 March 2018; pp. 1795–1801. [Google Scholar] [CrossRef]
- Sadouk, L. CNN approaches for time series classification. In Time Series Analysis-Data, Methods, and Applications; IntechOpen: London, UK, 2019; Volume 5, pp. 57–78. [Google Scholar]
- Cho, H.; Yoon, S.M. Divide and conquer-based 1D CNN human activity recognition using test data sharpening. Sensors 2018, 18, 1055. [Google Scholar] [CrossRef] [PubMed]
- Lee, S.M.; Yoon, S.M.; Cho, H. Human activity recognition from accelerometer data using Convolutional Neural Network. In Proceedings of the 2017 IEEE International Conference on Big Data and Smart Computing (bigcomp), Jeju, Republic of Korea, 13–16 February 2017; pp. 131–134. [Google Scholar] [CrossRef]
- Xi, R.; Hou, M.; Fu, M.; Qu, H.; Liu, D. Deep dilated convolution on multimodality time series for human activity recognition. In Proceedings of the 2018 International Joint Conference on Neural Networks (IJCNN), Rio de Janeiro, Brazil, 8–13 July 2018; pp. 1–8. [Google Scholar] [CrossRef]
- Shu, X.; Yang, J.; Yan, R.; Song, Y. Expansion-squeeze-excitation fusion network for elderly activity recognition. IEEE Trans. Circuits Syst. Video Technol. 2022, 32, 5281–5292. [Google Scholar] [CrossRef]
- Ronald, M.; Poulose, A.; Han, D.S. iSPLInception: An inception-ResNet deep learning architecture for human activity recognition. IEEE Access 2021, 9, 68985–69001. [Google Scholar] [CrossRef]
- Mekruksavanich, S.; Jitpattanakul, A.; Sitthithakerngkiet, K.; Youplao, P.; Yupapin, P. Resnet-se: Channel attention-based deep residual network for complex activity recognition using wrist-worn wearable sensors. IEEE Access 2022, 10, 51142–51154. [Google Scholar] [CrossRef]
- Yan, Z.; Younes, R.; Forsyth, J. ResNet-Like CNN Architecture and Saliency Map for Human Activity Recognition. In Proceedings of the International Conference on Mobile Computing, Applications, and Services, Cham, Switzerland, 24 March 2022; Volume 434, pp. 129–143. [Google Scholar] [CrossRef]
- Cavallo, A.; Cirillo, A.; Cirillo, P.; De Maria, G.; Falco, P.; Natale, C.; Pirozzi, S. Experimental comparison of sensor fusion algorithms for attitude estimation. Ifac Proc. Vol. 2014, 47, 7585–7591. [Google Scholar] [CrossRef]
- Wilson, S.; Eberle, H.; Hayashi, Y.; Madgwick, S.O.; McGregor, A.; Jing, X.; Vaidyanathan, R. Formulation of a new gradient descent MARG orientation algorithm: Case study on robot teleoperation. Mech. Syst. Signal Process. 2019, 130, 183–200. [Google Scholar] [CrossRef]
- Zmitri, M.; Fourati, H.; Vuillerme, N. Human activities and postures recognition: From inertial measurements to quaternion-based approaches. Sensors 2019, 19, 4058. [Google Scholar] [CrossRef] [PubMed]
- He, K.; Zhang, X.; Ren, S.; Sun, J. Deep residual learning for image recognition. In Proceedings of the IEEE Conference on Computer Vision and Pattern Recognition, Las Vegas, NV, USA, 27–30 June 2016; pp. 770–778. [Google Scholar]
- Koonce, B. ResNet 34. In Convolutional Neural Networks with Swift for Tensorflow: Image Recognition and Dataset Categorization; Apress: Berkeley, CA, USA, 2021; pp. 51–61. ISBN 978–1–4842–6168–2. [Google Scholar] [CrossRef]
- Parvat, A.; Chavan, J.; Kadam, S.; Dev, S.; Pathak, V. A survey of deep-learning frameworks. In Proceedings of the 2017 International Conference on Inventive Systems and Control (ICISC), Coimbatore, India, 19–20 January 2017; pp. 1–7. [Google Scholar] [CrossRef]
Figure 1.
The main workflow of our HAR task.

Figure 2.
Data collection platform.

Figure 3.
The zero degree angle sample distributions of our dataset.

Figure 4.
The device angles from left to right, top to bottom are 315, 0, 45, 90, 135, 225, 270, 180.
Figure 4.
The device angles from left to right, top to bottom are 315, 0, 45, 90, 135, 225, 270, 180.

Figure 5.
A participant’s running waveform, including accelerometer (top) and gyroscope (bottom).

Figure 6.
The fusion procession of our method (green indicates fused data).

Figure 7.
A simple building block of ResNet-34.

Figure 8.
Our model structure.

Figure 9.
The accuracy (left) and loss (right) curve of ResNet-34.

Figure 10.
The accuracy (left) and loss (right) curve of the optimized ResNet-34.

Figure 11.
The accuracy (left) and loss (right) curve of the optimized ResNet-34 with data fusion.

Figure 12.
The confusion matrix of the optimized ResNet-34 with data fusion.

Figure 13.
Loss/accuracy per fold (top) and average confusion matrix (bottom) of ResNet-34 on ACC_0.
Figure 13.
Loss/accuracy per fold (top) and average confusion matrix (bottom) of ResNet-34 on ACC_0.

Figure 14.
Accuracy (left) and loss (right) per fold of the optimized ResNet-34 on 9D.

Figure 15.
Performance comparison with user-dependent and user-independent data.

Figure 16.
Training curves (top) and confusion matrix (bottom) of the ResNet-34 model.

Figure 17.
Training curves (top) and confusion matrix (bottom) of the optimized ResNet-34 model.


Table 1.
Datasets setup.
| Our Dataset | WISDM | UCI HAR | |
|---|---|---|---|
| Sample rate (Hz) | 200 | 20 | 50 |
| Subjects | 31 | 29 | 30 |
| Catagories | 7 | 6 | 6 |
| Window size | 300 | 80 | 256 |
| Stride | 150 | 40 | 128 |
| Overlap rate (%) | 50 | 50 | 50 |
Table 2.
The optimized ResNet-34 structure.
| Layer Name | 34-Layer | Output Size |
|---|---|---|
| conv1 | ||
| conv2_x | max pool, stride 2 | |
| conv3_x | ||
| conv4_x | ||
| conv5_x | ||
| average pooling, flatten, 64d fully connected , dropout | ||
| softmax |
Table 3.
User-dependent performance comparison based on five-fold cross-validation (Accuracy %).
| ACC_0 | ACC_All | 6D | 3D | 9D | |
|---|---|---|---|---|---|
| MLP | 86.93 | 82.42 | 87.49 | 80.12 | 86.57 |
| CNN-2D | 91.25 | 89.62 | 86.33 | 90.60 | 92.25 |
| ResNet-34 | 92.08 | 91.14 | 92.31 | 96.52 | 96.58 |
| Optimized ResNet-34 | 95.83 | 96.24 | 96.25 | 96.16 | 97.13 |
Note: The titles are explained in Section 3.1.1.
Table 4.
User-independent performance comparison of different models (Accuracy %).
| ACC_0 | ACC_ALL | 6D | 3D | 9D | |
|---|---|---|---|---|---|
| MLP | 86.89 | 84.04 | 88.35 | 80.68 | 88.19 |
| CNN-2D | 91.26 | 91.02 | 90.39 | 89.42 | 86.16 |
| ResNet-34 | 89.01 | 92.53 | 92.51 | 94.04 | 92.73 |
| Optimized ResNet-34 | 89.83 | 94.27 | 94.40 | 94.22 | 95.65 |
Table 5.
User-independent performance comparison of ResNet-34 and optimized ResNet-34 on Fusioned (9D).
Table 5.
User-independent performance comparison of ResNet-34 and optimized ResNet-34 on Fusioned (9D).
| ResNet-34 | Optimized ResNet-34 | |
|---|---|---|
| Accuracy | 92.73% | 95.65% |
| Loss | 0.6749 | 0.5254 |
| Precision | 0.9343 | 0.9587 |
| Recall | 0.9273 | 0.9565 |
| F1 Score | 0.9281 | 0.9568 |
| Training Time | 10636 | 12798s |
Table 6.
Ablation studies on two publicly available datasets: WISDM and UCI HAR (Accuracy %).
| WISDM | UCI HAR | UCI HAR (6D) | UCI HAR (12D) | |
|---|---|---|---|---|
| MLP | 87.30 | 87.41 | 74.65 | 75.60 |
| CNN-2D | 94.23 | 88.09 | 78.25 | 90.60 |
| ResNet-34 | 95.34 | 90.34 | 89.48 | 91.89 |
| Optimized ResNet-34 | 96.33 | 90.80 | 87.13 | 92.06 |
Note: WISDM encompasses data from three-axis accelerometer sensors, while UCI HAR comprises data from three sensors: total_acc, body_acc, and body_gyr. Employing the Madgwick algorithm, we fused the body_acc and body_gyr components. In this context, UCI HAR (6D) signifies the combined data, while UCI HAR (12D) denotes the concatenation of the fused data with the original UCI HAR dataset.
Disclaimer/Publisher’s Note: The statements, opinions and data contained in all publications are solely those of the individual author(s) and contributor(s) and not of MDPI and/or the editor(s). MDPI and/or the editor(s) disclaim responsibility for any injury to people or property resulting from any ideas, methods, instructions or products referred to in the content. |
© 2024 by the authors. Licensee MDPI, Basel, Switzerland. This article is an open access article distributed under the terms and conditions of the Creative Commons Attribution (CC BY) license (https://creativecommons.org/licenses/by/4.0/).
Share and Cite
MDPI and ACS Style
He, Z.; Sun, Y.; Zhang, Z. Human Activity Recognition Based on Deep Learning Regardless of Sensor Orientation. Appl. Sci. 2024, 14, 3637. https://0-doi-org.brum.beds.ac.uk/10.3390/app14093637
AMA Style
He Z, Sun Y, Zhang Z. Human Activity Recognition Based on Deep Learning Regardless of Sensor Orientation. Applied Sciences. 2024; 14(9):3637. https://0-doi-org.brum.beds.ac.uk/10.3390/app14093637
Chicago/Turabian StyleHe, Zhenyu, Yulin Sun, and Zhen Zhang. 2024. "Human Activity Recognition Based on Deep Learning Regardless of Sensor Orientation" Applied Sciences 14, no. 9: 3637. https://0-doi-org.brum.beds.ac.uk/10.3390/app14093637
Note that from the first issue of 2016, this journal uses article numbers instead of page numbers. See further details here.