Article

An Intelligent Detection and Classification Model Based on Computer Vision for Pavement Cracks in Complicated Scenarios

Emergency Science Research Institute, China Coal Research Institute CCRI, Beijing 100013, China
*
Author to whom correspondence should be addressed.
Submission received: 6 February 2024 / Revised: 27 March 2024 / Accepted: 28 March 2024 / Published: 29 March 2024
(This article belongs to the Special Issue Machine Learning for Structural Health Monitoring)

Abstract

:
With the extension of road service life, cracks are the most significant type of pavement distress. To monitor road conditions and avoid excessive damage, pavement crack detection is absolutely necessary and an indispensable part of road periodic maintenance and performance assessment. The development and application of computer vision have provided modern methods for crack detection, which are low in cost, less labor-intensive, continuous, and timely. In this paper, an intelligent model based on a target detection algorithm in computer vision was proposed to accurately detect and classify four classes of cracks. Firstly, by vehicle-mounted camera capture, a dataset of pavement cracks with complicated backgrounds that are the most similar to actual scenarios was built, containing 4007 images and 7882 crack samples. Secondly, the YOLOv5 framework was improved from the four aspects of the detection layer, anchor box, neck structure, and cross-layer connection, and thereby the network’s feature extraction capability and small-sized-target detection performance were enhanced. Finally, the experimental results indicated that the proposed model attained an AP of the four classes of 81.75%, 83.81%, 98.20%, and 92.83%, respectively, and a mAP of 89.15%. In addition, the proposed model achieved a 2.20% missed detection rate, representing a 6.75% decrease over the original YOLOv5. These results demonstrated the effectiveness and practicality of our proposed model in addressing the issues of low accuracy and missed detection for small targets in the original network. Overall, the implementation of computer vision-based models in crack detection can promote the intellectualization of road maintenance.

1. Introduction

Roads are essential infrastructure that significantly contribute to society and economic development. Due to the coupling effect of environment, traffic, design, construction, and other factors, the average life cycle of more than 92% of asphalt pavements in China at this stage is about 7 to 8 years [1]. During its life cycle, the pavement crack is one of the main types of distress [2]. Causes of cracks include material performance degradation, bad climate conditions (especially in winter), traffic volume and size (especially for overloading), etc. [3,4]. Cracks could be categorized according to their form, shape, size, and distribution. The Federal Highway Administration (FHWA) distress identification manual identifies seven types of cracks: transverse, wheelpath longitudinal, non-wheelpath longitudinal, block, alligator, edge, and reflection [5]. They can also be divided into transverse, longitudinal, block, alligator, reflection, and slippage [6]. Basically, the four main categories of cracks that can be detected in early pavement deterioration are transverse, longitudinal, block, and alligator [7,8].
The existence of pavement cracks will accelerate the deterioration of the pavement, and restoring these cracks can result in higher maintenance costs. Delays in maintenance cause the costs to increase with time [9]. If this neglect continues, as pavements crumble both pedestrians and vehicles will face a severe security concern. Therefore, cracks should be detected as soon as possible before spreading and causing accidents, and effective pavement crack detection methods should be applied periodically to help to improve pavement conditions while minimizing maintenance costs and maximizing the pavement lifecycle.
Initially, the method used in most cases is that in which qualified personnel use conventional survey forms and visually check, measure, and record the observed distress by walking along the roads, which is laborious and time consuming [5]. Moreover, the manual method is subjective and easily causes congestion, reduces mobility, and is full of safety concerns as well. To address the limitations of the manual method, many types of pavement distress detection equipment have been developed. Mobile vehicles with diverse sensors and data processing centers are the foundation of this equipment. In the 1990s, PathRunner, KOMATSU, and ZOYOM-RTM were conducted, respectively, in the United States, Japan, and China [10,11]. Over the years, three-dimensional (3D) methods utilizing laser scanning, ground penetrating radar (GPR), and unmanned aerial vehicles (UAVs) have been a hot spot for detecting 3D pavement characteristics like volume and depth. PaveVision3D, Pavemetrics, and RICOH are typical automated detection systems that apply 3D techniques [12,13]. For example, PaveVision3D can conduct a complete lane width distress detection survey at 1 mm resolution at a speed up to 100 KM/h [14]. However, these systems are not appropriate enough for practical daily usage because of the high cost and challenging maintenance requirements [15,16]. Consequently, there still remains a wide gap to meet the daily usage demands. New methods and tools are urgently needed to achieve the effective and efficient detection of pavement cracks.
Computer vision refers to the technology that uses cameras and computers instead of human eyes and brains to observe and analyze images and videos, realizing target identification, tracking, and measuring [17,18]. A long process has driven the development of computer vision, and algorithms have gone from simple neural networks to deep learning which has become the most widely used algorithm for performing image classification, detection, segmentation, and other related tasks in the present day [19,20,21]. Deep learning automates much of the feature extraction process and enables us to extract high-dimensional features from images with less manual intervention [22,23,24]. It also works well with large datasets and allows the further exploration of unstructured data [25]. These characteristics make deep learning a great advantage in a wide range of challenging situations.
The development and application of computer vision and deep-learning algorithms have provided modern methods to tackle the dilemma of crack detection, and many researchers have conducted various studies and achieved a good performance. A deep-learning-based method for crack detection was proposed in [26] where the result showed a superior performance when compared with existing hand-craft feature extraction methods. The researchers in reference [27] used a convolutional neural network (CNN) with three convolution layers, three pooling layers, and two fully connected layers to detect and classify the pavement crack. Similarly, Zhang et al. [28] proposed an efficient architecture based on CNN named CrackNet for detecting cracks on 3D asphalt surfaces. With the emergence of the you only look once (YOLO) network, two automated pavement crack analysis systems were presented based on the YOLOv2 and YOLOv3 framework, respectively, in [29,30]. Whereas in [31], three models based on a very deep convolutional network (VGGNet), GoogLeNet, and DenseNet were developed as classifiers, and the VGGNet with 19 layers achieved the highest level of performance among the three models. Maeda et al. [32,33] developed two road damage detection models based on the single shot multibox detector (SSD) algorithm and generative adversarial network (GAN), whose datasets were derived from smartphone images and artificial images, respectively. A computer vision model was proposed using the YOLOv5 algorithm for detecting and classifying pavement distress of nine classes in [34]; a sensor-based model has also been investigated in this study.
While researchers have made continuous progress in detecting and classifying cracks and other pavement distress based on deep learning, there are still some issues that need to be taken into consideration. In most studies, images in a dataset were captured parallel to the pavement, with the crack area occupying the majority of the image space and no background other than the pavement visible. Particularly, some studies used datasets that consist solely of images of cracks from a single category. However, pavements images in practical situations generally exhibit several cracks of various types, affected by illumination, shadows, and other objects that have an impact on crack detection. Regarding this aspect, the multi-target and multi-class detection of cracks with a complicated background remains a challenging task [35].
For dealing with this task, an intelligent model to detect cracks with a complicated background using an improved deep-learning network is proposed in this paper. The remainder of this paper is organized as follows. Section 2 provides a description of the built dataset of cracks, including image acquisition, image preprocessing, and crack distribution information, and the pavement crack detection model based on the improved deep-learning network is also elaborated in detail from four perspectives. A comparison of the experimental results for the original network and the proposed network is presented in Section 3. Section 4 compares the proposed method with previous related methods. Finally, the conclusion of this study is drawn in Section 5.

2. Materials and Methods

2.1. Dataset Description

2.1.1. Image Data Acquisition

The availability of large-scale labeled data is one of the important factors that contribute to the success of deep learning in the field of computer vision [36]. The dataset also determines the application effect of the trained model to a certain extent. The images used in this study were captured from video streams collected through experiments and online searching. The video streams taken from the moving vehicles should ensure that the pavement area is clearly visible in the center. Additionally, there were no fixed requirements for equipment and vehicles. In this study, cameras and driving recorders were used, as well as vehicles such as buses, cars, motorcycles, and bikes. In order to reduce repeat frames, video streams were intercepted at regular intervals. The regular interval can be determined by the following steps: (1) estimate the average speed of the vehicle; (2) estimate the average distance of visible pavement in a frame; (3) calculate the time for the vehicle to drive the distance; (4) choose the interval close to the time calculated in (3). In most cases, the regular interval was set at 0.2 s, 5 frames per second.

2.1.2. Dataset Introduction

The pavement structural layer is exposed to the atmosphere and affected by a multitude of natural forces during its service life [37]. Factors such as temperature, climatic conditions, and geographical location significantly influence the pavement performance and are extremely important in pavement design [38]. Pavement exhibits different damage development patterns under different circumstances [39]. As well, when it comes to images, uneven illumination, blurriness, shadows, occlusions, and other noise variables can also obscure target information and interfere with detection, leading to false alarms [40].
In this study, the aforementioned factors were thoroughly considered to enhance the realism of our dataset. Finally, the dataset comprised 4007 images with temperature ranging from −20 to 38 degrees Celsius, climate conditions covering the four seasons of spring, summer, autumn and winter, and regions including Beijing, Hebei, Shandong, Jilin, Zhejiang, the United States, Japan, etc. One more thing worth noting is that each image in the dataset has a background of varying complexity. Figure 1 shows examples of haze, bright light, rain, and shadow.
Some public crack datasets are available not only for pavement, but also for bridges and concrete buildings [41,42,43]. Examples of images obtained from the public crack dataset are shown in Figure 2.
In comparison with Figure 1, it is obvious that the cracks in Figure 2 are only partially visible, which means that it is impossible to classify the cracks based solely on the images. In addition to the difference in background, Figure 1 also provides an overview of the basic information and future trends of cracks, which is more helpful for road monitoring and maintenance. The crack dataset in this study is enriched by these factors and is therefore of greater value than others. In total, there are 7882 crack samples of four classes: transverse, longitudinal, block, and alligator. Table 1 provides the number of crack samples corresponding to a certain class.

2.1.3. Image Pre-Processing

The image pre-processing included the following steps. Figure 3 displays the intermediate outcome after applying each individual step on an example image.
(1) Grayscale processing is used in order to reduce unnecessary information for subsequent model training and crack detection;
(2) Contrast-limited adaptive histogram equalization was applied in this paper which can retain the bright areas’ information and solve the distortion and noise issues;
(3) Bilateral filtering is used in order to remove noise as much as possible and enhance contrast to highlight the crack features.

2.2. Proposed Methodology

To automatically and accurately detect various cracks by the computer vision method, the YOLOv5 network was chosen as our detector which is the most widely used object detection algorithm that can achieve high levels of average precision and speed. In particular, several improvements for the YOLOv5 network were implemented to enhance the network’s adaptability to complex application scenarios.

2.2.1. YOLOv5 Network

YOLO is the pioneering of one stage target detection algorithm [44]. Different from two-stage algorithms such as R-CNN and Faster R-CNN, YOLO directly regresses the location of objects and performs classification, thus accelerating the detection process [45,46]. YOLOv5 was developed by Ultralytics based on previous-generation networks such as YOLOv3 and YOLOv4 [47,48,49]. The most significant modification was that YOLOv5 integrated the anchor box selection process into the model and possessed the capability to automatically learn the most appropriate anchor boxes for the particular dataset under consideration [50]. In terms of feature extraction, the CSPDarkNet53 of YOLOv4 was modified to extract rich features, including Focus, Conv, C3, Bottleneck, and spatial pyramid pooling (SPP) modules [51]. For feature fusion, a feature pyramid network (FPN) and path aggregation network (PAN) were used to fuse features of different scales. The head of YOLOv5 was consistent with previous-generation networks of YOLO, which can provide the detector with large, medium, and small feature channels to predict small, medium, and large targets.
YOLOv5 was further divided into YOLOv5-Small (YOLOv5s), YOLOv5-Middle (YOLOv5m), YOLOv5-Large (YOLOv5l), and YOLOv5-ExtraLarge (YOLOv5x) through two ratio adjustment factors for the depth and width of the network. For the purpose of facilitating deployment and reducing calculations, this study was conducted based on YOLOv5s. The YOLOv5s network architecture is shown in Figure 4.

2.2.2. Improvement Methods

In order to be more suitable for cracks in our dataset, YOLOv5 has been enhanced in four aspects, and they are illustrated separately in the following sections.
  • 160 × 160 Detection Layer for Small Targets
There are three (20 × 20, 40 × 40, and 80 × 80) detection branches in the head of YOLOv5. In multi-scale detection, the larger the size of the feature map, the more conducive it is to extracting small target features. In this study, a small-target detection layer with size 160 × 160 was added into the original YOLOv5 framework in order to enhance the detection of small-sized cracks which are abundant in our dataset.
In YOLOv5, the original three branches are connected to the 3rd, 4th, and 5th feature layer, respectively. After improving, the new detection branch integrated the 2nd feature layer where shallow features generated into the feature fusion network.
2.
Anchor Box Update
The anchor box is the prior knowledge from the dataset. During the model training process, anchor boxes that are more closely matched to the dataset will assist the network with converging better and faster. The original anchor box of previous-generation networks such as YOLOv3 was set up for the COCO dataset and was not applicable to self-built datasets, the problem of which has been settled in YOLOv5 by introducing the K-means clustering algorithm to generate an adaptive anchor box automatically.
Considering that K-means convergence depends heavily on the cluster center’s initialization status, the K-means++ clustering algorithm was used to cluster the label boxes of crack dataset in this study. As much as possible, K-means++ could lead the randomly selected center point to a global optimal solution rather than a local optimal solution. The updated 12 anchor boxes are as follows: [15 39], [65 12], [44 49], [23 108], [169 19], [52 127], [84 82], [248 38], [103 146], [156 99], [179 189], [322 176].
3.
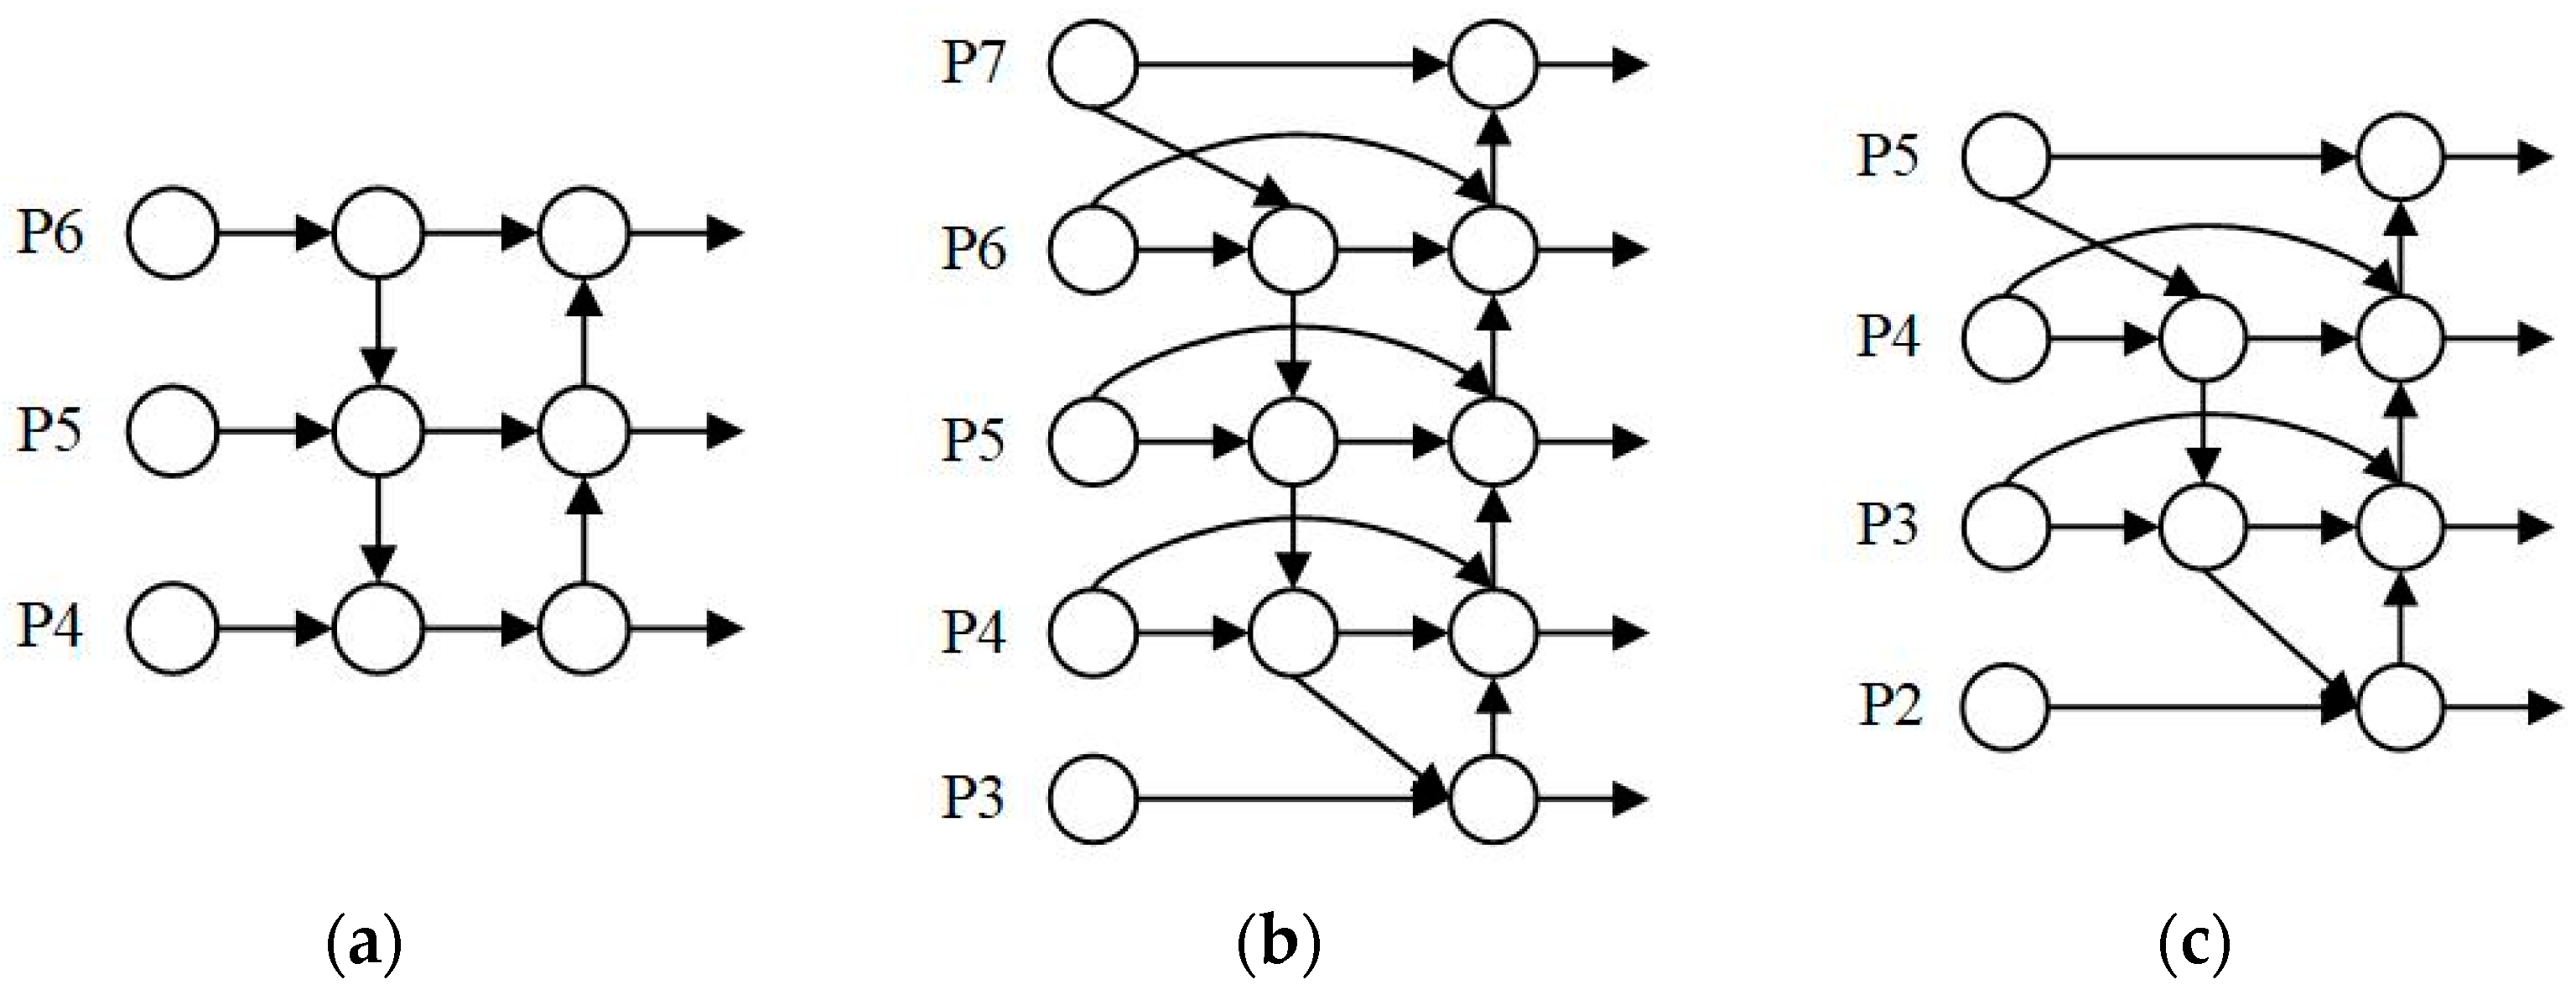
Improved Neck Structure Based on Bi-FPN
The neck structure of YOLOv5 consists of a feature pyramid network (FPN) and path aggregation network (PANet). This combination makes cross-layer connection and information aggregation possible. And while fusing the input feature maps that derived from different scales, YOLOv5 uses an equivalent weight strategy.
In this study, a bi-directional weighted feature pyramid network (Bi-FPN) was adopted. Bi-FPN was proposed by the Google team based on PANet, an extra path is added to fuse features in the feature extraction network and bottom-up path to realize cross-scale connections [52]. In addition, weighted feature fusion and a fast normalization method are introduced to distinguish the contribution of different feature maps, the employment of which achieves an adaptive balance for the process of network fusion. Figure 5 shows the neck structure design in this study.
4.
Improved Cross-Layer Connections
In this study, the feature maps of the YOLOv5 network were visualized and the hsv colormap was selected to scalar the grayscale data of feature maps to colors. Figure 6 displays the visualized feature maps generated by the feature extraction network of an example image, ranging from shallow to deep layers, and the red boxes in example image represent the crack area. It is obvious that shallow features contain more detailed crack information such as location, contour, color, etc.; on the contrary, deep features are more abstract and complex and mainly contribute to target classification. It is also clear that pavement cracks do not have strong semantic information, and shallow features are strong indicators in crack detection.
In the original YOLOv5 network, there is a connection between the 3rd feature layer and the 80 × 80 detection branch, and also between the 4th feature layer and the 40 × 40 detection branch, the 5th feature layer and the 20 × 20 detection branches. In this study, the cross-layer connections of the original three branches were upgraded to contact more shallow features into each detection scale. To be specific, the scales of 80 × 80, 40 × 40, and 20 × 20 were cross connected to the 2nd, 3rd, and 4th feature layers, respectively, through conv and downsampling.

2.2.3. The Overall Architecture of the Proposed Network Based on YOLOv5

As a result, the proposed network based on YOLOv5 has been completed with the four enhancements and its architecture is illustrated in Figure 7. It can be clearly seen that the network comprises four main sections, which are the backbone, neck structure based on Bi-FPN, detection head, and cross-layer connection. More specifically, the proposed network for crack detection can be described as follows.
Firstly, the backbone has five feature maps for different strides (P1, P2, P3, P4, P5) after 5 down-sampling operations, with Pj representing a stride of 2j; the bigger the strides, the smaller the extracted feature maps and the deeper the features. In the original YOLOv5 network, the P2 output is not taken to the subsequent network, while in our network, P2 plays a critical role in providing detailed features and spatial information for detecting small-sized cracks. Secondly, Bi-FPN aggregates the features extracted by the backbone and passes them to the head and optimizes the neck structure by removing two nodes with only one input, which helps to prevent crack information loss from the backbone, making our proposed network lighter and more efficient compared to the original YOLOv5. Then, the detection head generates predictions for crack detection from the updated anchor boxes, where smaller cracks require higher-resolution features and a greater number of anchor boxes. In this network, the added branch has a high resolution of 160 × 160 pixels, enabling the detection of cracks as small as 8 × 8 pixels, and the number of anchor boxes has been increased from 9 to 12. Lastly, the blue lines in the green part in Figure 7 represent the path of cross-layer connections. Different from the same level cross-layer connections, our proposed network concatenates feature maps from the lower level of the backbone, enabling the 80 × 80, 40 × 40, and 20 × 20 detection branches to also contain more shallow features related to cracks of various scales.
Overall, from the perspective of the network structure, the proposed network matches well with the dataset presented in this study, and is also conducive to enhancing the extraction of crack features, improving the accuracy of crack detection, and strengthening the sensitivity to small-sized cracks. Further experimental tests will be carried out in the upcoming section of this paper to verify the effectiveness of the proposed network architecture.

3. Experimental Results and Discussion

3.1. Experimental Environment and Settings

In this experiment, the crack dataset is divided into a training set, verification set, and test set according to the ratio of 0.75:0.15:0.1, where the training set is 3007 images, the verification set is 600 images, and the test set is 400 images. Table 2 shows the number of four classes of cracks in the test set.
An NVIDIA GTX 1080Ti GPU was used to satisfy the memory and speed requirements for model training and inferencing. During model training, batch_size was set to 64, epoch was set to 500, and periodic learning and warm-up were used to optimize the loss function with an initial learning rate of 0.01 and a weight decay of 0.0005. The training ends when the loss value stabilizes at 0.05, and the final weight is determined based on the weight of the last iterations. Then, the test set can be entered into the trained model to obtain the detection results.

3.2. Evaluation Indicators

The crack detection model was generated by the proposed network after several training cycles. In the field of object detection, there are a lot of indicators to assess different aspects of the model like accuracy, speed, and size. In this study, what we are most concerned about is the accuracy of the proposed model in crack detection. The average precision (AP) and mean average precision (mAP) are the two most used indicators to evaluate the accuracy of object detection models. AP can be calculated as Equation (1), and it takes the two indicators of precision and recall into consideration which can be calculated as Equations (2) and (3). Thus, AP can effectively evaluate the proposed model’s ability level to identify cracks, describe crack shapes with bounding boxes, and determine crack categories. mAP is the average AP of all categories and can be calculated as Equation (4). mAP comprehensively considers the accuracy of all crack categories, providing a more thorough evaluation of the proposed model’s performance.
Therefore, this paper selected AP to quantitatively evaluate the performance of the proposed model on a particular category of cracks and mAP to quantitatively evaluate the performance of the proposed model on the entire dataset.
A P = P r e c i s i o n N ( T o t a l I m a g e s )
p r e c i s i o n = T P T P + F P
r e c a l l = T P T P + F N
where TP, FP, and FN indicate the true positive, false positive, and false negative, respectively. The P-R curve is drawn based on the precision and recall values, and the integral under the P-R curve is the AP for the particular category.
m A P = A P N ( C l a s s e s )
In practical applications, it is more important to successfully detect cracks than to accurately describe cracks with bounding boxes. As part of our evaluation work, the model’s detection performance was further assessed using the missed detection rate and false detection rate which are widely adopted in engineering to avoid the error of bounding boxes. Their calculation expressions are shown in Equations (5) and (6).
missed   detection   rate = F N T P + F N
false   detection   rate = F P T N + F P
where TP, FP, TN and FN indicate the true positive, false positive, true negative, and false negative, respectively.

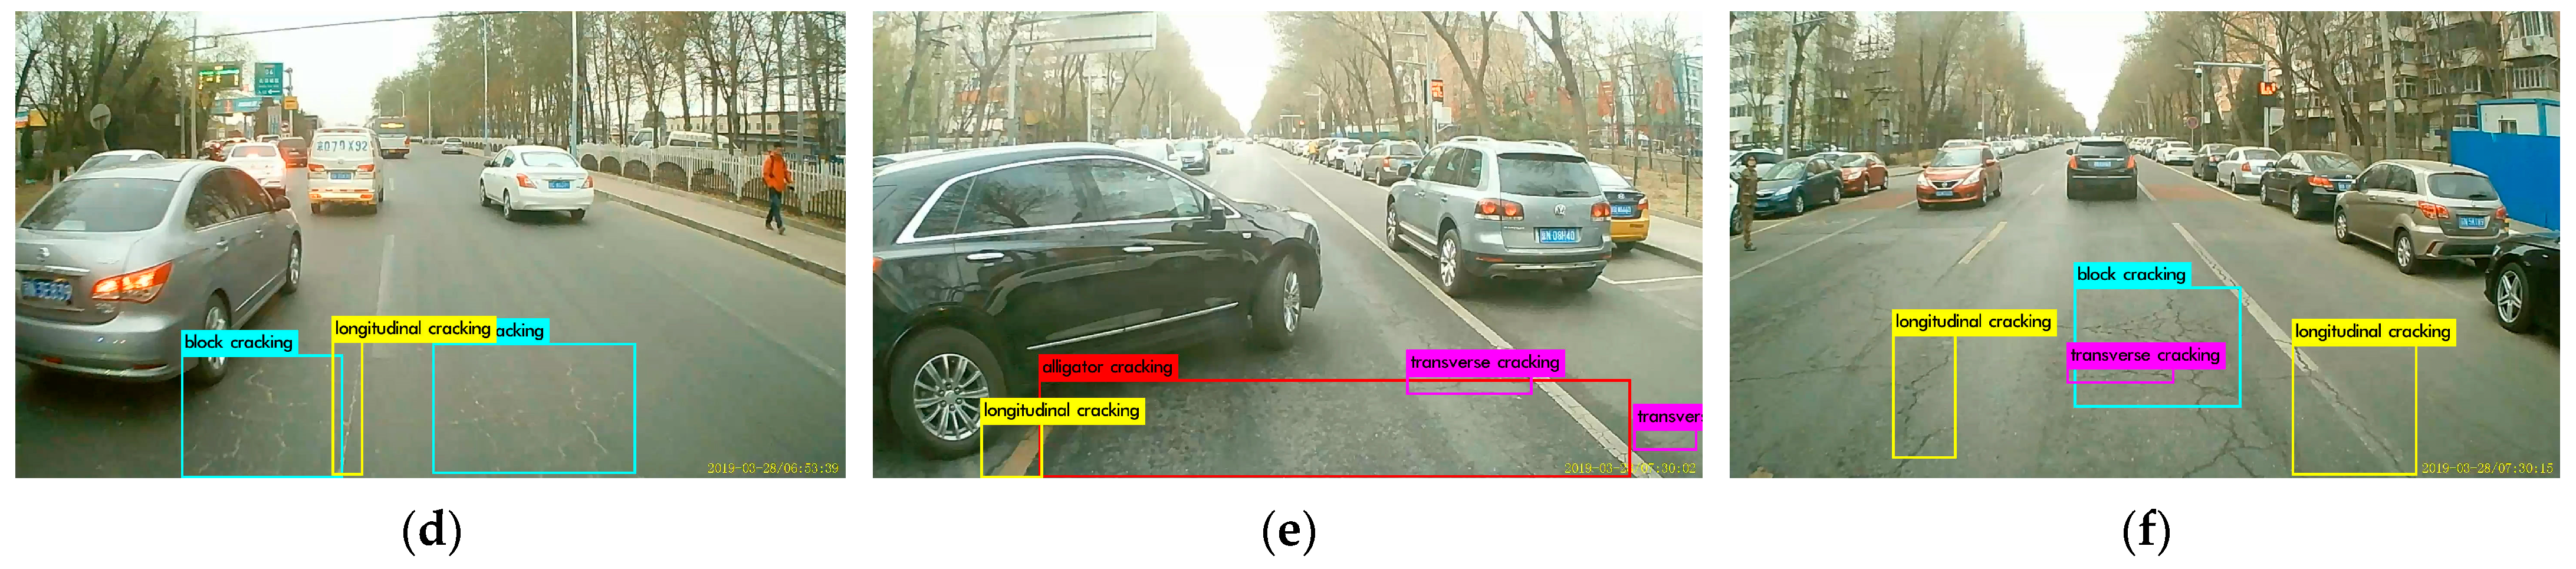
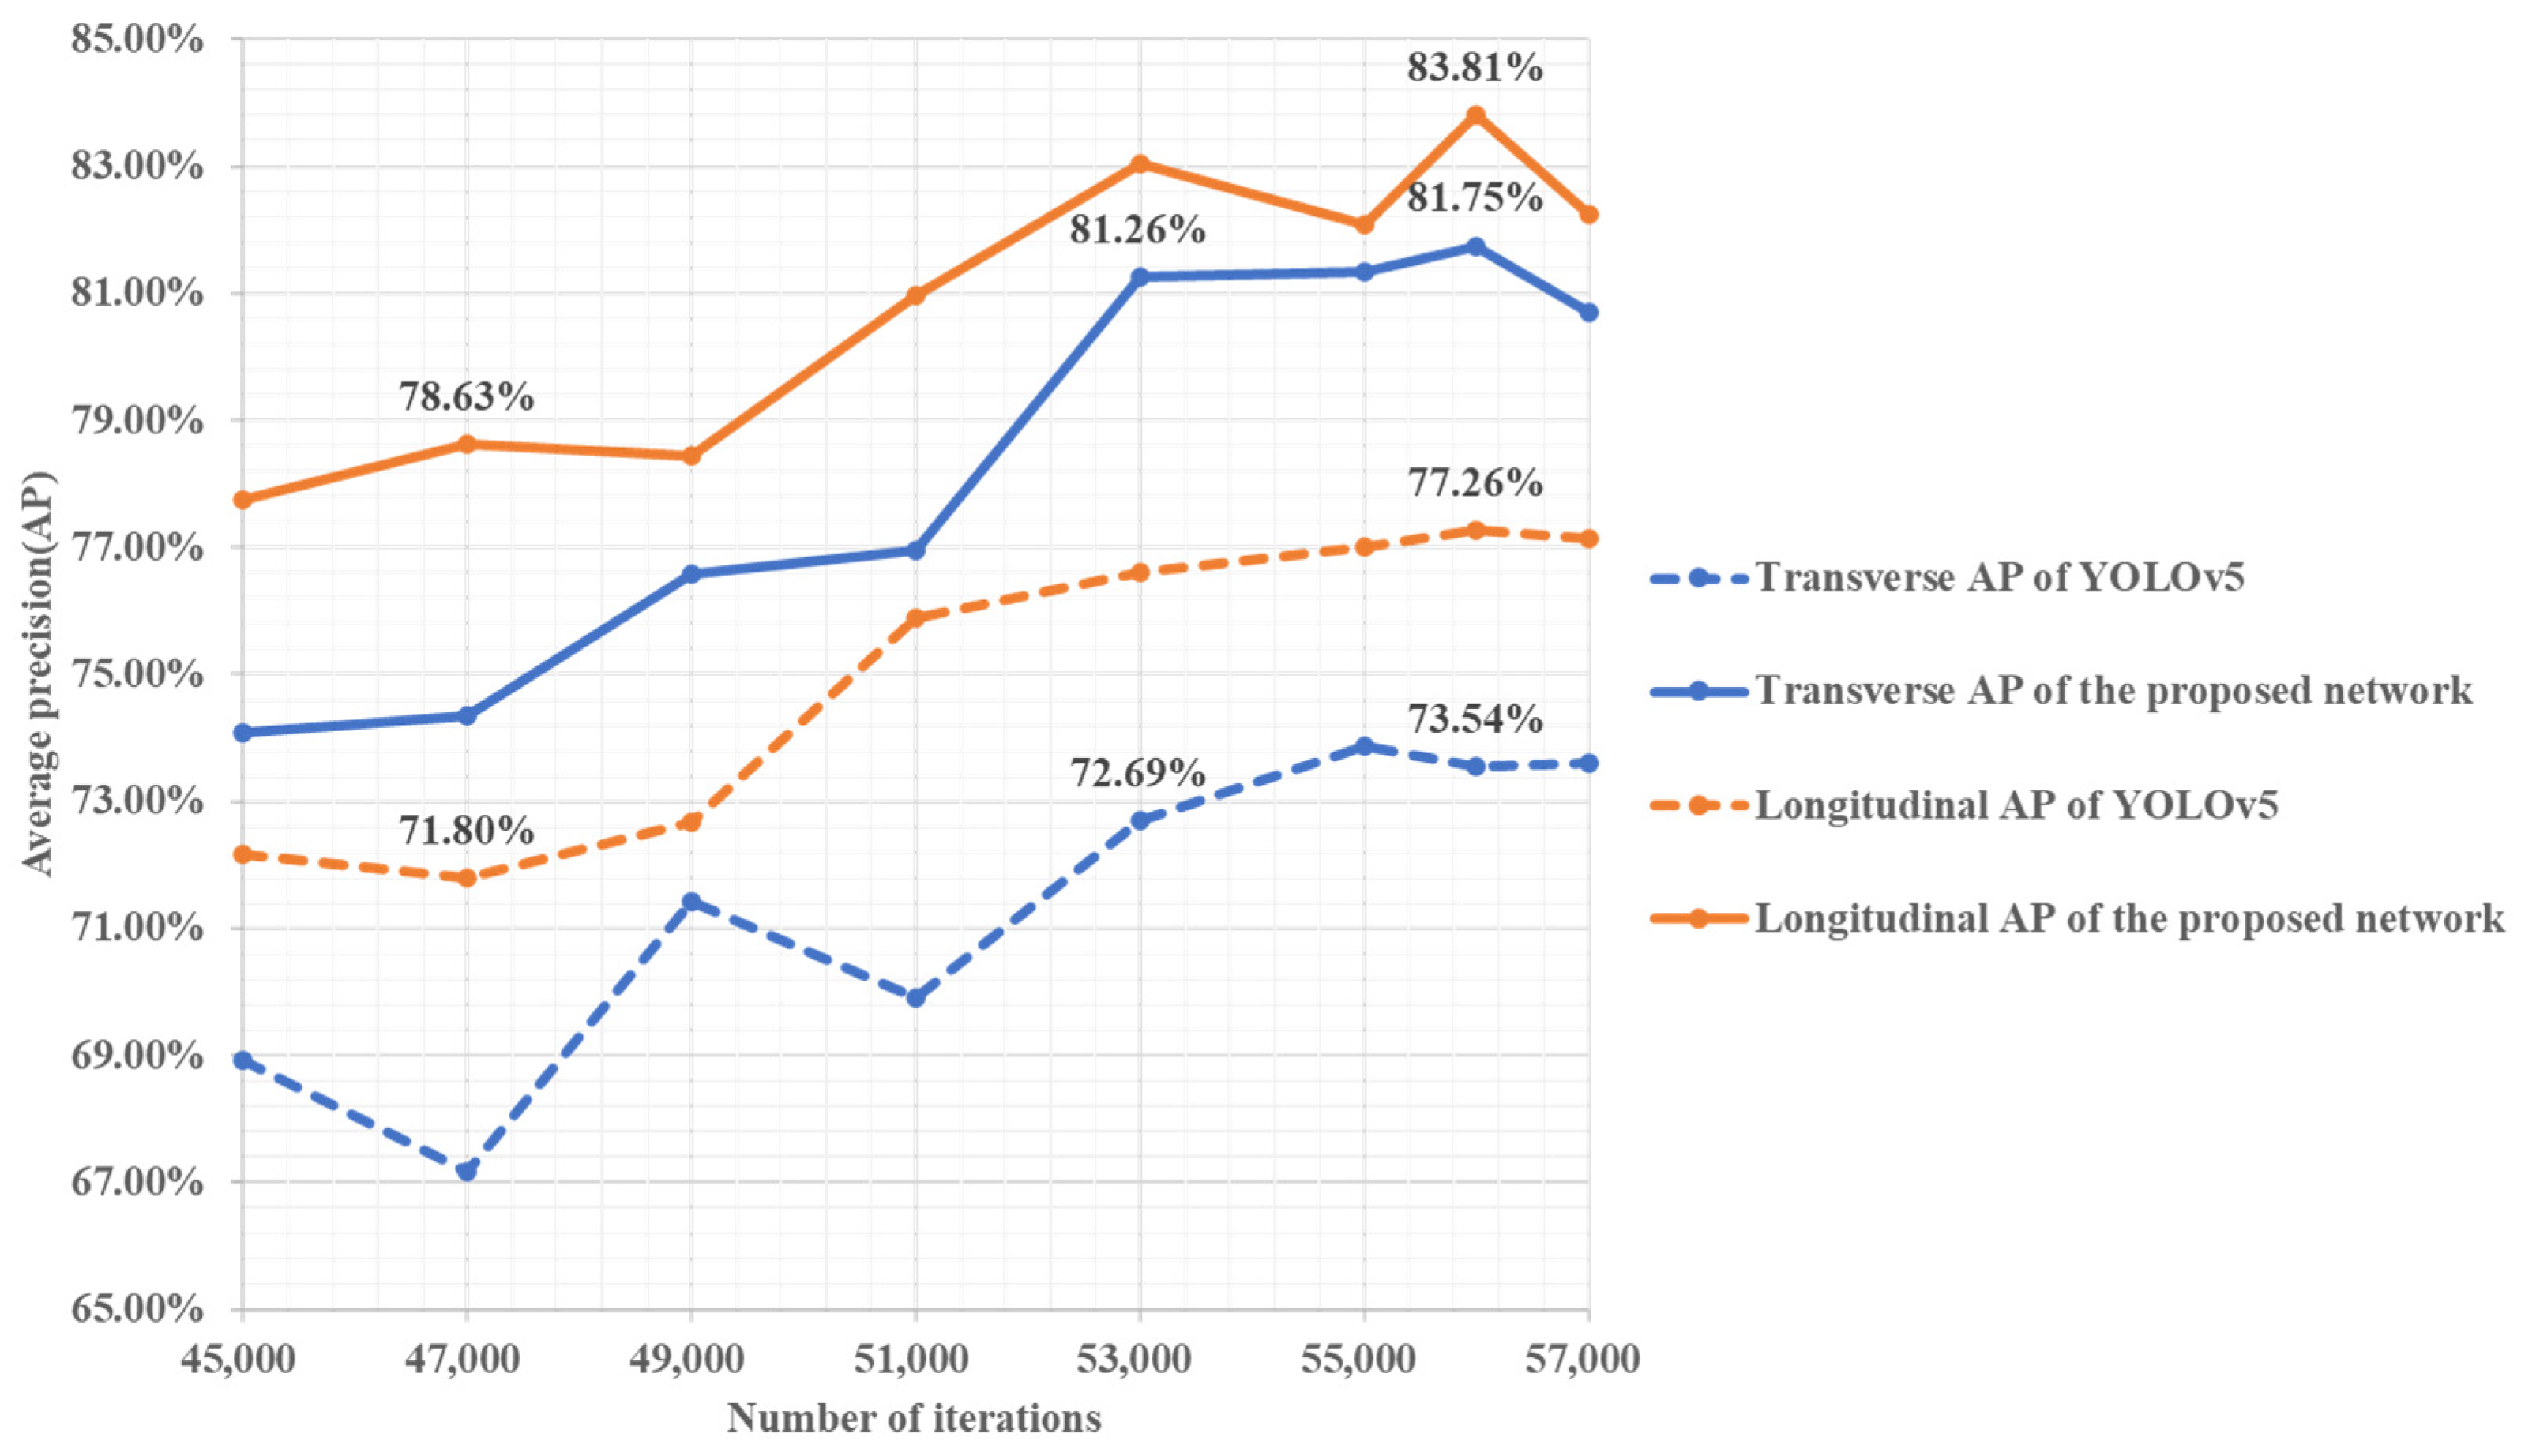
3.3. Experimental Results of the Proposed Crack Detection Model

During the training process, the loss value stabilized at 0.05 after 50,000 iterations, and the best test result was obtained at 56,000 iterations. Figure 8 presents examples of the experimental results generated by the proposed crack detection model.
In order to verify the crack detection model performance, a total of four comparative experiments were conducted. Table 3 shows the detection precision of Faster-RCNN, YOLOv3, YOLOv5, and the proposed network. Comprehensively judging from the performance of the four classes, our proposed model performs the best, followed by YOLOv5 and YOLOv3, and the typical two-stage detection network Faster-RCNN performs the worst. Obviously, there is a great improvement for the AP of the transverse crack, longitudinal crack, and alligator after the network improved, but the AP of the block is slightly reduced. It can also be seen from Figure 8f that the bounding box generated by the proposed model does not describe the shape of the block crack very well. There is a high possibility that block cracks are mostly large and medium targets with significant semantic information; the proposed network added more shallow features which are helpful to identify the characteristics of transverse cracks and longitudinal cracks but may not be conducive to the identification of block characteristics.
To further observe the improvement of the proposed crack detection model in small-target detection, follow-up experiments were conducted. When the number of iterations is between 45,000 and 57,000, a comparative experiment is performed every 2000 times to observe the detection precision of transverse cracks and longitudinal cracks. Figure 9 compares the AP changes in longitudinal cracks and transverse cracks during 45,000 to 57,000 iterations before and after network improvement. The evidence supports that when the number of iterations is greater than 45,000, as it increases, the AP values of transverse cracks and longitudinal cracks are both more than 5% higher than those of the original YOLOv5 network. As can be seen from Figure 9, there is a maximum difference of 8.57% between the APs of transverse cracks before and after YOLOv5 improvement at 53,000 iterations, while the APs of longitudinal cracks differ the most by 6.83% at 47,000 iterations.

3.4. Experimental Results of Evaluation Indicators in Engineering

Models are constantly being proposed, but industry adoption usually takes several years. In addition to algorithm updates, in the industrial world it is much more important that models can be applied appropriately on accurate data to solve real-world problems. Therefore, in the application scenario of this study, whether the proposed crack detection model provides complete and accurate identification and classification results for cracks is the major concern for road monitoring and maintenance.
Table 4 shows the missed detection rate and false detection rate of the proposed network and YOLOv5. Both networks do not exhibit false detections, but there are differing degrees of missed detections, and all missed detection rates have lower values in the proposed network. From Table 4, it can be observed that the original YOLOv5 network works poorly on transverse cracks and longitudinal cracks, but better on block and alligator cracks, where the reason is that in our dataset, transverse cracks and longitudinal cracks are widely distributed with complex and changeable backgrounds, while block and alligator cracks are more concentrated and have similar backgrounds. As can be seen, the proposed network has reduced the missed detection rate of the four types of cracks to varying degrees, and the missed detection rate of all cracks is reduced from 8.95% to 2.20%.

3.5. Validation Test of the Proposed Crack Detection Model

For verifying the robustness of the proposed model, a validation test was conducted in this study. Various methods were employed to obtain new images with cracks such as online searching, experimental collection, and public datasets. Finally, the validation set contains 120 images, and the total number of crack samples is 156, including 38 transverse cracks, 74 longitudinal cracks, 18 block cracks, and 26 alligator cracks. To obtain the experimental results, the validation set was input into the proposed crack detection model. Examples of the experimental results are shown in Figure 10.
It can be seen from Figure 10 that the bounding boxes generated by our proposed model describe the transverse and longitudinal cracks well as shown in Figure 10a,b, while those for block and alligator cracks are not particularly accurate as shown in Figure 10c,d, which is consistent with the experimental results obtained by the test set. This also shows that the proposed model has a strong ability to detect transverse and longitudinal cracks of a small size, but at the expense of deteriorating the ability to extract the features of block and alligator cracks. Table 5 displays the missed detection rate and the false detection rate of each category of cracks in the validation set. According to statistics, 150 crack samples were detected and 5 crack samples were not detected, including 1 transverse crack, 3 longitudinal cracks, and 1 block crack. For the entire validation set, the missed detection rate is 3.31%, which is slightly higher than that of our test set. In addition, a transverse crack was incorrectly detected as a longitudinal crack due to the different shooting angle, as shown in Figure 10e, which leads to a false detection rate of the longitudinal crack of 0.12%. It can be concluded from the above experimental results and analysis that the proposed crack detection model has achieved a good performance on the validation set and is of good adaptability.

4. Discussion

This paper proposed a method to address the multi-target and multi-class detection of cracks with complicated background by developing an intelligent model that improves the YOLOv5 network from four aspects and satisfies the requirements for multi-scale crack detection. In addition to the image processing method, prior literature has also attempted to detect and identify pavement distress utilizing methods such as 3D ground penetrating radar, 3D laser scanning, UAVs, etc. Table 6 provides a comparative analysis of related research on these methods from various perspectives.
All four methods listed in the table are highly efficient and productive. Image processing is commonly utilized to detect visible pavement distress like cracks, potholes, and ruttings while 3D GPR is typically employed for detecting structural pavement distress such as cavities, loose areas, and other underground facilities [56]. The mAPs of image processing and 3D GPR are basically over 80%. UAVs and 3D laser scanning are often used for the detection of distress types like potholes and road safety evaluation by integrating three-dimensional point cloud and images, and they can also measure distress with a margin of error at the centimeter level. In terms of cost, 3D laser scanning and 3D GPR are more costly, UAVs cost a moderate amount, and image processing costs the least. It can be seen from the comprehensive comparison that image processing has major advantages in detecting pavement visible distress due to its economy and feasibility of operations.
Furthermore, with the wide application of image processing, people have also carried out a lot of studies. For example, Li [57] designed a rural pavement distress detection network called crack convolution (CrackYOLO), while Xu [58] investigated crack detection and carried out a comparison study based on Faster R-CNN and Mask R-CNN, and Wu [59] integrated the coordinate attention (CA) module into the backbone of YOLOv5. The datasets they used were collected parallel to the pavement and did not classify cracks; unlike these studies, this study built a dataset of pavement cracks with complicated backgrounds to realize the multi-target and multi-class detection of cracks in complicated scenarios. There are also some studies which have attempted to detect cracks in complicated scenarios, but they focused on different pavement distress types, like Ref. [34] which classified pavement distress types into nine groups, while Refs. [60,61] classified pavement distress into longitudinal cracks, transverse cracks, alligator cracks, and potholes. Compared with these studies, our proposed method concentrated on detecting and identifying the four typical crack categories: transverse, longitudinal, block, and alligator. Moreover, the network structure of YOLOv5 was also improved from various aspects, and the detection performance of small-sized cracks was further compared and analyzed.
On the other hand, determining the severity levels of the detected and identified cracks is also essential for pavement maintenance work. In this study, the severity levels of cracks in images can be roughly evaluated according to the detection results output by the proposed model. It is obvious that the pavement has seriously deteriorated when block and alligator cracks exist, and the alligator is more destructive than the block because of its development pattern. Because the longitudinal tends to propagate downwards to cause top-down cracking (TDC), it is more destructive than the transverse [62]. Consequently, in this paper, it can be preliminarily thought that the order of the severity levels of cracks from high to low is alligator, block, longitudinal, and transverse. As for the severity levels of alligator and block cracks, it can be considered that the larger the size of the detection bounding box output by the model, the larger the crack’s coverage area and the higher the severity. As for transverse and longitudinal cracks, which typically appear as one or several adjacent curves in images, it can be considered that when the aspect ratio of the detection bounding box is too large or too small, the crack has a longer length and a higher severity. However, this is just a crude method for severity levels’ judgment combined with pavement crack detection results; we can further figure out the thresholds for classifying the severity levels of each category of crack in the future.

5. Conclusions

Automated pavement crack detection is a significant step which offers a low cost, is less labor-intensive, and represents a practical solution to replace traditional manual methods. In our study on crack detection, we have identified issues with existing works such as inappropriate datasets and an inadequate detection capability for small-sized cracks. In this paper, an intelligent model was implemented based on the improved YOLOv5 network to address these issues and detect pavement cracks with complex backgrounds automatically and accurately.
Specifically, a dataset of pavement cracks with complicated backgrounds was built which is more comparable to engineering applications. Samples in the dataset were collected from real scenarios and divided into four classes, containing the overall development trend of cracks. For the network architecture, the YOLOv5 framework was improved by adding a small-target detection layer, updating the anchor box, improving the neck structure based on Bi-FPN, and improving the cross-layer connection, which effectively enhanced the network’s understanding of features and detection capability of small targets. Experimental analyses revealed that the proposed crack detection model obtained a high performance for the AP of transverse, longitudinal, block, and alligator cracks with 81.75%, 83.81%, 98.20%, and 92.83% respectively, and the mAP for all cracks was 89.15%. Our proposed model also displayed an advantage in small-target detection, achieving more than a 5% improvement in the AP of transverse cracks and longitudinal cracks. From the perspective of engineering applications, more cracks were successfully detected by the proposed model, and the missed detection rate of the test set was reduced from 8.95% to 2.20%. In conclusion, both in terms of algorithm and engineering evaluation indicators, this methodology has significantly improved the crack detection capability and the model practicality of the original network.
However, our model also has disadvantages and limitations. Since we focused mainly on small-target detection, the AP of block cracks decreased by 0.18% in contrast to the original YOLOv5 network. And when several cracks of multiple categories appear in the same area, the bounding boxes of block and alligator cracks may not describe the shape of the cracks so accurately. Additional feature fusion methods will be combined in future studies to enhance the feature extraction capabilities and broaden the model’s applicability to multi-scale cracks. According to the crack detection results, our model can roughly evaluate the severity levels of cracks but cannot provide precise measurement data of cracks. The segmentation of pavement cracks could be investigated in subsequent research to obtain the width information of cracks which is more important for classifying severity levels. Additionally, the number of cracks in the dataset needs to be further expanded to cover more scenarios in the future.

Author Contributions

Conceptualization, Y.W. and Q.Q.; methodology, Y.W.; software, Y.W. and L.S.; validation, Y.W., W.X., C.L. and T.M.; formal analysis, Y.W. and J.Z.; investigation, C.L. and L.S.; resources, Q.Q.; data curation, W.X., C.L. and T.M.; writing—original draft preparation, Y.W. and J.Z.; writing—review and editing, C.L. and T.M.; visualization, Y.W., W.X. and T.M.; supervision, Q.Q., L.S. and W.X.; project administration, Y.W. and Q.Q.; funding acquisition, Q.Q. and W.X. All authors have read and agreed to the published version of the manuscript.

Funding

This work was funded by the Innovation and Entrepreneurship Science and Technology Project of Chinese Institute of Coal Science, Grant/Award Number: 2021-KXYJ-005 and the Innovation and Entrepreneurship Science and Technology Project of Chinese Institute of Coal Science, Grant/Award Number: 2022-TD-MS001.

Institutional Review Board Statement

Not applicable.

Informed Consent Statement

Not applicable.

Data Availability Statement

The data presented in this study are available on request from the corresponding author due to privacy and ethical restrictions.

Conflicts of Interest

The authors declare no conflicts of interest.

References

  1. Li, L.; Liu, W.; He, Z. A review of research on asphalt pavement design at home and abroad. Highway 2015, 12, 44–49. [Google Scholar]
  2. Li, Z.; Huang, X.; Chen, G.; Xu, T. Research on Reliability Evaluation of Asphalt Pavement. J. Beijing Univ. Technol. 2012, 8, 1208–1213. [Google Scholar]
  3. Tarawneh, S.; Sarireh, M. Causes of Cracks and Deterioration of Pavement on Highways in Jordan from Contractors’ Perspective. Civ. Environ. Res. 2013, 3, 16–26. [Google Scholar]
  4. Ottoa, F.; Liu, P.; Zhang, Z.; Wang, D.; Oeser, M. Influence of temperature on the cracking behavior of asphalt base courses with structural weaknesses. Int. J. Transp. Sci. Technol. 2018, 7, 208–216. [Google Scholar] [CrossRef]
  5. Miller, J.; Bellinger, W. Distress Identification Manual for the Long-Term Pavement Performance Program, Fifth Revised ed.; United States Department of Transportation Federal Highway Administration: Washington, DC, USA, 2014; pp. 1–16.
  6. Pavement Distresses. Available online: https://pavementinteractive.org/reference-desk/pavement-management/pavement-distresses/ (accessed on 1 January 2012).
  7. Fawzy, M.; Shrakawy, A.; Hassan, A.; Khalifa, Y. Enhancing sustainability for pavement maintenance decision-making through image processing-based distress detection. Innov. Infrastruct. Solut. 2024, 9, 58. [Google Scholar] [CrossRef]
  8. Molenaar, A. Structural Performance and Design of Flexible Road Constructions and Asphalt Concrete Overlays. Ph.D. Thesis, Delft University of Technology, Delft, The Netherlands, 1983. [Google Scholar]
  9. Vaitkus, A.; Čygas, D.; Motiejūnas, A.; Pakalnis, A.; Miškinis, D. Improvement of road pavement maintenance models and technologies. Balt. J. Road Bridg. Eng. 2016, 11, 242–249. [Google Scholar] [CrossRef]
  10. Chuo, E. Overview of the development of foreign road automatic detection systems. Transp. Stand. 2009, 17, 96–99. [Google Scholar]
  11. Gao, F. Research and Implementation of Road Comprehensive Information Collection System. Master’s Thesis, Changan University, Xian, China, 2009. [Google Scholar]
  12. Qureshi, W.; Hassan, S.; McKeever, S.; Power, D.; Mulry, B.; Feighan, K.; O’Sullivan, D. An Exploration of Recent Intelligent Image Analysis Techniques for Visual Pavement Surface Condition Assessment. Sensors 2022, 22, 9019. [Google Scholar] [CrossRef] [PubMed]
  13. Li, J.; Liu, T.; Wang, X. Advanced pavement distress recognition and 3D reconstruction by using GA-DenseNet and binocular stereo vision. Measurement 2022, 201, 111760. [Google Scholar] [CrossRef]
  14. Hou, Y.; Li, Q.; Zhang, C.; Lu, G.; Ye, Z.; Chen, Y.; Wang, L.; Cao, D. The State-of-the-Art Review on Applications of Intrusive Sensing, Image Processing Techniques, and Machine Learning Methods in Pavement Monitoring and Analysis. Engineering 2021, 7, 845–856. [Google Scholar] [CrossRef]
  15. Feldman, D.; Pyle, T.; Lee, J. Automated Pavement Condition Survey Manual; California Department of Transportation: Los Angeles, CA, USA, 2015. [Google Scholar]
  16. Majidifard, H.; Jin, P.; Adu-Gyamfi, Y.; Buttlar, W. Pavement Image Datasets: A New Benchmark Dataset to Classify and Densify Pavement Distresses. In Proceedings of the TRB 99th Annual Meeting, Washington, DC, USA, 12–16 January 2020. [Google Scholar]
  17. Klette, R. Concise Computer Vision; Springer: London, UK, 2014; pp. 287–330. [Google Scholar]
  18. Morris, T. Computer Vision and Image Processing; Palgrave Macmillan Ltd.: New York, NY, USA, 2004; pp. 287–330. [Google Scholar]
  19. O’Mahony, N.; Campbell, S.; Carvalho, A.; Harapanahalli, S.; Hernandez, G.; Krpalkova, L.; Riordan, D.; Walsh, J. Deep Learning vs. Traditional Computer Vision. In Advances in Computer Vision, Proceedings of the 2019 Computer Vision Conference (CVC), Las Vegas, CA, USA, 2–3 May 2019; Springer International Publishing: Berlin/Heidelberg, Germany, 2020; pp. 128–144. [Google Scholar]
  20. Chen, L.; Li, S.; Bai, Q.; Yang, J.; Jiang, S.; Miao, Y. Review of Image Classification Algorithms Based on Convolutional Neural Networks. Remote Sens. 2021, 13, 4712. [Google Scholar] [CrossRef]
  21. Chai, J.; Zeng, H.; Li, A.; Ngai, E. Deep learning in computer vision: A critical review of emerging techniques and application scenarios. Mach. Learn. Appl. 2021, 6, 100134. [Google Scholar] [CrossRef]
  22. Sarker, I. Deep Learning: A Comprehensive Overview on Techniques, Taxonomy, Applications and Research Directions. SN Comput. Sci. 2021, 2, 420. [Google Scholar] [CrossRef] [PubMed]
  23. Valente, J.; António, J.; Mora, C.; Jardim, S. Developments in Image Processing Using Deep Learning and Reinforcement Learning. J. Imaging 2023, 9, 207. [Google Scholar] [CrossRef] [PubMed]
  24. Nasser, M.; Yusof, U. Deep Learning Based Methods for Breast Cancer Diagnosis: A Systematic Review and Future Direction. Diagnostics 2023, 13, 161. [Google Scholar] [CrossRef]
  25. Prerna, S. Systematic review of data-centric approaches in artificial intelligence and machine learning. Data Sci. Manag. 2023, 6, 144–157. [Google Scholar]
  26. Zhang, L.; Yang, F.; Zhang, Y.; Zhu, Y. Road crack detection using deep convolutional neural network. In Proceedings of the IEEE International Conference on Image Processing, Phoenix, AZ, USA, 25–28 September 2016. [Google Scholar]
  27. Yusof, N.; Osman, K.; Noor, M.; Ibrahim, A.; Tahir, N.; Yusof, N. Crack Detection and Classification in Asphalt Pavement Images using Deep Convolution Neural Network. In Proceedings of the 2018 8th IEEE International Conference on Control System, Computing and Engineering (ICCSCE), Penang, Malaysia, 23–25 November 2018. [Google Scholar]
  28. Zhang, A.; Wang, K.; Li, B.; Yang, E.; Dai, X.; Peng, Y.; Fei, Y.; Liu, Y.; Li, J.; Chen, C. Automated Pixel-Level Pavement Crack Detection on 3D Asphalt Surfaces Using a Deep-Learning Network. Comput.-Aided Civ. Infrastruct. Eng. 2017, 32, 805–819. [Google Scholar] [CrossRef]
  29. Mandal, V.; Uong, L.; Adu-Gyamfi, Y. Automated Road Crack Detection Using Deep Convolutional Neural Networks. In Proceedings of the 2018 IEEE International Conference on Big Data (Big Data), Seattle, WA, USA, 10–13 December 2018. [Google Scholar]
  30. Nie, M.; Wang, C. Pavement Crack Detection based on yolov3. In Proceedings of the 2019 2nd International Conference on Safety Produce Informatization (IICSPI), Chongqing, China, 28–30 November 2019. [Google Scholar]
  31. Cao, W.; Zou, Y.; Luo, M.; Zhang, P.; Wang, W.; Huang, W. Deep Discriminant Learning-based Asphalt Road Cracks Detection via Wireless Camera Network. In Proceedings of the 2019 Computing, Communications and IoT Applications (ComComAp), Shenzhen, China, 26–28 October 2019. [Google Scholar]
  32. Maeda, H.; Sekimoto, Y.; Seto, T.; Kashiyama, T.; Omata, H. Road Damage Detection and Classification Using Deep Neural Networks with Smartphone Images. Comput. Civ. Infrastruct. Eng. 2018, 33, 1127–1141. [Google Scholar] [CrossRef]
  33. Maeda, H.; Kashiyama, T.; Sekimoto, Y.; Seto, T.; Omata, H. Generative adversarial network for road damage detection. Comput.-Aided Civ. Infrastruct. Eng. 2020, 36, 47–60. [Google Scholar] [CrossRef]
  34. Ruseruka, C.; Mwakalonge, J.; Comert, G.; Siuhi, S.; Ngeni, F.; Major, K. Pavement Distress Identification Based on Computer Vision and Controller Area Network (CAN) Sensor Models. Sustainability 2023, 15, 6438. [Google Scholar] [CrossRef]
  35. Wang, Y. Intelligent Detection System of Pavement Crack Based on Deep Learning. Master’s Thesis, University of Science and Technology Beijing, Beijing, China, 2021. [Google Scholar]
  36. Sun, C.; Shrivastava, A.; Singh, S.; Gupta, A. Revisiting Unreasonable Effectiveness of Data in Deep Learning Era. In Proceedings of the IEEE International Conference on Computer Vision, Venice, Italy, 22–29 October 2017. [Google Scholar]
  37. Chen, J.; Luo, S.; Li, L.; Dan, H.; Zhao, L. Temperature distribution and method-experience prediction model of asphalt pavement. J. Cent. South Univ. 2013, 44, 1647–1656. [Google Scholar]
  38. Wang, K.; Hao, P. Prediction model of temperature in different layers of asphalt pavement. J. Chang. Univ. 2017, 37, 24–30. [Google Scholar]
  39. Epps, J.; Monismith, C. Fatigue of asphalt concrete mixtures—Summary of existing information. In Fatigue of Compacted Bituminous Aggregate Mixtures; Gallaway, B., Ed.; ASTM International: West Conshohocken, PA, USA, 1972; pp. 19–45. [Google Scholar]
  40. Tang, G.; Ni, J.; Zhao, Y.; Gu, Y.; Cao, W. A Survey of Object Detection for UAVs Based on Deep Learning. Remote Sens. 2024, 16, 149. [Google Scholar] [CrossRef]
  41. Xu, H.; Su, X.; Wang, Y.; Cai, H.; Cui, K.; Chen, X. Automatic Bridge Crack Detection Using a Convolutional Neural Network. Appl. Sci. 2019, 9, 2867. [Google Scholar] [CrossRef]
  42. Li, L.; Ma, W.; Li, L.; Lu, C. Research on detection algorithm for bridge cracks based on deep learning. Acta Autom. Sin. 2019, 45, 1727–1742. [Google Scholar]
  43. Cui, L. CrackForest Dataset. Available online: https://github.com/cuilimeng/CrackForest-dataset (accessed on 11 May 2017).
  44. Redmon, J.; Divvala, S.; Girshick, R.; Farhadi, A. You Only Look Once: Unified, Real-Time Object Detection. In Proceedings of the IEEE Conference on Computer Vision and Pattern Recognition (CVPR), Las Vegas, NV, USA, 27–30 June 2016. [Google Scholar]
  45. Girshick, R.; Donahue, J.; Darrell, T.; Malik, J. Rich Feature Hierarchies for Accurate Object Detection and Semantic Segmentation. In Proceedings of the IEEE Conference on Computer Vision and Pattern Recognition (CVPR), Columbus, OH, USA, 23–28 June 2014. [Google Scholar]
  46. Ren, S.; He, K.; Girshick, R.; Sun, J. Faster R-CNN: Towards real-time object detection with region proposal networks. Adv. Neural Inf. Process. Syst. 2015, 28, 1–9. [Google Scholar] [CrossRef] [PubMed]
  47. Ultralytics. yolov5. Available online: https://github.com/ultralytics/yolov5/ (accessed on 26 June 2020).
  48. Redmon, J.; Farhadi, A. YOLOv3: An Incremental Improvement. In Proceedings of the IEEE Conference on Computer Vision and Pattern Recognition, Salt Lake City, UT, USA, 18–22 June 2018. [Google Scholar]
  49. Bochkovskiy, A.; Wang, C.; Liao, H. YOLOv4: Optimal Speed and Accuracy of Object Detection. arXiv 2020, 2004, 10934. [Google Scholar]
  50. Zaidi, S.; Ansari, M.; Aslam, A.; Kanwal, N.; Asghar, M.; Lee, B. A Survey of Modern Deep Learning based Object Detection Models. Digit. Signal Process. 2022, 126, 103514. [Google Scholar] [CrossRef]
  51. Ren, Z.; Zhang, H.; Li, Z. Improved YOLOv5 Network for Real-Time Object Detection in Vehicle-Mounted Camera Capture Scenarios. Sensors 2023, 23, 4589. [Google Scholar] [CrossRef]
  52. Tan, M.; Pang, R.; Le, Q. Efficientdet: Scalable and efficient object detection. In Proceedings of the IEEE/CVF Conference on Computer Vision and Pattern Recognition (CVPR), Seattle, WA, USA, 13–19 June 2020. [Google Scholar]
  53. Yang, B.; Zong, Z.; Chen, C.; Sun, W.; Mi, X.; Wu, W.; Huang, R. Real time approach for underground objects detection from vehicle-borne ground penetrating radar. Acta Geod. Cartogr. Sin. 2020, 49, 874–882. [Google Scholar]
  54. Wu, H.; Yao, L.; Xu, Z.; Li, Y.; Ao, X.; Chen, Q.; Li, Z.; Meng, B. Road pothole extraction and safety evaluation by integration of point cloud and images derived from mobile mapping sensor. Adv. Eng. Inform. 2019, 42, 100936. [Google Scholar] [CrossRef]
  55. Tan, Y.; Li, Y. UAV Photogrammetry-Based 3D Road Distress Detection. ISPRS Int. J. Geo-Inf. 2019, 8, 409. [Google Scholar] [CrossRef]
  56. Wang, D.; Lyu, H.; Tang, F.; Ye, C.; Zhang, F.; Wang, S.; Ni, Y.; Leng, Z.; Lu, G.; Liu, P. Road Structural Defects Detection and Digitalization Based on 3D Ground Penetrating Radar Technology: A State-of-the-art Review. China J. Highw. Transp. 2023, 36, 1–19. [Google Scholar]
  57. Li, Y.; Sun, S.; Song, W.; Zhang, J.; Teng, Q. CrackYOLO: Rural Pavement Distress Detection Model with Complex Scenarios. Electronics 2024, 13, 312. [Google Scholar] [CrossRef]
  58. Xu, X.; Zhao, M.; Shi, P.; Ren, R.; He, X.; Wei, X.; Yang, H. Crack Detection and Comparison Study Based on Faster R-CNN and Mask R-CNN. Sensors 2022, 22, 1215. [Google Scholar] [CrossRef] [PubMed]
  59. Wu, L.; Duan, Z.; Liang, C. Research on Asphalt Pavement Disease Detection Based on Improved YOLOv5s. J. Sens. 2023, 2023, 688–695. [Google Scholar] [CrossRef]
  60. Yu, G.; Zhou, X. An Improved YOLOv5 Crack Detection Method Combined with a Bottleneck Transformer. Mathematics 2023, 11, 2377. [Google Scholar] [CrossRef]
  61. Ren, J.; Zhao, G.; Ma, Y.; Zhao, D.; Liu, T.; Yan, J. Automatic Pavement Crack Detection Fusing Attention Mechanism. Electronics 2022, 11, 3622. [Google Scholar] [CrossRef]
  62. Canestrari, F.; Ingrassia, L. A review of top-down cracking in asphalt pavements: Causes, models, experimental tools and future challenges. J. Traffic Transp. Eng. 2020, 7, 541–572. [Google Scholar] [CrossRef]
Figure 1. Images of pavement cracks under different conditions: (a) Cracks on a hazy day; (b) Cracks under bright light; (c) Cracks on a rainy day; (d) Cracks in shadow.
Applsci 14 02909 g001
Figure 2. Examples of images obtained from the public crack dataset [41].
Applsci 14 02909 g002
Figure 3. Image pre-processing steps: (a) Original image; (b) Image after grayscale processing; (c) Image after histogram equalization; (d) Image after bilateral filtering.
Applsci 14 02909 g003
Figure 4. The network architecture of YOLOv5.
Applsci 14 02909 g004
Figure 5. Neck structure design: (a) PANet of YOLOv5s; (b) Bi-FPN; (c) The neck structure after introducing Bi-FPN and a small-target detection layer.
Applsci 14 02909 g005
Figure 6. Visualization of feature maps: (a) Original image; (b) The 1st downsampling feature map; (c) The 2nd downsampling feature map; (d) The 3rd downsampling feature map; (e) The 4th downsampling feature map; (f) The 5th downsampling feature map.
Applsci 14 02909 g006aApplsci 14 02909 g006b
Figure 7. The proposed network architecture based on YOLOv5.
Applsci 14 02909 g007
Figure 8. Examples of experimental results: (a) Single target; (b) Multiple targets within a single class; (c) Multiple targets within two classes; (d) Multiple targets within two classes; (e) Multiple targets within multiple classes; (f) Block crack with an inaccurate bounding box.
Applsci 14 02909 g008aApplsci 14 02909 g008b
Figure 9. Comparison of changes in the AP of transverse and longitudinal cracks before and after network improvement.
Applsci 14 02909 g009
Figure 10. Examples of the experimental results: (a) Longitudinal cracks with accurate bounding boxes; (b) Transverse cracks with accurate bounding boxes; (c) Alligator crack with an inaccurate bounding box; (d) Block crack with an inaccurate bounding box; (e) Transverse crack detected as a longitudinal crack.
Applsci 14 02909 g010
Table 1. The composition of pavement crack dataset with complicated backgrounds.
Image SourceImage NumberTransverseLongitudinalBlockAlligator
Experimental collectingCamera, car12817231700394373
Driving recorder, bus462995712515
Online searching22649441675440923
Total4007176639468591311
Table 2. The composition of the test set.
Test SetTransverseLongitudinalBlockAlligator
Labeling box number13523764156
Table 3. Comparison of experimental results of the selected networks.
Detection NetworkAverage Precision (AP)Mean Average Precision (mAP)
TransverseLongitudinalBlockAlligatorTest Set
Faster-RCNN66.27%70.44%92.24%84.87%78.46%
YOLOv372.62%75.83%98.31%90.13%84.22%
YOLOv573.54%77.26%98.38%90.42%84.90%
The proposed network81.75%83.81%98.20%92.83%89.15%
Table 4. Results of evaluation indicators in engineering before and after network improvement.
Detection NetworkMissed Detection RateFalse Detection Rate
TransverseLongitudinalBlockAlligatorTest SetTest Set
YOLOv513.33%9.70%3.13%6.41%8.95%0%
The proposed network2.96%2.53%0%1.92%2.20%0%
Table 5. Experimental results of the proposed model on the validation set.
Evaluation IndicatorsTransverseLongitudinalBlockAlligator
Missed detection rate5.26%4.05%5.56%0%
False detection rate0%0.12%0%0%
Table 6. Comparison of pavement distress detection methods.
MethodDetection ObjectAccuracySystematic Error Cost
Image processing
(the proposed method)
Transverse, longitudinal, block, and alligatormAP: 89.15%Missed detection rate: 2.20%Hundreds of dollars
3D GPR [53]Rainwater wells, cables, pipes, steel mesh, and cavitiesmAP: 92.00%/Tens of thousand dollars
3D laser scanning [54]Potholes/Mean error: 1.5–2.8 cmHundreds of thousand dollars
UAVs [55]Cavities and bulges/Hight dimension error: 1 cmThousands of dollars
Disclaimer/Publisher’s Note: The statements, opinions and data contained in all publications are solely those of the individual author(s) and contributor(s) and not of MDPI and/or the editor(s). MDPI and/or the editor(s) disclaim responsibility for any injury to people or property resulting from any ideas, methods, instructions or products referred to in the content.

