

Systems Reliability and Data Driven Analysis for Marine Machinery Maintenance Planning and Decision Making

1
Department of Naval Architecture Ocean and Marine Engineering, University of Strathclyde, 100 Montrose Street, Glasgow G4 0LZ, UK
2
Nigerian Navy, Naval Headquarters, Area 8 Garki, Abuja 900110, Nigeria
*
Author to whom correspondence should be addressed.
Machines 2024, 12(5), 294; https://0-doi-org.brum.beds.ac.uk/10.3390/machines12050294
Submission received: 12 February 2024
/
Revised: 15 April 2024
/
Accepted: 24 April 2024
/
Published: 27 April 2024
(This article belongs to the Special Issue Condition-Based Maintenance, Instrumentation and Data Analysis Methods Aiming Efficient Operation of Internal Combustion Engines)
Abstract
:Understanding component criticality in machinery performance degradation is important in ensuring the reliability and availability of ship systems, particularly considering the nature of ship operations requiring extended voyage periods, usually traversing regions with multiple climate and environmental conditions. Exposing the machinery system to varying degrees of load and operational conditions could lead to rapid degradation and reduced reliability. This research proposes a tailored solution by identifying critical components, the root causes of maintenance delays, understanding the factors influencing system reliability, and recognising failure-prone components. This paper proposes a hybrid approach using reliability analysis tools and machine learning. It uses dynamic fault tree analysis (DFTA) to determine how reliable and important a system is, as well as Bayesian belief network (BBN) availability analysis to assist with maintenance decisions. Furthermore, we developed an artificial neural network (ANN) fault detection model to identify the faults responsible for system unreliability. We conducted a case study on a ship power generation system, identifying the components critical to maintenance and defects contributing to such failures. Using reliability importance measures and minimal cut sets, we isolated all faults contributing over 40% of subsystem failures and related events. Among the 4 MDGs, the lubricating system had the highest average availability of 67%, while the cooling system had the lowest at 38% using the BBN availability outcome. Therefore, the BBN DSS recommended corrective action and ConMon as maintenance strategies due to the frequent failures of certain critical parts. ANN found overheating when MDG output was above 180 kVA, linking component failure to generator performance. The findings improve ship system reliability and availability by reducing failures and improving maintenance strategies.
1. Introduction
The operations of marine platforms such as offshore platforms, ships, and boats are increasingly being scrutinised for emission controls and safety of operations. This is more so because ships are central to global trade, responsible for over 90% of the global carriage of goods and services [1]. In addition, ships provide very essential services in the installation and maintenance of all types of offshore renewable power generation systems, as well as services in the oil and gas and security sectors. In order to ensure safety of life and the reduced environmental impact of ships and other maritime platforms, original equipment manufacturers (OEM) and operators rely on reliability analysis tools and data driven methods onboard or handheld sensors to access machinery information. This way, the health and performance of the machinery can be monitored in real time or recoded for future use. The essence is to enable documentation that can either be used in real time or for future diagnosis and prognosis to help with evidence-based machinery maintenance approach. Moreover, the complexity of systems onboard is such that there is a lot of inter-operational dependencies either in a machinery unit or system.
Ships in general are built for different purposes and applications; each of these has its peculiarities with regard to maintenance and other regulations, which can vary from state to state [2]. Notwithstanding, all ships constitute intricate connections systems and equipment design and are constructed to move from one point to another and provide support for human and machine inhabitation, as well as engage in designated services. In accordance with Stopford’s [3] findings, it is generally observed that ships are constructed with an intended operational lifespan of approximately 25 years, with the potential for extension up to 35 years or beyond [4]. The life cycle management of ships and on-board systems is frequently not adequately prioritised, resulting in significant maintenance costs beyond the initial 5-year period [5,6].
In this regard, operators are burdened with substantial maintenance expenses and frequently find themselves in forced marriages or alliances with equipment producers, in some cases having to bear the burden of equipment upgrades and retrofits due to regulations [7]. However, perception of maintenance activities differs among various operators, with many considering it to be a routine task that is only given significant attention in the case of a breakdown or when preparing for operations or exercises [8]. This approach contradicts the fundamental purpose of maintenance in that maintenance can be described as a comprehensive set of activities encompassing technical, administrative, and managerial measures undertaken throughout the lifespan of an item with the aim of preserving or reinstating its ability to fulfil the desired function [9]. It can therefore be inferred that maintenance, as a fundamental engineering service, plays a crucial role in operations, which significantly contributes to the achievement or failure of system availability in a fleet that could translate to revenue generation.
On the other hand, performance degradation in machineries could result in increased emissions in some machineries such as marine diesel generators and main propulsion engines, while in other systems such as pumps, this could lead to high levels of power consumption. Conversely, the presence of numerous equipment units that operate entirely autonomously poses a significant challenge in terms of maintenance planning, which cannot be effectively accomplished manually without some degree of data automation. In this regard, operators must create a maintenance strategy for condition monitoring that is appropriate for its intended purpose. When evaluating various aspects, it is important to consider elements such as the capacity of maintenance staff, availability of spare parts, environmental conditions, mission needs, future job predictions on the platform or fleet, and data management and processing [10].
Thus, this paper will detail the impact of combining reliability analysis tools and a machine learning approach on machinery degradation and reliability analysis. In this regard, the paper will be presented in 5 sections: Section 1 includes the introduction to the topic while the critical literature review focusing on machinery health degradation and component criticality analysis is presented in Section 2. The methodology on the hybrid approach is presented in Section 3, and Section 4 presents the case study. Finally, the results and discussion are presented in Section 5, closely followed by the conclusions in Section 6.
2. Critical Literature Review
The performance degradation of mechanical systems diminishes with age and usage due to component wear, tear, or fatigue. This degradation in performance is usually exhibited through a reduction in the ability to carry normal loads or an inability to operate for extended periods within the normal operational envelope and material conditions [11]. In this regard, system reliability analysis is enabled using historical failure and repair data, as well as the component and/or faults conditions responsible for machinery breakdown. However, wear and tear as well as other causes of machinery failure can be delayed or accelerated by some external or internal factors. External factors could include the environment, human factors such as technical skills, maintenance practice, and quality of consumables; others could associate failure with faults from other machinery. Internal factors include material failure, component failure as a result of shelf life, contamination, design issues, overload, etc. [12,13]. In this regard, research in the field of maintenance has received a lot of attention, especially pertaining to the combination of reliability analysis and data driven methods to enable comprehensive reliability and diagnostic and prognostic analysis [14,15,16]. Moreover, condition-based maintenance techniques, which are a viable replacement for planned or time-based maintenance concepts, largely underpin the effectiveness of reliability-centred maintenance. [17]. Nonetheless, the application of data-driven methods in predictive maintenance techniques were widely researched by authors such as Li, Gebraeel [18,19] and Wang, Chen [16], providing efficient optimisation models for implementation. Similarly, the use of supervised and non-supervised learning for clustering and anomaly detection-based machinery performance degradation on naval propulsion system was presented in [20,21].The use of data driven methods in machinery reliability and degradation analysis have been research in [6,22] where the authors have developed methodologies to improve reliability analysis outcomes using data-driven methods, especially in machinery performance degradation analysis.
2.1. Degradation Analysis
Performance degradation analysis thrives on the strength of data-driven methods enabled by machine learning. Maintenance strategies such as condition monitoring and predictive maintenance are popular due to their ability to provide real machinery conditions as well future machinery conditions based on current data. These achievement are all thanks to intelligent sensors as well as real-time data transmission enabled by the internet, commonly referred to as the internet of things of industry 4.0 [23]. Data-driven methods have provided the biggest push in machinery degradation analysis due to the use of qualitative sensor data, which can provide an unbiased image of machinery conditions. The importance of data-driven methods is found more in the maintenance strategy of critical machines and their components [24]. Therefore, data-driven methods have been used to establish machinery conditions that can be responsible for certain failures through indicators such as vibration, temperature, acoustics, pressure, speed, etc. [25,26,27].
The emergence of advance sensor technology gave rise to big data management, as operators are able collect large amount of machinery health data at short intervals, enabled by high-speed internet and wireless connectivity [28,29]. The combination of these technologies enables companies to monitor machinery in real time online, and in some cases, provide control and diagnosis [23]. Therefore, big data or industry 4.0 enables real-time insights into equipment performance, scheduling optimization, and downtime reduction, hence revolutionising how maintenance operations are carried out across a variety of industries [30]. Companies can foresee equipment failure and carry out proactive maintenance by evaluating data from sensors and other sources, which lowers the possibility of unscheduled downtime and boosts overall equipment efficiency [31].
Artificial Neural Networks
In general, there two types of machine learning approaches, namely, supervised and unsupervised learning. The supervised machine learning is used to train a model with labelled data, that is, the features to be looked out for are already known; therefore, the algorithm is trained to look out for those features in the input data. On the other hand, unsupervised learning deals with unlabelled data, which means the algorithm will identify unique features in the data and partition it accordingly. Unsupervised learning is useful for exploring data in order to understand the natural patten of the data, especially when there is no specific information about significant incidents in the data that can easily point to some fault indicators. Artificial neural networks (ANNs) have been applied in the field of maintenance for machinery health analysis and the prediction of machinery conditions by various authors. As an unsupervised learning method, SOMs are effective for data analysis and clustering, as demonstrated by their use in identifying nonlinear latent features from high dimensional data [32].
Therefore, riding on the existing success and procedures in the use of ANNs for machinery data analysis, this research will employ an ANN for fault classification and detection, fault/condition prediction, and machinery remaining useful life analysis [33]. An ANN approach for fault detection was applied with FTA to identify the critical component of a diesel generator in a research presented by [26,34]. In some cases, machinery fault data are recorded without identifying the fault signals; therefore, this requires data clustering. Clustering is a form of unclassified machine learning that is applied in machinery diagnostics [26]. The advantages of using clustering models include helping identify possible clusters as well as the most influential clusters in the data. In the research, ANN self-organising maps (SOMs) were used for clustering machinery log data of DG. SOMs consist of competitive layers which can classify a dataset of vectors with any number of dimensions as the number neurons in the layer and are good for dimensionality reduction, as presented in [19,35].
Accordingly, ANNs are widely employed for multiple tasks such as clustering, forecasting, prediction, pattern recognition, classification, and feature engineering [36]. ANNs and Regression techniques were employed to estimate vessel power and fuel consumption where the model was able to predict actual vessel fuel consumption in real time [37]. The use of ANNs for fault classification has been employed by [34], using self-organising map ANN clustering algorithm to analyse the health parameter of a marine diesel engine, looking at the exhaust gas temperature, piston cooling outlet temperature, and piston cooling inlet pressure. Therefore, the performance of ANNs in prediction and classification, as reviewed in [38,39], was presented to be good in handling nonlinear, high-dimensional data with a smaller dataset. In this regard, building on the success of ANNs, this work will apply the use of an ANN on labelled data for diagnostic analysis on 4 sets of marine diesel generators. Therefore, the feedback from the ANN is used in combination with the reliability analysis output to identify the dominant faults and most affected components.
The success of a diagnostics analysis platform using artificial intelligence or machine learning depends on an efficient and standardised data management system, in particular when the information is needed for maintenance planning. To make sense of the information available in a set of data collected from single or multiple machinery, it is important that there is a common platform and procedure understood by all within and outside the organisation. Moreover, [40] defines data as any reinterpretable representation of information in a formalised manner suitable for communication, hence the need to ensure that there is standardisation of data such that there is little or no interpretation needed at the point of use of analysis. While ship data as described in [41] is a measurement value from shipboard machine and equipment to which a time stamp is added, maintenance engineers have long depended on machinery data as their main source of information for understanding the present and future health condition of the machinery. Similarly, a broad methodology utilising various sensor data and technologies has been presented in the INCASS project, which provides research data and methodology for both ship machinery and structural risk analysis, enabled by the combination of sensor data and failure and repair data for machinery health and reliability analysis [42,43]. Nonetheless, these technologies present some challenges that companies need to be aware of, which are as follows [40]:
- Data quality: Successful implementation depends on the quality of data; therefore, it is important to ensure data accuracy, completeness, reflectiveness, and relevance to the requirement of the ship.
- Data Security: Appropriate security measures are needed to guard against cyberattacks and unauthorised access when storing and transmitting significant amounts of data from sensors and other sources.
- Data Integration: In order to analyse and interpret big data from diverse sources, the right tools and technologies must be used.
- Competence: Companies must ensure they have the right competence and tools in obtaining, analysing, and interpreting data so that they may make wise judgements; hence, ships must have the requisite expertise or hire one.
In this regard, [19] discussed a system of predicting machinery health monitoring using ANNs and FTA for reliability analysis, the methodology has successfully identified and defined measurement for machinery data through step-by-step demonstration of the process and identification of the critical component using FTA. Moreover, ISO 19847 [44] and ISO19845 [45] provides standard guidelines and definition for onboard ship data collection, storage, management, and transmission via the internet. Nonetheless, there already exists commonly understood formats for managing and collecting data onboard ships that are generated via various sources on board, as shown in Figure 1. Although there may be nomenclature differences, for instance, between merchant and naval ships, the records may still be referring to the same objective. It is a standard requirement for merchant ships to hold historical records of ship repair and maintenance being managed by classification society who also provide additional standards and guidelines for data collection and management [21,46]. These documents provide vital information on the location, speed, time, engine speed, and generator(s) online, as well as other systems operational within a given time. The records provide hourly updates of the operational state and consumption rates of important machinery. Typically, machinery health consists of time series data points of some important parameters, such as temperature, pressure, vibration, consumption rates, outputs, speed, load, deflections, and clearances.
2.2. System Reliability Analysis
System reliability analysis is central to the successful implementation of any maintenance strategy as it provides clear insight on machinery behaviour and the impacts of failure on the availability of machineries up to system levels. Accordingly, reliability analysis tools are widely used to support maintenance strategy selection or implementation in line with organisational objectives. Therefore, various maintenance strategy such as reliability-centred maintenance (RCM), risk-based maintenance, total productive maintenance, risk- and reliability-based maintenance, etc., draw from existing maintenance approaches using system reliability analysis to provide a tailored maintenance system [27]. RCM was developed in the aviation industry and United States Navy in the 1970s [47] provides clear intersection on the combination of various maintenance strategy and used of reliability tools. Moreover, maintainability analysis carried out at the design stage of products or platforms such ships or aircraft and other complex machinery are carried out with the use of reliability analysis tools such as FTA, DFTA, BBN, etc. [8,12]. An overview of the adopted tools in this research is given.
2.2.1. Fault Tree Analysis
Fault tree analysis (FTA) is a graphical method of analysing and presenting how a system or piece of equipment may fail. FTA was developed using a deductive approach that began with the main fault, known as TOP EVENT, and progressed to the propagated events, known as Primary or Basic Event [48]. Low-level events are further classified into basic, house, conditional, and underdeveloped events, which can be thought of as fault conditions that preside over the top event [49]. Simply put, the fault tree depicts the propagation of lower-level events that result in a system-wide undesirable or top event. As a result, FTA uses logic gates and events to present failure patterns on systems or equipment for both quantitative and qualitative analysis. Fault tree analysis (FTA) is a static method for analysing component faults in systems or equipment by identifying all possible causes of likely failures and impacts on the system through the logical analysis of dependencies of basic events that lead to the undesired event, the top event of the fault tree [50].
The primary objective of fault tree analysis (FTA) is to assess the likelihood of the top event occurring and illustrate the sequence of events that could lead to the occurrence of the top event [51]. Before entering numerical data into a fault tree, it is advisable to conduct a qualitative analysis using the FTA logic structure. Therefore, to calculate the likelihood of the top event happening, it is necessary to generate quantitative information about the system’s reliability and maintainability, such as the probability of failure, failure rate, or repair rate. This information will then be used as inputs for the qualitative analysis of failures. However, FTA has some shortcomings regarding sequence dependencies, temporal order of occurrence, and redundancies due to standby systems; consequently, DFTA was developed to overcome these constraints in the static FTA.
2.2.2. Dynamic Fault Tree Analysis
Dynamic FTA is an improvement over the static FTA tool; it is an equally important tool for reliability and risk analysis as it provides critical information on system component failure development. DFTA is so significantly improved over the static FTA such that in addition to prioritising the importance of the contributors to the undesired events, it also considers time and sequence dependencies [52]. Moreover, it uses Boolean law by applying gates and events to describe faulty components and possible event(s) that could develop a fault, as well as Markov Chains for the state probability occurrence among multiple events [53], hence accounting for sequence- and time-dependent analysis. The dynamic gates, which include the priority and gate (PAND), sequence enforcing gate (SEQ), functional dependency gate (FDEP), spare gate (SPARE), and the spare event, when added to the FTA structure, become dynamic FTA [50].
In the PAND gate, events are prioritized from left to right such that the left most event (fault) is considered first before the next; similarly, SEQ considers events in left to right fashion; however, rather than prioritizing, it enforces, thus ensuring that events follow the expected failure mechanism [54]. On the other hand, FDEP evaluate events from left to right considering the occurrence of primary or causal event, which is independent of other faults to the right [55]. The SPARE gate and event have unique attributes and functions; though events are evaluated from left to right as obtained in other gates, the dormancy factor feature of the spare event makes lot of difference. The dormancy factor is a measure of the ratio between failure and operational rate of the spare event in the standby mode [50]. A cold spare has dormancy factor 0, a hot spare has dormancy factor 1, and a warm spare has a dormancy factor between 0 and 1 [52].
Overall, DFTA provides a platform that is capable of analysing reparable systems while considering other factors such as dependencies and temporal behaviour or partially operating state analysis [55,56,57]. Therefore, this makes it very relevant in analysing system improvements as presented in [24,55,56,57,58]. Overall, these additional gates provided more scope in DFT analysis [54,59], which can be used to factor repair or improvements due to routine maintenance. Moreover, additional outputs such as the reliability importance measures and minimal cuts sets in the DFTA are equally influenced by the logic structure such of the model, meaning the output of static FT and dynamic in those output will be significantly different and reflective of whatever dependencies exist in the model.
2.2.3. Bayesian Belief Network
Bayesian belief networks (BBNs) provide a good platform for dependability analysis, and cause, effect, and inferential analysis in a wide range of sectors covering health care, human reliability, machinery system reliability, and decision support systems. BBNs are represented as a direct acyclic graph (DAG) which consist of chance nodes (variables) representing possible outcomes of system states and a given set of arrows (connections) indicating dependability/relationships. The nodes can take variable inputs in BBN analysis which can be continues or discreet and are not restricted to single top events, thus providing great flexibility unlike fault tress or RBD [60]. BBNs can be used to represent cause and effect between parts of systems or equipment by identifying potential causes of failure. Authors have used BBNs for fault and diagnostic analysis as well decision support system (DSS), for instance Jun et al. [61] presented a Bayesian-based fault identification system for CBM by discretising continues parameters based on maximum likelihood estimation (MLE) to identify failure conditions; the research used the discretised feature as binary inputs for the BBN conditional probability table (CPT). Similarly, to address port energy efficiency towards the reduction ships emission during port calls, a strategy using BBNs was presented in [62]. This research also explains how BBN conditional probability can efficiently in-cooperate to expert knowledge to provide vital inputs in decision making variables in areas where there is inadequate data or literature.
Bayesian updating or inference provides bases for the use of influence diagrams in decisions analysis by computing the impact of new evidence to the probability of events and the influence on all related nodes [63]. As such, BNs provide a good platform for DSS, especially in maintenance strategy when considering several dependent and independent factors. Conducting system reliability and maintenance analysis demands inputs from multiple sources which the BN platform can accommodate, as compared to other tools. Papers by Jun et al. [61] and Li et al. [64] provide methodologies for the use of BBNs in reliability analysis; however, while [61] focused on fault diagnosis, [64] emphasises component reliability with limited analysis on factors affecting the reliability. Furthermore, BBNs have been used to provide inferential analysis in conjunction with other tools such as the Markov chain and Petri-nets, especially in risk and reliability analysis [60,65,66,67]. BBN-based DSS are widely applied in maritime industry to handle operational issues such as human factors, and procedural issues such as maintenance [67,68]. Similarly, in the field of ship system reliability analysis, Lazakis et al. [56] have presented on the use of BBNs and FTA for ship machinery cooling system reliability analysis and DSS. Likewise, BahooToroody et al. [69] applied a combination BBN and Markov chain Monte Carlo simulation to analyse machinery reliability estimation onboard autonomous ships to help maintenance planning and decision.
Overall, the critical literature review has established the prevalence of the use of multiple tools in reliability and diagnostic analysis by several authors, especially in maintenance planning, to overcome certain restrictions or provide further layers of validation [5]. Therefore, a combination of multiple tools for system reliability analysis has been in practice by many authors, this combination is necessitated by the complex dynamics of fault development and organisational maintenance challenges [24,70]. In this regard, some of the identified gaps in the literature addressed by this paper include assessing the importance of components in relation to system availability, choosing maintenance decisions based on the operator’s sentiment, and using IM obtained from DFTA to build a maintenance DSS using BBN. Therefore, a novel methodology was developed which uses the DFTA outputs as inputs for the BBN maintenance DSS. Similarly, a fault detection model was developed to diagnose the prevalent causes of failure to aid maintenance DSS.
3. Methodology
The research methodology utilises the combined strength of reliability analysis tools for system reliability and criticality, artificial neural network for diagnosis and fault prediction, and Bayesian belief networks for maintenance decision support systems. Maintenance, repair, overhaul, and machinery log data obtained from onboard ship system and machinery were analysed so as to understand the courses of failure in diesel generators, identify the most critical component, and provide possible ways to improve maintenance on board ships. This process would assist both onboard technical staff as well as shore support units. The process of the research involves the collection of machinery data from an offshore patrol vessel (OPV) which were then analysed to generate outputs relevant to machinery health performance indicators. The research has three broad areas which are used as inputs or in combination to analyse the condition of machinery health, as shown in the Figure 2 below. As shown in the figure below, the three areas are the system reliability analysis using DFTA, fault detection and prediction using ANNs, and BBNs for developing a maintenance decision support system.
The data used in this study were obtained through a data collection campaign conducted onboard a Nigerian Navy OPV. It encompassed machinery health and historical data, such as maintenance and overhaul records, repair data, and machinery health records. The dataset covered the machinery log for a period of up to 12 calendar months, along with historical records spanning up to 18 months. The collected machinery log data and a portion of the maintenance and overhaul records were in manuscript form, which necessitated conversion into electronic format. In this regard, data pre-processing played a pivotal role in handling challenges related to missing values and outliers. Various statistical methods were used to interrogate the data; therefore, missing values were filled using linear interpolation, as it provides a more consistent approach for time series data. On the other hand, outlier detection methods were applied based on the specific parameter under analysis. In this regard, given the multidimensionality of the data, a flexible approach to outlier cleaning was adopted, involving the use of the interquartile range (IQR) for natural number values and an iterative approach for numbers less than one. This ensured the cleaned data remained consistent with the original dataset.
3.1. Maintenance and Machinery Health Data Preprocessing
Nonetheless, the approach in data pre-processing helped to address some challenges with regard to missing values, outliers, or ‘not a number’ (NAN) entries. The main approach that used outlier detection was the interquartile range (IQR). Missing values were filled using linear interpolation and, in some cases, forward fill/backward fill was used, especially on variables representing temperature as they can change in no particular patten. Therefore, using this method would help retain the randomness in the time series as regard fault development. These actions were carried out using the MATLAB R2023b software application. Additionally, the feature engineering process to identify the most relevant variables to MDG faults was developed using correlation analysis and is presented in the ANN diagnostics section.
3.2. Dynamic Fault Tree Analysis
Dynamic fault tree analysis (DFTA) is an extension of standard fault tree analysis (FTA) that provides time or sequence dependent analysis and can also prioritise events for analysis. Its flexibility calculation nature allows it to handle failure sequence and time dependent events especially in reparable mechanical systems. Moreover, the spare gates provide the DFTA a unique future that is useful for modelling failures in active, inactive, or warm standby repairable systems. Overall, the addition of four gates and one basic event in the FTA structure has provided a much more flexible way of modelling faults/failures in complex systems with respect to sequence and dependencies in the DFTA. These additions made it possible to consider the temporal order of the occurrence of events including the dependencies in analysis. DFTA is selected for this study in order to utilise its system-dependent relationship on the effect of component failures.
Accordingly, failure and maintenance data over a period of six calendar years, obtained from the maintenance records, were processed to generate components failure rates (⋌) based on Equation (4). The model structure was built suing both static and dynamic FT gates and events to reflect the mode of failures and, in other cases, dependency and sequence. Therefore, top events and sub-events were modelled using dynamic gates while gates connecting to the main system were modelled using static FTs; this procedure is necessary to reduce memory usage and improve calculation time. The probabilities for the static gates used were generally AND gate Equation (5), OR gate Equation (6), and voting gate Equitation (1):
where n is number of failures (106) and is aggregated time in service of individual DG.
The results from the DFTA provides several outputs in addition to the reliability outcomes; further manipulation of the gates such as the spare gates could also be used to model the impact of standby systems and spares, while additional improvements in maintenance activities can also be captured through these processes. Additionally, results that can be obtained from the analysis include the minimal cut set and reliability importance measures.
3.2.1. Importance Measures
Reliability importance measures (IMs) are a means to identify the most critical component or situation that contributes to the occurrence of the basic event leading up to equipment failure or top event occurrence [48,71]. In essence, the IMs help the operators, maintenance crew, and administrators including regulatory agency in the prioritisation of actions that could improve equipment or system reliability. These IMs include Birnbaum (Bir), Fussell-Vesely (F-V), and Criticality (Cri). The Bir IM evaluates the occurrence of the top events based the probability of basic event occurring or not occurring, hence the higher the probability of the basic events the high chances of top event occurring. Criticality (Cri) IMs are calculated in a similar way to the Bir IM except that it considers the probability in the occurrence of the basic event to the occurrences of the top event. On the other hand, the F-V calculation adopts an entirely different approach in that it uses the minimal cut set summation i.e., the minimum number of basic events that contribute to the top event. Therefore, the F-V Ims consider the contribution of the basic event to occurrence of the top event irrespective of how it contributes to the failure.
In this regard, using the Bir IM robust criticality analysis generates more than 290 basic events modelled at component level failures per individual MDG. The Bir calculation method provides more accurate results compared to the other 2 Ims; this is because it considers all possible failures based on their individual contributions and occurrence. Moreover, the use of dynamic gates also provides additional complexity to the calculation in that the location of the event and the type and position of the gates must be considered to calculate the reliability of the component. For instance, some of the drawbacks with the Cri and F-V is the possibility of overlooking or overemphasising faults, which might give rise to high reliability or low reliability. The cut set approach used to determine criticality in F-V method could give rise to false high reliability depending on the connection of the events to the top gate, especially when using non dynamic gates, as it tends to consider only the probability of occurrence against sequences and dependencies. On the other hand, Bir IMs measure the increase in probability of the top event due to the occurrence of an event A, which lies on the critical path of a likely failure event, as presented in Equation (2). Equation (3) solves for local or sub-system level component criticality.
where
- IB(i|t) = Birnbaum criticality at time t;
- h (1i, p(t)) = system reliability when system is functioning.
- h (0i, p(t)) = system reliability when system has failed.
- = Birnbaum importance measures of for event A;
- A = the event whose importance is being measured;
- = the event did occur;
- X = top event.
3.2.2. Minimal Cut Set
A minimal cut set (MCS) is the smallest set of events, which, if they all occur, cause the top event to occur [72]. The qualitative analysis is conducted utilising the DFTA structure, which relies on the logical properties of the gates. On the other hand, the quantitative analysis is based on MRO data, including failure rate, MTBF, and frequency. The quantitative analysis outputs are objective results that include system unreliability, unavailability, and reliability importance measures which provide critical components failures. However, the MCS evaluation is based on the output evaluated using the logic combination of the top event occurrence usually from left to right. Therefore, to obtain the MCS, the DFTA structure representing each MDG was built based on the functional relationship and system boundary of the sub-systems on the respective marine MDGs.
Accordingly, the product of the MCS derived from the evaluated fault tree was used to identify or isolate important failures in a system or sub-system. Moreover, considering that a single basic event can equally form a cut set depending on the arrangement of the fault tree, it goes to show how important the qualitative evaluation of fault trees can be. Figure 3 provides some instance of MCS, such that sub-system 1 having an AND gate fails only when all the events have occurred however the intermediate OR gate fail when any of its BEs occur, while in the case of sub-system 2, the occurrence of BE 7 or BE 8 is an MCS. On the other hand, sub-system 3 has all the BEs as MCS due to the AND top gate. This highlights potential area where improvements can be achieved either through redesign or simply altering the system to improve its reliability.
Using Figure 3 above, the cut sets associated with each of the top events can be calculated as follows:
where
- = the basic event in the group of minimal cut set.
Thereafter, the probabilities of occurrence of the top events can be obtained using Equation (7):
where
- P(TE) = the probability of the occurrence of the top event;
- (Ci …m, i ≠ 0) = cumulative summation of all minimal cut set.
3.3. ANN Diagnostics
Machinery failures frequently exhibit early indicators, enabling operators to foresee potential problems, which, if addressed, could enhance the availability, reliability, and cost-effectiveness of maintenance management. Therefore, gaining comprehension of these indicators can result in enhanced maintenance and operational procedures. A neural network analysis was performed in conjunction with system reliability analysis on MDGs to detect faults associated with system failures. The ANN fault detection model, utilising FFNN, offers comprehensive insights into significant causes of failures.
Feedforward Neural Network
Diagnostics analysis involves recognising patterns in the data that indicates the presence of variations pointing to a change in the normal health parameters of the system or machinery of interest. A supervised ANN feedforward neural network was implemented for the classification analysis. Feedforward ANN is a time series algorithm that can be used for both function fitting and pattern recognition [73]. The feedforward networks usually have single or multilayer hidden sigmoid neurons followed by a series of output neurons. Multiple layers of neurons with nonlinear transfer functions enable the network to learn nonlinear relationships between input and output vectors [74].
A two-layer feedforward network with sigmoid activation and SoftMax output neurons were adopted for the study based on Equation (8). The sigmoid activation function, Equation (9), helps to improve the prediction capability of the neurons by adding bias and non-linearity while the SoftMax activation function, Equation (10), is a probability function with values between 0 and 1, that determines the similarity of the output to the input class. Therefore, highest probability being 1 and vice-versa, both the sigmoid and SoftMax are used for classification problems, and they help improve the model’s capability [36].
4. Case Study
Machinery repair and maintenance data, as well as operational health monitoring data, over a period of six calendar years, were obtained from the power generation system (PGS) of an offshore patrol vessel (OPV). The PGS is only used for electricity generation onboard and is the main source of power to both at sea and at the harbour. The system was design without an emergency MDG; therefore, the four generators are run as main MDGs. These MDGs are rated at 440 Volts, 60 Hertz 3 Phase with a steady load speed of 1800 RPM. The MDGs are 12-cylinder V arrangement and turbo charged with direct sea water intercooler. The main type of fuel type used onboard is low-sulphur fuel oil bunkered via fuel tankers.
4.1. Case Study: Vessel Mission Profile
The vessel selected for this research belongs to the Centenary Class OPVs of the Nigerian Navy. The vessel is mainly engaged in patrol duties typically lasting 3–4 weeks at sea and 2 weeks at harbour. In addition to normal patrols, the vessel can conduct search and rescue operations, oil spill clean-up, and helicopter recovery and launching. Therefore, the MDGs play a central role in the vessel’s operation safety and efficiency, especially during rescue and helicopter operations. As such, the MDGs play a pivotal in the vessel’s overall ability to achieve its operational objectives. Consequently, it is a standard practice in the Navy to run on parallel MDGs while transiting through a channel or in areas with restricted traffic and during close-up situations; hence, this explains the accrued long hours of operation of the MDGs.
It is therefore clear that the MDGs were in high demand, making the PGS the most critical system onboard. Overall, the MDGs have an average monthly running hour of about 160 h per generator. It therefore becomes important to ensure their availability while efficiently putting in place a maintenance strategy that considers the environment. Figure 4 presents utility obtained from the PGS to some major users onboard.
4.2. Case Study: Assumptions and Limitations
Some necessary assumptions were made to enable a more generalised implementation of the methodology on the collected data. In particular, the reliability analysis was conducted using failure rate obtained from MRO of the MDGs over a period of 78 calendar months; hence, the analysis assumes equal operational time distribution among the MDGs. Therefore, failure rates for individual MDGs were assumed to be constant withing the period, while multiple components such as the injector nozzles, valves and tappets were assumed to have identical failure rates. In this regard, these components were model as repeated faults not as individual distinct failures. The quality of maintenance and repair was assumed to be the same irrespective of whether the component was repaired or replaced.
As stated earlier, data collected include MRO and sensor data on machinery health parameters. The MRO was used to generate failure rate for individual MDGs, while the sensor data provided information for machinery diagnostic analysis. Some other details extracted from MRO were on maintenance or repair action taken and possible causes of certain failures; however, these data lack details on routine services and the extent of work performed. Therefore, based on the data collected, the analysis did not explicitly consider issues such as human factors, quality of spares, and environmental impacts on machinery performance or fault. Additionally, performance degradation to establish machinery life was difficult to establish. In this regard, the research only considered machinery health parameters for faut identification in relation to component reliability analysis limited to the case study data.
4.3. Case Study Data Presentation
The case study data obtained from individual MDGs provide details on failure rates, date failure occurred, and action taken as regards either repair or replacement, while the machinery health data contain information on temperature, pressure, and power output. On the other hand, the data did not provide evidence on performance degradation on the MDGs due to the frequency of repair and replacement that are often not clearly captured by the maintenance crew. Consequently, the case study covers mainly reliability and fault identification due to data constraints. In this regard, using the generated data, system reliability and criticality measures are obtained from the DFTA results. The failure rate data obtained from the maintenance records covering about six calendar years were used as input for the DFTA analysis; summary of the failure rates for 4 MDGs is shown Table 1.
Using the failure rate data, the unreliability in the system as well as the machinery were established, while identifying the most critical component in the system or machinery. In addition, the MCS function of the DFTA is relevant in analysing the failure path and possible ways of mitigating them. Furthermore, the output from the DFTA tool, namely, component criticality and cut set, are going to form a very important input for the BBN analysis while the ANN uses parametric data for fault detection analysis. Overall, the MDGs have an average monthly running hours of about 160 h per generator; consequently, it is important to ensure their availability while efficiently putting in place a maintenance strategy that ensures reduced emission from both primary and secondary.
Case Study Diagnostic Data Analysis
In addition to the MRO data, which provide data for the DFTA, machinery health log data for the four MDGs was accessed for the purpose of diagnostics analysis. In this regard, fault identification analysis was carried out using ANN feedforward networks. Machinery health parameters and their limits are presented in Table 2. However, to improve model quality, a correlation analysis was conducted to extract the most relevant futures for the diagnostics analysis; details are provided in Section 5.4.
Therefore, machinery log data collected from the case study ship were used to develop a diagnostic model. Input and response variables were obtained based on the outcome of feature engineering, Table 3 presents the response and predictor variables. The predictor variables represent the most sensitive parameters to the response variable considering the thermodynamics behaviour of diesel engines.
In this regard, the performance of the training process to develop the diagnostic using FFNN is presented in the below figures. Overall, the predictor variables consist of 1090 observations from 7 features, from which only one was used, while the response variable includes 1090 observations from 3 classes. The data was then split into 70% training, 15% validation, and 15% test.
Accordingly, details on the training performance are given in the confusion matrix of the training, validation, and test partitions. The matrices provide the percentage accuracy at each level of the model development, as well as a combined or generic matrix for the 3 levels. Overall, each of the classes had an over 80% score in matrices, which suggest a strong model performance. Furthermore, the combined output of the matrices, as shown in Figure 5, show a collative score for the classes at 83.7%, which proves the quality of the data and the choice of response predictor variables. The overall picture on model accuracy based on the confusion matrix for the diagnostic training model is presented Figure 5.
5. Results and Discussion
This section discusses the results of the case study findings as developed in the methodology section, which began by presenting the DFTA results of the reliability importance measures and the minimal cut set (MCS). The MCSs were used as input for the building maintenance decision support platform using BBN. Thereafter, feature selection and fault identification analysis using FFNN was presented.
5.1. Importance Measures
Reliability importance provide significant insight on component that greatly impacts system failures. The information from the IM can be considered collectively as all subsystems are analysed individually, hence helping to isolate the most critical component to each system, though with the downside of common cause failures. Therefore, using the information from the IM data the maintenance department can help us glean very important aspects on component prone to certain failures, which can help generate spares holding based likely usage patten for onboard usage and shore technical stores. Therefore, instead of considering a single MDG, a collection of all critical components can be made at the fleet level while at the ship or platform MDGs can be considered individually. This brings to light the importance of component criticality to faults mapping, as implemented in this research. Moreover, the overall maintenance platform being developed is geared towards a more flexible maintenance approach that can be updated based on actual machinery operating condition either through manual or automated data imputation. Overall, the IMs in Table 4 represent components that have at least contributed more than 50% of all failures within the period analysed that are common to all the MDGs in the PGS.
The results in the above table provide a list of 19 components that contribute to most failures. Additionally, the components are equally among the most challenging with regard to cost and repair time, except for the oil filter, which is easily replaceable. However, missing the replacement of oil filters could result in undesirable impacts on the condition of the filter that may lead collapse or constriction. These situations can bring about disruption in oil supply to other major parts of the MDG. Consequently, this points to additional risk factors associated to component failures. Therefore, it also becomes important that failures associated with this component are identified, which can be achieved through the MCS.
5.2. Minimal Cut Sets
MCSs obtained through DFTA for individual subsystems had dual purposes: the first was its relevance within the DFTA framework and the second was its use as input to build the BBN probability analysis. The adoption of the MCSs as inputs for the BBN was to ensure that the maintenance DSS is consistent or to translate findings of the DFTA to actionable maintenance decisions. Having this in mind, the MCSs provide very valuable inputs to the maintenance decision support, especially considering the failure relations, such as failures triggered by a fault in another system. Hence, the relevance of investigating interrelationships in component failures becomes critical. Moreover, a lot of failures in main machineries are as result of primary failures in a performance supporting system. An example of this is the crank case failure of the MDGs investigated, which exhibited a concerning low level of reliability due to faults initiated in other system and the crankcase seemed not designed to handle such faults, particularly faults originating from the lubrication and freshwater cooling as well as the air distribution system. This makes it difficult to isolate failure to faults, so the approach in this research is to identify the MCSs, and link the components and their percentage of occurrence, as shown in Table 5. This way, the operators can prioritise maintenance and identify spare parts shortages, as necessary.
Overall, MCSs capture fault formations based on the qualitative structure of the DFTA, thus providing a more structured understanding of failure and fault relationships. For instance, in Table 5, heat exchanger fouling or scaling remains one of the dominant faults, which can be linked to reduced cooling efficiency and possibly failures due to overheating. Similarly, failures related to the top cylinder gasket can be associated with overheating problems due to sea water or freshwater cooling problems. Therefore, we can establish the relationship between a fault and failure based on the percentage influence of the cut set. Failures do not always result in components becoming critical to maintenance, but once they are, these kinds of critical faults can be well planned for, either by adding more repair or inspection or by offering backup systems. Emphasising these kinds of measures could improve monitoring and quick intervention. Moreover, the ability to efficiently identify faults and their possible courses can help address the challenges associated with extended downtime, the cost of repairs, and repair capability, which are major concerns for operators.
5.3. BBN Results
The BBN model for each of the four MDGs was created in two stages. The first stage involved analysing the availability of the subsystem, while the second stage was developing the maintenance decision support system (DSS). The analysis of component availability was conducted using data from MCSs for components that contribute more than 50% chance to the top events occurrence as identified in the DFTA. The CPT tables were filled with data derived from the MCS percentage rates obtained from the DFTA and the corresponding influence of those faults on the components. The BBN also offers the ability to simulate and quantify the influence of CCF on various parts and systems. Thus, minimising redundancy and improving the evaluation of faults’ consequences.
The BBN availability model’s purpose is to investigate the availability of key components in the PGS. This is particularly important because it directly affects the safety of operators, passengers, equipment, and cargo. As a result, the model investigated various failure types and their influence on component availability and MDG. We obtained the components used in the model from DFTA MCS and determined their probability of failure based on the collected MRO data. This input was used to determine the availability of individual MDGs, as presented in Table 6. The overall MDG availability is determined by subsystem availability; this explains the low availability of MDG 3 and 4, which seemed to be influenced by low numbers in fuel and lubricating systems, both of which would have a significant impact on the MDG’s performance and ability to take significant loads. In general, subsystem availability serves as a guide for determining the focus of maintenance efforts. However, to enhance maintenance decision-making, it is necessary to take into account additional factors that impact on the delivery and quality of maintenance.
The maintenance DSS was developed using two major input sources, namely, the availability for the BBN and RPN from the FMECA. It is pertinent to note that the FMECA analysis and results used for the DSS were presented in earlier research by the author. Therefore, details of the FMECA can be obtained via [75]. The relevance of the FMECA is in providing subjective inputs regarding operator sentiment on mission critical component failures to help provide intuition to the overall DSS. Accordingly, four maintenance strategy options were adopted for developing the maintenance DSS; these are corrective action, condition monitoring (ConMon), planned maintenance system (PMS), and delay action. The allocation of an MDG to any of the maintenance strategies is determined by the cumulative availability of the subsystems measured against RPN with a value between 0–100, as defined in Table 7.
The assigned target value for each of the strategies determines how maintenance action, planning, and monitoring should be prioritised. This allows for flexibility regarding the distribution of resources such as personnel, spare parts, logistics, and operational deployment. Furthermore, the high criticality ranking for ConMon indicates the need for additional monitoring approaches, which can include the addition of sensors, increased inspection frequency, or watchkeeping attention. The strategy prioritisation enables placement of the MDGs in the maintenance DSS as a representation of the MDGs cumulative sub-system non-availability. Consequently, the higher the MDG score in a certain strategy, the greater its position within it and the level of maintenance or monitoring required. In this regard, all the MDGs belong to one or all of the four strategy types based on which the maintenance department can plan and make projections.
Figure 6 presents maintenance DSS allocation for the four MDGs, which shows all the MDGs having some form of presence in all of the four strategy types. Overall, the results indicate that corrective action and ConMon are the prepared options for all of the MDGs, with the exception of MDG 1, which has low ConMon values but high PMS. On the other hand, MDG1 and MDG2 were the only ones to appear within the delay action while showing elevated values for both corrective action and ConMon. These findings indicate that the two generators require a significant amount of maintenance. Additionally, MDG1 has a corrective action rate of approximately 54%, while MDG2 has a rate of about 58% in ConMon. However, MDG3 and MDG4 have similar levels of priority, except in PMS, where the numbers for MDG4 are significantly higher than those for MDG3. One possible explanation for this is that MDG1 and MDG2 are situated in the same engine room, just like MDG3 and MDG4. Consequently, owing to the utilisation of common resources like sea chest, ventilation, fuel line, and local stress such as vibration, the generators are prone to experiencing similar patterns of failure. Though some of these findings were not evident to the operators before this research, they were nevertheless consistent with comparable research findings in the shipping industry.
Generally, the analysis indicates how each of the MDGs aligned to a certain maintenance strategy regime as a reflection of its reliability or failure pattens. Therefore, the main determinants are to identify what influences faults leading to failures or high level of unavailability in subsystems. Similarly, the ability to repair the MDGs when failed is an important consideration to make, hence the need to carry out further investigation regarding MDG health parameters to conduct machine learning analysis for fault detection.
5.4. Fault Detection
The fault identification analysis using a feed-forward ANN with two layers based on sigmoid and SoftMax activation functions was used for the classification analysis. A time-series data of about 1000 data points was used; the data were divided into three categories: 70% for training, 15% for validation, and 15% for testing. The anomaly data labels were used for the initial training using MDG 1; this was executed to develop a single model for all four MDGs. Hence, the labelled fault data using temperature fault codes (Temp) was used for fault detection, which contains three fault classes. Accordingly, overall training data utilised 20% of the data from all MDGS added to MDG1 data before splitting, as highlighted earlier. To enable the fault detection model, data threshold values were established, as shown in Table 8.
For the initial training using MDG 1, we used the anomaly data labels presented in Table 9, aiming to develop a single model for all four MDGs. Hence, the labelled fault data using temperature fault codes (Temp) was used for fault detection, which contains three fault classes. Accordingly, overall training data utilised 20% of the data from all MDGS added to MDG1 data before splitting, as highlighted earlier.
Therefore, having established the fault labels for the diagnostic analysis, it is necessary to identify which of the variables can be used a good health indicator. Accordingly, a correlations analysis was conducted for feature selection using the R-values with strongest correlation; this was also backed by personal experience and established industry practice for diagnostic feature selection on MDG. Hence, this provides the foundation for the variable used for the diagnostic analysis, as seen in Figure 7.
In view of the above, fault identification limits were determined by utilising the threshold values specified in Table 8. Therefore, a model was trained using data from MDG 1 and was partitioned as earlier explained. Among the six response variables, LoT had a good R-score against KW, which is the predictor variable, as can be seen in Figure 7. In this regard, the original model training was conducted with LoT as the response variable and KW as the predictor. The model accuracy based on the true positive rate (TPR) and false negative rate (FNR) classes is presented in Figure 8. Overall, the model has achieved more than 97% accuracy between the true and predicted classes in identifying the three classes, namely NML, HTM, and OVH.
The results of the original model using MDG 1 are shown in Figure 9. The fault identification scatter plot indicates that the MDG was operating with relatively elevated temperatures, usually above 80 degrees. Similarly, an indication of abnormally operating condition is the region of overheating situation around 60 kw to 100 kw, as indicated in Figure 9. Moreover, the selection of the LoT as a predictor is premised on its fidelity to indicate performance degradation, as well as the overall health of internal combustion engines especially within the normal operating range as well in overload conditions.
Following the original dataset diagnostics outcome using the LoT, the model was tested using the held partitioned data for the test. The test model prediction of the fault class performed well above 96%, as presented in Figure 10. Going by the test model accuracy, the model seemed to generalise well with major fault classes and is not very different from what was presented in the original model prediction.
The model was deployed on the combined data of the MDGs, and the result remains consistent with both the validation and test data results earlier presented. The prediction model shows more fault detections with improved accuracy, mainly because of improved data presented during both the test and validation phases. Figure 11 shows predictions using the combined data from the MDGs; the plot indicate challenges with the MDGs operating temperature especially around >100 kw. This information provides important confirmation on the operational temperature disparity between the OEM and operator. In this regard, additional investigations were carried out with other response variable to provide some level of validation between the different response variables.
Figure 12 is a diagnostic plot using ETA with the KW predictor variable. The scatter positions are generally similar to that of the LoT, in particular with HTM positions dominate around 100–150 KW output. On the other hand, there seem to be no health indications beyond 180 KW, suggesting that the MDGs hardly produce up to 200 KW. Moreover, the only few scatter positions above 200 KW are that of OVH and possibly misclassified NML.
Overall, scatter plots using the LoT and ETA diagnostic models, as presented in this research, have good fitness for fault detection. Though each of the plots presented varying levels of intensity regarding the fault classes and common regions that the MDGs tend to deviate from an acceptable or normal operating range, the two plots clearly identified the HTM positions at nearly the same points in the plot, though with varying clarity. Accordingly, the findings confirm the low reliability and criticality of both the cooling and lubricating systems, thereby establishing a reasonable ground for relatively MCS outcomes as well as concerns regarding the cooling system and cylinder head bolts. Therefore, the link between component reliability and fault can be established based on the fact that the MDGs operate most of the time at relatively high temperatures, above the normal operating range but below alarm levels.
Furthermore, the component reliability analysis identified components such as the sea chest, FW heat exchanger, tappet clearance, and turbo charger as the most critical to MDG reliability. In the MDG, all of the stated components can be associated with temperature increases and performance degradation. However, since the MDGs are run most of the time at the harbour or when the ship is alongside, this could explain the reliability issues with the sea chest and due to objects in the water.
The fault identification analysis has played a crucial role in pinpointing failure conditions that are associated with reliability outcomes. These results would significantly reinforce the reliability analysis outcome but would also raise the issue of the performance of the MDGs above 50% of the rated output. In fact, the LoT diagnostics analysis and ETA fault identification analysis have both identified the maximum loads the MDGs overheat. In general, using both ETA and LoT, the safe working load for the MDGs was between 160 kw and 200 kw, suggesting the MDGs could have been overrated. Therefore, with this finding, it is safe to say that the MDGs are overrated; hence, the operator can decide to take this up with the OEM.
6. Conclusions
This paper presents a hybrid approach that combines dynamic fault tree analysis DFTA, BBNs, and ANNs to analyse system reliability and machinery health degradation. The methodology introduced in the paper serves as a valuable tool for operators and asset managers to enhance maintenance strategies by offering a detailed assessment of component criticality and related faults based on collected data. As the shipping industry faces increasing scrutiny and regulations related to emissions control, efficient maintenance approaches that ensure equipment availability and system reliability while minimizing emissions become crucial. Traditional maintenance methods may not suffice to address these complex challenges. In this regard, to tackle these issues, the study highlights the potential of sensor technologies, reliability, and data analysis in offering efficient solutions for ship maintenance. The hybrid methodology employing DFTA, BBNs, and ANNs was developed to determine component criticality and identify faults.
A case study was conducted on the power generation system of an OPV, which identified critical components and their corresponding faults. These faults had a significant impact on vessel availability and overall system performance. The utilisation of BBN analysis, which includes inputs from the DFTA criticality and MSC, enabled the analysis of sub-system availability and the development of a maintenance decision support system (DSS). The study also assessed the accessibility of MDGs by analysing their individual components and suggesting strategies for upkeep. Overall, corrective action and ConMon were the most preferred options among most MDGs, although their availability differed. Ultimately, an artificial neural network (ANN) was utilised to detect faults, with LoT and ETA serving as a response and KW as predictor. The results indicated that the majority of malfunctions took place when the power output was slightly above 150 KW and associated to high temperature faults. Overall, the main issues identified are overheating and low load carrying capacity of MDGs, contributing to frequent failures affecting key components such as heat exchanger tubes, crankshaft journals, cylinder head bolts and freshwater circulation pump.
Author Contributions
Conceptualisation, A.A.D. and I.L.; methodology, A.A.D. and I.L.; software, A.A.D.; validation, A.A.D.; formal analysis, A.A.D. and I.L.; investigation, I.L. and A.A.D.; resources, A.A.D.; data curation, A.A.D.; writing—original draft preparation, A.A.D.; writing—review and editing, A.A.D. and I.L.; visualisation, A.A.D.; supervision, I.L.; project administration, A.A.D.; funding acquisition, A.A.D. All authors have read and agreed to the published version of the manuscript.
Funding
This research was funded by the Petroleum Technology Development Fund (PTDF) of Nigeria, grant number 17PHD178.
Data Availability Statement
The data presented in this study are available on request from the corresponding author.
Acknowledgments
The author wants to acknowledge and appreciate the support and scholarship funding received from the Federal Government of Nigeria via the Petroleum Technology Development Fund (PTDF) and the Nigerian Navy for providing access to ship data used in the research.
Conflicts of Interest
The funders as well as the data providers had no role in the design of the study, in the collection, analysis, or interpretation of data, in the writing of the manuscript, or in the decision to publish the results.
Abbreviations
| ABS(NS) | American Bureau of Shipping (Nautical System) | ISM code | International Safety Management |
| ANN | Artificial Neural Network | MCS | Minimal Cut Set |
| BBN | Bayesian Belief Network | MTTF | Mean Time to Failure |
| BE | Basic Event | MTBF | Mean Time Between Failure |
| BSI | British Standards Institution | MDT | Mean Down Time |
| CBM | Condition-Based Maintenance | MRO | Maintenance, Repair, and Overhaul |
| CMMS | Computerised Maintenance Management System | NASA | National Aeronautics and Space Administration |
| CPT | Conditional Probability Table | ISO | International Standard Organisation |
| RPN | Risk Priority Number | OEM | Original Equipment Manufacturer |
| OREDA | Offshore and Onshore Reliability Data | OPV | Offshore Patrol Vessel |
| MDG | Marine Diesel Generator | PAND | Priority-AND |
| ETA | Event Tree Analysis | DFTA | Dynamic Fault Tree Analysis |
| DSS | Decision Support System | PMS | Planned Maintenance System |
| GHG | Green House Gas | RCM | Reliability-Centred Maintenance |
| CII | Carbon Intensity Index | UN | United nations |
| EEXI | Energy Efficiency Existing Ship Index | RPM | Revolution Per Minute |
| SOM | Self-Organising Maps | LoP | Lubricating Oil Pressure |
| FFNN | Feedforward Neural Network | FWT(A/B) | Fresh Water Temperature (Bank A/B) |
| FDEP | Functional Dependency | LoT | Lubricating Oil Temperature |
| FMEA | Failure Mode and Effect Analysis | FWP | Fresh Water Pressure |
| FMECA | Failure Mode Effect and Criticality Analysis | EGT(A/B) | Exhaust Gas Temperature (Bank A/B) |
| FTA | Fault Tree Analysis | RH | Running Hours |
| IM | Importance Measure | KW | Kilo Watt |
| IMO | International Maritime Organisation | HRS | Hours |
References
- UNCTAD. Review of Maritime Transport 2022; UNCTAD: Geneva, Switzerland, 2022.
- MEPC.328(76); 2021 Revised MARPOL Annex VI. IMO: London, UK, 2021.
- Stopford, M. Maritime Economics, 3rd ed.; Routledge: London, UK, 2009. [Google Scholar]
- Horvath, S.; Fasihi, M.; Breyer, C. Techno-economic analysis of a decarbonized shipping sector: Technology suggestions for a fleet in 2030 and 2040. Energy Convers. Manag. 2018, 164, 230–241. [Google Scholar] [CrossRef]
- Kang, Y.-J.; Noh, Y.; Jang, M.-S.; Park, S.; Kim, J.-T. Hierarchical level fault detection and diagnosis of ship engine systems. Expert Syst. Appl. 2023, 213, 118814. [Google Scholar] [CrossRef]
- Karatuğ, Ç.; Arslanoğlu, Y.; Soares, C.G. Design of a decision support system to achieve condition-based maintenance in ship machinery systems. Ocean Eng. 2023, 281, 114611. [Google Scholar] [CrossRef]
- Bouman, E.A.; Lindstad, E.; Rialland, A.I.; Strømman, A.H. State-of-the-art technologies, measures, and potential for reducing GHG emissions from shipping—A review. Transp. Res. Part D Transp. Environ. 2017, 52, 408–421. [Google Scholar] [CrossRef]
- Li, Z.; Zhang, D.; Han, B.; Wan, C. Risk and reliability analysis for maritime autonomous surface ship: A bibliometric review of literature from 2015 to 2022. Accid. Anal. Prev. 2023, 187, 107090. [Google Scholar] [CrossRef] [PubMed]
- BS EN 13306:2010; Maintenance-Maintenance Terminology. BSI: London, UK, 2010.
- ISO. Condition monitoring and Diagnostics of Machines—General Guidelines; ISO: Geneva, Switzerland, 2018. [Google Scholar]
- Jimenez, V.J.; Bouhmala, N.; Gausdal, A.H. Developing a predictive maintenance model for vessel machinery. J. Ocean Eng. Sci. 2020, 5, 358–386. [Google Scholar] [CrossRef]
- Hirzinger, B.; Nackenhorst, U. Efficient model-correction-based reliability analysis of uncertain dynamical systems. Acta Mechanica 2023, 235, 1419–1436. [Google Scholar] [CrossRef]
- Zhang, P.; Gao, Z.; Cao, L.; Dong, F.; Zou, Y.; Wang, K.; Zhang, Y.; Sun, P. Marine Systems and Equipment Prognostics and Health Management: A Systematic Review from Health Condition Monitoring to Maintenance Strategy. Machines 2022, 10, 72. [Google Scholar] [CrossRef]
- BahooToroody, A.; Abaei, M.M.; Banda, O.V.; Montewka, J.; Kujala, P. On reliability assessment of ship machinery system in different autonomy degree; A Bayesian-based approach. Ocean Eng. 2022, 254, 111252. [Google Scholar] [CrossRef]
- Aizpurua, J.I.; Knutsen, K.E.; Heimdal, M.; Vanem, E. Integrated machine learning and probabilistic degradation approach for vessel electric motor prognostics. Ocean Eng. 2023, 275, 114153. [Google Scholar] [CrossRef]
- Wang, R.; Chen, H.; Guan, C. A self-supervised contrastive learning framework with the nearest neighbors matching for the fault diagnosis of marine machinery. Ocean Eng. 2023, 270, 113437. [Google Scholar] [CrossRef]
- Cort, S.J. Moving from Planned to Condition Based Maintenance; IMDEX: Singapore, 2017. [Google Scholar]
- Li, N.; Gebraeel, N.; Lei, Y.; Bian, L.; Si, X. Remaining useful life prediction of machinery under time-varying operating conditions based on a two-factor state-space model. Reliab. Eng. Syst. Saf. 2019, 186, 88–100. [Google Scholar] [CrossRef]
- Lazakis, I.; Gkerekos, C.; Theotokatos, G. Investigating an SVM-driven, one-class approach to estimating ship systems condition. Ships Offshore Struct. 2018, 14, 432–441. [Google Scholar] [CrossRef]
- Cipollini, F.; Oneto, L.; Coraddu, A.; Murphy, A.J.; Anguita, D. Condition-Based Maintenance of Naval Propulsion Systems with supervised Data Analysis. Ocean Eng. 2018, 149, 268–278. [Google Scholar] [CrossRef]
- Cipollini, F.; Oneto, L.; Coraddu, A.; Murphy, A.J.; Anguita, D. Condition-based maintenance of naval propulsion systems: Data analysis with minimal feedback. Reliab. Eng. Syst. Saf. 2018, 177, 12–23. [Google Scholar] [CrossRef]
- Velasco-Gallego, C.; Lazakis, I. RADIS: A real-time anomaly detection intelligent system for fault diagnosis of marine machinery. Expert Syst. Appl. 2022, 204, 117634. [Google Scholar] [CrossRef]
- Galar, D.; Kumar, U. Sensors and Data Acquisition. In eMaintenance; Academic Press: Cambridge, MA, USA, 2017; pp. 1–72. [Google Scholar]
- Chen, R.; Zhang, C.; Wang, S.; Zio, E.; Dui, H.; Zhang, Y. Importance measures for critical components in complex system based on Copula Hierarchical Bayesian Network. Reliab. Eng. Syst. Saf. 2023, 230, 108883. [Google Scholar] [CrossRef]
- Velasco-Gallego, C.; Lazakis, I. A real-time data-driven framework for the identification of steady states of marine machinery. Appl. Ocean Res. 2022, 121, 103052. [Google Scholar] [CrossRef]
- Gkerekos, C.; Lazakis, I.; Theotokatos, G. Machine learning models for predicting ship main engine Fuel Oil Consumption: A comparative study. Ocean Eng. 2019, 188, 106282. [Google Scholar] [CrossRef]
- Cheliotis, M.; Lazakis, I.; Theotokatos, G. Machine learning and data-driven fault detection for ship systems operations. Ocean Eng. 2020, 216, 107968. [Google Scholar] [CrossRef]
- Bousdekis, A.; Papageorgiou, N.; Magoutas, B.; Apostolou, D.; Mentzas, G. Enabling condition-based maintenance decisions with proactive event-driven computing. Comput. Ind. 2018, 100, 173–183. [Google Scholar] [CrossRef]
- Galar, D.; Kumar, U. Data Collection. In eMaintenance; Academic Press: Cambridge, MA, USA, 2017; pp. 73–128. [Google Scholar]
- Fuller, A.; Fan, Z.; Day, C.; Barlow, C. Digital Twin: Enabling Technologies, Challenges and Open Research. IEEE Access 2020, 8, 108952–108971. [Google Scholar] [CrossRef]
- Mihanovic, L.R.; Belamaric, G.P. Use of new informtion technologies in the maintenance of ship systems. Pomorstvo 2016, 30, 38–44. [Google Scholar] [CrossRef]
- Patil, C.; Theotokatos, G. Comparative Analysis of Data-Driven Models for Marine Engine In-Cylinder Pressure Prediction. Machines 2023, 11, 926. [Google Scholar] [CrossRef]
- Wu, S.-J.; Gebraeel, N.; Lawley, M.A.; Yih, Y. A Neural Network Integrated Decision Support System for Condition-Based Optimal Predictive Maintenance Policy. IEEE Trans. Syst. Man Cybern. Part A Syst. Hum. 2007, 37, 226–236. [Google Scholar] [CrossRef]
- Raptodimos, Y.; Lazakis, I. Using artificial neural network-self-organising map for data clustering of marine engine condition monitoring applications. Ships Offshore Struct. 2018, 13, 649–656. [Google Scholar] [CrossRef]
- Cheliotis, M.; Gkerekos, C.; Lazakis, I.; Theotokatos, G. A novel data condition and performance hybrid imputation method for energy efficient operations of marine systems. Ocean Eng. 2019, 188, 106220. [Google Scholar] [CrossRef]
- Gurney, K. An Introduction to Neural Networks; Taylor and Francis Group: London, UK, 1997. [Google Scholar]
- Farag, Y.B.; Ölçer, A.I. The development of a ship performance model in varying operating conditions based on ANN and regression techniques. Ocean Eng. 2020, 198, 106972. [Google Scholar] [CrossRef]
- Stetco, A.; Dinmohammadi, F.; Zhao, X.; Robu, V.; Flynn, D.; Barnes, M.; Keane, J.; Nenadic, G. Machine learning methods for wind turbine condition monitoring: A review. Renew. Energy 2019, 133, 620–635. [Google Scholar] [CrossRef]
- Velasco-Gallego, C.; Lazakis, I. Real-time data-driven missing data imputation for short-term sensor data of marine systems. A comparative study. Ocean Eng. 2020, 218, 108261. [Google Scholar] [CrossRef]
- DNV. Data Collection Infrastructure; DNV: Bærum, Norway, 2020. [Google Scholar]
- ISO-19848-2018(E); Ships and Marine Technology—Standard Data for Shipboard Machinery and Equipment. ISO: Geneva, Switzerland, 2018.
- Lazakis, I.; Theotokatos, G.; Barltrop, N.; Dikis, K. Inspection Capabilities for Enhanced Ship Safety. In Proceedings of the 16th International Congress of the International Maritime Association of the Mediterranean, Pula, Croatia, 21–24 September 2015; pp. 775–780. [Google Scholar]
- Eriksen, S.; Utne, I.B.; Lützen, M. An RCM approach for assessing reliability challenges and maintenance needs of unmanned cargo ships. Reliab. Eng. Syst. Saf. 2021, 210, 107550. [Google Scholar] [CrossRef]
- ISO19847; Ships and Marine Technology-Shipboard Data Servers to Share Field Data at Sea. ISO: Geneva, Switzerland, 2018.
- ISO/IEC 19845; Information Technology-Universal Business Language Version 2.1. ISO/IEC: Geneva, Switzerland, 2015.
- Raptodimos, Y. Collection and Analysis of Data for Ship Condition Monitoring aiming at Enhanced Reliability and Safety. In Proceedings of the 26th International Ocean and Polar Engineering Conference, Rhodes, Greece, 26 June–2 July 2016; Volume 4. [Google Scholar]
- NAVSEA. RCM Handbook 2007; NAVSEA: Washington, DC, USA, 2007.
- Jakkula, B.; Mandela, G.R.; N, M.C.S. Reliability block diagram (RBD) and fault tree analysis (FTA) approaches for estimation of system reliability and availability—A case study. Int. J. Qual. Reliab. Manag. 2020, 38, 682–703. [Google Scholar] [CrossRef]
- Chybowski, L.; Gawdzińska, K.; Laskowski, R. Assessing the Unreliability of Systems during the Early Operation Period of a Ship—A Case Study. J. Mar. Sci. Eng. 2019, 7, 213. [Google Scholar] [CrossRef]
- NASA. Fault Tree handbook with Aerospace Applications; NASA: Washington, DC, USA, 2002.
- Byun, S.; Papaelias, M.; Márquez, F.P.G.; Lee, D. Fault-Tree-Analysis-Based Health Monitoring for Autonomous Underwater Vehicle. J. Mar. Sci. Eng. 2022, 10, 1855. [Google Scholar] [CrossRef]
- Relex. Reliability: Practitioner’s Guide; Relex Software Corpoaration: Greensburg, Pennsylvania, 2003; p. 350. [Google Scholar]
- Boudali, H.; Crouzen, P.; Stoelinga, M. Dynamic Fault Tree analysis using Input Output Interactive Markov Chains. In Proceedings of the 37th Annual IEEE/IFIP International Conference on Dependable Systems and Networks (DSN’07), Edinburgh, UK, 25–28 June 2007. [Google Scholar]
- Kabir, S. An overview of fault tree analysis and its application in model based dependability analysis. Expert Syst. Appl. 2017, 77, 114–135. [Google Scholar] [CrossRef]
- Zhou, S.; Ye, L.; Xiong, S.; Xiang, J. Reliability analysis of dynamic fault trees with Priority-AND gates based on irrelevance coverage model. Reliab. Eng. Syst. Saf. 2022, 224, 108553. [Google Scholar] [CrossRef]
- Lazakis, I.; Dikis, K.; Michala, A.L.; Theotokatos, G. Advanced Ship Systems Condition Monitoring for Enhanced Inspection, Maintenance and Decision Making in Ship Operations. Transp. Res. Procedia 2016, 14, 1679–1688. [Google Scholar] [CrossRef]
- Čepin, M.; Mavko, B. A dynamic fault tree. Reliab. Eng. Syst. Saf. 2002, 75, 83–91. [Google Scholar] [CrossRef]
- Turan, O.; Lazakis, I.; Judah, S. Establishing the Optimum Vessel Maintenance Approach Based on System Reliability and Criticality Analysis. In Managing Reliability & Maintainability in the Maritime Industry; RINA SaRS Conference, London, UK, 25 January 2012; Royal Institution of Naval Architects: London, UK, 2012; pp. 59–70. [Google Scholar]
- Ruijters, E.; Stoelinga, M. Fault tree analysis: A survey of the state-of-the-art in modeling, analysis and tools. Comput. Sci. Rev. 2015, 15–16, 29–62. [Google Scholar]
- Kabir, S.; Papadopoulos, Y. Applications of Bayesian networks and Petri nets in safety, reliability, and risk assessments: A review. Saf. Sci. 2019, 115, 154–175. [Google Scholar] [CrossRef]
- Jun, H.-B.; Kim, D. A Bayesian network-based approach for fault analysis. Expert Syst. Appl. 2017, 81, 332–348. [Google Scholar] [CrossRef]
- Canbulat, O.; Aymelek, M.; Turan, O.; Boulougouris, E. An application of BBNs on the integrated energy efficiency of ship–port interface: A dry bulk shipping case. Marit. Policy Manag. 2019, 46, 845–865. [Google Scholar] [CrossRef]
- BayesFusion. GeNIe Modeler; BayesFusion: Pittsburgh, PA, USA, 2020; p. 614. [Google Scholar]
- Li, H.; Soares, C.G.; Huang, H.-Z. Reliability analysis of a floating offshore wind turbine using Bayesian Networks. Ocean Eng. 2020, 217, 107827. [Google Scholar] [CrossRef]
- Don, M.G.; Khan, F. Dynamic process fault detection and diagnosis based on a combined approach of hidden Markov and Bayesian network model. Chem. Eng. Sci. 2019, 201, 82–96. [Google Scholar]
- Khakzad, N.; Khan, F.; Amyotte, P. Safety analysis in process facilities: Comparison of fault tree and Bayesian network approaches. Reliab. Eng. Syst. Saf. 2011, 96, 925–932. [Google Scholar] [CrossRef]
- Kampitsis, D.; Panagiotidou, S. A Bayesian condition-based maintenance and monitoring policy with variable sampling intervals. Reliab. Eng. Syst. Saf. 2022, 218, 108159. [Google Scholar] [CrossRef]
- Ahn, S.I.; Kurt, R.E. Application of a CREAM based framework to assess human reliability in emergency response to engine room fires on ships. Ocean Eng. 2020, 216, 108078. [Google Scholar] [CrossRef]
- BahooToroody, A.; Abaei, M.M.; Banda, O.V.; Kujala, P.; De Carlo, F.; Abbassi, R. Prognostic health management of repairable ship systems through different autonomy degree; From current condition to fully autonomous ship. Reliab. Eng. Syst. Saf. 2022, 221, 108355. [Google Scholar] [CrossRef]
- New, C.; Rob, G. RCM In The Royal Navy—Developing A Risk Based Policy For Integrating Safety And Maintenance Management. In Proceedings of the Managing Reliability and Maintainability in the Maritime Industry, London, UK, 25–26 January 2012. [Google Scholar]
- Daya, A.A.; Lazakis, I. Application of Artifical Neural Network and Dynamic Fault Tree Analysis to Enhance Reliability in Predicitive Ship Machinery Health Condintion Monitoring; GMO-SHIPMAR: Istanbul, Turkey, 2021. [Google Scholar]
- Windchill, P. PTC Windchill Quality Solutions Getting Started Guide, 11th ed.; PTC Winchill Quality Solutions: Boston, MA, USA, 2015; p. 161. [Google Scholar]
- Sazli, M.H. A brief review of feed-forward neural networks. Commun. Fac. Sci. Univ. Ank. 2006, 50, 11–17. [Google Scholar] [CrossRef]
- Sarwar, U.; Muhammad, M.B.; Karim, Z.A.A. Time Series Method for Machine Performance Prediction Using Condition Monitoring Data. In Proceedings of the 2014 International Conference on Computer, Communications, and Control Technology (I4CT), Langkawi, Malaysia, 2–4 September 2014. [Google Scholar]
- Daya, A.A.; Lazakis, I. Developing an advanced reliability analysis framework for marine systems operations and maintenance. Ocean Eng. 2023, 272, 113766. [Google Scholar] [CrossRef]
Figure 1.
Ship Maintenance data Sources.

Figure 2.
Methodology.

Figure 3.
Example of alternative methods of minimal cut set formation.

Figure 4.
Power generation system utility service consumers.

Figure 5.
Training confusion matrix.

Figure 6.
Maintenance DSS choice for all MDGs.

Figure 7.
Correlation Matrix.

Figure 8.
Training model accuracy.

Figure 9.
Original Data Model.

Figure 10.
Test model accuracy.

Figure 11.
Model prediction with LoT.

Figure 12.
Combined MDG data prediction using ETA.


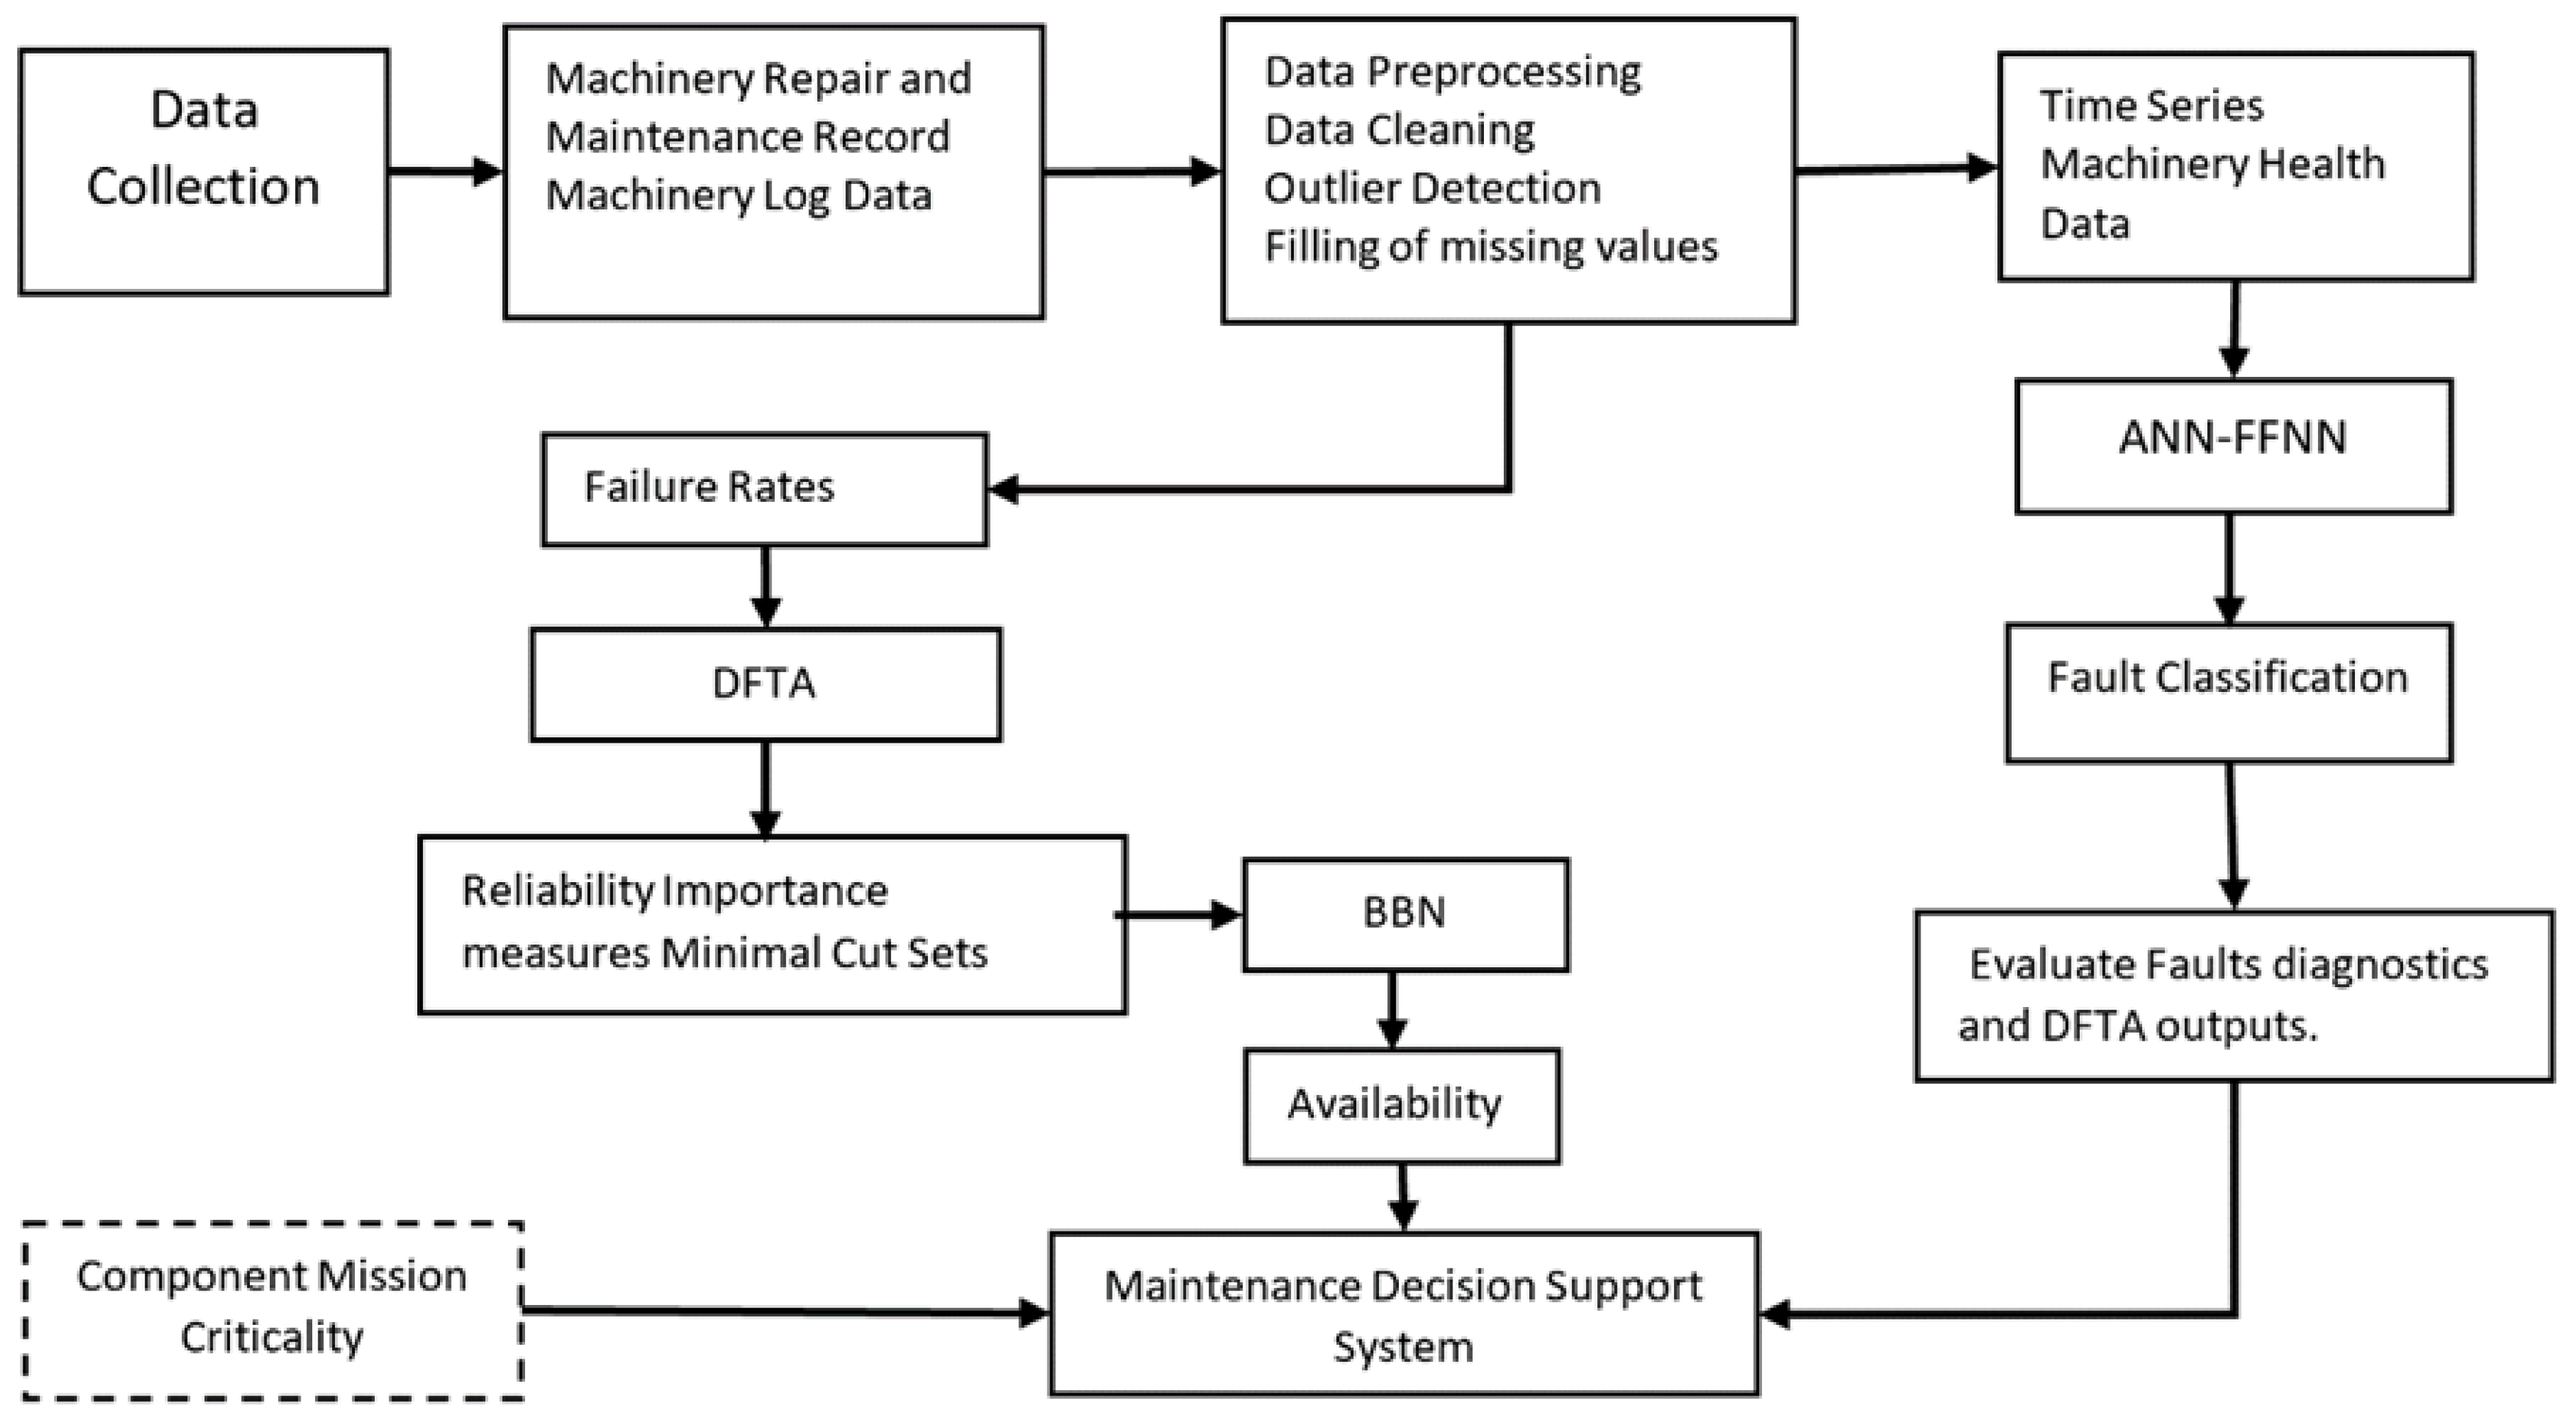
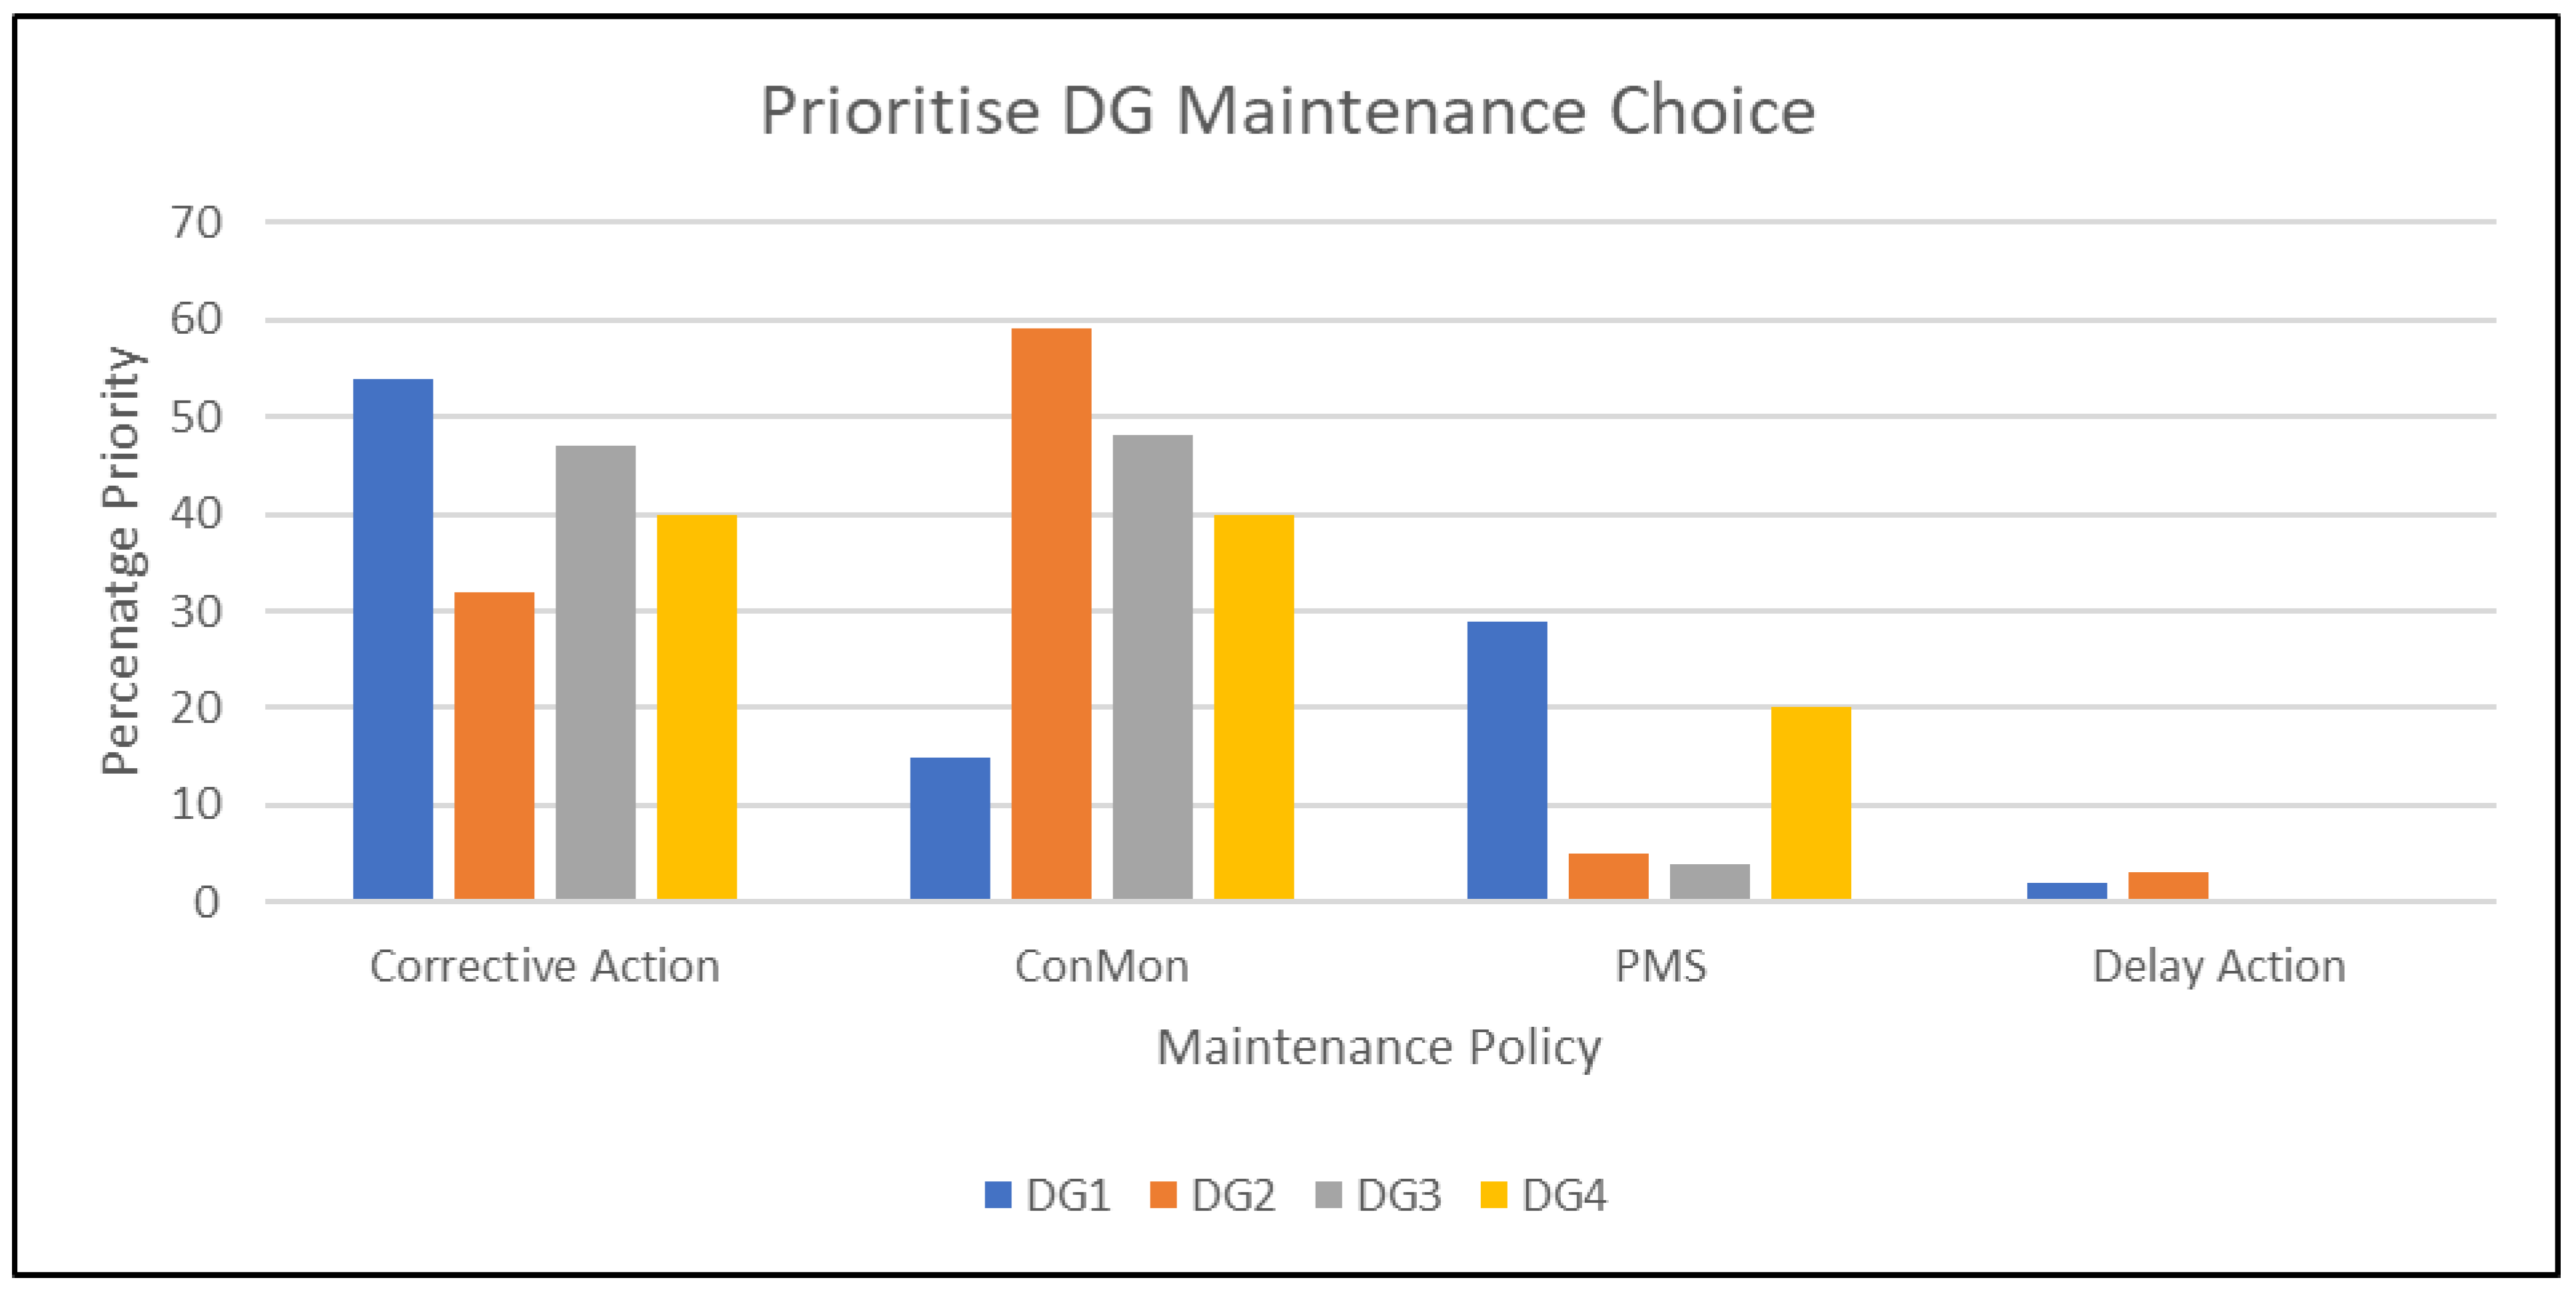
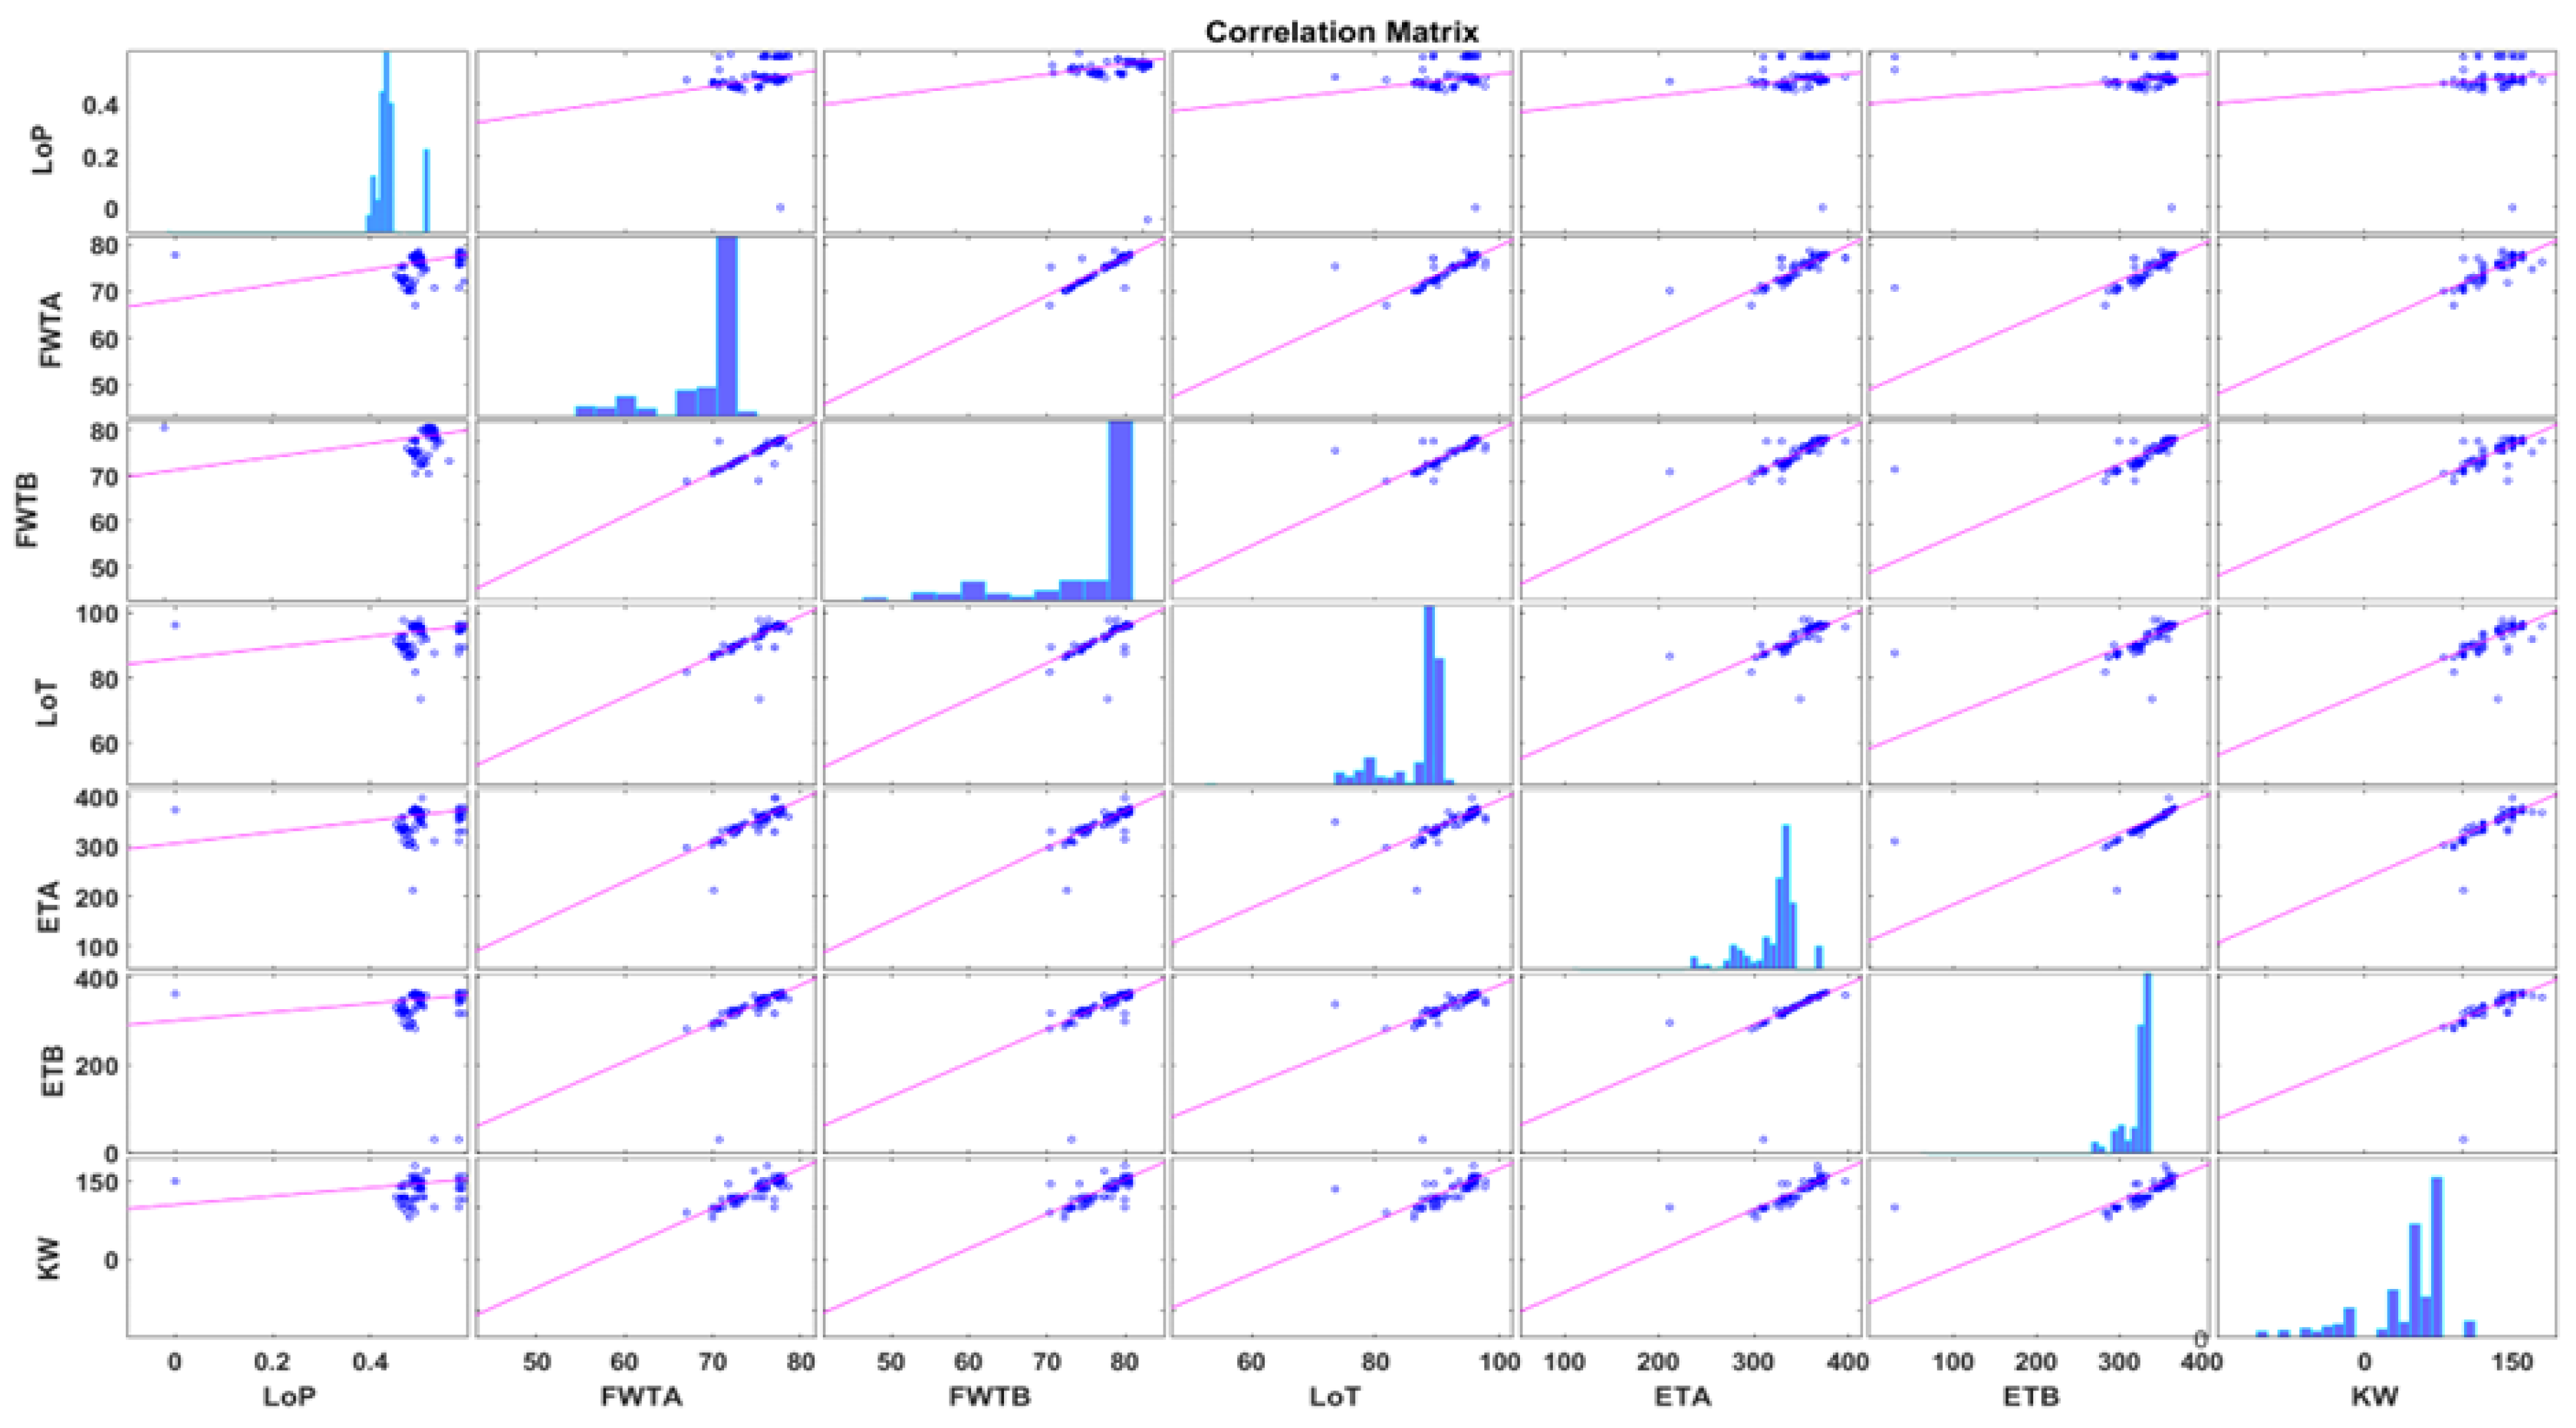
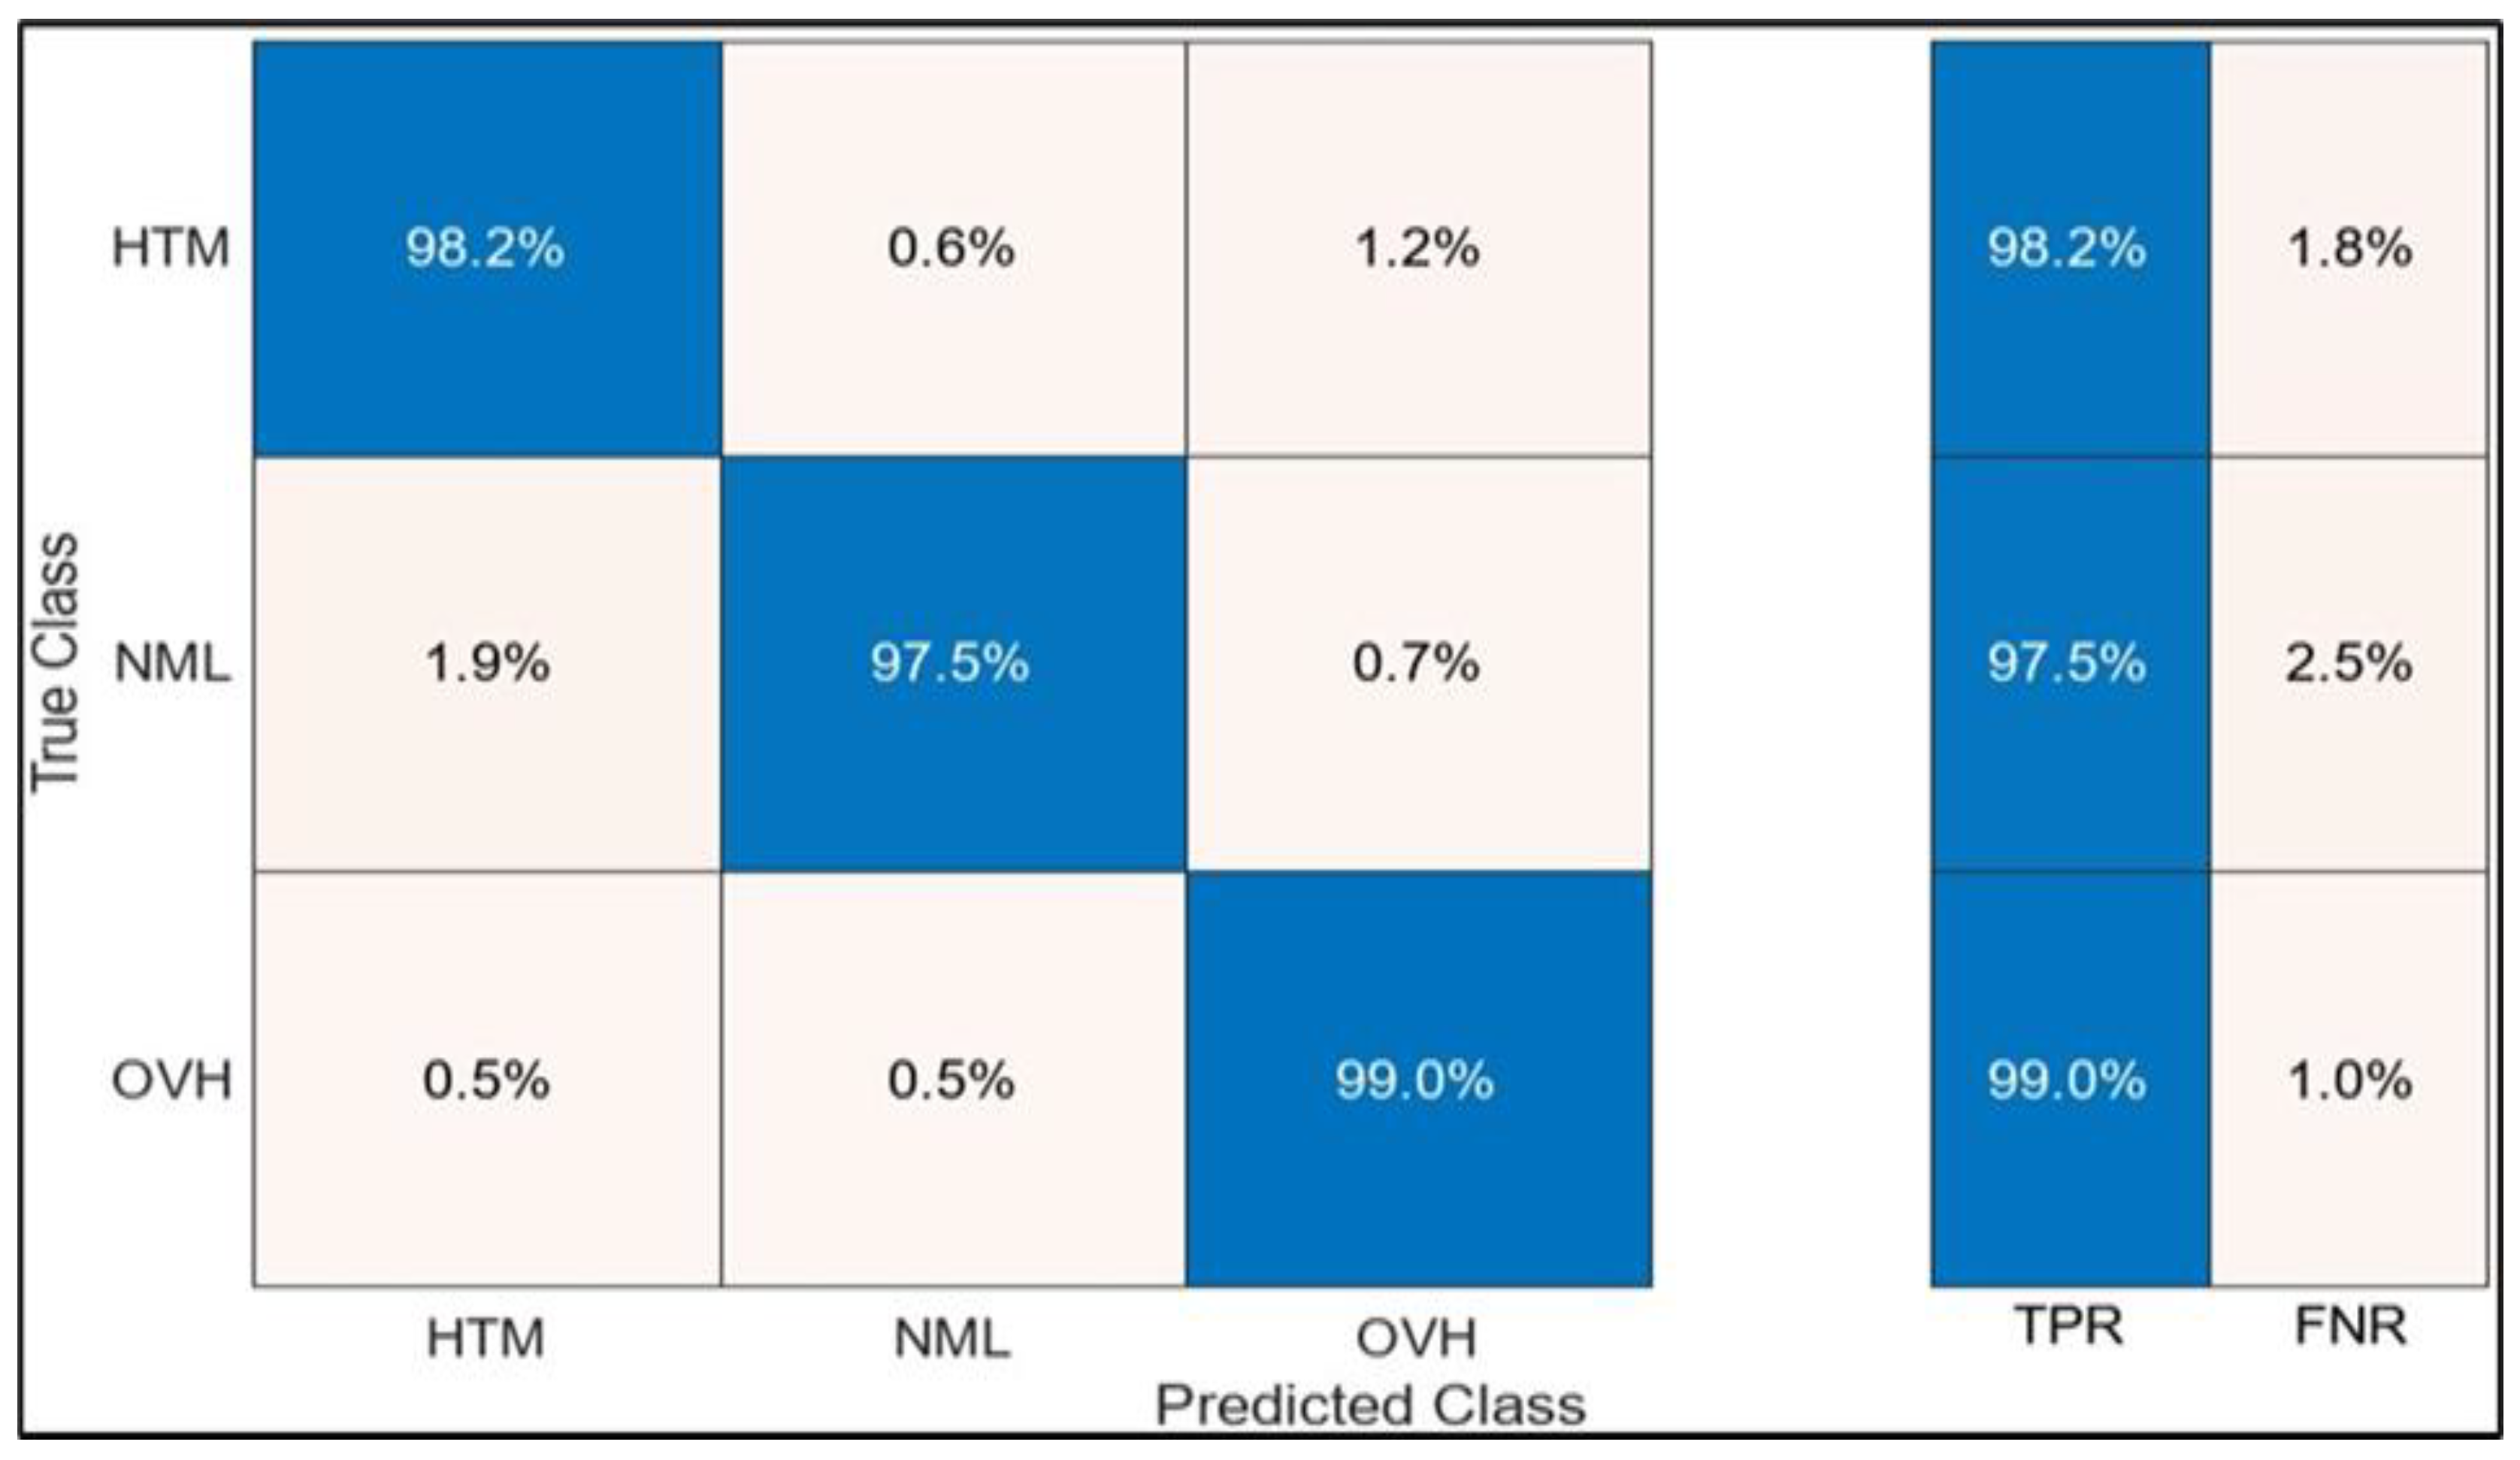
Table 1.
Component failure rate per 10,000/hours for the case study MDGs.
| Components | Frequency | |||||
|---|---|---|---|---|---|---|
| Failure Type | Action Taken | MDG1 | MDG2 | MDG3 | MDG4 | |
| Turbo charger | Black smoke | Replaced, Repaired | 8 | 10 | 12 | 12 |
| Lub oil cooler | Oil leakage | 1. Replaced 2. Cleaned and zinc anode replaced | 16 | 18 | 15 | 16 |
| External leakage | 10 | 8 | 8 | 12 | ||
| Oil cooler valve | failed | Remove/repaired | 1 | 1 | 2 | 1 |
| Cylinder head | 1. Oil leakage 2. Fresh water leakage from A2 exhaust 3. Unable to start | 1.Liner, O-ring replaced (G1 & G3) 2. Cylinder replaced (G3 & G2) replaced gasket (G3) | 20 | 19 | 1 × (A1 & A2) 3 × (A2, liner) 2 × (A2 head) 1 × (A3 & B2 gskt) | 21 |
| Guide bushing | 20 | 14 | 20 | 20 | ||
| O-ring | 28 | 32 | 23 | 23 | ||
| Holding bolts | 18 | 17 | 17 | 16 | ||
| Cylinder jacket/sleeve | 1.Scuffed × 4 2. Cracked × 2 | Replaced | 11 | 12 | 11 | 12 |
| Piston | Rings | Replaced | 12 | 13 | 13 | 14 |
| cooling/crown | 8 | 13 | 15 | 14 | ||
| ConRod | bent | 7 | 9 | 8 | 9 | |
| Gudgeon pin | 8 | 6 | 8 | 6 | ||
| Drive belt | failed | Replaced | 8 | 8 | 9 | 11 |
| Torn(wear) | Replaced | 11 | 5 | 9 | 3 | |
| Mech Injector pump | 1. Cracked bolts 2. Broken bolts 3. Broken shims | 1. Replaced bolt and drive (G1 & G3) 2. Replaced bolt, pulley, and set injector timing (G1 & G2) 3. Replaced shims | 16 | 12 | 12 | 13 |
| Drive | defects | 22 | 20 | 21 | 24 | |
Table 2.
MDG safe health parameters and alarm limit range used for diagnostics.
| No | Parameter | Abbreviation | Operating Ranges | Alarm | |
|---|---|---|---|---|---|
| Min | Max | ||||
| 1 | Lubricating Oil Pressure | LoP | 0.4 Mpa | 0.55 Mpa | >0.6 |
| 2 | Cooling Fresh Water Temperature | FWT(A/B) | 75 °C | 80 °C | >85 °C |
| 3 | Lubricating Oil Temperature | LoT | 30 °C | 110 °C | >120 °C |
| 4 | Fresh Water Pressure | FWP | 0.02 Mpa | 0.25 Mpa | >0.3 |
| 5 | Exhaust Gas Temperature | EGT(A/B) | 220 °C | 400 °C | >520 |
| 6 | Engine Speed | RPM | 1789 RPM | 1850 RPM | 2052 RPM |
| 7 | Power Output | KW | 0 | 440 KVA | 440 Kva |
| 8 | Generator Running Hours | HRS | ≥2000 h | ||
Table 3.
Diagnostics input Variables.
| Variable | Abbreviations | Remarks |
|---|---|---|
| Fresh Water Temperature A-Bank | FWTA | Response Variable |
| Fresh Water Temperature B-Bank | FWTB | Response Variable |
| Exhaust Gas Temperature B-Bank | ETB(EGTB) | Response Variable |
| Exhaust Gas Temperature A-Banks | ETA (EGTA) | Response Variable |
| Lubricating Oil Temperature | LoT | Response Variable |
| Lubricating Oil Pressure | LoP | Response Variable |
| Power Output | Kw | Predictor Variable |
Table 4.
Component High Criticality Across MDGs.
| Component | Criticality |
|---|---|
| Valve Clearance | 0.50 |
| Oil Inlet Hose | 0.52 |
| Primary Fuel Lift Pump | 0.53 |
| Air Filter | 0.55 |
| Primary Fuel Filter | 0.56 |
| Pulley Bolts | 0.58 |
| Fuel Injection Pump Erratic | 0.60 |
| TBC Seal Lub | 0.63 |
| Crank Shaft Main Bearing | 0.63 |
| Top Cylinder Gasket | 0.71 |
| Top Cylinder Bolts | 0.73 |
| Fresh Water Heat Exchanger Tubes (fouled) | 0.78 |
| Crankshaft Journal Failure | 0.82 |
| High Pressure Fuel Pipe | 0.82 |
| Cylinder Block Damage | 0.88 |
| Lub Oil Pump | 0.99 |
| Cylinder Damage | 1 |
| Fresh Water Circulation Pump | 1 |
| Fresh Water Heat Exchanger Tubes (leakages) | 1 |
Table 5.
Most critical MCSs to MDG availability.
| DG1 | % | DG2 | % | DG3 | % | DG4 | % |
|---|---|---|---|---|---|---|---|
| Crankshaft Journal Failure | 49 | Fuel Injection Pump Mechanical Failure | 82 | Crankshaft Journal Failure | 78 | HP Fuel Pipe Leakages | 85 |
| Fuel Filter (1&2) | 87 | FW Heat Exchanger Fouling | 67 | FW Heat Exchanger Fouling | 94 | FW Heat Exchanger Tube Fouling | 70 |
| Sea Chest Blockage | 71 | Tappet Clearance (Inlet and Exhaust Valves) | 82 | RW Impeller Damage | 84 | Rocker Arm and Tappets Clearance | 86 |
| Tappet Clearance (Inlet and Exhaust Valves) | 52 | Burnt Top Cylinder Gasket | 86 | Turbo Charger Lub Failure | 75 | Governor Drive | 77 |
| Cylinder Head Sealing | 75 | Clogged Air Filter | 75 | Cylinder Head Gasket Damage | 72 | Intercooler Fins Fouling | 53 |
| Fuel Lift Pump Defects | 82 | Injector Nozzle Faults | 74 | Injector Nozzles Cylinder | 72 | Turbo Charger | 52 |
| Turbo Charger Leakages | 54 | Clogged Air Filter | 76 | Blacked Fuel Filter | 76 | Cylinder Head Gasket Damage | 73 |
| Cylinder Jacket Cracks | 50 | Oil Filter | 46 | Piston Crown Damage | 87 | Loose Cylinder Head Bolts | 64 |
| Low Fuel Pressure | 63 | No Fuel Supply | 78 | Tappet Clearance | 80 | Clogged Air Filter | 65 |
| RW Water Impeller | 84 | Defective Fuel Pump | 82 | Loose Cylinder Head Bolts | 68 | Injector Camshaft Failure | 54 |
Table 6.
BBN MDG and component availability.
| MDG | MDG1 | MDG2 | MDG3 | MDG4 |
|---|---|---|---|---|
| Individual Availability | 50% | 53% | 48% | 47% |
| Subsystem Availability | ||||
| Cylinder Block | 47% | 43% | 44% | 44% |
| PTO | 60% | 56% | 50% | 60% |
| Cooling | 37% | 39% | 39% | 37% |
| Fuel System | 43% | 45% | 44% | 44% |
| Air Distribution | 50% | 52% | 52% | 42% |
| Lubrication | 62% | 75% | 56% | 55% |
| Inlet and Exhaust | 60% | 63% | 62% | 58% |
| Alternator | 59% | 52% | 59% | 57% |
Table 7.
Developed maintenance strategy definitions and RPN ranges.
| Maintenance Strategy | Definition | RPN Range (0–100) |
|---|---|---|
| Corrective Action | This is recommended for very high to high mission critical component or faults for example sea water supply pump impeller, fuel supply pump, automatic voltage regulator faults, etc. | 75–100 |
| Condition Monitoring | This strategy serves as intervention to ensure system availability targeted at component or failures whose early identification could avert major operational delays. | 55–75 |
| Planned Maintenance System | The PMS maintenance choices prioritise time dependent component failures with no immediate impacts to availability repair requirements. | 35–55 |
| Delay Action | Delay action maintenance choice is directed at those components with good resilience or sufficient redundancy such that there is little or no danger personnel and system safety. | 0–35 |
Table 8.
Limits of data labels used for fault identification.
| Fault | Fault Identity | Fault Parameter | Temperature Ranges (°C) | Operating State |
|---|---|---|---|---|
| Normal Temperature | NTM | Normal Lubricating Oil Temperature | 80–110 | Normal |
| High Temperature | HTM | High Lubricating Oil Temperature | 110–115 | Abnormal |
| Overheating | OVH | Engine Overheating | Max 120 | Fault/Failure |
Table 9.
Fault labels.
| RPM | LoP | FWTA | FWTB | LoT | FWP | EGTA | EGTB | RH | KW | Fault | Temp |
|---|---|---|---|---|---|---|---|---|---|---|---|
| 1800 | 0.458 | 72.9 | 75.4 | 90 | 0.067 | 332.1 | 319.5 | 5234 | 115 | Normal | NML |
| 1800 | 0.465 | 72.8 | 75.3 | 89.9 | 0.068 | 335.3 | 323.9 | 5235 | 120 | Normal | NML |
| 1800 | 0.59 | 72.01 | 74.06 | 89.3 | 0.068 | 329.5 | 316.7 | 5236 | 115 | Fault | HTM |
| 1800 | 0.53 | 70.7 | 73.2 | 87.6 | 0.068 | 310.2 | 29.4 | 5262 | 100 | Normal | NML |
| 1800 | 0.58 | 78 | 80.68 | 96.2 | 0.066 | 366.1 | 355.9 | 5294 | 150 | Abnormal | OVH |
| 1801 | 0.58 | 75.8 | 78.6 | 94.6 | 0.067 | 360.4 | 351.7 | 5298 | 140 | Abnormal | HTM |
| 1800 | 0.504 | 76.2 | 79.1 | 95 | 0.067 | 361.2 | 353.1 | 5299 | 140 | Normal | HTM |
| 1800 | 0.58 | 78.6 | 78.7 | 94.5 | 0.067 | 359.1 | 350.1 | 5300 | 140 | Abnormal | HTM |
| 1800 | 0.502 | 76.2 | 79.1 | 94.8 | 0.067 | 358.3 | 351 | 5201 | 140 | Normal | HTM |
| 1800 | 0.499 | 75.8 | 78.8 | 95.6 | 0.067 | 360.1 | 353.7 | 5302 | 150 | Normal | NML |
| 1800 | 0.488 | 77.8 | 80.5 | 96.1 | 0.066 | 374.2 | 363.3 | 5203 | 140 | Normal | OVH |
| 1800 | 0.498 | 77.3 | 80 | 95.8 | 0.066 | 364.3 | 354.3 | 5204 | 150 | Normal | HTM |
Disclaimer/Publisher’s Note: The statements, opinions and data contained in all publications are solely those of the individual author(s) and contributor(s) and not of MDPI and/or the editor(s). MDPI and/or the editor(s) disclaim responsibility for any injury to people or property resulting from any ideas, methods, instructions or products referred to in the content. |
© 2024 by the authors. Licensee MDPI, Basel, Switzerland. This article is an open access article distributed under the terms and conditions of the Creative Commons Attribution (CC BY) license (https://creativecommons.org/licenses/by/4.0/).
Share and Cite
MDPI and ACS Style
Daya, A.A.; Lazakis, I. Systems Reliability and Data Driven Analysis for Marine Machinery Maintenance Planning and Decision Making. Machines 2024, 12, 294. https://0-doi-org.brum.beds.ac.uk/10.3390/machines12050294
AMA Style
Daya AA, Lazakis I. Systems Reliability and Data Driven Analysis for Marine Machinery Maintenance Planning and Decision Making. Machines. 2024; 12(5):294. https://0-doi-org.brum.beds.ac.uk/10.3390/machines12050294
Chicago/Turabian StyleDaya, Abdullahi Abdulkarim, and Iraklis Lazakis. 2024. "Systems Reliability and Data Driven Analysis for Marine Machinery Maintenance Planning and Decision Making" Machines 12, no. 5: 294. https://0-doi-org.brum.beds.ac.uk/10.3390/machines12050294
Note that from the first issue of 2016, this journal uses article numbers instead of page numbers. See further details here.