Article

In-Situ Geochemical and Rb–Sr Dating Analysis of Sulfides from a Gold Deposit Offshore of Northern Sanshandao, Jiaodong Peninsula, North China: Implications for Gold Mineralization

1
Key Laboratory of Building Structural Retrofitting and Underground Space Engineering, Ministry of Education, Jinan 250101, China
2
School of Civil Engineering, Shandong Jianzhu University, Jinan 250101, China
3
Shandong Institute of Geological Survey, Jinan 250014, China
4
Shandong Institute of Geophysical and Geochemical Exploration, Jinan 250013, China
*
Author to whom correspondence should be addressed.
Submission received: 28 March 2024 / Revised: 22 April 2024 / Accepted: 23 April 2024 / Published: 26 April 2024

Abstract

:
The gold deposit offshore of Northern Sanshandao is an ultra-large-scale gold deposit discovered in the Jiaodong ore area in recent years. This deposit is a fractured-zone altered-rock-type gold deposit; however, its ore genesis and precise mineralization processes are still highly controversial. Based on petrographical observation, the trace elements, sulfur isotopes, and rubidium–strontium isotopes of the gold-bearing pyrite were analyzed using LA-MC-ICP-MS to obtain the source of the ore-forming fluids and ore genesis. The results show that Au has a good positive correlation with Ag, As, and Cu. It is speculated that the As in the pyrite of the gold deposit offshore of Northern Sanshandao is in the form of As, replacing S and entering the pyrite, causing its lattice defects, and thus promoting the entry of Au+ into the gold-bearing pyrite. The Co/Ni ratios mainly range between 0.1 and 10, indicating that the mineralization process has experienced different forms of hydrothermal evolution and the mixing of different fluids. The results of the in-situ sulfur isotope analysis show that pyrite δ34S in the mineralization period is characterized by a high sulfur value. The authors of this study believe that the initial sulfur isotope composition has mantle-derived components. The large-scale, deep cutting, and high degree of fragmentation in the Sanshandao fault zone are conducive to the interaction between fluids and rocks, as well as the mixing and addition of seawater, resulting in the characteristic high δ34S value. The Sr isotopic compositions indicate a crust–mantle mixing attribute of the mineralized material source. The Rb–Sr isochron age of the pyrite is 118.5 ± 0.65 Ma, which represents the age of gold mineralization. According to the characteristics of the trace elements and sulfur isotopes, it is inferred that the gold deposit minerals offshore of Northern Sanshandao originated from deep magmatic-hydrothermal reservoirs, and the mixing of seawater and Au–As-rich hydrothermal fluids was the formation mechanism of huge amounts of gold precipitation.

1. Introduction

The Jiaodong gold province is located on the southeastern edge of the North China Craton (NCC), which is China’s most productive gold province and the third-largest gold mining area in the world [1,2,3,4,5,6,7]. The gold deposit offshore of Northern Sanshandao is an ultra-large-scale gold deposit that was discovered in the Jiaodong ore area in recent years [8]. It is located under the sea north of the Sanshandao gold deposit. This gold deposit is a deep extension of the ore body of the Sanshandao deposit and a typical case for the study of differences in mineralization at different depths in the Sanshandao ore-bearing fault zone.
Researchers have carried out some work on the geological characteristics of ore deposits, ore-controlling structures, and their structural-magmatic backgrounds [8,9,10,11,12,13,14,15]. Previous petrographic and mineralogy studies indicate that the main alteration types are pyritic sericization, sericization, and potassic alteration [8]. Other studies have suggested the unit cell parameters and thermoelectric characteristics of pyrite, and that their alteration is strong in the range of −1200 to −1400 m. In the range of −1200 to −1600 m, sericitolite and pyrite–sericite–quartz-altered rock are rich in As, Ag, Sb, and other low-temperature elements, which have great ore-prospecting potential for ore prospecting in deep areas [10,11]. Regarding ore-forming fluids, it is believed that they have the characteristics of medium temperature, medium–low salinity, medium acidity, and richness in carbonaceous materials [12]. Fluid immiscibility is generally developed in the early and main stages of mineralization. On the basis of fluid immiscibility, the interaction between fluid and surrounding rocks is superimposed, thus enriching and forming gold deposits [12]. During the hydrothermal alteration process, Si, Mg, Ca, and other elements were added, Na was precipitated, and the K content did not change significantly. This is consistent with the hydrothermal alteration characteristics of the Sanshandao gold mineralization belt proposed by researchers [16,17]. However, there has not yet been a systematic study of the gold occurrence status, gold precipitation mechanism, or mineralization age. It is unknown whether there are differences in the mineralization mechanisms between the marine gold deposits offshore and the gold deposits onshore. Therefore, the authors of this study selected the gold deposit offshore of Northern Sanshandao, Jiaodong Peninsula, as the main research object, and researched the geological characteristics of the gold deposit, pyrite trace element characteristics, sulfur isotope composition, and mineralization chronology to understand the alteration rock type of the fracture zone. Theoretical research on gold deposits has become more abundant, which has improved the research level of gold deposits in the Sanshandao gold mineralization belt, providing a theoretical basis for searching for similar types of gold deposits in the area.

2. Regional Geological Background

The gold deposit offshore of Northern Sanshandao is located in the northwest of the Jiaodong Peninsula. In the shallow sea area in the north of Sanshandao Village, the mining area is covered by seawater, with a water depth of 10–15 m. The thickness of the Quaternary strata under the sea is generally 35–40 m, and the thickest position can reach 60 m. The lithology is mainly coarse, medium, and fine sand, and marine deposit silt. The gold deposit belongs to the Jiaoxibei (Laizhou–Zhaoyuan) ore area, and the Precambrian metamorphic rock series strata and Mesozoic intrusive rocks are mainly exposed in this area (Figure 1). The Precambrian metamorphic rock series mainly includes Mesoarchean granulites, metamorphic supracrustal rocks of the Neoarchean Jiaodong Group, and Neoarchean granitic gneiss that intrudes into them. The intrusive rock mass is mainly composed of Late Jurassic granites (165–150 Ma) and Early Cretaceous (132–123 Ma) porphyritic granodiorite. The late Jurassic granites are mainly monzonitic granite, biotite granite, and biotite granite. Early Cretaceous porphyritic granodiorite, as well as lamprophyre, diabase porphyry, quartz diorite porphyry, diorite porphyry, and other dikes, intrude into the Late Jurassic granites. The fault structure is divided into three groups: north–northeast-trending, northeast-trending, and north–northwest-trending. The north–northeast trending fault zone is the main ore-controlling structure in this area. There are three NNE- and NE-trending ore-controlling faults in the area: the Sanshandao fault zones, the Jiaojia fault zones, and the Zhaoyuan–Pingdu fault zones (Figure 1). The gold deposit offshore of Northern Sanshandao is located in the direction in which the Sanshandao fault zones extend to the sea.

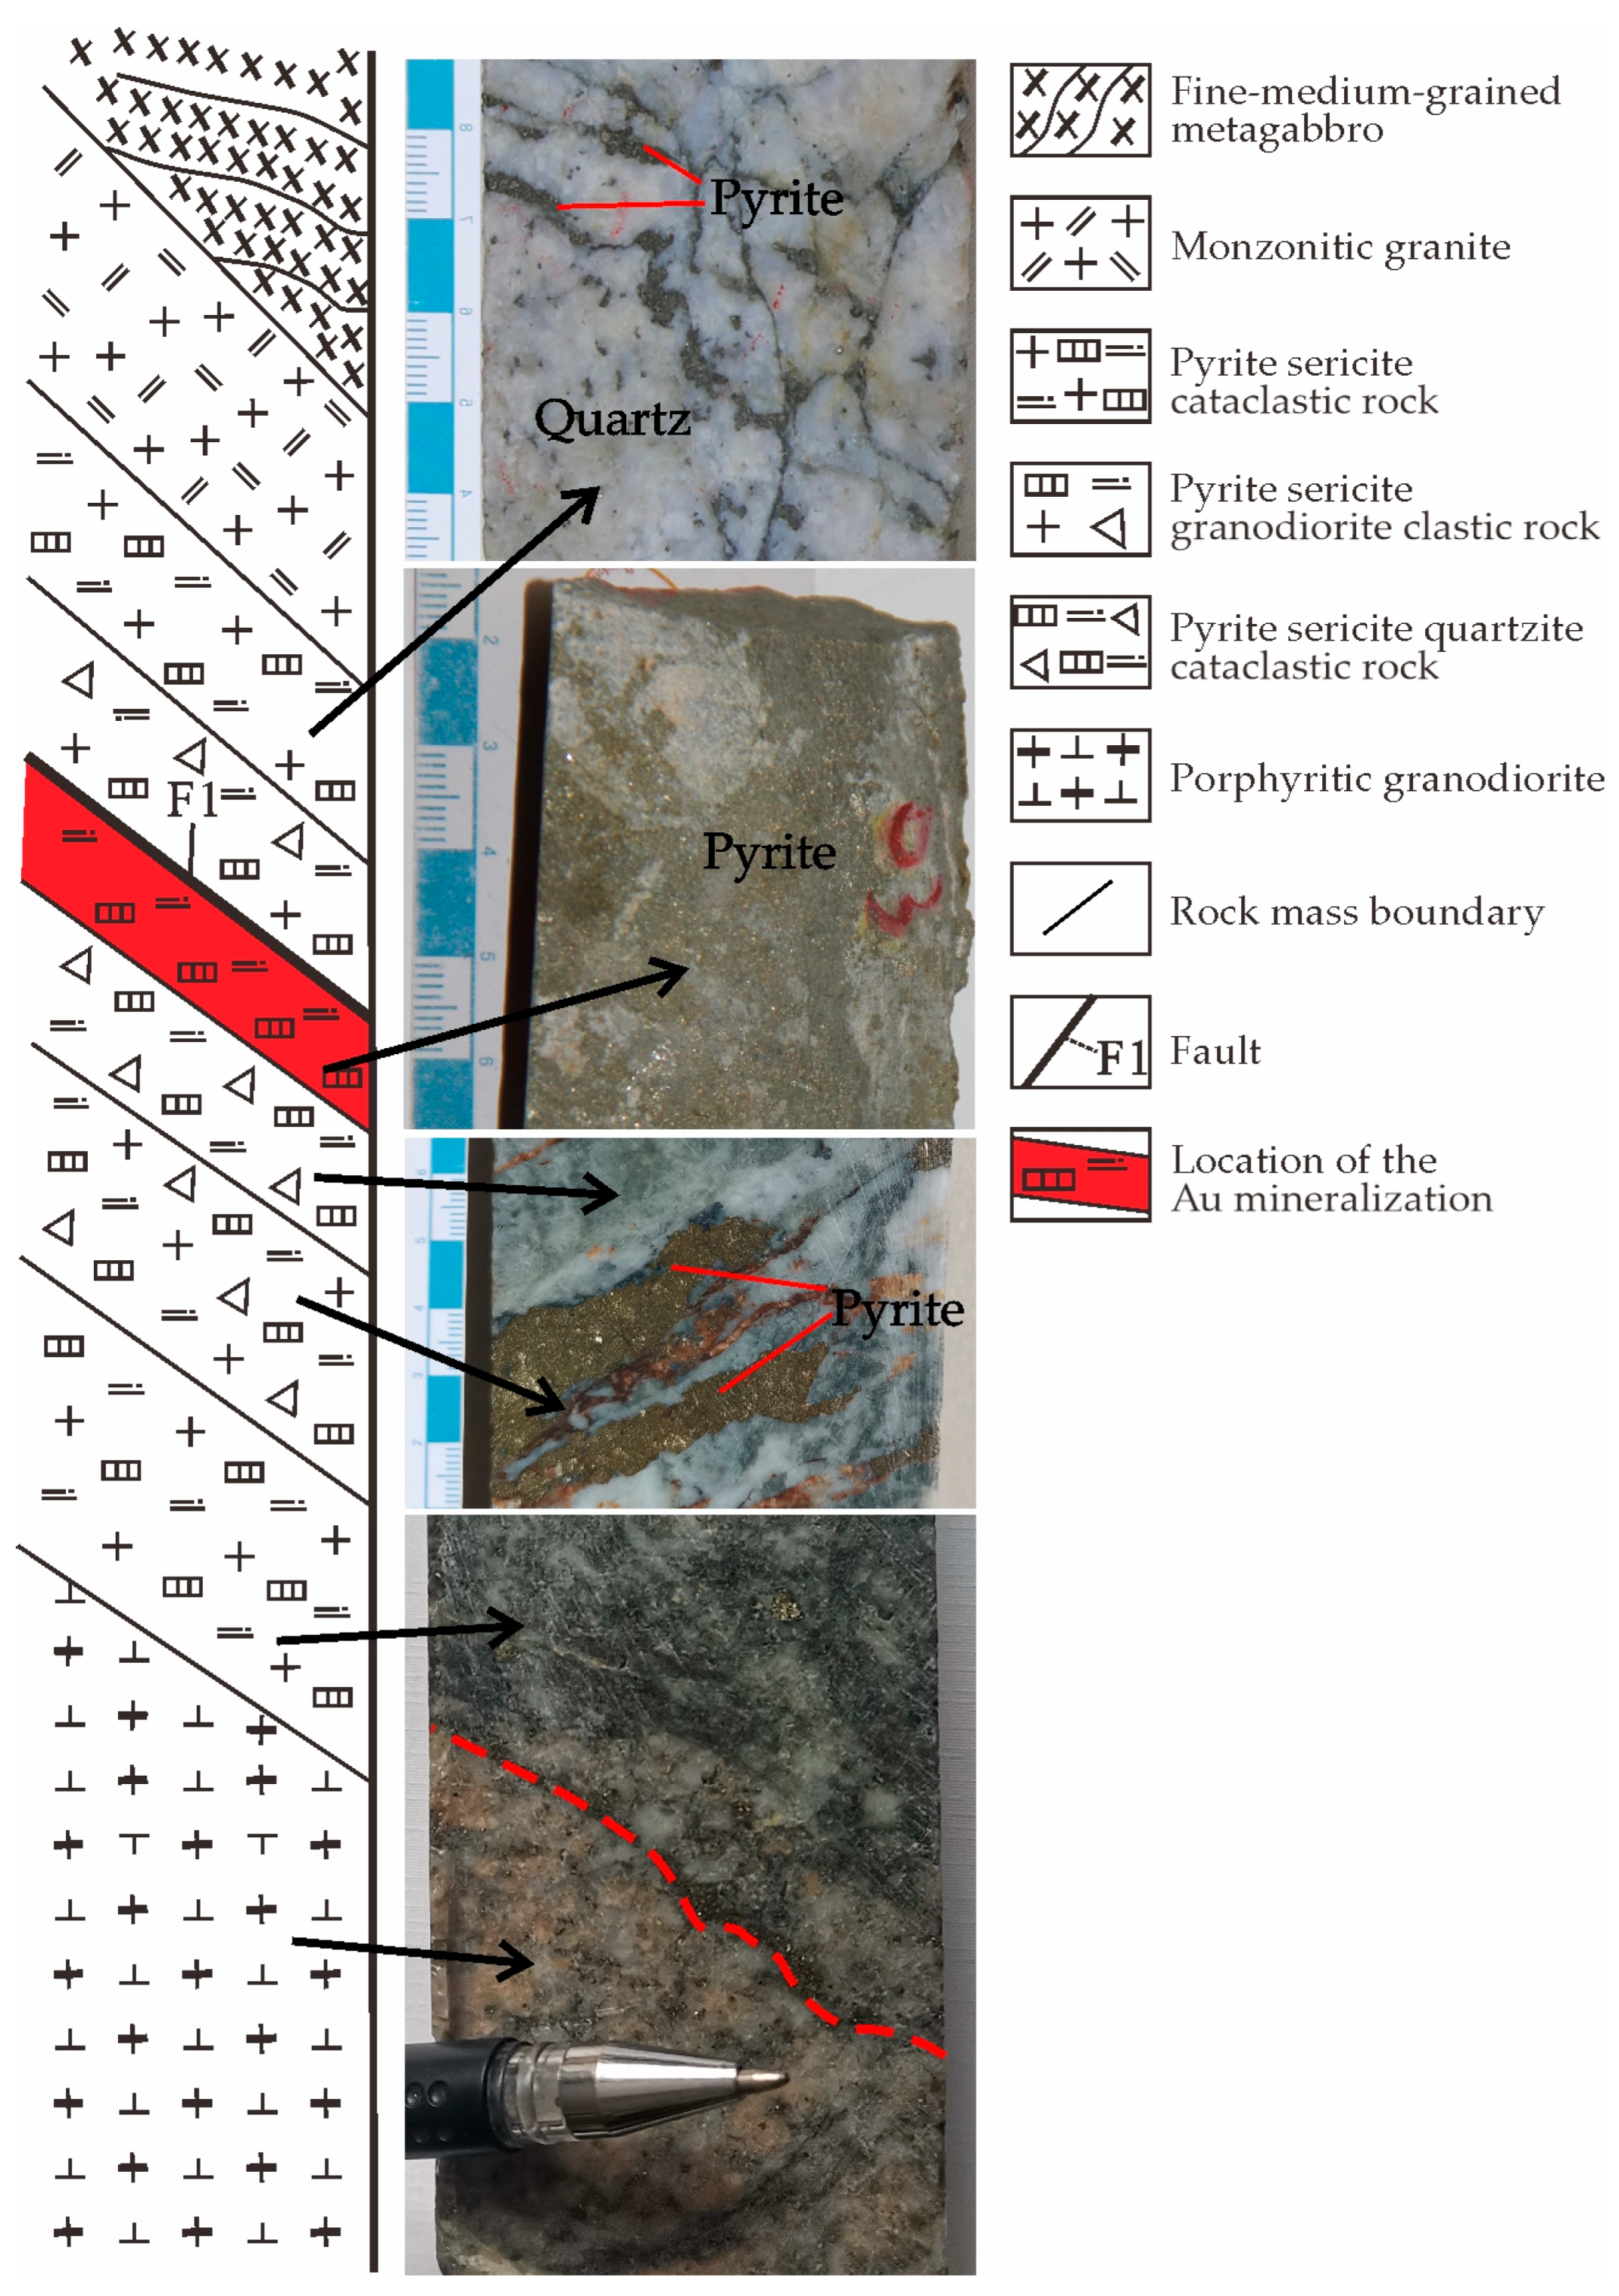
3. Ore Deposit Geology

The magmatic rocks are mainly composed of Early Cretaceous porphyritic granodiorite, Late Jurassic granite, and Neoarchean metagabbro (Figure 2). The Late Jurassic biotite granodiorite is intruded by Early Cretaceous porphyritic granodiorite, and the veinstone mainly consists of lamprophyre, diabase porphyry, quartz diorite porphyry, diorite porphyry, etc. Metagabbro is mainly distributed in the hanging wall of the Sanshandao fault.
The Sanshandao fault is the ore-controlling fault, which strikes about 35° and dips to the southeast. Faults cut the Late Jurassic granite. The alteration and petrogenesis zones are divided along the vertical direction with the main fracture surface as the boundary. From top to bottom, the layers of the rock mass are fine–medium grained metagabbro, monzonitic granite, pyrite sericite cataclastic rocks, pyrite sericite granodiorite clastic rocks, fault gouge, pyrite sericite quartzite cataclastic rocks (pyrite–sericite belt), pyrite sericite granodiorite clastic rocks, pyrite sericite cataclastic rocks, and porphyritic granodiorite, with a gradual transitional contact between the altered rock (Figure 3). Local NW-trending small faults offset the Sanshandao fault.
The metallic minerals are pyrite, galena, and sphalerite, followed by chalcopyrite, arsenopyrite, pyrrhotite, etc. The non-metallic minerals include quartz, sericite, feldspar, and carbonate minerals (calcite, dolomite, siderite, etc.). The prevailing electrum with an Ag content of 6.40 wt% is accompanied by native gold with only 4.30 wt%. The main ore textures are granular metamorphic, fragmented, and metasomatic structures, and a few emulsion droplet structures (Figure 4). The ore structures are mainly disseminated, followed by network vein, breccia, and fine vein structures.
Based on observation of the core samples under a microscope and their identification results, and combined with the mineral texture, structural characteristics, and generation sequence, the mineralization period can be divided into the following four stages: The pyrite–sericite stage (I) is the early stage of mineralization mainly characterized by the irregular granular or euhedral coarse-grained distribution of pyrite, which is disseminated or distributed in a star-like pattern in the sericite. In the quartz–pyrite stage (II), the pyrite is mostly fine-to-medium-grained, isomorphic granular, and significantly more abundant. The coexisting quartz and pyrite form small granular or scattered shapes, fine veins, network veins, etc. This stage is the main stage of mineralization, and gold is distributed throughout the crystals and fissures of pyrite. The gold–quartz–base-metal-sulfide stage (III) is the late stage of mineralization, where base metal sulfide is fine-grained, vein-like, and has a dip distribution. Mineral filling is significant in the middle and late stages of mineralization. The quartz–carbonate stage (IV) is the final stage of mineralization. Carbonate minerals such as quartz and calcite are mostly interspersed in the ore in the form of fine veins, and no gold mineralization occurs.

4. Sampling and Analytical Methods

Typical core samples from the gold deposit offshore of Northern Sanshandao were selected for this study, and the selected samples represent different spatial locations. The samples were polished and sliced for observation and analysis under a microscope. Then, laser ablation inductively coupled plasma mass spectrometry (LA-ICP-MS) was carried out.

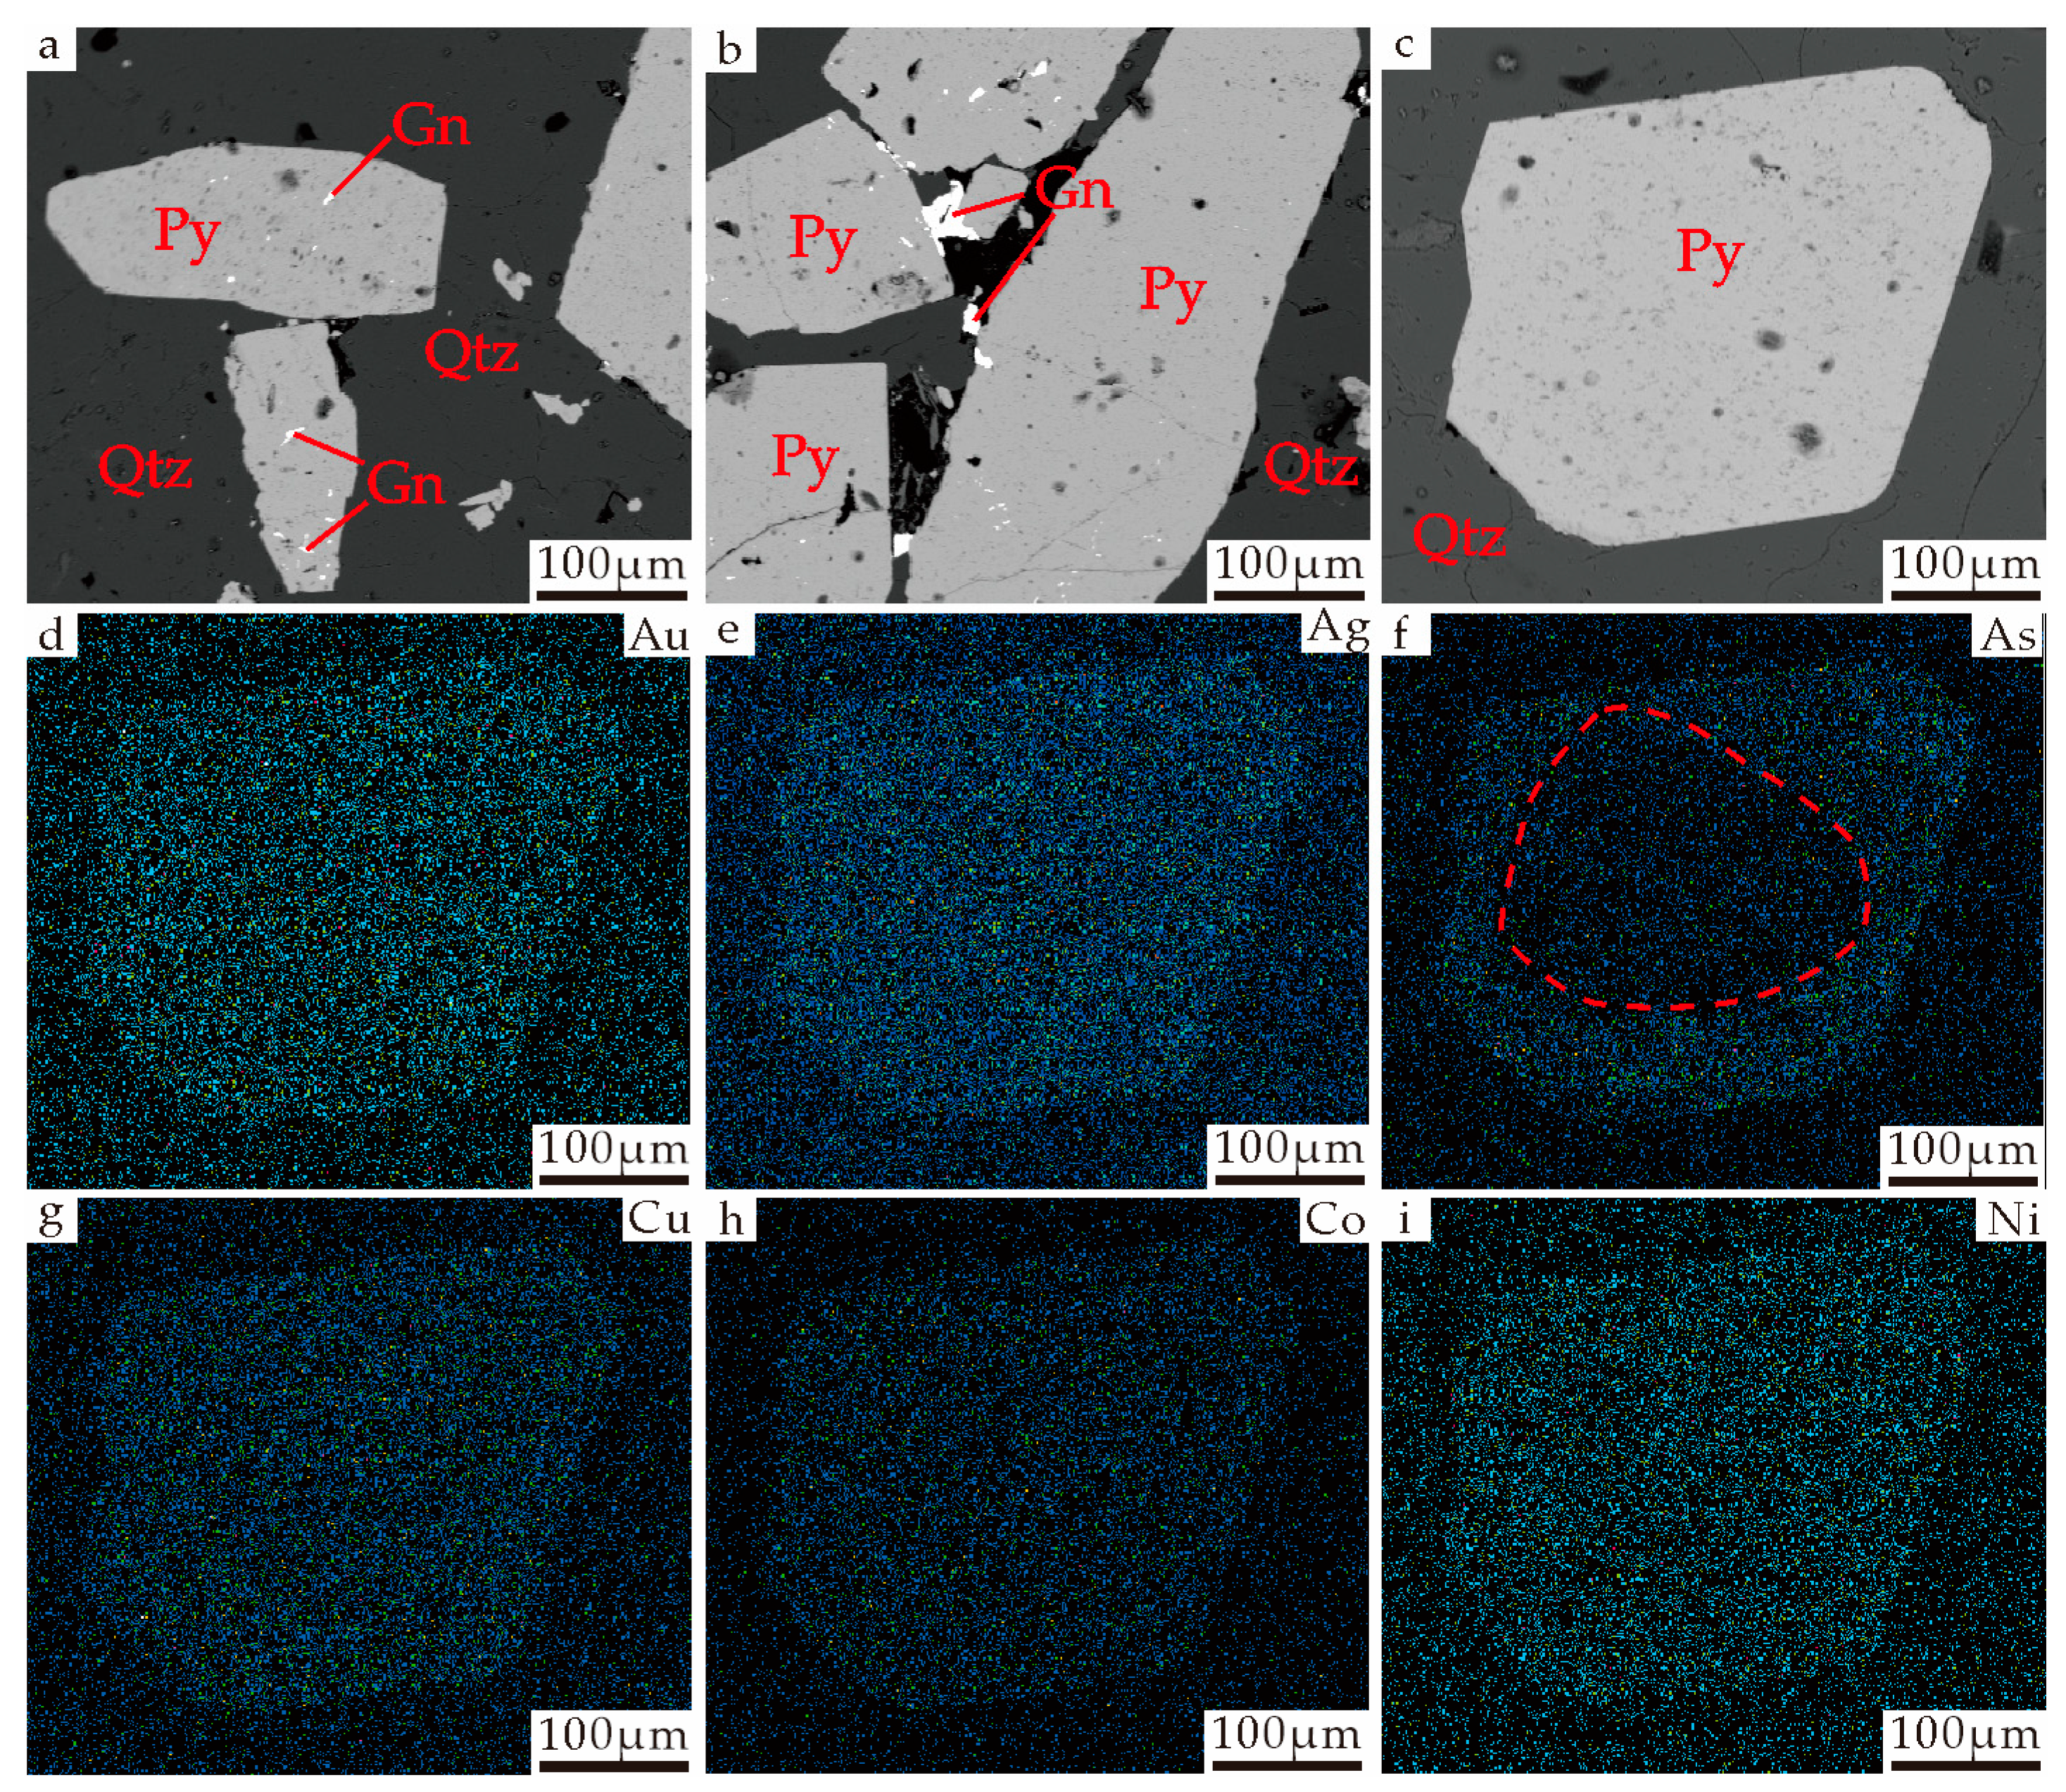
4.1. Backscattered Electron (BSE) Imaging and Wavelength Dispersive Elemental Maps

Backscattered electron (BSE) imaging and wavelength dispersive elemental mapping were carried out at the Key Laboratory of Gold Metallogenic Processes and Deep Prospecting of the Ministry of Natural Resources, Shandong Institute of Geological Sciences (SIGS). The samples were analyzed using electron probe microanalysis and wavelength dispersion spectrometry (EPMA-WDS), and the instrument model was JEOLJXA-8230. The acceleration voltage was 15 kV, the current was 2 × 10⁻⁸ A, and the beam spot diameter was 0.5 μm. The data collection time was 20–60 s. The ZAF method was used to correct the data, and the analysis accuracy was less than 1%. All standard samples used are standard samples from Canada’s Astimex Company. Different standards are used for different elements. Au and Ag use pure metal standards; S and Fe use pyrite; Co uses chloanthite; and Ni uses nickel pyrite; the standard sample used for Cu is cuprite; the standard sample used for Pb is galena.

4.2. In-Situ Trace Element Analysis of Pyrite Using LA-ICP-MS

Trace element analysis of pyrite was conducted using LA-ICP-MS at the Wuhan Sample Solution Analytical Technology Co., Ltd., Wuhan, China. Laser sampling was performed using a GeolasPro laser ablation system, which consisted of a COMPexPro 102 ArF excimer laser (wavelength of 193 nm and maximum energy of 200 mJ) and a MicroLas optical system. An Agilent 7900 ICP-MS instrument was used to obtain the ion signal intensity. Helium was used as the carrier gas. Argon was applied as the supplementary gas and was mixed with the carrier gas through a T-connector before entering the ICP. The laser ablation system contained a “wire” signal-smoothing device [19]. In this study, the laser spot size was set to 5 µm and the frequency to 44 Hz. The trace element composition of pyrite was calibrated against various standards (NIST 610 and NIST 612) without the use of internal standards [20]. The accuracy of the calibration method was verified using MASS-1 (USGS) sulfide standards as unknown samples. Each analysis consisted of approximately 20–30 s of background acquisition, followed by 50 s of data collection from the sample. Offline selection and integration of the background and analytical signals, temporal drift correction, and quantitative calibration for trace element analysis were performed using Excel-based ICPMS-DataCal software [20].

4.3. In-Situ S Isotope Analysis of Pyrite Using LA-MC-ICP-MS

In-situ sulfur isotope analyses of pyrite were performed on a Neptune Plus MC-ICP-MS (Thermo Fisher Scientific, Bremen, Germany) equipped with a Geolas HD excimer ArF laser ablation system (Coherent, Göttingen, Germany) at the Wuhan Sample Solution Analytical Technology Co., Ltd, Hubei, China. In the laser ablation system, helium was used as the carrier gas for the ablation bath, and mixed with argon (supplementary gas) at the end of the ablation bath. The single-spot ablation mode was used. A large spot size (44 μm) and a slow pulse frequency (2 Hz) were used to avoid the downhole chunking effect reported by [21]. One hundred laser pulses were completed in a single analysis. A new signal-smoothing device was used downstream of the sampling unit to effectively eliminate short-term variations in the signal, especially for the slow pulse frequency condition [19]. The laser fluence was constant at 3–5 J/cm2.The Neptune Plus was equipped with nine Faraday cups with 1011 Ω resistors. 32S, 33S, and 34S isotopes were collected in Faraday cups using the static mode. The newly designed X-swept cone and Jet sample cone in the Neptune Plus were used to increase the signal intensity. Nitrogen (4 mL/min) was added to the central airflow to reduce multimer interference. All measurements were performed using medium-resolution rotational power (defined by the peak edge widths ranging from 5% to 95% of the full peak height), which was always greater than 5000.
A standard-sample-bracketing method (SSB) was employed to correct for instrumental mass fractionation. To avoid the matrix effect, a pyrite standard PPP-1 was chosen as the reference material for correcting the natural pyrite. In addition, the in-house references of a pyrrhotite SP-Po-01 (δ34Sv-CDT = 1.4 ± 0.4), a chalcopyrite SP-CP-01 (δ34Sv-CDT = 5.45 ± 0.3), and two synthetic Ag2S standards, IAEA-S-2 (δ34Sv-CDT = 22.58 ± 0.39) and IAEA-S-3 (δ34Sv-CDT = −32.18 ± 0.45), were analyzed repeatedly as unknown samples to verify the accuracy of the calibration method. All data reduction for the MC-ICP-MS analysis of S isotope ratios was conducted using “Iso-Compass” software [22].

4.4. Rb–Sr Dating

Isotope measurements were accomplished on an IsoProbe-T mass spectrometer at the Beijing Institute of Geological Research of the Nuclear Industry, equipped with nine Faraday cups and four ion-counting detectors. Rubidium and strontium isotopes were measured using static multi-reception. The fractionation effects during the strontium isotope measurements were regularized and corrected using 88Sr/86Sr = 8.375219. The strontium isotope composition and strontium concentration were also determined using a computational method established in our laboratory.
We accurately weighed 0.1–0.2 g of the sample powder in a low-pressure closed dissolution jar, added rubidium–strontium diluent, and dissolved it with mixed acid (HF + HNO3) for 24 h. When the sample was completely dissolved and evaporated, we added 6.0 mol/L of hydrochloric acid to convert into chloride for evaporation. Then, it was dissolved with 0.5 mol/L of hydrochloric acid solution and separated using centrifugation. The supernatant was added to a cation exchange column (φ 0.5 × 15.0 cm, AG50W × 8 (H+) 100–200 mesh). The rubidium was drenched with a 2.0 mol/L hydrochloric acid solution, and the strontium was drenched with a 3.0 mol/L hydrochloric acid solution and then evaporated to dryness for mass spectrometry analysis.
Rubidium and strontium isotope analyses were performed using a PHOENIX thermal ionization mass spectrometer with a single-band, M+, adjustable multi-Faraday receiver. Mass fractionation was corrected with 86Sr/88Sr = 0.1194, with the following standard measurements: 87Sr/86Sr = 0.710248 ± 8 for the NBS987 specimen, 87Sr/86Sr = 1.20022 ± 8 for the NBS607 specimen with Rb 522.550 ug/g and Sr 65.511 ug/g; and 87Sr/86Sr = 1.20022 ± 8 with a laboratory process background of Rb 2.0 × 10⁻¹⁰ g and Sr 2.0 × 10⁻¹⁰ g. The detailed experimental separation process and instrument test parameters followed those of previous researchers [23,24].

5. Results

5.1. Wavelength Dispersive Elemental Maps

The analysis results of the wavelength dispersive elemental maps show that if the content of the element in a certain area of the sample is high, the bright spots in the corresponding area of the image are dense. The bright spots of elements such as Au, Ag, and Ni are denser, and the content is higher (Figure 5). Only the As element had an obvious ring structure, and Au, Ag, Cu, and other elements did not show an obvious ring structure (Figure 5d–i). The results indicate that Au–Ag–Cu–Co–Ni in pyrite changes uniformly and has a good positive correlation.

5.2. In-Situ Trace Element Compositions

Pyrite samples from three boreholes were analyzed for trace elements, and the results are shown in Table 1 for a total of 30 analytical points.
Pyrite analytical results from borehole ZK8401 are as follows: The Co content was 3.08−457.00 ppm, with an average of 129.00 ppm. The Ni content was 0.06−58.00 ppm, with an average of 23.97 ppm, except for one point that was lower than the detection limit. The Co/Ni ratio ranged from 1.54 to 87.00, with a large variation, and an average value of 17.35. The Cu content was 0.10−5.16 ppm, with an average of 1.41 ppm. The content of Zn was 0.66–1.36 ppm, with an average of 1.09 ppm. The content of As was 8.74–125.00 ppm, with an average of 37.50 ppm. The content of Ag was lower than the detection limit at all but one point, at which it was 0.07–2.58 ppm, with an average of 0.83 ppm. The content of Sb was below the detection limit at all but three points, at which it was 0.02–0.17 ppm, with an average of 0.08 ppm. The content of Au was below the detection limit at all but two points, at which it was 0.01–0.14 ppm, with an average of 0.04 ppm. The content of Pb was 0.65–107.00 ppm with an average of 25.66 ppm, and the content of Bi was 2.02–43.00 ppm, with an average of 12.11 ppm.
Pyrite analytical results from borehole ZK3612 are as follows: The content of Co was 0.02–47.00 ppm, with an average of 10.27 ppm. The content of Ni was 0.13–25.00 ppm, with an average of 6.58 ppm. The Co/Ni ratio ranged from 0.02 to 16.21, with a large variation, and an average value of 3.42. The content of Cu was 0.19–277.00 ppm, with an average of 51.48 ppm. The content of Zn was 0.94–4216.00 ppm, with an average of 418.87 ppm. The content of As was 0.70–8019.00 ppm, with an average of 2,179.97 ppm. The content of Ag was 0.08–551.00 ppm, with an average of 91.79 ppm. The content of Sb was 0.47–127.00 ppm, with an average of 19.77 ppm, except for four points that were below the detection limit. The content of Au was 0.03–3.84 ppm, with an average of 0.78 ppm. The content of Pb was 7.86–57,880.00 ppm, with an average of 16,167.72 ppm. The content of Bi was 0.02–0.62 ppm, with an average of 0.23 ppm, except for two points below the detection limit.
Pyrite analytical results from borehole ZK3410 are as follows: The content of Co was 1.41–61.00 ppm, with an average of 16.45 ppm. The content of Ni was 2.03−17.00 ppm, with an average of 8.17 ppm. The Co/Ni ratio ranged from 0.22 to 4.61, with a large variation, and an average value of 1.57. The content of Cu was 0.41−41.00 ppm, with an average of 7.17 ppm. The content of Zn was 0.55−2.73 ppm, with an average of 1.35 ppm. The content of As was 87.00−574.00 ppm, with an average of 243.00 ppm. The content of Ag was 0.08−5.55 ppm, with an average of 2.06 ppm. The content of Sb was 0.05−4.07 ppm, with an average of 1.42 ppm, except for one point below the detection limit. The content of Au was 0.01−0.37 ppm, with an average of 0.10 ppm, except for two points below the detection limit. The content of Pb was 2.04–100.00 ppm, with an average of 26.10 ppm. The content of Bi was 1.43–43.00 ppm, with an average of 12.65 ppm.

5.3. In-Situ Sulfur Isotopic Compositions

Pyrite from three boreholes was selected for in-situ sulfur isotope analysis, and the results are shown in Table 2, with a total of 24 analytical points. Overall, the δ34S values of pyrite from different boreholes have a narrow range of variation (10‰–13‰), with an average pyrite δ34S value of + 11.65‰, which is positively deviated from meteoric sulfur and has a small range of variation, with a high degree of sulfur homogenization, characterized by an enrichment of δ34S (Figure 6).

5.4. Rb–Sr Age

Test samples of pyrite Rb–Sr isotopes were taken from borehole ZK3410, and the contents of the Rb–Sr and isotope ratios are shown in Table 3. The values of 87Rb/86Sr and 87Sr/86Sr were (0.797712–21.364224) and (0.713049–0.747714), respectively; the 87Rb/86Sr and 87Sr/86Sr plots showed good linear relationships. ISOPLOT software was used to calculate the isochron age, which was t = 118.50 ± 0.65 Ma, and the initial 87Sr/86Sr (Isr) value was 0.711686 ± 0.000059 (Figure 7).

6. Discussion

6.1. Trace Element Distribution Characteristics of Pyrite

The trace element composition of pyrite can effectively reflect the characteristics of ore-forming fluids, trace the source of ore-forming materials, and indicate the genesis of the deposit [25,26,27,28,29,30,31,32,33]. The form of occurrence form of trace elements in pyrite can be intuitively and effectively distinguished using a LA-ICP-MS time-resolved signal spectrum. Generally, if the signal intensity of a certain element shows a gentle straight line with the denudation time, it means that the element mainly exists in the form of a solid solution in pyrite. If the peak of an element appears on the time-resolved signal spectrum, it means that the element exists in the form of micron-sized mineral inclusions in pyrite [32]. Correlations among the trace elements in pyrite were analyzed, and a relatively flat signal area was selected for data processing so that the data could reliably and truly reflect the changes in trace elements in pyrite (Figure 6, Table 1). The Au content of pyrite in gold deposits is relatively low, and the contents of Bi, Pb, Cu, Co, and Ni are generally high. Among these, Co and Ni are strong pro-copper elements, which can replace Fe in the lattice of pyrite minerals [34]. In addition, As and Sb also have isomorphism with S or Fe. According to the trace element correlation diagram, Au and Ag, and As and Cu showed certain positive correlations, and Sb and Ag, and Zn and Cu showed positive correlations (Figure 8). The correlation between Au and Ag indicates that Au in gold-bearing pyrite may exist in the form of an electrum, while the correlation with As is more likely to indicate that As-bearing pyrite is a good gold carrier.
Among the trace elements of pyrite, As, Co, and Ni are often affected by the physical and chemical conditions in which they are precipitated. Therefore, it is of great significance to determine the genetic information of pyrite using the contents of these trace elements. It is generally believed that the content ratio of Co and Ni in pyrite of sedimentary or sedimentary transformation is generally less than 1.0, and the content ratio of Co and Ni in pyrite of magmatic origin is often close to 1.0. For pyrite related to hydrothermal genesis, the content ratio of Co and Ni is generally greater than 1 and less than 10, while for pyrite of volcanic origin, the content ratio of Co and Ni is greater than 10 [34,35]. From the test results, it can be seen that the extreme values of Co and Ni elements in pyrite are large, and the element contents jump greatly. In addition, the Co/Ni ratios of each test point are also different. The Co/Ni ratio of the gold deposit offshore of Northern Sanshandao is mainly between 0.1 and 10, and the Co/Ni ratio has a wide range of changes. Most of the casting points on the Co–Ni diagram are located in magmatic and hydrothermal genesis areas, and a few are located in sedimentary genesis areas (Figure 8f). The Mesozoic sedimentary strata are missing in the Jiaodong area. It is speculated that the pyrite of gold deposits in the northern sea area of Sanshandao is of hydrothermal genesis. The reason that most of the casting points deviate from the hydrothermal genesis area may be that the metallogenic process has experienced different forms of hydrothermal evolution or different fluid mixing.

6.2. Occurrence of Gold

The LA-ICP-MS signal curves of pyrite from different boreholes are stable, indicating that Au mainly exists in pyrite in the form of invisible lattice gold or nanoparticles. However, there are also abnormal peaks of Au (Figure 6a,b). The inclusion of gold can also be seen under the reflected light of the microscope (Figure 4b,c), indicating that there was also a micron-sized inclusion of gold in the gold-bearing pyrite. The maximum amount of soluble Au (CAu) in pyrite depends on the As content (CAs). According to the Au saturation line of pyrite, CAu = 0.02 × CAs + 4 × 10⁻⁵, and it can be found that below this curve, Au mainly exists in the form of invisible Au in the pyrite lattice. Above the curve, Au mainly appears in the form of natural gold or mineral inclusions, such as gold and silver, and the Au/As ratio can reflect the occurrence state of invisible gold in pyrite [36]. In the LA-ICP-MS time-resolved signal spectrum of this study, the signal intensity of Au generally shows a smooth state with the ablation time, and all test points were below the gold solubility line, indicating that invisible gold mainly exists in the form of a solid solution (Figure 6 and Figure 8b). In the form of atoms or ions, gold enters the lattice of the medium through isomorphism and forms a solid solution with the medium. In hydrothermal fluids, gold may mainly migrate in the form of Au (HS)2− complexes. In the process of pyrite–sericite–quartz lithification, sulfidation makes the Au (HS)2− complex unstable, and it decomposes, resulting in Au precipitation and enrichment mineralization [15].
Au and As generally show a certain positive correlation (Figure 8b), indicating that As has a certain correlation with the enrichment of Au in the gold deposit offshore of Northern Sanshandao, which is not completely consistent with previous research results of the Sanshandao gold deposit [37]. There are usually two mechanisms for the simultaneous entry of As and Au in gold-bearing pyrite, that is, Au and As replace Fe as follows: As3+ + yAu+ + (1–y)M = Fe2+, where M refers to other elements in lattice defects [38], or Au replaces Fe, and As replaces S with As. The former is usually found in high-sulfur epithermal gold deposits with high oxygen fugacity [39], while the precipitation of gold in the Jiaodong area is in a relatively reducing environment [40]. Therefore, it is speculated that As in the gold deposit offshore of Northern Sanshandao enters into pyrite in the form of As instead of S, causing its lattice defects to promote the entry of Au+ into gold-bearing pyrite.

6.3. Metallogenic Age

In this study, the Rb–Sr isochron age of pyrite is 118.5 ± 0.65Ma, which can represent the metallogenic age of the deposit (Figure 7). It belongs to the Early Cretaceous and is consistent with the gold mineralization age (120.0 ± 5Ma) in the Jiaodong area [41,42,43,44]. Previous studies have determined the crystallization ages of Sanshandao granite (128.0–129.0 Ma) [45,46]. The sericite Rb–Sr isochron age of the Sanshandao gold deposit is 117.6 ± 3.0 Ma [47], and the 40Ar/39Ar plateau age of sericite from the Sanshandao gold deposit is 118.35 ± 1.21 Ma [48]. The Cangshang gold deposit has a sericite 40Ar/39Ar plateau age of 121.3 ± 0.2 Ma [49]. The younger age peak is 8–10 Ma later than the crystallization ages of igneous rocks in the study area and may represent the main mineralization period in the Sanshandao gold belt. These ages suggest that gold mineralization in the Jiaodong area was completed in a short time under the same tectonic conditions.

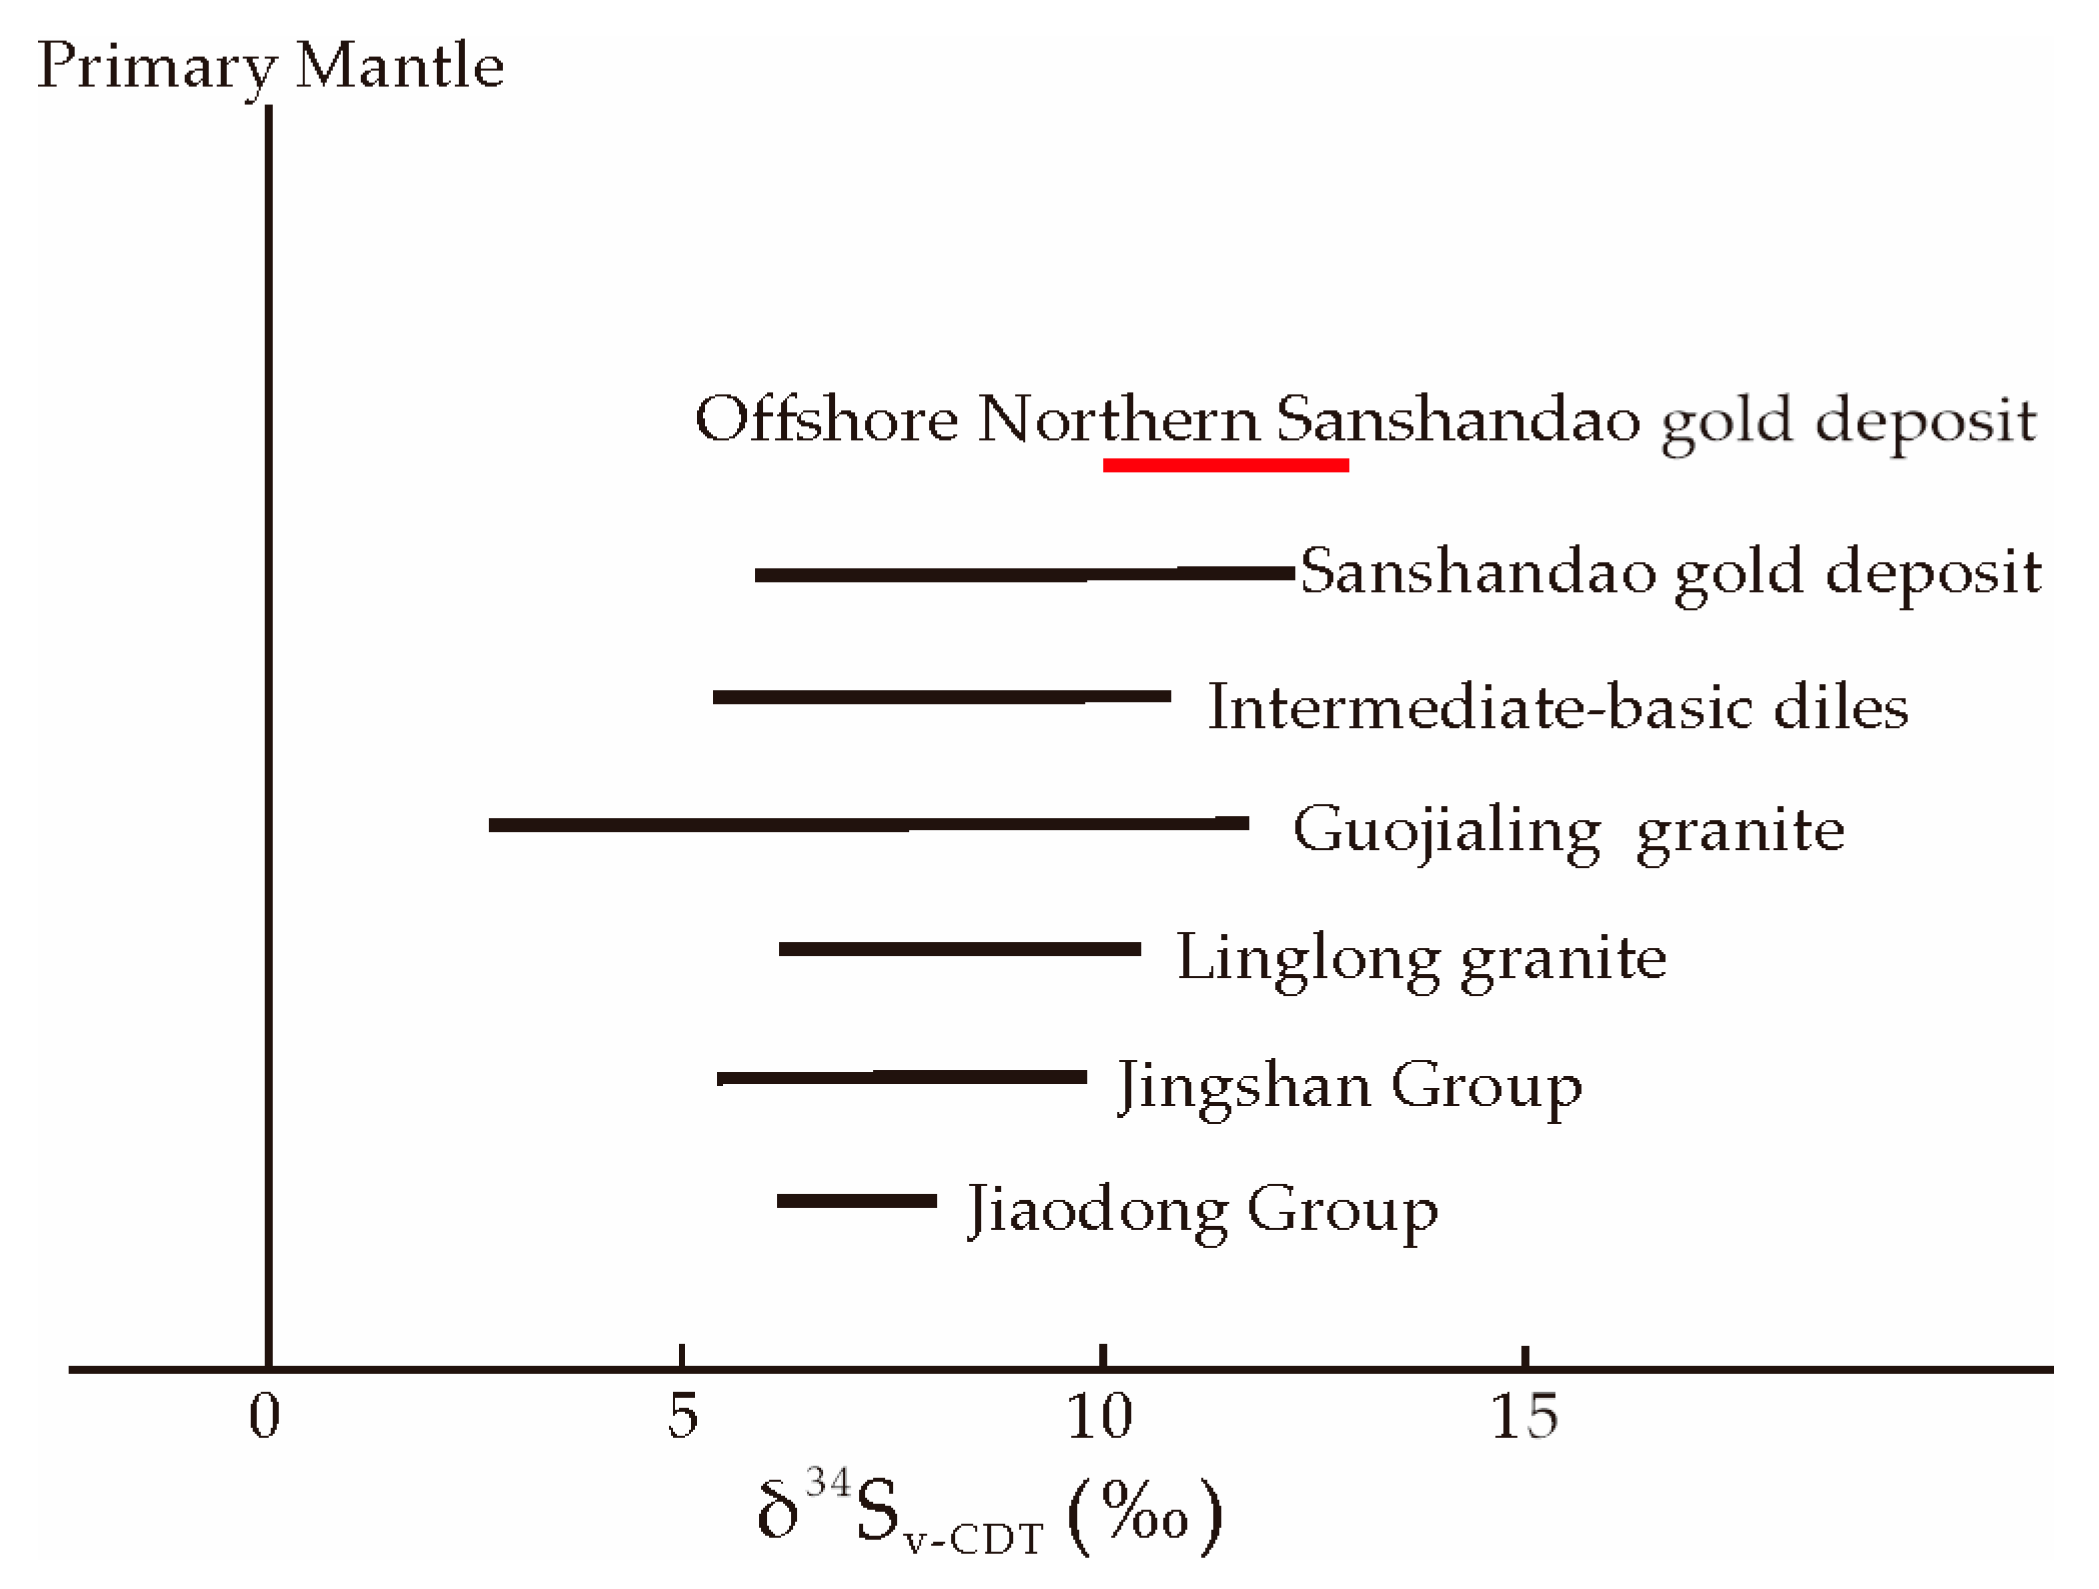
6.4. Sources of Ore-Forming Material

The δ34S values of sulfides from different sources usually have a certain range, for example, that of a meteorite or mantle source is 0.0‰–3.0‰, and that of granitic magma sulfur is −5.0‰–10.0‰. The average value of sulfur in seawater is +20.0‰, and sedimentary source reduction sulfur is <0.0‰ [50,51,52]. The sulfur isotope samples of the three boreholes studied in this test are all pyrite, and the δ34S values are concentrated in the 10‰–13‰ range. The test results generally show high δ34S values (Figure 9), which are close to the δ34S value of the Sanshandao and Cangshang gold deposits [53,54], all of which have characteristics of a positive deviation from meteorite sulfur and a relatively concentrated distribution. This shows that the degree of sulfur homogenization is high, and it also shows that the possibility of sulfur from only mantle-derived magma is relatively small. The δ34S values are relatively higher than those of the Precambrian metamorphic strata, Neoarchean TTG rock series, and Mesozoic granites [55,56,57,58]. Previous researchers believe that sulfur isotopes are mainly derived from ore-bearing surrounding rocks, initially from early Precambrian metamorphic complexes, and finally from late Mesozoic granitoids [59]. Previous studies have suggested that sulfur is dominated by mantle-derived magmatic sulfur and mixed with crust-derived sulfur [60,61]. It is also believed that sulfur may be derived from devolatilization during plate subduction [62]. Other studies have suggested that the value of δ34S gradually increases from east to west in the Jiaodong area, which is due to sulfur in the seawater participating in mineralization [58]. However, some recent studies suggest that the high sulfur isotope composition of the Jiaodong gold deposit was related to subduction of the Neoproterozoic sedimentary strata of the Yangtze Craton under the lithospheric mantle of the North China Craton [63]. It is speculated that the sulfur isotope composition has mantle-derived components. The large-scale, deep cutting, and high degree of fragmentation of the Sanshandao fault zone are conducive to the full development of water–rock interactions and the mixing of seawater sulfur, increasing the δ34S value.
The initial 87Sr/86Sr value is also an essential indicator for judging the source of diagenetic and metallogenic materials. It is often used to trace the source of metallogenic materials, magmatic fluid, and deep source fluid in the geological study of deposits [64]. Generally, values of 87Sr/86Sr > 0.710 are considered to reflect a crustal source, whereas values of 87Sr/86Sr < 0.705 are considered to reflect a mantle source [64,65,66,67]. The initial Sr value from the gold deposit offshore of Northern Sanshandao was lower than the continental crust but significantly higher than the mantle. The Sr isotope composition also shows that the source of the minerals has the attributes of a mixed crust–mantle source. It is speculated that the volatile-containing gold-rich initial mantle fluid upwells along the deep fault. In the process of rising and intrusion, a large amount of seawater sulfur is mixed to form a mixed fluid. This fluid carries mineralized materials as it rises, and it precipitates to form gold deposits in the fracture zones with increased tectonic space.

7. Conclusions

The gold deposit offshore of Northern Sanshandao contains visible gold and invisible gold. The visible gold is mainly electrum and natural gold, and the invisible gold is mainly invisible lattice gold or nanoparticles. The gold most likely precipitated directly from the Au–As-rich fluid.
The Rb–Sr isochron age of pyrite from the main mineralization period was 118.5 ± 0.65 Ma, representing the ore formation age of the gold deposits. It belongs to the Early Cretaceous and is consistent with the gold mineralization age (120.0 ± 5 Ma) in the Jiaodong area.
The mineralization of gold deposits originated from the mixing of a large amount of seawater sulfur in the rising process of mantle magmatic fluid. The fluid underwent phase separation and sulfidation under suitable temperature and pressure conditions, and gold deposits were formed in the Early Cretaceous.

Author Contributions

J.T. and J.W. conceived and designed the research ideas; J.T., J.W., T.T. and L.W. participated in the field investigation; J.T., Y.W., X.Y., W.Z. and T.T. performed the data processing; T.R., B.S. and J.W. reviewed and edited the draft. All data were obtained from previous work performed by the project team. All authors have read and agreed to the published version of the manuscript.

Funding

This study was financially supported by the National Key Research and Development Program of China (grant 2016YFC0600100), geological and mineral survey special project from Shandong province (grants 12120113060400, LKZ2021–18, and LKB2020–1), and the Doctoral Research Foundation of Shandong Jianzhu University (grant X21005Z).

Data Availability Statement

All data are contained within the article.

Conflicts of Interest

The authors declare no conflicts of interest.

References

  1. Li, J.J.; Luo, Z.K.; Liu, X.Y.; Xu, W.D.; Luo, H. Geodynamic setting for formation of large-superlarge gold deposits and Mesozoic granites in Jiaodong area. Miner. Depos. 2005, 24, 361–372. (In Chinese) [Google Scholar]
  2. Deng, J.; Yang, L.Q.; Ge, L.S.; Wang, Q.F.; Zhang, J.; Gao, B.F.; Zhou, Y.F.; Jiang, S.Q. Research advances in the Mesozoic tectonic regimes during the formation of Jiaodong ore cluster area. Prog. Nat. Sci. 2006, 16, 777–784. [Google Scholar]
  3. Deng, J.; Wang, Q.F. Gold mineralization in China: Metallogenic provinces, deposit types and tectonic framework. Gondwana Res. 2016, 36, 219–274. [Google Scholar] [CrossRef]
  4. Li, S.R.; Santosh, M. Metallogeny and craton destruction: Records from the North China Craton. Ore Geol. Rev. 2014, 56, 376–414. [Google Scholar] [CrossRef]
  5. Goldfarb, R.J.; Santosh, M. The dilemma of the Jiaodong gold deposits: Are they unique? Geosci. Front. 2014, 5, 139–153. [Google Scholar] [CrossRef]
  6. Song, M.C.; Ding, Z.J.; Zhang, J.J.; Song, Y.X.; Bo, J.W.; Wang, Y.Q.; Liu, H.B.; Li, S.Y.; Li, J.J.; Li, R.X. Geology and mineralization of the Sanshandao supergiant gold deposit (1200 t) in the Jiaodong Peninsula, China: A review. China Geol. 2021, 4, 686–719. [Google Scholar] [CrossRef]
  7. Qiu, K.F.; Goldfarb, R.J. Gold Deposits of the Jiaodong Peninsula, Eastern China; Society of Economic Geologists: Littleton, CO, USA, 2020; pp. 1–10. [Google Scholar]
  8. Song, M.C.; Zhang, J.J.; Zhang, P.J.; Yang, L.Q.; Liu, D.H.; Ding, Z.J.; Song, Y.X. Discover and tectonic-magmatic background of superlarge gold deposit in offshore of northern Sanshandao, Shandong peninsula. Acta Geol. Sin. 2015, 89, 365–383. (In Chinese) [Google Scholar]
  9. Liu, D.H.; Lv, G.X.; Zhang, P.J.; Ding, Z.J.; Zhang, J.J.; Lin, D.W.; Lv, C.X.; Wang, Z.Y. A study of 3D ore-controlling of the tectonic altered rocks of the Sanshandao fault in Jiaodong Peninsular and the discovery of an offshore super-large gold deposit in China. Earth Sci. Front. 2015, 22, 162–172. (In Chinese) [Google Scholar]
  10. Gao, J.W.; Shen, J.F.; Li, G.W.; Wang, L.M.; Sun, N.Y.; Liu, H.D.; Chi, L.; Zhang, H.F.; Du, B.S. Characteristics of Cell Parameters and Thermoelectricity of the Pyrite in the Sanshandao North Offshore Gold Deposit, Shandong Province, China. Bull. Mineral. Petrol. Geochem. 2020, 39, 1205–1214. (In Chinese) [Google Scholar] [CrossRef]
  11. Gao, J.W.; Liu, W.Q.; Deng, H.J.; Shen, J.F.; Zhao, G.C. Hydrothermal Alteration Characteristics and Migration Rules of Trace Elements in the North Sanshandao Sea Gold Deposit, Shandong, China. Northwestern Geol. 2023, 56, 245–253. (In Chinese) [Google Scholar] [CrossRef]
  12. Lyu, J.Y.; Wang, J.H.; Mao, M.Q.; Zhang, W.; Wang, Y.P.; Yu, X.W.; Wang, L.G.; Zhang, G.L. The Genesis of the Haiyu Gold deposit in the northern part of Sanshandao gold metallogenic belt in the eastern Shandong: Constraints from geological characteristics and fluid inclusion study. Acta Mineral. Sin. 2023, 43, 521–532. (In Chinese) [Google Scholar]
  13. Song, Y.X.; Li, S.R.; Shen, J.F.; Zhang, L.; Li, W.T.; Zeng, Y.J. Characteristics and prospecting significance of thermoluminescence patterns and cell parameters of quartz from the undersea gold deposit off northern Sanshandao, Jiaodong Peninsula. Earth Sci. Front. 2021, 28, 305–319. (In Chinese) [Google Scholar]
  14. Wang, J.; Zhu, L.X.; Ma, S.M.; Tang, S.X.; Zhang, L.L.; Zhou, W.W. Application of the multi-attribute anomaly model for prospecting potential at depth: A case study of the Haiyu Au deposit in the Jiaodong Gold Province, China. J. Geochem. Explor. J. Assoc. Explor. Geochem. 2019, 207, 106359. [Google Scholar] [CrossRef]
  15. Wang, J.P. Geochemical Mechanism of Gold Accumulation in Offshore of Northern Sanshandao Gold Deposit in the Jiaodong Gold Province, Eastern China. Ph.D Thesis, China University of Geosciences, Wuhan, China, 2020. [Google Scholar]
  16. Zhang, C.; Huang, T.; Liu, X.D.; Liu, Y.; Wang, X.D. Hydrothermal alteration of the xincheng gold deposit, northwestern Jiaodong, China. Acta Pet. Sin. 2016, 32, 2433–2450. (In Chinese) [Google Scholar]
  17. Fan, Y.C. Origins of Ore-Forming Materials and the Metallogenic Model of Gold Deposits in the Jiaoxibei Area. Ph.D Thesis, Jilin University, Changchun, China, 2022. [Google Scholar]
  18. Ding, Z.J. Study on Metallogenic Regularity of Mesozoic Precious and Non-Ferrous Deposits in Jiaodong Area. Ph.D. Thesis, Jilin University, Changchun, China, 2014. [Google Scholar]
  19. Hu, Z.C.; Zhang, W.; Liu, Y.S.; Gao, S.; Li, M.; Zong, K.Q.; Chen, H.H.; Hu, S.H. “Wave” Signal-Smoothing and Mercury-Removing Device for Laser Ablation Quadrupole and Multiple Collector ICPMS Analysis: Application to Lead Isotope Analysis. Anal. Chem. 2015, 87, 1152–1157. [Google Scholar] [CrossRef] [PubMed]
  20. Liu, Y.S.; Hu, Z.C.; Gao, S.; Gunther, D.; Xu, J.; Gao, C.G.; Chen, H.H. In situ analysis of major and trace elements of anhydrous minerals by LA-ICP-MS without applying an internal standard. Chem. Geol. 2008, 257, 34–43. [Google Scholar] [CrossRef]
  21. Fu, J.L.; Hu, Z.C.; Zhang, W.; Yang, L.; Liu, Y.S.; Li, M.; Zong, K.Q.; Gao, S.; Hu, S.H. In situ sulfur isotopes (δ34S and δ33S) analyses in sulfides and elemental sulfur using high sensitivity cones combined with the addition of nitrogen by laser ablation MC-ICP-MS. Anal. Chim. Acta 2016, 911, 14–26. [Google Scholar] [CrossRef] [PubMed]
  22. Zhang, W.; Hu, Z.C.; Liu, Y.S. Iso-Compass: New freeware software for isotopic data reduction of LA-MC-ICP-MS. J. Anal. At. Spectrom. 2020, 35, 1087–1096. [Google Scholar] [CrossRef]
  23. Tian, J.P. The Mesozoic Gold Polymetallic Regional Metallogeny in Qipengfu Ore Concentration Area, Jiaodong Peninsula. Ph.D. Thesis, China University of Geosciences, Beijing, China, 2020. [Google Scholar]
  24. Liu, W.G.; Liu, H.B.; Li, G.Z.; Xiao, Z.B.; Tu, J.R.; Li, H.M. The Application of Ion Exchange Resins in Sr-Nd Isotopic Assay of Geological Samples. Acta Geol. Sin. 2017, 91, 2584–2592. (In Chinese) [Google Scholar]
  25. Barker, S.L.; Hickey, K.A.; Cline, J.S.; Dipple, G.M.; Kilburn, M.R.; Vaughan, J.R.; Longo, A.A. Uncloaking invisible gold: Use of nanoSIMS to evaluate gold, trace elements, and sulfur isotopes in pyrite from Carlin-type gold deposits. Econ. Geol. 2009, 104, 897–904. [Google Scholar] [CrossRef]
  26. Ciobanu, C.L.; Cook, N.J.; Utsunomiya, S.; Kogagwa, M.; Green, L.; Gilbert, S.; Wade, B. Gold-telluride nanoparticles revealed in arsenic-free pyrite. Am. Mineral. 2012, 97, 1515–1518. [Google Scholar] [CrossRef]
  27. Ciobanu, C.L.; Cook, N.J.; Pring, A.; Brugger, J.; Danyushevsky, L.V.; Shimizu, M. ‘Invisible gold’ in bismuth chalcogenides. Geochim. Et Cosmochim. Acta 2009, 73, 1970–1999. [Google Scholar] [CrossRef]
  28. Cook, N.J.; Ciobanu, C.L.; Meria, D.; Silcock, D.; Wade, B. Arsenopyrite-Pyrite Association in an Orogenic Gold Ore: Tracing Mineralization History from Textures and Trace Elements. Econ. Geol. Bull. Soc. Econ. Geol. 2013, 108, 1273–1283. [Google Scholar] [CrossRef]
  29. Cook, N.J.; Ciobanu, C.L.; Mao, J.W. Textural control on gold distribution in As-free pyrite from the Dongping, Huangtuliang, and Hougou gold deposits, North China Craton (Hebei Province, China). Chem. Geol. 2009, 264, 101–121. [Google Scholar] [CrossRef]
  30. Ulrich, T.; Long, D.G.F.; Kamber, B.S.; Whitehouse, M.J. In Situ Trace Element and Sulfur Isotope Analysis of Pyrite in a Paleoproterozoic Gold Placer Deposit, Pardo and Clement Townships, Ontario, Canada. Econ. Geol. 2011, 106, 667–686. [Google Scholar] [CrossRef]
  31. Fan, H.R.; Li, X.H.; Zuo, Y.B.; Chen, L.; Liu, S.; Hu, F.F.; Feng, K. In-situ LA-(MC)-ICPMS and (Nano) SIMS trace elements and sulfur isotope analyses on sulfides and application to confine metallogenic process of ore deposit. Acta Petrol. Sin. 2018, 34, 3479–3496. (In Chinese) [Google Scholar]
  32. Zhang, H.Y.; Zhao, Q.Q.; Zhao, G.; Hong, J.X.; Liu, J.J.; Zhai, D.G. In situ LA-ICP-MS trace element analysis of pyrite and its application in study of Au deposit. Miner. Depos. 2022, 41, 1182–1199. (In Chinese) [Google Scholar]
  33. Zhou, L.L.; Zeng, Q.D.; Sun, G.T.; Duan, X.X.; Bonnetti, C.; Biegler, T.; Long, D.G.F.; Kamber, B. Laser Ablation-Inductively Coupled Plasma Mass Spectrometry (LA-ICP-MS) elemental mapping and its applications in ore geology. Acta Petrol. Sin. 2019, 35, 1964–1978. (In Chinese) [Google Scholar] [CrossRef]
  34. Koglin, N.; Frimmel, H.E.; Lawrie Minter, W.E.; Brätz, H. Trace-element characteristics of different pyrite types in Mesoarchaean to Palaeoproterozoic placer deposits. Miner. Depos. 2010, 45, 259–280. [Google Scholar] [CrossRef]
  35. Bralia, A.; Sabatini, G.; Troja, F. A revaluation of the Co/Ni ratio in pyrite as geochemical tool in ore genesis problems. Miner. Depos. 1979, 14, 353–374. [Google Scholar] [CrossRef]
  36. Reich, M.; Kesler, S.E.; Utsunomiya, S.; Palenik, C.S.; Chryssoulis, S.L.; Ewing, R.C. Solubility of gold in arsenian pyrite. Geochim. Et Cosmochim. Acta 2005, 69, 2781–2796. [Google Scholar] [CrossRef]
  37. Lin, Z.W.; Zhao, X.F.; Xiong, L.; Zhu, Z.X. In-situ trace element analysis characteristics of pyrite in Sanshandao Gold Deposit in Jiaodong Peninsula: Implications for ore genesis. Adv. Earth Sci. 2019, 34, 399–413. (In Chinese) [Google Scholar] [CrossRef]
  38. Deditius, A.P.; Reich, M.; Kesler, S.E.; Utsunomiya, S.; Chryssoulis, S.L.; Walshe, J.; Ewing, R.C. The coupled geochemistry of Au and As in pyrite from hydrothermal ore deposits. Geochim. Cosmochim. Acta 2014, 140, 644–670. [Google Scholar] [CrossRef]
  39. Simmons, S.F.; White, N.C.; John, D.A. Geological Characteristics of Epithermal Precious and Base Metal Deposits. In One Hundredth Anniversary Volume; Society of Economic Geologists: Littleton, CO, USA, 2005; pp. 485–522. [Google Scholar] [CrossRef]
  40. Zhu, Z.X.; Zhao, X.F.; Lin, Z.W.; Zhao, S.R. In Situ Trace Elements and Sulfur Isotope Analysis of Pyrite from Jinchiling Gold Deposit in the Jiaodong Region: Implications for Ore Genesis. Earth Sci. 2020, 45, 945–959. (In Chinese) [Google Scholar] [CrossRef]
  41. Zhai, M.G.; Fan, H.R.; Yang, J.H.; Miao, L.C. Large-scale cluster of gold deposits in east Shandong: Anorogenic metallogenes. Earth Sci. Front. 2004, 11, 85–98. (In Chinese) [Google Scholar]
  42. Deng, J.; Qiu, K.F.; Wang, Q.F.; Goldfarb, R.; Yang, L.Q.; Zi, J.W.; Geng, J.Z.; Ma, Y. In Situ Dating of Hydrothermal Monazite and Implications for the Geodynamic Controls on Ore Formation in the Jiaodong Gold Province, Eastern China. Econ. Geol. 2020, 115, 671–685. [Google Scholar] [CrossRef]
  43. Yang, K.F.; Jiang, P.; Fan, H.R.; Zuo, Y.B.; Yang, Y.H. Tectonic transition from a compressional to extensional metallogenic environment at similar to 120 Ma revealed in the Hushan gold deposit, Jiaodong, North China Craton. J. Asian Earth Sci. 2018, 160, 408–425. [Google Scholar] [CrossRef]
  44. Zhang, L.; Weinberg, R.F.; Yang, L.Q.; Groves, D.I.; Sai, S.X.; Matchan, E.; Phillips, D.; Kohn, B.P.; Miggins, D.P.; Liu, Y.; et al. Mesozoic Orogenic Gold Mineralization in the Jiaodong Peninsula, China: A Focused Event at 120 +/− 2 Ma During Cooling of Pregold Granite Intrusions. Econ Geol. 2020, 115, 415–441. [Google Scholar] [CrossRef]
  45. Yang, K.F.; Fan, H.R.; Santosh, M.; Hu, F.F.; Wilde, S.A.; Lan, T.G.; Lu, L.N.; Liu, Y.S. Reactivation of the Archean lower crust: Implications for zircon geochronology, elemental and Sr-Nd-Hf isotopic geochemistry of late Mesozoic granitoids from northwestern Jiaodong Terrane, the North China Craton. Lithos 2012, 146, 112–127. [Google Scholar] [CrossRef]
  46. Wang, L.G.; Qiu, Y.M.; McNaughton, N.J.; Groves, D.I.; Luo, Z.K.; Huang, J.Z.; Liu, Y.K. Constraints on crustal evolution and gold metallogeny in the northwestern Jiaodong Peninsula, China, from SHRIMP U-Pb zircon studies of granitoids. Ore Geol. Rev. 1998, 13, 275–291. [Google Scholar] [CrossRef]
  47. Hu, F.F.; Fan, H.R.; Jiang, X.H.; Yang, K.F. Fluid inclusions in different depths at Sanshandao gold deposit, Jiaodong Peninsula: Implication for ore genesis. Geofluids 2013, 13, 528–541. [Google Scholar] [CrossRef]
  48. Yang, Z.Y.; Yu, X.W.; Zhang, W.; Wang, L.G.; Wang, Q.Y.; Guo, R.P. 40Ar/39Ar Age and Its Significance of Sericite in Pyrite Sericite in Sanshandao Gold Deposit in Northwest of Shandong Province. Shandong Land Resour. 2020, 36, 1–8. (In Chinese) [Google Scholar]
  49. Zhang, X.; Cawood, P.A.; Wilde, S.A.; Liu, R.; Song, H.; Li, W.; Snee, L.W. Geology and timing of mineralization at the Cangshang gold deposit, north-western Jiaodong Peninsula, China. Miner. Depos. 2003, 38, 141–153. [Google Scholar] [CrossRef]
  50. Ohmoto, H. Systematics of Sulfur and Carbon Isotopes in Hydrothermal Ore Deposits. Econ. Geol. 1972, 67, 551–578. [Google Scholar] [CrossRef]
  51. Chaussidon, M.; Albarède, F.; Sheppard, S.M.F. Sulphur isotope variations in the mantle from ion microprobe analyses of micro-sulphide inclusions. Earth Planet Sci. Lett. 1989, 92, 144–156. [Google Scholar] [CrossRef]
  52. Rollinson, H.R. Using Geochemical Data: Evaluation, Presentation, Interpretation; Routledge: London, UK, 1993; Available online: https://www.taylorfrancis.com/books/mono/10.4324/9781315845548/using-geochemical-data-hugh-rollinson (accessed on 1 October 2023).
  53. Wen, B.J.; Fan, H.R.; Hu, F.F.; Liu, X.; Yang, K.F.; Sun, Z.F.; Sun, Z.F. Fluid evolution and ore genesis of the giant Sanshandao gold deposit, Jiaodong gold province, China: Constrains from geology, fluid inclusions and H-O-S-He-Ar isotopic compositions. J. Geochem. Explor. J. Assoc. Explor. Geochem. 2016, 171, 96–112. [Google Scholar] [CrossRef]
  54. Liu, Y.Z. Characteristics of the Ore-Forming Fluid and Thermodynamic Simulation of Water-Rock Interaction at the Sanshandao Gold Deposit, Shandong Province, China. Ph.D. Thesis, China University of Geosciences, Beijing, China, 2019. [Google Scholar]
  55. Zhu, R.X.; Fan, H.R.; Li, J.W.; Meng, Q.R.; Li, S.R.; Zeng, Q.D. Decratonic gold deposits. Sci. China Earth Sci. 2015, 58, 1523–1537. [Google Scholar] [CrossRef]
  56. Deng, J.; Wang, C.M.; Bagas, L.; Carranza, E.J.M.; Lu, Y.J. Cretaceous-Cenozoic tectonic history of the Jiaojia Fault and gold mineralization in the Jiaodong Peninsula, China: Constraints from zircon U-Pb, illite K-Ar, and apatite fission track thermochronometry. Miner. Depos. 2015, 50, 987–1006. [Google Scholar] [CrossRef]
  57. Wang, Y.W.; Zhu, F.S.; Gong, R.T. Tectonic isotope geochemistry—Further study on sulphur isotope of Jiaodong Gold Concentration Area. Gold 2002, 23, 1–16. (In Chinese) [Google Scholar]
  58. Huang, D.Y. Sulfur isotope studies of the metallogenic series of gold deposits in Jiaodong area. Miner. Depos. 1994, 13, 75–86. (In Chinese) [Google Scholar]
  59. Yang, L.Q.; Deng, J.; Wang, Z.L.; Zhang, L.; Guo, L.N.; Song, M.C.; Zheng, X.L. Mesozoic gold metallogenic system of the Jiaodong gold province, eastern China. Acta Petrol. Sin. 2014, 30, 2447–2467. (In Chinese) [Google Scholar]
  60. Li, J.; Song, M.C.; Liang, J.L.; Jiang, M.Y.; Li, S.Y.; Ding, Z.J.; Su, F. Source of ore-forming fluids of the Jiaojia deeplyseated gold deposit: Evidences from trace elements and sulfur-helium-argon isotopes of pyrite. Acta Geol. Sin. 2020, 36, 297–313. (In Chinese) [Google Scholar]
  61. Li, J.; An, M.Y.; Song, M.C.; Wang, M.Y.; Ding, Z.J.; Bao, Z.Y.; Wang, S.S. Sulfur isotopic composition and its source of Jiaodong gold deposit. Geol. Bull. China 2022, 41, 993–1009. (In Chinese) [Google Scholar] [CrossRef]
  62. Feng, K.; Fan, H.R.; Groves, D.I.; Yang, K.F.; Hu, F.F.; Liu, X.; Cai, Y.C. Geochronological and sulfur isotopic evidence for the genesis of the post-magmatic, deeply sourced, and anomalously gold-rich Daliuhang orogenic deposit, Jiaodong, China. Miner. Depos. 2020, 55, 293–308. [Google Scholar] [CrossRef]
  63. Deng, J.; Yang, L.Q.; Groves, D.I.; Zhang, L.; Qiu, K.F.; Wang, Q.F. An integrated mineral system model for the gold deposits of the giant Jiaodong province, eastern China. Earth Sci. Rev. 2020, 208, 103274. [Google Scholar] [CrossRef]
  64. Hou, M.L.; Jiang, S.Y.; Jiang, Y.H.; Ling, H.F. S-Pb isotope geochemistry and Rb-Sr geochronology of the Penglai gold field in the eastern Shangdong province. Acta Petrol. Sin. 2006, 22, 2525–2533. (In Chinese) [Google Scholar]
  65. Chen, Y.J.; Pirajno, F.; Lai, Y.; Li, C. Metallogenic time and tectonic setting of the Jiaodong gold province, eastern China. Acta Petrol. Sin. 2004, 20, 907–922. [Google Scholar]
  66. Faure, M.; Caridroit, M.; Charvet, J. The Late Jurassic oblique collisional orogen of SW Japan: New structural data and synthesis. Tectonics 1986, 5, 1089–1114. [Google Scholar] [CrossRef]
  67. Sun, X.L. Sr and O isotopic characteristics of porphyries in the Qinling molybdenum deposit belt and their implication To genetic mechanism and type. Sci. China Ser. D Earth Sci. 2001, 43, 82–94. [Google Scholar]
Figure 1. Map showing the regional geology in the Jiaoxibei ore area.
Minerals 14 00456 g001
Figure 2. Geological map of the Sanshandao metallogenic belt (a,b) and the exploration line profile of the deposit (c). (1) Quaternary sediments; (2) Early Cretaceous porphyritic granodiorite; (3) Late Jurassic monzonitic granite; (4) Late Jurassic biotite granodiorite; (5) Late Jurassic biotite granite; (6) Neoarchean metagabbro(amphibolite); (7) structural metamorphic belt; (8) exploration line and number; (9) horizontal projection range of gold ore body; (10) location and number of gold ore bodies; (11) drilling location and number; (12) drilling starting and ending position and path.
Minerals 14 00456 g002
Figure 3. Lithologic zoning of fault alteration zone (modified from [18]).
Minerals 14 00456 g003
Figure 4. Photomicrographs showing the mineralization and structure of the ore. (a) Pyrite–sericite–quartzite in borehole ZK3410; (b) encapsulated gold of pyrite in borehole ZK3410; (c) encapsulated and fissure gold of pyrite in borehole ZK8401; (d) automorphic pyrite in borehole ZK3612. Abbreviations: Py, pyrite; Qtz, quartz; Ser, Sericite; Au, gold; Gn, galena; Sp, sphalerite; Ccp, chalcopyrite.
Minerals 14 00456 g004
Figure 5. Photomicrographs of BSE images (ac), and wavelength dispersive elemental maps (di). Pyrite is in dark gray. Galena is present as inclusions within pyrite or along pyrite margins. In the BSE images, the galena in pyrite is light gray and white (a,b). Wavelength dispersive elemental maps (di) correspond to the area of the BSE image in (c). Abbreviations: Qz = quartz; Py = pyrite; Gn = galena.
Minerals 14 00456 g005
Figure 6. LA-ICP-MS output for analyses of pyrite from the gold deposit offshore of Northern Sanshandao.
Minerals 14 00456 g006
Figure 7. Rb–Sr isotope data and isochron age of pyrite from the gold deposit offshore of Northern Sanshandao.
Minerals 14 00456 g007
Figure 8. Binary plots of trace elements of pyrites in the mineralization stage from the gold deposit. (a) Au vs. Ag; (b) Au vs. As; (c) Au vs. Cu; (d) Zn vs. Cu; (e) Sb vs. Ag; (f) Co vs. Ni.
Minerals 14 00456 g008
Figure 9. Sulfur isotopic composition of pyrite from the gold deposit offshore of Northern Sanshandao and regional rocks.
Minerals 14 00456 g009
Table 1. Trace element contents of pyrite from the gold deposit offshore of Northern Sanshandao (ppm).
Sample Serial NumberCoNiCuZnAsAgSbAuPbBi
ZK8401-13.37-0.101.321250.19-0.011.879.35
ZK8401-25.220.062.241.04680.420.020.048.4010
ZK8401-33.081.291.211.09300.670.170.04156.94
ZK8401-4134422.140.66250.410.030.034.892.72
ZK8401-5130385.161.26222.580.140.147743
ZK8401-6457191.051.3391.700.040.0310710
ZK8401-770.370.241.36350.07--1.454.93
ZK8401-8180300.490.79250.650.060.025.4019
ZK8401-989580.240.7012---0.652.02
ZK8401-10274271.261.30240.790.080.023513.20
ZK3612-1201.5031421610940120.2318,4000.20
ZK3612-24724232.90801951130.9921,2900.15
ZK3612-32425111.507915188.040.6437500.03
ZK3612-40.290.386.951.0252143.580.1443860.02
ZK3612-5100.625.290.94497.661.560.12247-
ZK3612-60.230.550.191.490.700.080.470.037.86-
ZK3612-71.0610277379205511273.8457,8800.62
ZK3612-80.020.13130.94166337.130.1593320.17
ZK3612-90.063.02591.834103197221.4245,8960.58
ZK3612-100.250.8788154686.121.970.254920.05
ZK3410-11.456.501.011.662300.440.280.08107.02
ZK3410-23.764.510.551.241360.400.12-3.876.52
ZK3410-334171.081.391902.090.110.011543
ZK3410-44.655.600.561.14870.08--2.041.81
ZK3410-56.457.460.411.031600.150.050.013.294.88
ZK3410-623133.530.554383.942.310.371810
ZK3410-71.412.780.511.291430.300.240.035.431.43
ZK3410-8279.20201.322705.554.070.1710030
ZK3410-96113412.732064.883.270.068017
ZK3410-102.432.033.371.175742.792.360.07234.17
Note: - represents contents less than 0.1 ppm.
Table 2. In-situ sulfur isotopic analyses from the gold deposit offshore of Northern Sanshandao.
Sample Serial NumberMineralδ34SCDT (‰)Sample Serial Number
ZK8401-1Pyrite11.9920.0 m
ZK8401-2Pyrite12.6920.0 m
ZK8401-3Pyrite12.6920.0 m
ZK8401-4Pyrite12.1920.0 m
ZK8401-5Pyrite12.0920.0 m
ZK8401-6Pyrite11.6963.5 m
ZK8401-7Pyrite12.4963.5 m
ZK8401-8Pyrite11.4963.5 m
ZK8401-9Pyrite12.1963.5 m
ZK8401-10Pyrite11.6963.5 m
ZK8401-11Pyrite10.5963.5 m
ZK3612-1Pyrite11.11537.0 m
ZK3612-2Pyrite12.01537.0 m
ZK3612-3Pyrite11.31537.0 m
ZK3612-4Pyrite12.91537.0 m
ZK3410-1Pyrite10.01552.0 m
ZK3410-2Pyrite10.31552.0 m
ZK3410-3Pyrite10.61552.0 m
ZK3410-4Pyrite11.91552.0 m
ZK3410-5Pyrite11.41552.0 m
ZK3410-6Pyrite10.81613.0 m
ZK3410-7Pyrite10.61613.0 m
ZK3410-8Pyrite13.01613.0 m
ZK3410-9Pyrite12.81613.0 m
Table 3. The contents and isotope ratios of Rb and Sr from the gold deposit offshore of Northern Sanshandao.
Sample Serial NumberOre Type87Rb/86Sr87Sr/86SrStdErr (%)
ZK3410-2Pyrite2.4665150.7157940.000012
ZK3410-5Pyrite3.8478050.7181910.000022
ZK3410-7Pyrite21.3642240.7477140.000019
ZK3410-9Pyrite19.9447310.7452170.000017
ZK3410-11Pyrite8.0881070.7253190.000015
ZK3410-12Pyrite0.7977120.7130490.000024
Disclaimer/Publisher’s Note: The statements, opinions and data contained in all publications are solely those of the individual author(s) and contributor(s) and not of MDPI and/or the editor(s). MDPI and/or the editor(s) disclaim responsibility for any injury to people or property resulting from any ideas, methods, instructions or products referred to in the content.

