Article

Elevational Patterns of Forest Evapotranspiration and Its Sensitivity to Climatic Variation in Dryland Mountains

1
Comprehensive Survey Command Center for Natural Resources, China Geological Survey, Beijing 100055, China
2
School of Earth Science and Resources, China University of Geosciences, Beijing 100083, China
3
Key Laboratory of Coupling Process and Effect of Natural Resources Elements, Ministry of Natural Resources, Beijing 100055, China
4
Key Laboratory of Ecosystem Network Observation and Modeling, Institute of Geographic Sciences and Natural Resources Research, Chinese Academy of Sciences, Beijing 100101, China
5
Key Laboratory of Geochemical Exploration, Institute of Geophysical and Geochemical Exploration, CAGS, Langfang 065000, China
*
Author to whom correspondence should be addressed.
Submission received: 27 March 2024 / Revised: 22 April 2024 / Accepted: 26 April 2024 / Published: 27 April 2024
(This article belongs to the Topic Hydrology and Water Resources Management)

Abstract

:
Elevational climatic heterogeneity, complex terrains, and varying subsurface properties affect the sensitivity of evapotranspiration (ET) in dryland mountain forests to hydrometeorological changes. However, the elevational distribution of ET sensitivity and its major influencing factors remain poorly understood. This study focused on the mid-altitude zone (1000–3500 m) forests in the Chinese Western Tianshan Mountains and assessed ET sensitivity to multiple climate variables, including precipitation (P) and potential evapotranspiration (PET), from 2000 to 2020. To evaluate the multi-year mean and trends in ET sensitivity, multi-source remote sensing data and regional survey data were analyzed using Spearman’s correlation coefficient, the sliding window method, and Kendall’s test. Furthermore, the relative importance of environmental variables (topography, geology, soil, and vegetation) was investigated. P and PET showed no significant trends, while ET exhibited a significant increasing trend (5.81 mm/yr, p < 0.01), particularly at elevations above 2000 m. Most forests (93.5%) showed a positive sensitivity of ET to P, and 70.0% showed a positive sensitivity of ET to PET, mainly at elevations of 1500–2500 m. Additionally, the trend in ET sensitivity to P decreased with an increasing elevation, with 64.5% showing a positive trend. Meanwhile, the trend in ET sensitivity to PET increased with elevation, with 88.1% showing a positive trend. Notably, 53.2% of the forests showed increasing ET sensitivity trends to both P and PET, primarily at elevations of 2000–3000 m with a mean normalized difference vegetation index (NDVI) of 0.56. Geological factors, particularly the hydrological properties of weathered bedrock, contributed the most (~47%) to mean sensitivity. However, geological and vegetative factors, including the NDVI and root zone water availability, were the main contributors (35% each) to the sensitivity. This study highlights the elevation-dependent sensitivity of dryland mountain forests to hydrothermal changes, with higher-elevation forests (>2000 m) being more sensitive to global warming.

1. Introduction

Drylands cover more than 40% of the Earth’s surface and support around 40% of the global human population [1,2,3]. Ecosystems in water-limited drylands are highly fragile and sensitive to the increasing aridity caused by climate change [4,5]. Mountains in drylands serve as regional “water towers”, supplying fresh water to downstream areas [6]. The warming climate is expected to intensify and accelerate the global hydrological cycle, with impacts that vary across different spatial and temporal scales [7]. Mountains are unique ecosystems that encompass all latitudinally controlled climate zones, and the vegetation in these areas are highly sensitive to both average and extreme hydroclimatic conditions [8,9]. Elevation-dependent warming phenomena result in more rapid environmental changes in mountain systems compared to the lowlands, particularly in dryland mountain ecosystems [10]. Forest evapotranspiration (ET) plays a crucial role in the hydrological cycle of dryland mountains, directly influencing the water supply and ecological security of oasis-desert areas in the lower reaches [11,12]. Therefore, it is essential to quantify the spatiotemporal patterns of forest ET in response to climatic variations along elevational gradients for effective water resource management in water-limited regions [13].
ET plays a crucial role in the water budget and energy balance of biogeophysical systems, impacting the functioning of the local and regional climate, hydrology, and ecosystem [14,15]. Forest ET encompasses the combined processes of water loss from the land surface to the atmosphere through evaporation and canopy transpiration, which closely links a series of land surface processes with ecosystem functions [16]. It is important to understand the complex interactions between forest ET, climate conditions (e.g., precipitation (P), net radiation, air temperature, humidity, and wind speed), and surface characteristics (e.g., soil moisture and canopy structure), especially in the context of global warming and the increasing impact of human activities [17]. The Budyko framework highlights that water and energy supply conditions, represented by P and potential evapotranspiration (PET), respectively, are the two major climatic factors controlling actual ET, particularly in dryland regions where water availability is limited [18,19]. The variation in dryland forest ET is highly sensitive to these two climatic factors, which collectively determine bioclimatic aridity [20,21]. Climate change, notably global warming, is expected to impact ET by increasing the potential evapotranspiration (PET) levels due to changes in radiation, temperature, and water vapor deficit, as well as variability in P [22,23].
There has been increasing concern about the impacts of climate factors on ecosystem ET in many regions across different climate zones in the context of global warming, ranging from humid catchments and semi-arid and arid mountainous basins to boreal forests [23,24,25,26,27]. However, the impact of elevation on the sensitivity of mountain forest ET to atmospheric water input and demand has rarely been discussed. This issue is becoming more relevant as water input fluctuation and atmospheric water demand increase [28]. One of the challenges in studying ET and its response to climate variability is the spatial heterogeneity of mountainous forest ecosystems, particularly along the elevation gradient [29]. This spatial variation is influenced by the multiple altitudinally controlled climatic zones of mountains, complex land surface conditions, and the intricate forest ET process [30]. Recent advancements have led to the development of several long-term gridded ET products utilizing remote sensing, land surface models, and data assimilation. These products have the capability to address the limitations of ground measurements and provide opportunities for studying large-scale spatiotemporal variations in ET [31].
Furthermore, recent studies have emphasized the significant impact of bedrock lithology and regolith properties on the sensitivity of ecosystem productivity to variations in climatic water deficit [32,33]. Of particular note is the limited water storage and supply capacity of the shallow soil cover beneath mountain forests, highlighting the critical role of water from the bedrock regolith in sustaining these forests during dry periods [34,35]. In tectonically active environments characterized by fault zones that fragment rocks and create complex geomorphological features, surface fault characteristics play a crucial role in shaping the spatial and temporal vegetation patterns [36,37]. Hence, geological variables, such as regolith properties and tectonic properties, likely play a significant role in regulating mountain forest ET, although detailed studies investigating these geological impacts remain limited.
The Tianshan Mountains, known as the “water tower of Central Asia” [38], are the largest mountain range in arid regions globally and act as the primary water source and ecological barrier for the region. Mountain forests within the Tianshan Mountains play a crucial role in water and soil conservation, as well as in maintaining ecosystem functions. The climatic conditions and forest ecosystems of the Tianshan Mountains are highly sensitive to climate change [39]. Furthermore, the Tianshan Mountains are a classical resurgence orogenic belt resulting from the collision of the Indian and Eurasian continents. This collision has led to complex geomorphological conditions, diverse bedrock types, and active tectonic movements in the region [40]. The relationship between mountain ecosystems and the geoenvironment is complex, involving mutual feedback. Currently, it remains unclear how forest ET and its sensitivity to climatic conditions vary in the Tianshan Mountains. Additionally, investigating the connections between these changes in sensitivity and regional conditions such as topography, geology, and soils is essential. Addressing these questions is crucial for understanding the response of hydrological processes in mountain forests to environmental changes and for developing restoration measures at different elevations with varying hydrothermal conditions.
This study aims to explore the significance of incorporating elevation gradients and geological elements to understand changes in ET in dryland mountain forests. Specifically, the research in this study focuses on the forested areas within the mid-altitude zone (1000–3500 m) of the Chinese Western Tianshan Mountains. To analyze spatiotemporal variations in ET, a high-spatial-resolution gridded remote sensing ET product based on the Penman–Monteith–Leuning equation version 2 (PML-V2) is utilized, along with gridded P and PET data. Spearman’s correlation coefficient, the moving-window method, and the Kendall test are used to investigate the multi-year mean and trend of ET sensitivity to climatic conditions at the pixel level. Finally, the machine learning algorithm eXtreme Gradient Boosting (XGBoost) is used to evaluate the impact of environmental variables such as topography, geology, soil, and vegetation on variations in sensitivity.

2. Materials and Methods

2.1. Study Area

The Tianshan Mountains, a large mountain range in Central Asia, stretch approximately 2500 km in length and 200–400 km in width. They are considered the world’s largest and most isolated east–west mountain range in the temperate arid zone and are a significant part of the southern Central Asian Orogenic Belt. In northwestern China’s Xinjiang Uygur Autonomous Region, also known as the Chinese Tianshan Mountains, the eastern part extends 1700 km from east to west, with an average elevation of approximately 2300 m above sea level (asl) [39]. The Chinese Tianshan Mountains are divided into eastern and western sections by the Urumqi-Korla line. This study specifically focuses on the Western section of the Chinese Tianshan Mountains, CWTM (79°45′ E to 86°58′ E, 41°46′ N to 45°24′ N; see Figure 1), which covers approximately 248,000 km2 and consists of diverse landforms such as high mountains, steep hills, wide basins, and river valleys. Within the borders of China, the highest elevations typically range between 4500 and 5500 m, although towards the western parts of this range, peaks higher than 7000 m are found. The boundary zone between the basin and the mountains is characterized by numerous active faults and folds, leading to fragmented rocks and a series of thrust earthquakes in the area [40]. The CWTM spans different bioclimatic zones, all falling within the semi-arid climate range between the warm temperate desert of the Tarim Basin to the south and the temperate desert of the Junggar Basin to the north.
The CWTM is a significant part of the Tianshan Mountains, showcasing a variety of natural landscapes including glaciers, permanent snow cover, virgin forests, grasslands, and deserts. It exhibits the most comprehensive mountain elevation vegetation belts in a globally temperate arid region, transitioning through a montane steppe belt, a coniferous forest belt, an alpine meadow belt, an alpine cushion vegetation belt, and a nival belt. The mountain forest is predominantly composed of the boreal tree species Picea schrenkiana var. tianshannica and is mainly distributed in the mid-altitude zone (1000–3500 m asl), covering approximately 4600 km2. Therefore, this region was chosen as the study area for forest ET research. The average annual temperature in this region ranges from −6 to 8 °C, with an average annual precipitation varying from approximately 200 mm to 600 mm, most of which falls during the rainy season (June–September) [37]. The mid-altitude CWTM is characterized by two main soil types: chernozems and kastanozems, with a thickness generally less than 80 cm. These soils are formed from a parent material consisting of unevenly thick loess-like substances.

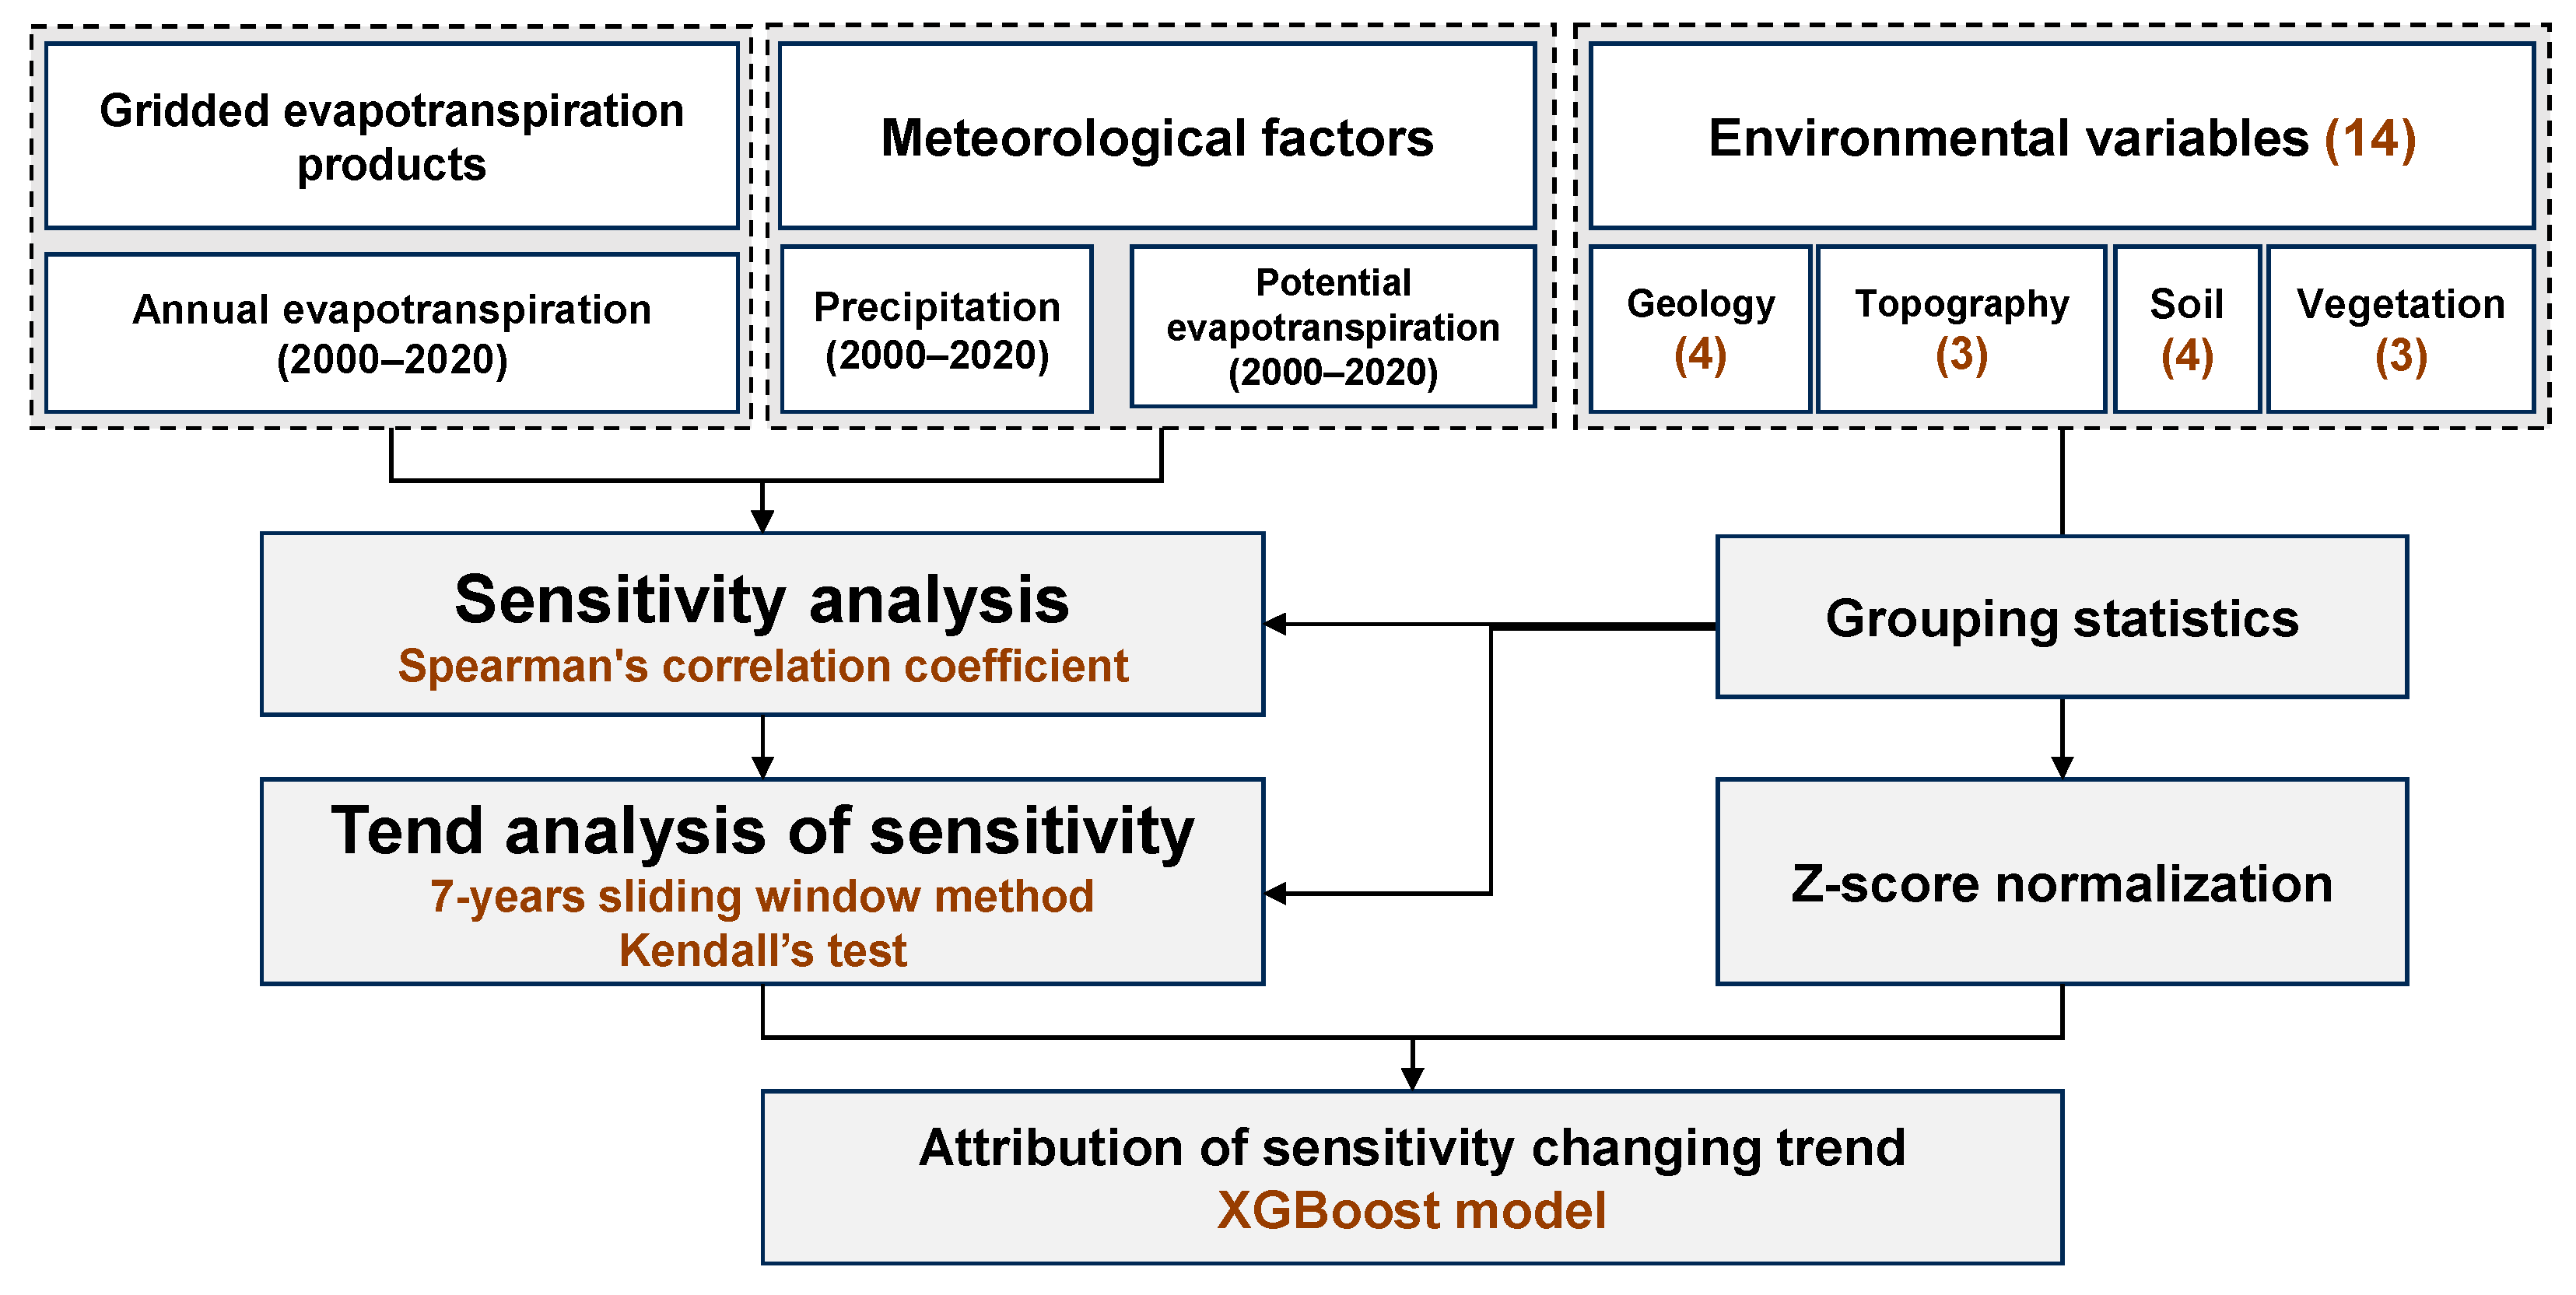
2.2. Data Sources and Processing

PML-V2 was used to evaluate ET from the ET product [41]. The PML-V2 ET product provides data at 8-day temporal and 500 m spatial resolutions, incorporating vegetation transpiration and gross primary productivity through a biophysical canopy conductance model in the PML model. This model also considers the impact of changes in CO2 concentration. The accuracy of the product was validated against ground observations from 95 flux towers representing ten plant functional types globally, showing high accuracy. Among five process-based ET algorithms, the PML-V2 product was found to be the most important at the site scale for integrating ET across China [31]. The spatiotemporal variation of terrestrial ET and its components has been demonstrated by the wide use and verification of the PML-V2 ET dataset [42]. In this study, we analyzed the spatiotemporal variation in annual ET in the CWTM region from 2000 to 2020. Annual climatic data, including P, temperature, and PET, were obtained from a 1 km monthly meteorological dataset covering China from 2000 to 2020 [43,44].
Land cover data were sourced from the China National Land Use and Cover Change (CNLUCC) dataset, with a spatial resolution of 30 m (http://www.resdc.cn/, accessed on 25 July 2023) [45]. This dataset was chosen for its suitability in conducting long-term time series research in China compared to other land cover products [46]. The CNLUCC consists of six major land cover categories, namely farmland, forestland, grassland, water, urban land, and unused land. In this study, a sub-group within the “forestland” category named “natural and plantation forests with canopy density >20%”, which plays a significant role in local environments, was selected to represent the mountain forests. To emphasize the sensitivity of forest evapotranspiration to climatic variations (atmospheric water input and demand) and minimize the impact of land use change, we chose the grid where the predominant land use category based on CNLUCC data for the years 2000, 2005, 2010, 2015, and 2020 was “forestland” (the mode).
A total of 14 environmental variables were used to predict the ET pattern, encompassing geological, topographic, soil, and vegetation variables. Detailed information regarding the resolution and sources are presented in Table 1.
(1) Geological data include distance to faults (DTF), depth to bedrock (DTB), regolith porosity (RPO), and regolith permeability (RPE). DTF data were calculated using the Euclidean Distance tool in ArcGIS Desktop 10.8 (Esri Co. Ltd., Redlands, CA, USA) based on geological fault line data from the spatial database of the 1:250,000 Digital Geologic Map of Xinjiang, provided by GeoClound3.0 (https://geocloud.cgs.gov.cn, accessed on 16 July 2023). DTB data were extracted from high-resolution (100 m) DTB maps of China [47], computed based on 6382 DTB observations from the Chinese National Important Geological Borehole Database. RPO and RPE data were obtained from the Global HYdrogeology MaPS (GLHYMPS), providing the permeability and porosity of consolidated and unconsolidated geologic units beneath soil horizons, with an average polygon size of approximately 100 km2 [48]; this was converted to a regular grid with a spatial resolution of 500 m for usage. The correlation coefficient between RPO and RPE was only 0.03, indicating that these two variables in this dataset represented independent information [32].
(2) Topographic information, including elevation (ELE), slope (SLP), and aspect (ASP), was obtained from the ASTER Global Digital Elevation Model with a spatial resolution of 90 m (http://www.gscloud.cn/, accessed on 16 July 2023) and processed using the spatial analyst tool in ArcGIS Desktop 10.8.
(3) Soil information was obtained from SoilGrids2.0 250 m (https://soilgrids.org/, accessed on 16 October 2023) [49], which provided a global dataset of soil properties at six standard depths from 0 to 200 cm. Three soil properties related to hydraulic conductivity were selected: coarse fragments fraction, sand particles proportion, and organic matter content [50], and the multi-layer values were averaged for use. Soil depth data with a spatial resolution of 250 m were extracted from the basic soil property dataset of the high-resolution China Soil Information Grids [51].
(4) Vegetation variables comprised the normalized difference vegetation index (NDVI), rooting zone water storage capacity (RZWS), and rooting depth (RD). NDVI during the growing season (April to October) was derived from the MOD15A2H product with a spatial resolution of 500 m for the years 2000 to 2020, obtained from Google Earth Engine (https://code.earthengine.google.com/, accessed on 7 July 2023) [37]. RZWS data, which quantify the amount of water accessible to plants, were extracted from a global dataset derived using mass-balance approaches with a spatial resolution of 0.05° × 0.05° (~5 km) [52]. RD data were extracted from a global dataset of the maximum depth of root water uptake, computed from inverse modeling of root water uptake profiles with a spatial resolution of 1 km [53].
Using ArcGIS Desktop 10.8, all the data were resampled to a spatial resolution of 500 m using the nearest-neighbor interpolation and projected in the WGS 1984 coordinate system using the Mercator projection (Universal Transverse Mercator, UTM). The index band selected was 45° N. Extraction tools in the ArcGIS Desktop 10.8 were used to generate multiple attributes for individual grids, which were then analyzed, processed, and plotted using Microsoft Excel and Python software (version: 3.11). Maps were created using ArcGIS software.

2.3. Methodology

In this study, the inter-annual trend of annual ET, P and PET from 2000 to 2020 was examined using a linear regression model with time (year) as the independent variable. ET sensitivity was calculated by determining Spearman’s correlation coefficient between annual ET data and meteorological factors (P and PET) on a per-pixel basis. Furthermore, changes in ET sensitivity were analyzed using Kendall’s τ with sliding 7-year windows of inter-annual series. The relative importance of multiple factors contributing to ET sensitivity and its trend was estimated using machine learning algorithms (XGBoost models). The technical flowchart in Figure 2 illustrates this process.

2.3.1. Sensitivity Analysis and Its Trend

Spearman’s correlation coefficient was used in this study to assess the sensitivity of ET to meteorological factors. While the Pearson correlation coefficient is effective in identifying linear relationships, the Spearman rank correlation coefficient is more suitable for variables with non-normal distributions, homoscedasticity, and linear or small sample sizes; it can also detect monotonic relationships [54,55]. The sign of the Spearman’s coefficient indicates the direction of the relationship. A larger value (positive or negative) suggests a stronger response of the flux to variability in the variable. A coefficient close to zero indicates that the flux did not respond significantly to the variable.
The trends of the 7-year window Spearman’s correlation over the two-decade study period were assessed using Kendall’s τ, a ranked correlation coefficient that ranges from −1 to 1 and incorporates nonparametric hypothesis testing. This was accomplished by utilizing sliding multi-year sequences (2000–2006, 2001–2007, …, 2014–2020) of Spearman’s correlation coefficients at the pixel level. To validate the robustness of the findings, sensitivity analyses were conducted using different time windows (W = 7, 9, 11, 13 years), and a 7-year window was determined to be the optimal length for analysis [56]. A positive value of Kendall’s τ indicates an increasing trend in sensitivity to environmental variables, while a negative value indicates the opposite trend. Due to its ability to account for temporal dependence, Kendall’s τ is recognized as a reliable and robust index that represents the rate of change in correlations. It identified significant trends in the trend analysis at the P < 0.05 level [57].

2.3.2. Attribution Analysis

To evaluate the relative importance of various environmental variables influencing long-term mean values and trends in ESP or ESPE (targets), eXtreme gradient boosting machine learning models (XGBoost) were utilized. The XGBoost method is capable of capturing nonlinear relationships and interaction effects in the data, making it suitable for complex prediction problems [58]. Additionally, its built-in regularization term can control the complexity of the model and effectively prevent overfitting. The XGBoost method enables parallel data processing and further enhances model performance by including regulatory factors to prevent overfitting; these factors have been widely implemented in attribution analysis [56,57,58]. To directly compare the sensitivity to environmental variables, we standardized the original environmental data as the “standardized anomaly” (also known as z-score) by subtracting the mean and then dividing by one standard deviation. Randomized searches was used to determine the optimal parameter combinations (training size: 30%, learning rate: 0.1, number of estimators: 400, maximum depth of tree: 10, minimum value of the loss function: 0, sum of weights of the smallest leaf node samples: 10). The data were split into testing and training parts, and fivefold cross-validation was additionally performed to avoid overfitting. These processes were executed using the Python packages “xgboost”, “sklearn.model_selection”, and “sklearn.metrics”.

3. Results

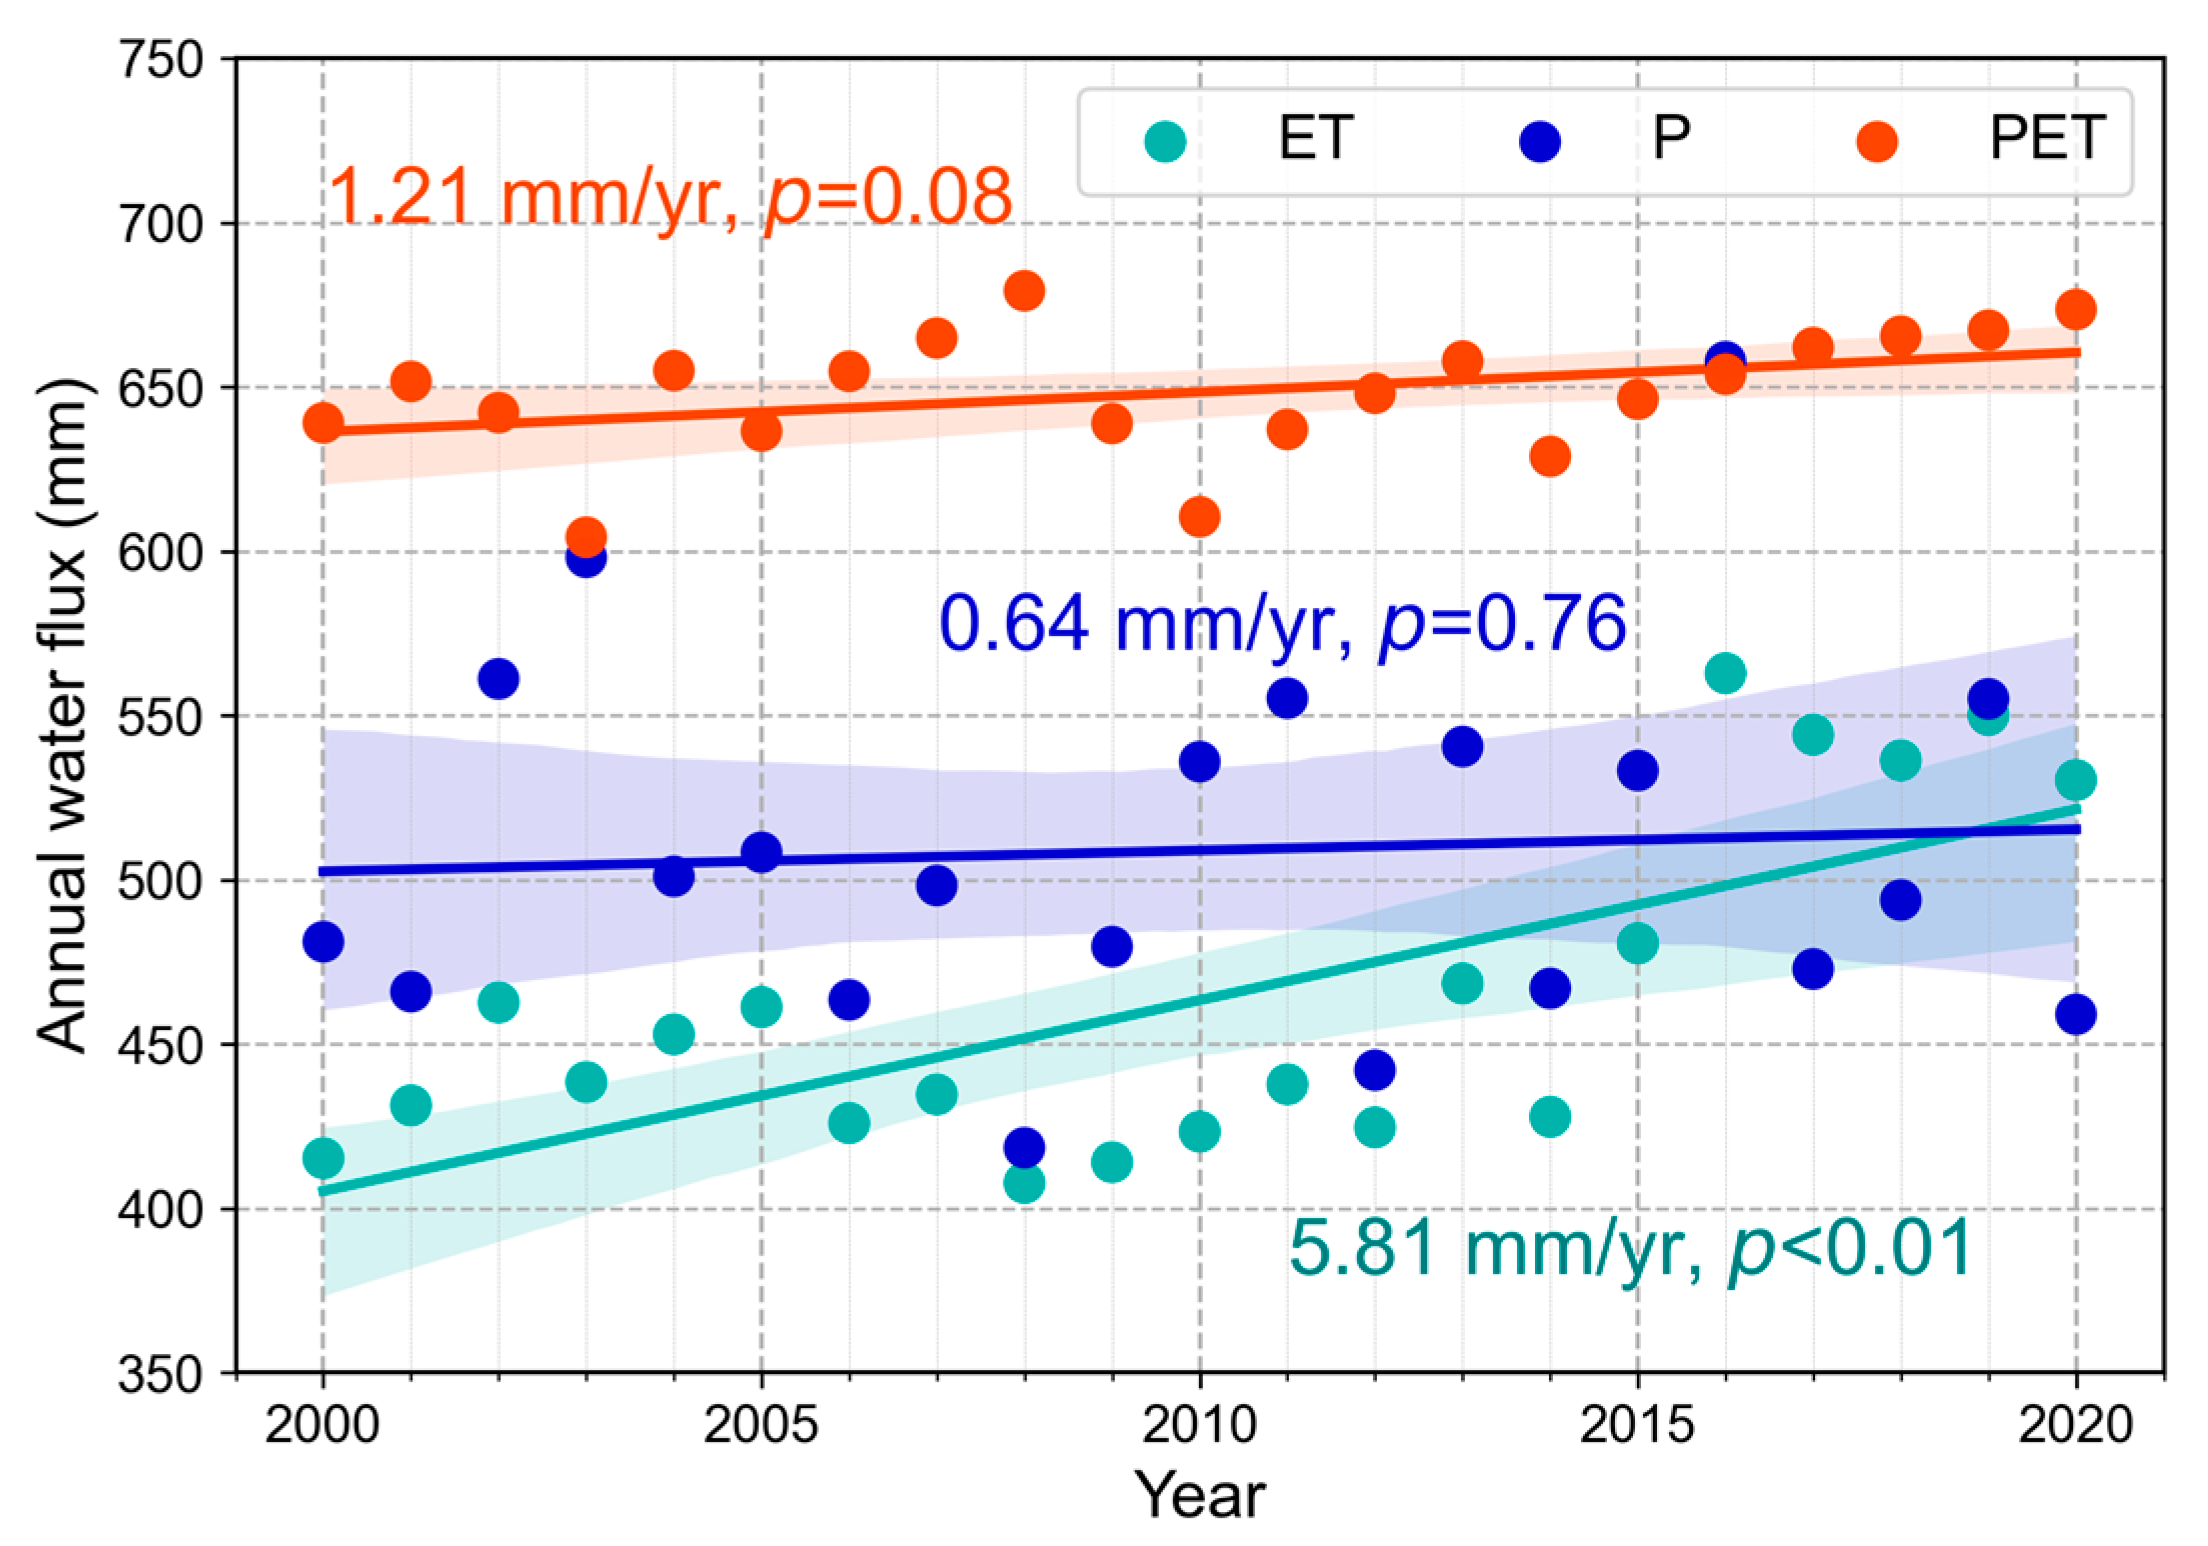
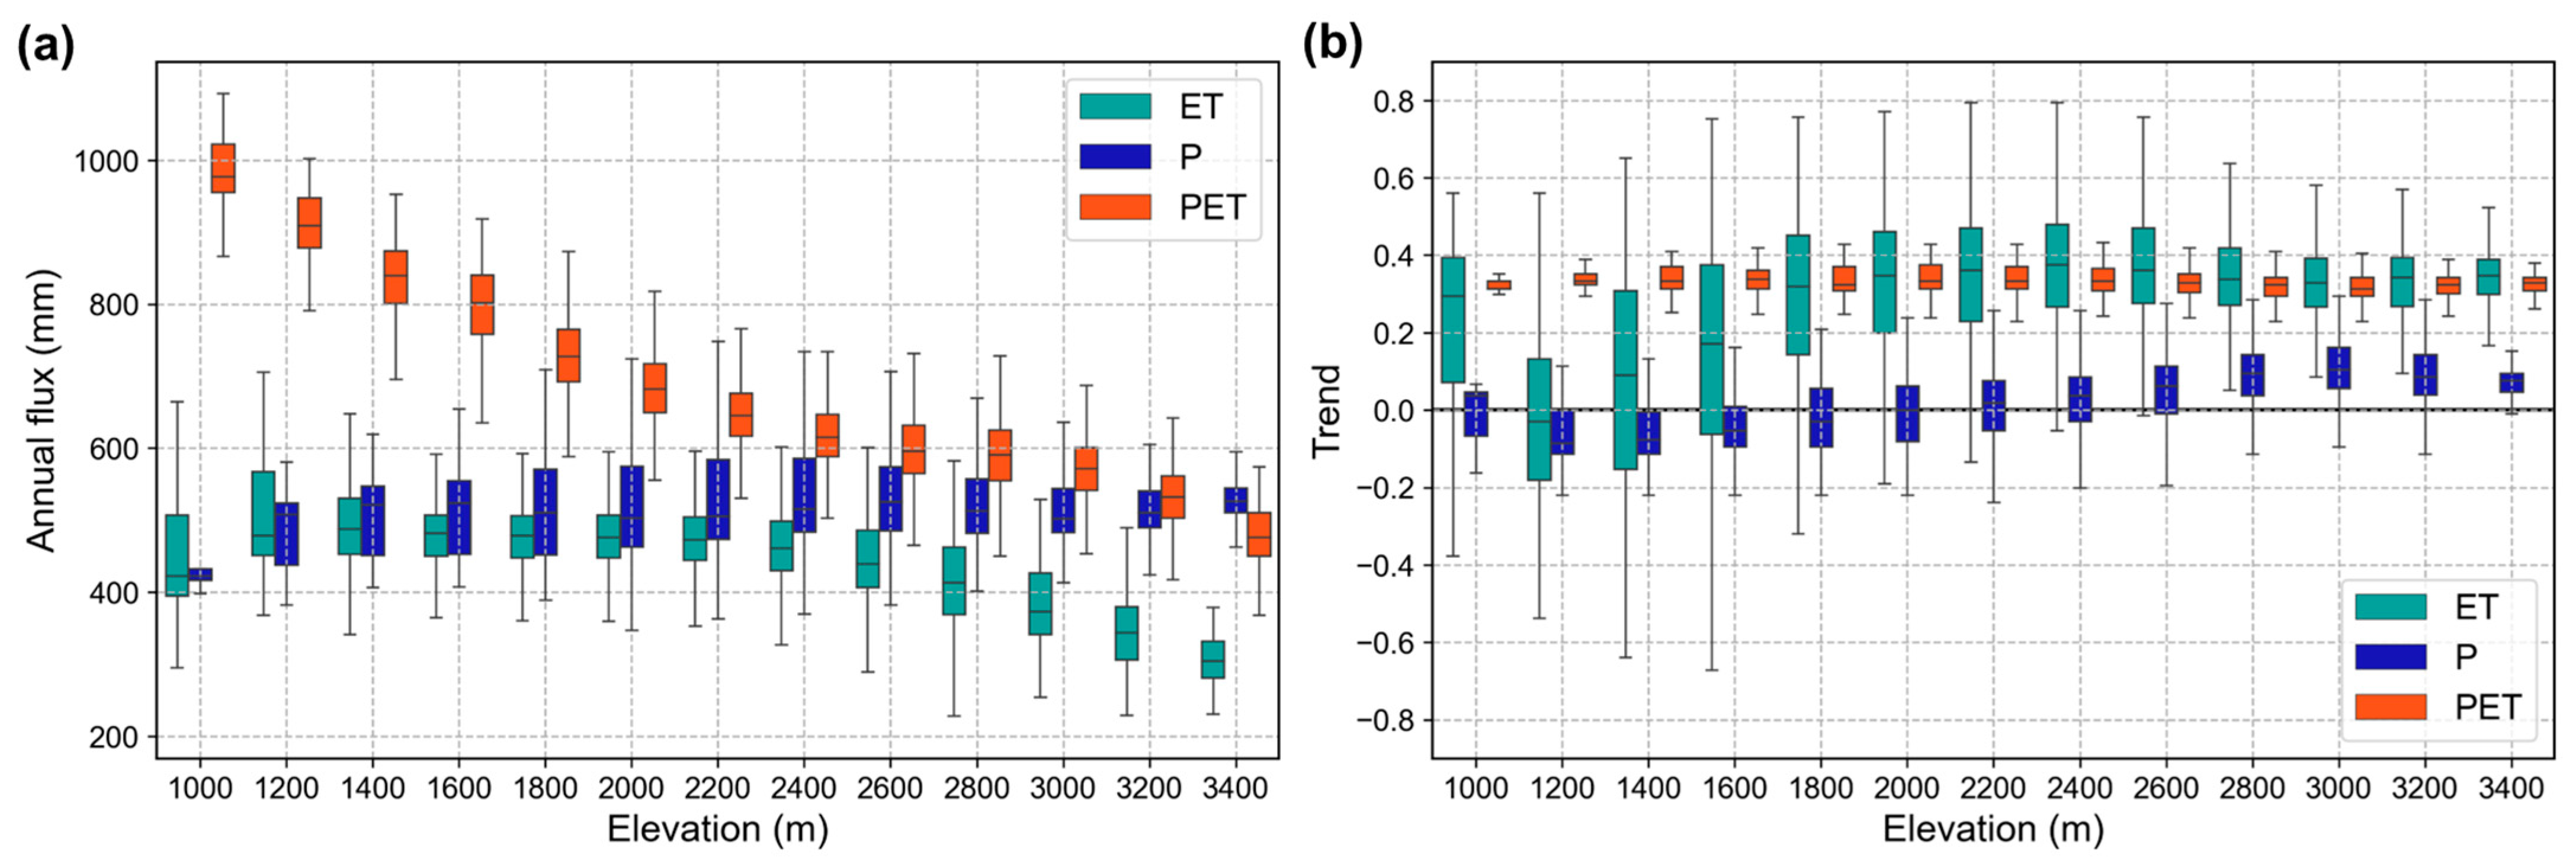
3.1. Spatiotemporal Patterns of Evapotranspiration and Climatic Factors

Annual ET, P, and PET in the study area exhibited distinct inter-annual trends from 2000 to 2020, with some existing correlations (Figure 3). The multi-year mean PET was 648.4 mm, indicating a non-significant increasing trend of 1.21 mm/yr (p = 0.08) according to the linear regression. It increased from a mean of 643.4 mm in 2000–2010 to 654.0 mm in 2011–2020, reaching its peak value in 2008 at 679.2 mm. The average annual P was 506.3 mm, showing a non-significant increasing trend of 0.64 mm/yr (p = 0.76). The lowest value was recorded in 2008 (418.4 mm), which is consistent with the year of the highest PET, while the highest value was recorded in 2016 (647.6 mm). Considering the combined influence of P and PET, the multi-year average ET was 463.3 mm, indicating a significant increasing trend of 5.81 mm/yr (p < 0.01). It increased from an average of 433.4 mm in 2000–2010 to 496.3 mm in 2011–2020, reaching its peak in 2016 at 562.8 mm, which aligns with the year of the highest P.
From 2000 to 2020, PET, P, and ET exhibited distinct distribution patterns along the elevation gradient (Figure 4). Multi-year mean annual PET generally decreased monotonously with the increasing elevation, with a median decrease from 976.8 mm at elevations of 1000–1200 m to 477.7 mm at elevations of 3500 m. In contrast, multi-year mean P did not show significant changes with elevation, remaining around 500 mm. ET remained relatively stable at elevations of 1000–2500 m, with a median of 474.5 mm. However, at elevations of 2500–3500 m, ET significantly decreased with an increasing elevation, reaching the lowest median value of 300.8 mm at the highest elevations of 3400–3500 m. The multi-year trends of these three variables along the elevation gradient also differed. For any elevation and from 2000 to 2020, PET showed a consistent increase of ~0.33 mm. In contrast, the trend in P decreased at lower elevations and increased at upper elevations. As a result of these trends, ET at elevations of 1000–2000 m showed no significant trend, whereas in most forests above 2000 m, there was an increasing trend.

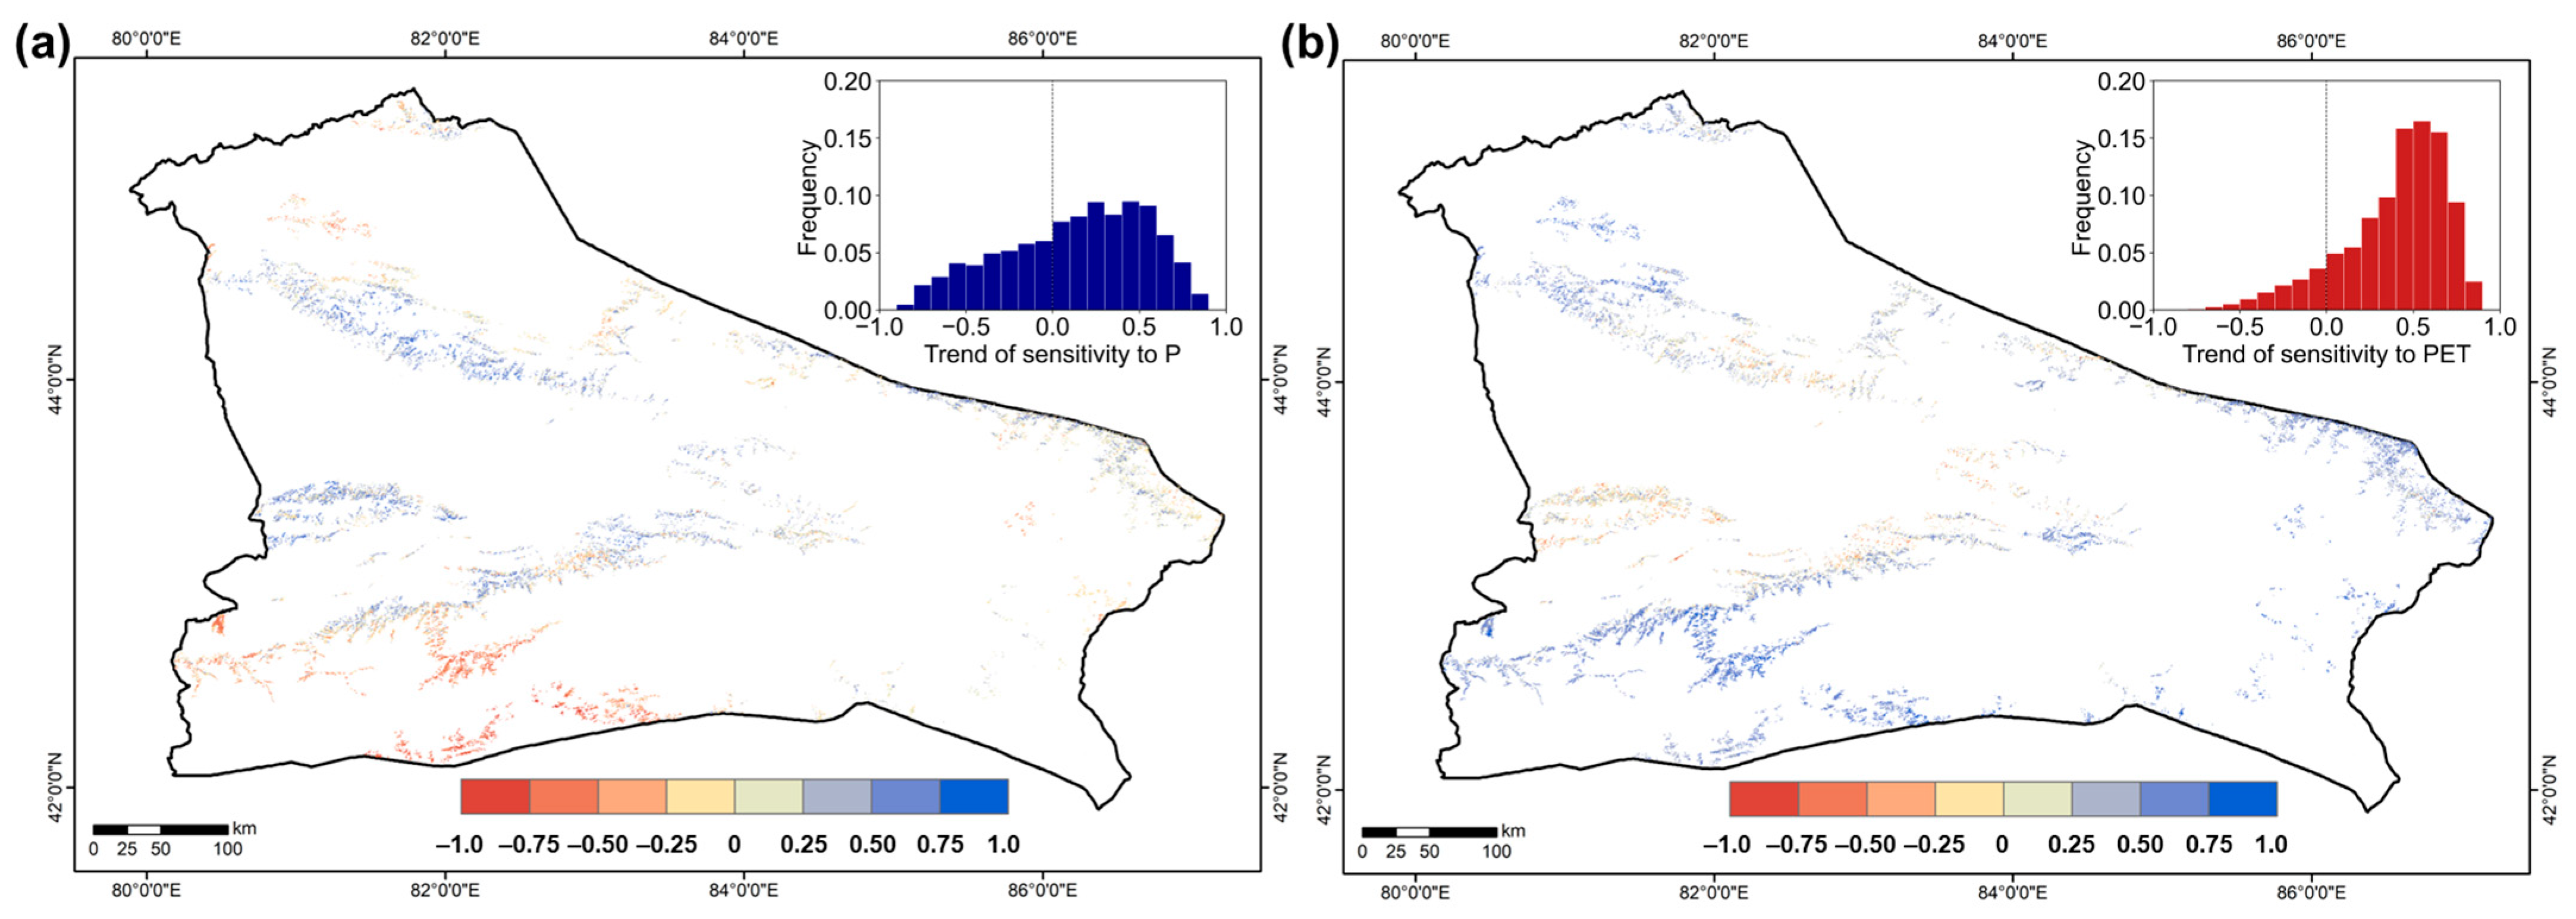
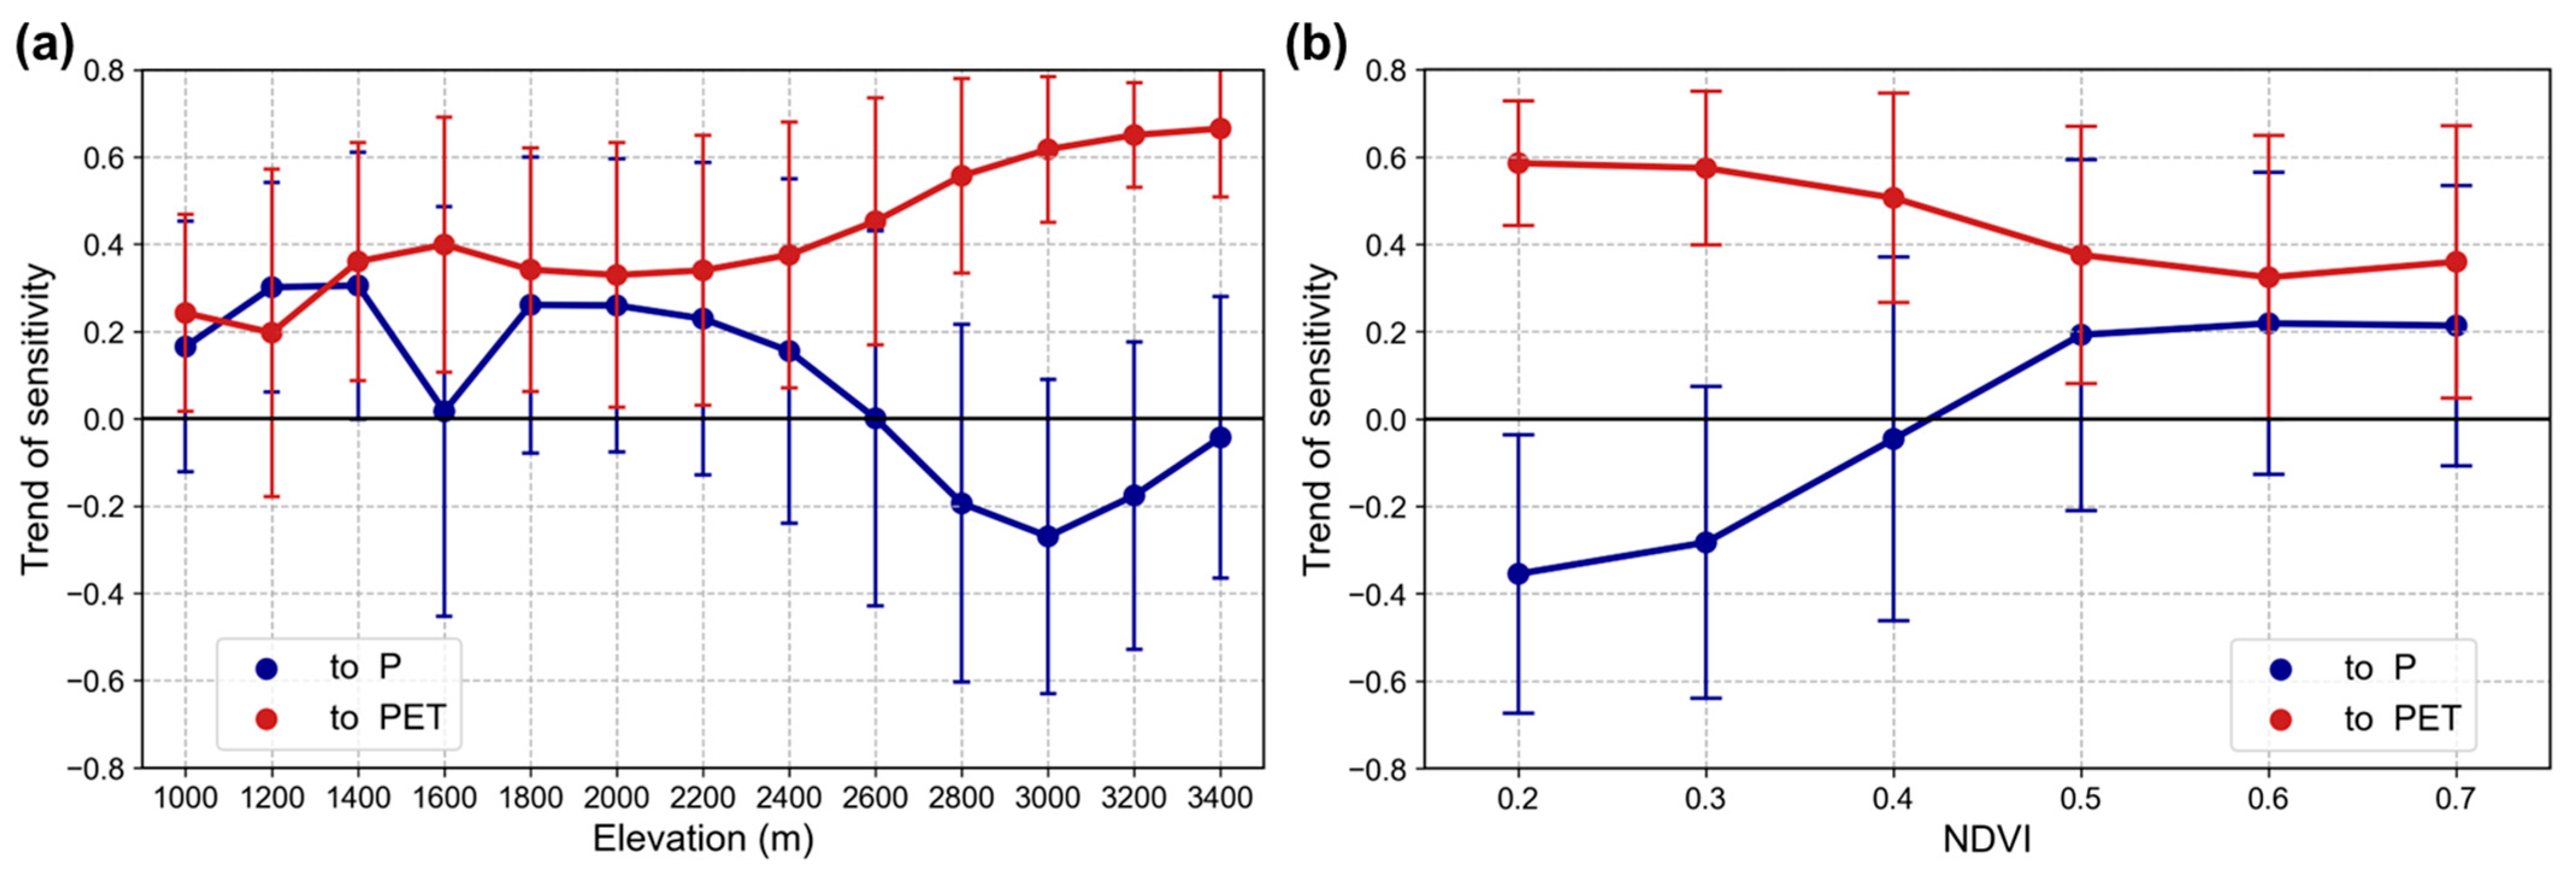
3.2. Spatiotemporal Patterns of Evapotranspiration Sensitivity and Its Trend

During the period 2000–2020, the ET in mountain forests displayed distinct spatial variations in sensitivity to both P and PET (Figure 5). The sensitivity of ET to precipitation (ESP) was mostly positive, covering approximately 93.5% of all forested areas. This sensitivity was primarily concentrated in the range of 0.3–0.4. In contrast, the sensitivity of ET to PET (ESPE) was comparatively lower, with approximately 70.0% of mountain forest ET exhibiting positive sensitivity, primarily falling within the range of 0.1–0.3. Notably, ESP and ESPE demonstrated opposing trends. For example, in the southern region of the study area, mountain forests displayed a positive ESP (as indicated by the blue color in Figure 5), while their ESPE was negative (as indicated by the yellow or orange color in the figure).
Similarly, the ESP and ESPE in mountain forests exhibited an elevation-dependent distribution pattern (Figure 6a). ESP decreased approximately between elevations of 1000–2200 m, increased between 2200–3200 m, and then decreased again between 3200–3500 m. In contrast, ESPE showed a pattern of initial increase, followed by a decrease, and then a slight increase within the same elevation intervals. The former fluctuated within an average range of 0.25 to 0.35, while the latter fluctuated within an average range of −0.2 to 0.2. The relationship between both sensitivities and the NDVI was inversely proportional. As the NDVI increased, ESP decreased and stabilized at a low level, while ESPE increased and then stabilized (Figure 6b). Mountain forests with low vegetation coverage (NDVI < 0.35) displayed both positive and negative ESPE, whereas those with high coverage (NDVI > 0.35) demonstrated positive ESP and ESPE.
During the period from 2000 to 2020, there was clear spatial variability in the multi-year trend in the ESP and ESPE in mountain forests (Figure 7). Approximately 64.5% of mountain forest ET showed an increasing trend in ESP, with a relatively scattered distribution, mainly within the range of 0–0.06. In contrast, approximately 88.1% of mountain forests exhibited an increasing ESPE, with a more concentrated distribution, primarily falling within the range of 0.4–0.7. Notably, a considerable number of mountain forests showed contrasting trends in ESP and ESPE. For example, in the southern part of the study area, mountain forests exhibited a decreasing trend in ESP (indicated by the deep orange color in Figure 7) but an increasing trend in ESPE (indicated by the deep blue color in the figure).
Both the ESP and ESPE in mountain forests displayed contrasting patterns along the elevation gradient (Figure 8). ESP generally decreased with elevation, with positive average values at elevations of 1000–2800 m, which then turned negative at 2800–3500 m. In contrast, ESPE significantly increased with elevation. The average value increased from 0.21 to 0.64 at elevations of 1000–3500 m, accompanied by a decrease in the standard deviation. The relationship between these two sensitivity trends and the NDVI was also contrasting. Mountain forests exhibited an increasing trend in ESP as the NDVI increased, eventually stabilizing at high levels. Conversely, ESPE values decreased and stabilized at low levels as the NDVI increased. Mountain forests with low vegetation coverage (NDVI < 0.4) showed a positive ESP trend (>0.4) and a negative ESPE trend. In contrast, mountain forests with a high coverage (NDVI > 0.5) showed a similar positive trend in ESP and ESPE.
ESP and ESPE, along with their trends, in mountain forests exhibit significant diversity across different elevations and growth conditions (Figure 9). A significant proportion (63.5%) of the mountain forests exhibited positive ESP and ESPE values, primarily located at elevations of 2000–3000 m. Notably, ET in forests at higher elevations of 2500–3000 m was generally less sensitive to PET but more susceptible to P. As illustrated in Figure 9b, the majority (52.8%) of mountain forests showed an increasing trend in both ESP and ESPE, with an average elevation of 2000–3000 m and an average NDVI of 0.56. It is particularly noteworthy that the ESPE trend in forests at higher elevations of 2500–3000 m is higher. Approximately 34.9% of mountain forests showed a trend of decreasing ESP and increasing ESPE, with an average elevation of 2000–2500 m and an average NDVI of 0.49.

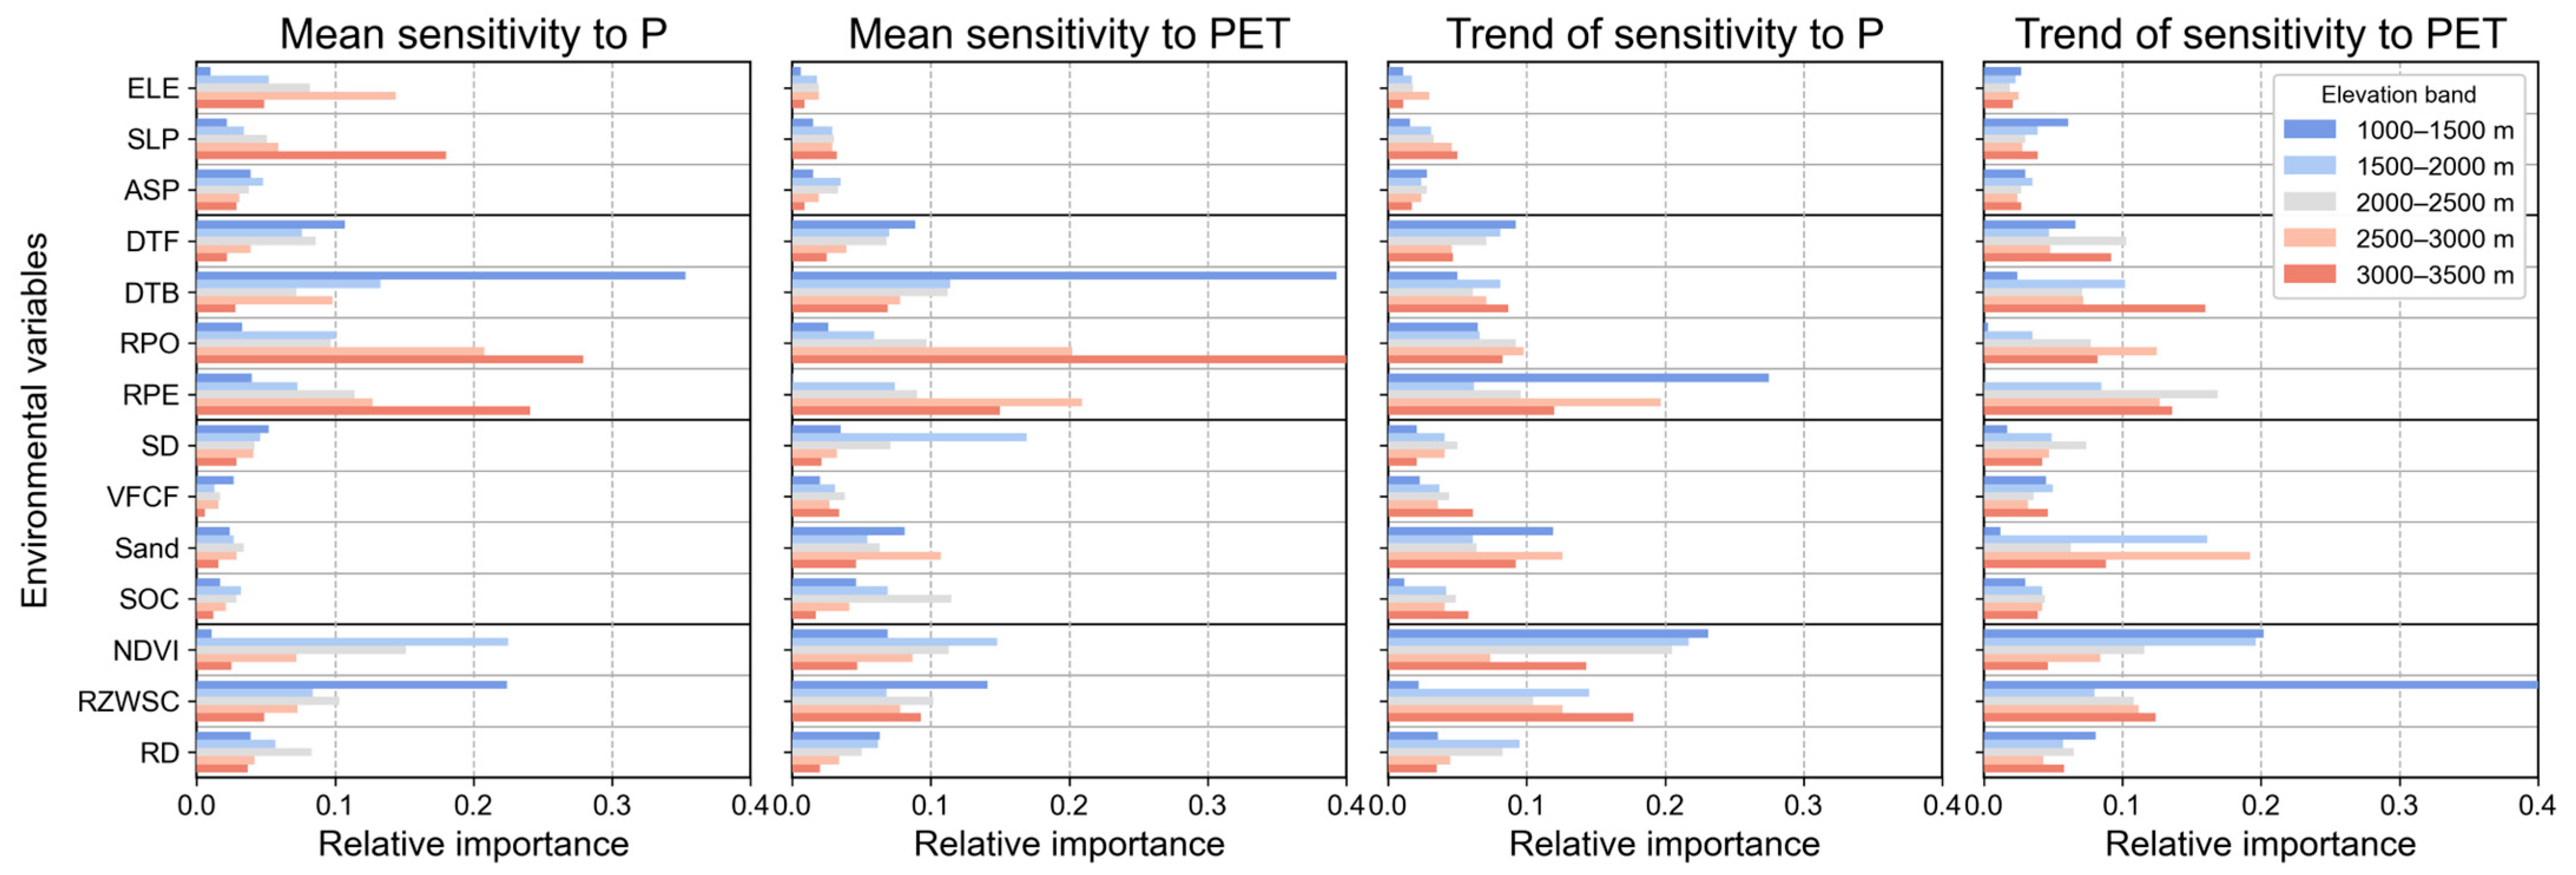
3.3. Attribution of Sensitivity Trends

The influence of environmental variables on ESP and ESPE shows significant variation across different elevation bands. Figure 10 illustrates that DTB and RPO are the predominant factors affecting ESP. Specifically, the relative importance of DTB peaks at a value of 0.36 at low elevations of 1000–1500 m, while its influence is significantly reduced in higher elevation bands. Conversely, the relative importance of RPO peaks with a mean value of 0.28 at elevations of 3000–3500 m. Similarly, for ESPE, the pattern is similar, with DTB’s relative importance being most pronounced at the lower elevations of 1000–1500 m, averaging 0.39, and decreasing in other zones. The maximum relative importance of RPO is observed at 0.43 at elevations of 3000–3500 m. These findings underscore the significance of DTB and RPO, both geological variables, as the primary driving factors influencing ESP and ESPE, with their impact varying across different elevation levels. In the case of ESP, the relative importance of elevation (ELE), slope (SLP), RPO, and RPE increases with elevation. In contrast, the relative importance of DTF, DTB, and rooting zone water storage capacity (RZWSC) shows a declining trend in increasing elevation. The environmental variables influencing ESPE and ESP showed a consistent pattern along the elevation gradient.
The impact of each environmental variable on trends in ESP and ESPE varied significantly across the different elevation bands, as shown in Figure 10. Interestingly, RPE and NDVI emerged as the most influential variables for ESP trends, displaying significant relative importance across a wide range of elevations. Their effect was particularly pronounced in the 1000–1500 m band, where their relative importance exceeded 0.20. This emphasizes the crucial role of RPE and NDVI in shaping ESP trends, especially at lower elevations. Moreover, for ESPE trends, NDVI and RZWSC were identified as the primary contributors, exerting the most substantial influence at elevations of 1000–1500 m, with mean relative importances of approximately 0.20 for NDVI and 0.41 for RZWSC. This suggests that NDVI and RZWSC, both vegetation variables, are the dominant factors influencing ESPE trends, particularly in lower elevation zones.
In the case of mountain forests, geological variables made the greatest contributions to ESP and ESPE, with mean values of 0.47 and 0.48, respectively (Figure 11). Topographic and vegetation variables showed similar contributions, with mean values ranging from 0.20 to 0.26. However, for trends in ESP and ESPE, the contributions of geological variables were significantly reduced compared to the sensitivity, with values of 0.36 and 0.33, respectively. On the other hand, the relative importance of vegetation variables increased significantly, with mean values of 0.35 for both ESP and ESPE trends. The relative importance of soil and topographic variables to the sensitivity and its trend did not change significantly, with mean values of around 0.21 and 0.08, respectively. Notably, topographic variables had the smallest contribution to the sensitivity and its trend.

4. Discussion

4.1. Elevation Variation of Climatic Conditions and Its Temporal Trend

Mountains are highly sensitive to climate change, experiencing more pronounced climate variations compared to lowland regions worldwide [59]. This study showed a significant increase in PET in the mid-altitude zone of the Chinese Western Tianshan Mountains since 2000, as depicted in Figure 3, which is consistent with the trends in the arid region of Northwest China [60]. Climatic warming and humidification have been observed in arid Northwest China [61]. In contrast, annual precipitation in the study area has fluctuated with no significant trends. Observation-based studies have indicated a climatic shift from “warm-wet” to “warm-dry” around the year 2000 in the low-altitude zone, including the north and south slopes of the Tianshan Mountains and Yili Valley [62], sparking a debate on regional variations in temperature and precipitation changes. To examine the spatial and temporal patterns of temperature and precipitation trends, a combined analysis of gridded observational, reanalysis, and modeled datasets would be necessary [63].
The relationship between climatic conditions and elevation is well-established. PET, which represents the maximum atmospheric evaporative capacity, is particularly influenced by elevation. Its sensitivity varies with multiple meteorological factors such as temperature, radiation, and relative humidity, along elevational gradients [44,64]. This study has demonstrated a decline in average PET with increasing elevation, consistent with temperature patterns [37]. The observed elevation-dependent pattern of PET is consistent with previous studies on dryland mountains in Northwest China based on previous observations [65]. Previous studies have indicated that warming is more rapid at higher elevations, which is a phenomenon referred to as elevation-dependent warming (EDW) [66]. However, this study found a relatively stable PET increasing trend with elevation (around 0.33). In contrast, in the Tibetan Plateau, the rate of change in PET declines with increasing elevation [67,68], highlighting a complex connection between the PET and EDW.
The elevational patterns of precipitation in the study area were consistent with those of adjacent arid mountain ranges, showing an increasing trend followed by a slight decline with increasing elevation [69]. Due to the strong heterogeneity of climatic conditions, sparse observations, and coarse resolution of data in complex terrains, as well as the difficulties in measurements at high altitudes, accurate estimates of the spatial pattern of mountain precipitation are still challenging [59]. This uncertainty can be reduced by using downscaling approaches to precipitation products and integrating certain local covariates in future studies [70].

4.2. Elevational Variation of Forest Evapotranspiration and Its Sensitivity to Climatic Conditions

ET is a highly complex variable in the water cycle, regulated by a combination of internal (i.e., biological) and external (i.e., physical and climatic) processes [17]. Factors affecting ecosystems’ ET include climatic conditions (water demand and energy supply) and surface characteristics (subsurface water supply capacity and water transport capacity of vegetation). Surface characteristics traditionally include soil, topography, and vegetation, with vegetation being the most dynamic and determining factor [23]. Changes in vegetation, such as vegetation greening associated with the implementation of ecological restoration projects, greatly affect ET, the extent of which varies across different climates [71]. In humid regions, climate change dominates changes in ET (contribution > 90%), while vegetation cover mainly impacts the changes in the proportion of ET components (contribution ~60%) [26]. In contrast, in drylands, changes in vegetation type and increases in vegetation greenness contribute considerably to the increase in ET [65,72]. Although most forest coverage in the study area showed no increasing trend [37], forest ET showed a significant increasing trend for many years (5.81 mm/yr, P < 0.01). This increase was higher than the average level of increased ET in arid Northwest China [65]. Additionally, it was mainly attributed to the increase in water demand, as the water supply from precipitation in the study area showed no obvious trend (Figure 3). On the other hand, the increasing trend of ET in other drylands has primarily been driven by an increase in precipitation [27]. This suggests that while total vegetation growth in the Tianshan Mountains is sensitive to moisture changes [39], forest water consumption in its middle-altitude zone is more constrained by the water demand (closely related to temperature).
The spatial variation of ET is sensitive to climatic factors such as precipitation, net radiation, and temperature [18]. Generally, ET is highly positively correlated with precipitation in water-limited regions, while it is primarily influenced by air temperature and net radiation in energy-limited regions. Specifically, mountain ecosystems are water-limited at low elevations and energy-limited at high elevations [73]. Studies have demonstrated that the radial growth of forests in the Altay Mountains (located adjacent to the study area) at lower elevations (<1800 m asl.) was positively correlated with precipitation, whereas at higher elevations (>1800 m asl.) it was positively correlated with temperature [74]. Similarly, our study revealed that annual forest ET decreased with elevation, but forest ET at higher elevations (>2000 m asl.) exhibited a significant increasing trend. This trend may be linked to the relief of low-temperature stress on plants in the energy-limited high-elevation zones and the lengthening of the growing season due to warming [75,76]. Future projections suggest that temperatures are expected to rise, while changes in precipitation remain uncertain in arid Northwest China [61]. This is likely to further lead to an increase in mountain forest ET at higher elevations, resulting in a decrease in runoff and streamflow, which could impact downstream water supply [77].
Our study found that the ET in most areas of the forest in CWTM was increasingly sensitive to P (64.5%) and PET (88.1%), indicating that these forests are indeed hotspots of hydrological intensification under climate change [78]. A similar pattern has also been observed in the alpine forests of northwest China’s Qilian Mountains [29,65] (Yang, L., 2021; Yang, L., 2022). Further, a positive temporal trend of ecosystem sensitivity to climate variability was observed in 61.28% of China from 2001 to 2021 [56]. Therefore, the pattern of increased ecosystem sensitivity would be more extensive under global warming. The increased sensitivity of ET to P, coupled with more frequent and severe climate extremes, could further enhance the relative importance of dryland mountains in the terrestrial carbon cycle [79]. Specifically, the heightened sensitivity of ET to PET at high elevations (>2500 m asl.) could increase forest ET in a warming climate, potentially increasing plant carbon uptake and growth [80]. However, this could lead to vegetation overgrowth and soil moisture depletion surpassing the ecosystem’s carrying capacity, significantly expanding the ecosystem’s water limitation and escalating the risk of vegetation degradation under ongoing climate change (i.e., structural overshoot) [81]. Vegetation degradation associated with structural overshoot accounted for over one-third of drought events and exhibited increasing trends from 1982 to 2015 in arid Northwest China [82].
There is increasing scientific evidence that the increasing forest ET under global warming has broader ecological implications. For example, the climatic factors, particularly P and PET, profoundly explained the richness pattern in the Larch forests and threatened plant species in the mountain regions of China [83,84]. Furthermore, ET is regarded as the primary climatic predictor of biodiversity, influencing not only the quantity of plant growth but also the environmental conditions it fosters [85]. Climate change influences vegetation growth and also impacts the physical, chemical, and biological properties of soil, consequently affecting soil health. Notably, PET greatly affects forest carbon use efficiency and soil organic carbon in Xinjiang. In particular, an increase in winter temperatures has significantly promoted the carbon sequestration capacity of Picea schrenkiana in the Tianshan Mountains [86,87]. Moreover, increased PET and its ET sensitivity contribute to the loss of resilience in forests, which is crucial for vegetation health [88]. Therefore, in the future, greater attention should be paid to monitoring forest greenness and water conditions at high elevations, and formulating forest management strategies that consider the impact of the terrain.

4.3. Geological Controls on Forest Evapotranspiration in Upland Landscapes

This study found that geological factors play a crucial role in determining the sensitivity of forest ET to climatic variations. The significance of the geological setting, including bedrock lithology, saprolite properties, and distribution of faults, on vegetation growth and ecohydrology on hillslopes has been increasingly emphasized in recent years [32,36,89]. A global-scale study has highlighted the impact of bedrock lithology and weathering products on the sensitivity of ecosystem productivity to changes in climate-related water deficits [32]. This influence is primarily exerted through their control over water holding capacity, with the extent of the impact varying across different geographic regions. In upland landscapes with shallow soils (typically less than 1 m), research at plot, slope, and regional scales has shown that plants, particularly woody ones, can endure drought by extracting water stored in weathered bedrock layers, which may be tens of meters thick, beneath the soil surface [42,90,91]. The uptake of water by deep roots of woody plants into weathered bedrock or saprolite has been observed across diverse climatic and geological settings [34]. This study highlighted a regional-scale link between forest water uptake and the geological setting of the region, demonstrating that water in weathered bedrock may be more vital for plants than soil water, particularly in dry seasons in arid mountainous areas.
Moreover, empirical studies have indicated that the availability of water for mountainous plants is not significantly linked to variations in rooting depth (RD) and soil depth (SD) [33]. Consistently, this study proposed that the role of RZWSC is more crucial than that of RD, suggesting that RZWSC better reflects water usage by mountain forests. Furthermore, the contributions of geological factors such as DTB and RPE were found to be more significant than SD, highlighting the potential role of weathered bedrock in supplying water to plants. For example, bedrock permeability controls the seasonal fluctuations in catchment water storage, and greater regolith permeability leads to a decrease in the water holding capacity of the subsurface ecosystem [32,92]. Therefore, considering weathered bedrock as a supplementary water source is beneficial for accurately modeling the seasonal transpiration patterns of trees in the mountainous regions during dry seasons [35].
Vegetation in areas with higher weathered bedrock, such as near fault areas, may exhibit higher productivity and water consumption under similar climatic conditions [37,93]. The presence of more fractured and highly weathered bedrocks in tectonic fault zones enhances the water holding capacity and nutrient status of soils, leading to improved vegetation growth in these areas [36]. However, vegetation in fault zones is also at a higher risk of fault-induced landslides and ecological disturbances [94]. The relationship between tectonic faults and vegetation growth is complex and varies depending on elevation [37]. Therefore, when conducting ecological restoration in dryland mountains with a complex terrain situated in a tectonically active region such as the Tianshan Mountains, it is crucial to consider the effects of elevation and local geological settings, including weathered bedrock and fault properties.

4.4. Limitations and Future Work

This study integrated the PML-V2 ET dataset, gridded climate products (P and PET) and multi-source environmental data to analyze the ET sensitivity to climate variation. However, the data and methods used for this analysis had some uncertainties. Firstly, the results in this paper are based on remote sensing data, and further validation is needed in the future by combining field monitoring and process-based models. Secondly, the sensitivity magnitude and variation of driving factors may differ for various sources of data, potentially introducing uncertainty into the results. Robust accuracy assessments of such data are essential [14]. Thirdly, Spearman’s correlation coefficient, the sliding window method, and Kendall’s test are combined to estimate the multi-year variation of sensitivity, and statistically based elasticity and variance analysis could be utilized in future sensitivity analysis [56,65].
Furthermore, this study primarily focused on natural stable forests and climatic and environmental variables. Over the past half-century, Xinjiang has experienced rapid population growth and intensified human activities (e.g., cultivation, grazing, and ecological projects), which account for over half of the variation in changes in each ecosystem indicator [95]. Notably, increased vegetation from ecological projects may greatly impact regional water cycles, especially in water-limited areas [71]. To comprehensively understand the observed trends in ET sensitivity, it is necessary to further incorporate anthropogenic factors, such as changes in land use and forest management practices, which could provide a more holistic view. Future studies should evaluate the differences in remote sensing products and enhance the temporal resolution of human activities data by conducting long-term verifications using in situ observation data. In-depth exploration of forest sensitivity to environmental change will need to consider the effects of these factors.

5. Conclusions

In summary, this study revealed a broad increase in forest ET in the mid-altitude zone of the Western Tianshan Mountains in China, driven primarily by rising water demand. A contrasting trend in the sensitivity of ET to P and PET along an elevational gradient was identified. Most forests displayed an increasing sensitivity to both P and PET, especially at elevations above 2000 m. These findings highlight the elevation-dependent sensitivity of dryland mountain forests to hydrothermal changes, with forests at higher elevations (>2000 m) emerging as critical areas responding to intensified water cycles. Geological factors, such as bedrock lithology and saprolite hydraulic properties, play key roles in influencing forest ET sensitivity to climatic variations. Overall, the detected increase in ET sensitivity suggests an enhanced response of mountain forest water cycles to climate changes in the context of global warming. By identifying regions with strong and increasing ET sensitivity at high elevations, this study underscores the importance of monitoring vegetation growth dynamics and water status in these particular hotspots.

Author Contributions

Conceptualization, X.L. (Xiaohuang Liu) and J.L.; data curation, analysis, and methodology, H.L. and X.L. (Xinping Luo); visualization, W.Z., R.W. and C.W.; writing—original draft preparation, and editing, H.L., H.Z. (Haoyang Zhu), X.Z. and H.Z. (Honghui Zhao). All authors have read and agreed to the published version of the manuscript.

Funding

This research was supported by the Science and Technology Innovation Fund of the Comprehensive Survey and Command Center for Natural Resources, China Geological Survey (KC20220015), National Nonprofit Institute Research Grant of IGGE (AS2022P03), the Third Xinjiang Scientific Expedition Program (2022xjkk090405 and 2021xjkk1401).

Data Availability Statement

The data presented in this study are available from the corresponding author X.L. with a reasonable request. The data are not publicly available due to privacy restrictions.

Acknowledgments

We thank the reviewers for their thoughtful comments and constructive suggestions which substantially improved this manuscript.

Conflicts of Interest

The authors declare no conflicts of interest.

References

  1. Li, C.; Fu, B.; Wang, S.; Stringer, L.C.; Wang, Y.; Li, Z.; Liu, Y.; Zhou, W. Drivers and impacts of changes in China’s drylands. Nat. Rev. Earth Environ. 2021, 2, 858–873. [Google Scholar] [CrossRef]
  2. Maestre, F.T.; Benito, B.M.; Berdugo, M.; Concostrina-Zubiri, L.; Delgado-Baquerizo, M.; Eldridge, D.J.; Guirado, E.; Gross, N.; Kéfi, S.; Le Bagousse-Pinguet, Y.; et al. Biogeography of global drylands. New Phytol. 2021, 231, 540–558. [Google Scholar] [CrossRef]
  3. Huang, J.; Li, Y.; Fu, C.; Chen, F.; Fu, Q.; Dai, A.; Shinoda, M.; Ma, Z.; Guo, W.; Li, Z.; et al. Dryland climate change: Recent progress and challenges. Rev. Geophys. 2017, 55, 719–778. [Google Scholar] [CrossRef]
  4. Abel, C.; Abdi, A.M.; Tagesson, T.; Horion, S.; Fensholt, R. Contrasting ecosystem vegetation response in global drylands under drying and wetting conditions. Glob. Chang. Biol. 2023, 29, 3954–3969. [Google Scholar] [CrossRef] [PubMed]
  5. Zhang, J.; Zhang, Y.; Qin, S.; Wu, B.; Ding, G.; Wu, X.; Gao, Y.; Zhu, Y. Carrying capacity for vegetation across northern China drylands. Sci. Total Environ. 2020, 710, 136391. [Google Scholar] [CrossRef] [PubMed]
  6. Immerzeel, W.W.; Lutz, A.F.; Andrade, M.; Bahl, A.; Biemans, H.; Bolch, T.; Hyde, S.; Brumby, S.; Davies, B.J.; Elmore, A.C.; et al. Importance and vulnerability of the world’s water towers. Nature 2020, 577, 364–369. [Google Scholar] [CrossRef] [PubMed]
  7. Allan, R.P.; Barlow, M.; Byrne, M.P.; Cherchi, A.; Douville, H.; Fowler, H.J.; Gan, T.Y.; Pendergrass, A.G.; Rosenfeld, D.; Swann, A.L.S.; et al. Advances in understanding large-scale responses of the water cycle to climate change. Ann. N. Y. Acad. Sci. 2020, 1472, 49–75. [Google Scholar] [CrossRef]
  8. Albrich, K.; Rammer, W.; Seidl, R. Climate change causes critical transitions and irreversible alterations of mountain forests. Glob. Chang. Biol. 2020, 26, 4013–4027. [Google Scholar] [CrossRef] [PubMed]
  9. Xu, H.J.; Zhao, C.Y.; Wang, X.P. Spatiotemporal differentiation of the terrestrial gross primary production response to climate constraints in a dryland mountain ecosystem of northwestern China. Agric. Forest Meteorol. 2019, 276–277, 107628. [Google Scholar] [CrossRef]
  10. Yao, J.; Chen, Y.; Guan, X.; Zhao, Y.; Chen, J.; Mao, W. Recent climate and hydrological changes in a mountain–basin system in Xinjiang, China. Earth Sci. Rev. 2022, 226, 103957. [Google Scholar] [CrossRef]
  11. Xu, H.J.; Zhao, C.Y.; Wang, X.P.; Chen, S.Y.; Shan, S.Y.; Chen, T.; Qi, X.L. Spatial differentiation of determinants for water conservation dynamics in a dryland mountain. J. Clean. Prod. 2022, 362, 132574. [Google Scholar] [CrossRef]
  12. Tie, Q.; Hu, H.; Tian, F.; Holbrook, N.M. Comparing different methods for determining forest evapotranspiration and its components at multiple temporal scales. Sci. Total Environ. 2018, 633, 12–29. [Google Scholar] [CrossRef] [PubMed]
  13. Wang, H.; Lv, X.; Zhang, M. Sensitivity and attribution analysis of vegetation changes on evapotranspiration with the Budyko framework in the Baiyangdian catchment, China. Ecol. Indic. 2021, 120, 106963. [Google Scholar] [CrossRef]
  14. Li, S.; Wang, G.; Sun, S.; Fiifi Tawia Hagan, D.F.T.; Chen, T.; Dolman, H.; Liu, Y. Long-term changes in evapotranspiration over China and attribution to climatic drivers during 1980–2010. J. Hydrol. 2021, 595, 126037. [Google Scholar] [CrossRef]
  15. Levizzani, V.; Cattani, E. Satellite remote sensing of precipitation and the terrestrial water cycle in a changing climate. Remote Sens. 2019, 11, 2301. [Google Scholar] [CrossRef]
  16. Isaacson, B.N.; Yang, Y.; Anderson, M.C.; Clark, K.L.; Grabosky, J.C. The effects of forest composition and management on evapotranspiration in the New Jersey Pinelands. Agric. Forest Meteorol. 2023, 339, 109588. [Google Scholar] [CrossRef]
  17. Yang, Y.; Roderick, M.L.; Guo, H.; Miralles, D.G.; Zhang, L.; Fatichi, S.; Luo, X.; Zhang, Y.; McVicar, T.R.; Tu, Z.; et al. Evapotranspiration on a greening Earth. Nat. Rev. Earth Environ. 2023, 4, 626–641. [Google Scholar] [CrossRef]
  18. Ma, L.; Yu, G.; Chen, Z.; Yang, M.; Hao, T.; Zhu, X.; Zhang, W.; Lin, Q.; Liu, Z.; Han, L.; et al. Cascade effects of climate and vegetation influencing the spatial variation of evapotranspiration in China. Agric. Forest Meteorol. 2024, 344, 109826. [Google Scholar] [CrossRef]
  19. Numata, I.; Khand, K.; Kjaersgaard, J.; Cochrane, M.A.; Silva, S.S. Forest evapotranspiration dynamics over a fragmented forest landscape under drought in southwestern Amazonia. Agric. Forest Meteorol. 2021, 306, 108446. [Google Scholar] [CrossRef]
  20. Holdrege, M.; Beard, K.; Kulmatiski, A. Woody plant growth increases with precipitation intensity in a cold semiarid system. Ecology 2021, 102, e03212. [Google Scholar] [CrossRef]
  21. Ullah, S.; You, Q.; Sachindra, D.A.; Nowosad, M.; Ullah, W.; Bhatti, A.S.; Jin, Z.; Ali, A. Spatiotemporal changes in global aridity in terms of multiple aridity indices: An assessment based on the CRU data. Atmos. Res. 2022, 268, 105998. [Google Scholar] [CrossRef]
  22. Zhang, W.; Furtado, K.; Wu, P.; Zhou, T.; Chadwick, R.; Marzin, C.; Rostron, J.; Sexton, D. Increasing precipitation variability on daily-to-multiyear time scales in a warmer world. Sci. Adv. 2021, 7, eabf8021. [Google Scholar] [CrossRef]
  23. Liu, Z.; Cheng, L.; Zhou, G.; Chen, X.; Lin, K.; Zhang, W.; Chen, X.; Zhou, P. Global response of evapotranspiration ratio to climate conditions and watershed characteristics in a changing environment. J. Geophys. Res. Atmos. 2020, 125, e2020JD032371. [Google Scholar] [CrossRef]
  24. Wang, T.; Zhang, H.; Zhao, J.; Guo, X.; Xiong, T.; Wu, R. Shifting contribution of climatic constraints on evapotranspiration in the boreal forest. Earths Future 2021, 9, e2021EF002104. [Google Scholar] [CrossRef]
  25. Ning, T.; Li, Z.; Feng, Q.; Li, Z.; Qin, Y. Attribution of growing season evapotranspiration variability considering snowmelt and vegetation changes in the arid alpine basins. Hydrol. Earth Syst. Sci. 2021, 25, 3455–3469. [Google Scholar] [CrossRef]
  26. Zhang, D.; Liu, X.; Zhang, L.; Zhang, Q.; Gan, R.; Li, X. Attribution of evapotranspiration changes in humid regions of China from 1982 to 2016. JGR Atmospheres 2020, 125, e2020JD032404. [Google Scholar] [CrossRef]
  27. Zeng, S.; Du, H.; Xia, J.; Wu, J.; Yang, L. Attributions of evapotranspiration and gross primary production changes in semi-arid region: A case study in the water source area of the Xiong’an New Area in North China. Remote Sens. 2022, 14, 1187. [Google Scholar] [CrossRef]
  28. Zhang, W.; Luo, G.; Chen, C.; Ochege, F.U.; Hellwich, O.; Zheng, H.; Hamdi, R.; Wu, S. Quantifying the contribution of climate change and human activities to biophysical parameters in an arid region. Ecol. Indic. 2021, 129, 107996. [Google Scholar] [CrossRef]
  29. Yang, L.; Feng, Q.; Adamowski, J.F.; Alizadeh, M.R.; Yin, Z.; Wen, X.; Zhu, M. The role of climate change and vegetation greening on the variation of terrestrial evapotranspiration in northwest China’s Qilian Mountains. Sci. Total Environ. 2021, 759, 143532. [Google Scholar] [CrossRef]
  30. Yu, Y.; Zhou, Y.; Xiao, W.; Ruan, B.; Lu, F.; Hou, B.; Wang, Y.; Cui, H. Impacts of climate and vegetation on actual evapotranspiration in typical arid mountainous regions using a Budyko-based framework. Hydrol. Res. 2021, 52, 212–228. [Google Scholar] [CrossRef]
  31. Yin, L.; Tao, F.; Chen, Y.; Liu, F.; Hu, J. Improving terrestrial evapotranspiration estimation across China during 2000-2018 with machine learning methods. J. Hydrol. 2021, 600, 126538. [Google Scholar] [CrossRef]
  32. Dong, X.; Martin, J.B.; Cohen, M.J.; Tu, T. Bedrock mediates responses of ecosystem productivity to climate variability. Commun. Earth Environ. 2023, 4, 114. [Google Scholar] [CrossRef]
  33. Hahm, W.J.; Dralle, D.N.; Sanders, M.; Bryk, A.B.; Fauria, K.E.; Huang, M.H.; Hudson-Rasmussen, B.; Nelson, M.D.; Pedrazas, M.A.; Schmidt, L.; et al. Bedrock vadose zone storage dynamics under extreme drought: Consequences for plant water availability, recharge, and runoff. Water Resour. Res. 2022, 58, e2021WR031781. [Google Scholar] [CrossRef]
  34. Nardini, A.; Tomasella, M.; Di Bert, S. Bedrock: The hidden water reservoir for trees challenged by drought. Trees 2024, 38, 1–11. [Google Scholar] [CrossRef]
  35. Jiménez-Rodríguez, C.D.; Sulis, M.; Schymanski, S. Exploring the role of bedrock representation on plant transpiration response during dry periods at four forested sites in Europe. Biogeosciences 2022, 19, 3395–3423. [Google Scholar] [CrossRef]
  36. Ludat, A.L.; Kübler, S. Tectonic controls on the ecosystem of the Mara river basin, east Africa, from geomorphological and spectral indices analysis. Biogeosci. Discuss. 2023, 20, 1991–2012. [Google Scholar] [CrossRef]
  37. Li, H.; Liu, X.; Zhao, X.; Zhang, W.; Liu, J.; Luo, X.; Wang, R.; Xing, L. Contrasting effects of tectonic faults on vegetation growth along the elevation gradient in tectonically active mountains. Forests 2023, 14, 2336. [Google Scholar] [CrossRef]
  38. Chen, Y.; Li, Z.; Fang, G. Changes of key hydrological elements and research progress of water cycle in the Tianshan Mountains. Central Asia. Arid Land Geogr. 2022, 45, 1–8. [Google Scholar]
  39. Li, Y.; Chen, Y.; Sun, F.; Li, Z. Recent vegetation browning and its drivers on Tianshan mountain, Central Asia. Ecol. Indic. 2021, 129, 107912. [Google Scholar] [CrossRef]
  40. Liu, X.; Yuan, S.; Bai, X.; Jiang, J.; Li, Y.; Liu, J. Tectonic uplift of the Tianshan mountains since quaternary: Evidence from magnetostratigraphy of the Yili basin, northwestern China. Int. J. Earth Sci. (Geol. Rundsch.) 2023, 112, 855–865. [Google Scholar] [CrossRef]
  41. Zhang, Y.; Kong, D.; Gan, R.; Chiew, F.H.S.; McVicar, T.R.; Zhang, Q.; Yang, Y. Coupled estimation of 500 m and 8-day resolution global evapotranspiration and gross primary production in 2002–2017. Remote Sens. Environ. 2019, 222, 165–182. [Google Scholar] [CrossRef]
  42. McCormick, E.L.; Dralle, D.N.; Hahm, W.J.; Tune, A.K.; Schmidt, L.M.; Chadwick, K.D.; Rempe, D.M. Widespread woody plant use of water stored in bedrock. Nature 2021, 597, 225–229. [Google Scholar] [CrossRef] [PubMed]
  43. Peng, S.Z.; Ding, Y.X.; Liu, W.Z.; Li, Z. 1 km monthly temperature and precipitation dataset for China from 1901 to 2017. Earth Syst. Sci. Data 2019, 11, 1931–1946. [Google Scholar] [CrossRef]
  44. Yang, Y.; Chen, R.; Song, Y.; Han, C.; Liu, J.; Liu, Z. Sensitivity of potential evapotranspiration to meteorological factors and their elevational gradients in the Qilian mountains, northwestern China. J. Hydrol. 2019, 568, 147–159. [Google Scholar] [CrossRef]
  45. Liu, J.; Kuang, W.; Zhang, Z.; Xu, X.; Qin, Y.; Ning, J.; Zhou, W.; Zhang, S.; Li, R.; Yan, C.; et al. Spatiotemporal characteristics, patterns, and causes of land-use changes in China since the late 1980s. J. Geogr. Sci. 2014, 24, 195–210. [Google Scholar] [CrossRef]
  46. He, S.; Li, J.; Wang, J.; Liu, F. Evaluation and analysis of upscaling of different land use/land cover products (FORM-GLC30, GLC_FCS30, CCI_LC, MCD12Q1 and CNLUCC): A case study in China. Geocarto Int. 2024, 37, 17340–17360. [Google Scholar] [CrossRef]
  47. Yan, F.; Shangguan, W.; Zhang, J.; Hu, B. Depth-to-bedrock map of China at a spatial resolution of 100 meters. Sci. Data 2020, 7, 2. [Google Scholar] [CrossRef] [PubMed]
  48. Gleeson, T.; Moosdorf, N.; Hartmann, J.; van Beek, L.P.H. A glimpse beneath earth’s surface: GLobal hydrogeology MaPS (GLHYMPS) of permeability and porosity. Geophys. Res. Lett. 2014, 41, 3891–3898. [Google Scholar] [CrossRef]
  49. Poggio, L.; De Sousa, L.M.; Batjes, N.H.; Heuvelink, G.B.M.; Kempen, B.; Ribeiro, E.; Rossiter, D. SoilGrids 2.0: Producing soil information for the globe with quantified spatial uncertainty. Soil 2021, 7, 217–240. [Google Scholar] [CrossRef]
  50. Gao, X.; Avramov, A.; Saikawa, E.; Schlosser, C.A. Emulation of community land model version 5 (CLM5) to quantify sensitivity of soil moisture to uncertain parameters. J. Hydrol. Meteorol. 2021, 22, 259–278. [Google Scholar] [CrossRef]
  51. Liu, F.; Wu, H.; Zhao, Y.; Li, D.; Yang, J.L.; Song, X.; Shi, Z.; Zhu, A.X.; Zhang, G.L. Mapping high resolution national soil information grids of China. Sci. Bull. 2022, 67, 328–340. [Google Scholar] [CrossRef]
  52. Stocker, B.D.; Tumber-Dávila, S.J.; Konings, A.G.; Anderson, M.C.; Hain, C.; Jackson, R.B. Global patterns of water storage in the rooting zones of vegetation. Nat. Geosci. 2023, 16, 250–256. [Google Scholar] [CrossRef]
  53. Fan, Y.; Miguez-Macho, G.; Jobbágy, E.G.; Jackson, R.B.; Otero-Casal, C. Hydrologic regulation of plant rooting depth. Proc. Natl. Acad. Sci. USA 2017, 114, 10572–10577. [Google Scholar] [CrossRef]
  54. Kannenberg, S.A.; Anderegg, W.R.L.; Barnes, M.L.; Dannenberg, M.P.; Knapp, A.K. Dominant role of soil moisture in mediating carbon and water fluxes in dryland ecosystems. Nat. Geosci. 2024, 17, 38–43. [Google Scholar] [CrossRef]
  55. Cao, S.; Zhang, L.; He, Y.; Zhang, Y.; Chen, Y.; Yao, S.; Yang, W.; Sun, Q. Effects and contributions of meteorological drought on agricultural drought under different climatic zones and vegetation types in Northwest China. Sci. Total Environ. 2022, 821, 153270. [Google Scholar] [CrossRef]
  56. Hu, Y.; Wei, F.; Fu, B.; Zhang, W.; Sun, C. Ecosystems in China have become more sensitive to changes in water demand since 2001. Commun. Earth Environ. 2023, 4, 444. [Google Scholar] [CrossRef]
  57. Yan, Y.; Piao, S.; Hammond, W.M.; Chen, A.; Hong, S.; Xu, H.; Munson, S.M.; Myneni, R.B.; Allen, C.D. Climate-induced tree-mortality pulses are obscured by broad-scale and long-term greening. Nat. Ecol. Evol. 2024, 1–12. [Google Scholar] [CrossRef]
  58. Zhang, X.; Wang, G.; Xue, B.; A, Y. Changes in vegetation cover and its influencing factors in the inner Mongolia reach of the yellow river basin from 2001 to 2018. Environ. Res. 2022, 215, 114253. [Google Scholar] [CrossRef]
  59. Pepin, N.C.; Arnone, E.; Gobiet, A.; Haslinger, K.; Kotlarski, S.; Notarnicola, C.; Palazzi, E.; Seibert, P.; Serafin, S.; Schöner, W.; et al. Climate changes and their elevational patterns in the mountains of the world. Rev. Geophys. 2022, 60, e2020RG000730. [Google Scholar] [CrossRef]
  60. Liu, W.; Yang, L.; Zhu, M.; Adamowski, J.F.; Barzegar, R.; Wen, X.; Yin, Z. Effect of elevation on variation in reference evapotranspiration under climate change in Northwest China. Sustainability 2021, 13, 10151. [Google Scholar] [CrossRef]
  61. Zhang, Q.; Yang, J.; Wang, W.; Ma, P.; Lu, G.; Liu, X.; Yu, H.; Fang, F. Climatic warming and humidification in the arid region of northwest China: Multi-scale characteristics and impacts on ecological vegetation. J. Meteorol. Res. 2021, 35, 113–127. [Google Scholar] [CrossRef]
  62. Yao, J.Q.; Mao, W.Y.; Chen, J.; Dilinuer, T. Signal and impact of wet-to-dry shift over Xinjiang, China. Acta Geogr. Sin. 2021, 76, 57–72. [Google Scholar]
  63. Chen, F.; Xie, T.; Yang, Y.; Chen, S.; Chen, F.; Huang, W.; Chen, J. Discussion of the “warming and wetting” trend and its future variation in the drylands of northwest China under global warming. Sci. China Earth Sci. 2023, 66, 1241–1257. [Google Scholar] [CrossRef]
  64. Chen, J.; Zhang, J.; Peng, J.; Zou, L.; Fan, Y.; Yang, F.; Hu, Z. Alp-valley and elevation effects on the reference evapotranspiration and the dominant climate controls in Red River Basin, China: Insights from geographical differentiation. J. Hydrol. 2023, 620, 129397. [Google Scholar] [CrossRef]
  65. Yang, L.; Feng, Q.; Zhu, M.; Wang, L.; Alizadeh, M.R.; Adamowski, J.F.; Wen, X.; Yin, Z. Variation in actual evapotranspiration and its ties to climate change and vegetation dynamics in northwest China. J. Hydrol. 2022, 607, 127533. [Google Scholar] [CrossRef]
  66. Li, B.; Chen, Y.; Shi, X. Does elevation dependent warming exist in high mountain Asia? Environ. Res. Lett. 2020, 15, 024012. [Google Scholar] [CrossRef]
  67. Zhang, X.; Wang, L.; Chen, D. How does temporal trend of reference evapotranspiration over the Tibetan plateau change with elevation? Int. J. Climatol. 2019, 39, 2295–2305. [Google Scholar] [CrossRef]
  68. Chang, Y.; Ding, Y.; Zhao, Q.; Qin, J.; Zhang, S. Elevation-dependent changes in the trend of reference evapotranspiration in the Tibetan Plateau during 1960–2017. Int. J. Climatol. 2023, 43, 2077–2095. [Google Scholar] [CrossRef]
  69. Geng, H.; Pan, B.; Huang, B.; Cao, B.; Gao, H. The spatial distribution of precipitation and topography in the Qilian Shan mountains, northeastern Tibetan plateau. Geomorphology 2017, 297, 43–54. [Google Scholar] [CrossRef]
  70. Zhao, N.; Wu, X. Improving daily precipitation estimations in a high mountainous watershed by developing a new downscaling method with spatially varying coefficients. J. Hydrol. 2023, 626, 130367. [Google Scholar] [CrossRef]
  71. Zheng, H.; Miao, C.; Li, X.; Kong, D.; Gou, J.; Wu, J.; Zhang, S. Effects of vegetation changes and multiple environmental factors on evapotranspiration across China over the past 34 years. Earths Future 2022, 10, e2021EF002564. [Google Scholar] [CrossRef]
  72. Qiu, L.; Wu, Y.; Shi, Z.; Chen, Y.; Zhao, F. Quantifying the responses of evapotranspiration and its components to vegetation restoration and climate change on the Loess Plateau of China. Remote Sens. 2021, 13, 2358. [Google Scholar] [CrossRef]
  73. Tai, X.; Epstein, H.E.; Li, B. Elevation and climate effects on vegetation greenness in an arid mountain-basin system of central Asia. Remote Sens. 2020, 12, 1665. [Google Scholar] [CrossRef]
  74. Zhou, P.; Huang, J.G.; Liang, H.; Rossi, S.; Bergeron, Y.; Shishov, V.V.; Jiang, S.; Kang, J.; Zhu, H.; Dong, Z. Radial growth of Larix sibirica was more sensitive to climate at low than high altitudes in the Altai mountains, China. Agric. Forest Meteorol. 2021, 304–305, 108392. [Google Scholar] [CrossRef]
  75. Shi, S.; Liu, G.; Li, Z.; Ye, X. Elevation-dependent growth trends of forests as affected by climate warming in the southeastern Tibetan plateau. Forest Ecol. Manag. 2021, 498, 119551. [Google Scholar] [CrossRef]
  76. Xu, S.; Yu, Z.; Lettenmaier, D.P.; McVicar, T.R.; Ji, X. Elevation-dependent response of vegetation dynamics to climate change in a cold mountainous region. Environ. Res. Lett. 2020, 15, 094005. [Google Scholar] [CrossRef]
  77. Guo, S.; Tian, L.; Chen, S.; Liang, J.; Tian, J.; Cao, B.; Wang, X.; He, C. Analysis of effects of vegetation cover and elevation on water yield in an alpine basin of the Qilian mountains in northwest China by integrating the WRF-hydro and Budyko framework. J. Hydrol. 2024, 629, 130580. [Google Scholar] [CrossRef]
  78. Ficklin, D.L.; Null, S.E.; Abatzoglou, J.T.; Novick, K.A.; Myers, D.T. Hydrological intensification will increase the complexity of water resource management. Earths Future 2022, 10, e2021EF002487. [Google Scholar] [CrossRef]
  79. Zhang, Y.; Gentine, P.; Luo, X.; Lian, X.; Liu, Y.; Zhou, S.; Michalak, A.M.; Sun, W.; Fisher, J.B.; Piao, S.; et al. Increasing sensitivity of dryland vegetation greenness to precipitation due to rising atmospheric CO2. Nat. Commun. 2022, 13, 4875. [Google Scholar] [CrossRef]
  80. Yin, D.; Gou, X.; Yang, H.; Wang, K.; Liu, J.; Zhang, Y.; Gao, L. Elevation-dependent tree growth response to recent warming and drought on eastern Tibetan Plateau. Clim. Chang. 2023, 176, 77. [Google Scholar] [CrossRef]
  81. Denissen, J.M.C.; Teuling, A.J.; Pitman, A.J.; Koirala, S.; Migliavacca, M.; Li, W.; Reichstein, M.; Winkler, A.J.; Zhan, C.; Orth, R. Widespread shift from ecosystem energy to water limitation with climate change. Nat. Clim. Chang. 2022, 12, 677–684. [Google Scholar] [CrossRef]
  82. Zhang, Y.; Liu, L.; Cheng, Y.; Kang, S.; Li, H.; Wang, L.; Shi, Y.; Liu, X.; Cheng, L. Intensified structural overshoot aggravates drought impacts on dryland ecosystems. Earths Future 2024, 12, e2023EF003977. [Google Scholar] [CrossRef]
  83. Fang, W.; Cai, Q.; Zhao, Q.; Ji, C.; Zhu, J.; Tang, Z.; Fang, J.Y. Species richness patterns and the determinants of larch forests in China. Plant Divers. 2022, 44, 436–444. [Google Scholar] [CrossRef]
  84. Li, J.; Pandey, B.; Dakhil, M.; Khanal, M.; Pan, K. Precipitation and potential evapotranspiration determine the distribution patterns of threatened plant species in Sichuan Province, China. Sci. Rep. 2022, 12, 22418. [Google Scholar] [CrossRef]
  85. Fisher, J.; Whittaker, R.; Malhi, Y. ET come home: Potential evapotranspiration in geographical ecology. Global Ecol. Biogeogr. 2011, 20, 1–18. [Google Scholar] [CrossRef]
  86. Zhang, X.; Chen, Y.; Zhang, Q.; Xia, Z.; Hao, H.; Xia, Q. Potential evapotranspiration determines changes in the carbon sequestration capacity of forest and grass ecosystems in Xinjiang, Northwest China. Global Ecol. Biogeogr. 2023, 48, e02737. [Google Scholar] [CrossRef]
  87. Zhou, H.; Chen, Y.; Zhu, C.; Chen, Y.; Yang, Y.; Li, W.; Chen, S. Warming increases the carbon sequestration capacity of Picea schrenkiana in the Tianshan Mountains, China. Forests 2021, 12, 1066. [Google Scholar] [CrossRef]
  88. Zhang, Y.; Liu, X.; Jiao, W.; Wu, X.; Zeng, X.; Zhao, L.; Wang, L.; Guo, J.; Xing, X.; Hong, Y. Spatial heterogeneity of vegetation resilience changes to different drought types. Earths Future 2023, 11, e2022EF003108. [Google Scholar] [CrossRef]
  89. Fan, Y.; Clark, M.; Lawrence, D.M.; Swenson, S.; Band, L.E.; Brantley, S.L.; Brooks, P.D.; Dietrich, W.E.; Flores, A.; Grant, G.; et al. Hillslope hydrology in global change research and earth system modeling. Water Resour. Res. 2019, 55, 1737–1772. [Google Scholar] [CrossRef]
  90. Hahm, W.J.; Rempe, D.M.; Dralle, D.N.; Dawson, T.E.; Dietrich, W.E. Oak transpiration drawn from the weathered bedrock vadose zone in the summer dry season. Water Resour. Res. 2020, 56, e2020WR027419. [Google Scholar] [CrossRef]
  91. Rempe, D.M.; Dietrich, W.E. Direct observations of rock moisture, a hidden component of the hydrologic cycle. Proc. Natl. Acad. Sci. USA 2018, 115, 2664–2669. [Google Scholar] [CrossRef]
  92. Pfister, L.; Martínez-Carreras, N.; Hissler, C.; Klaus, J.; Carrer, G.E.; Stewart, M.K.; McDonnell, J.J. Bedrock geology controls on catchment storage, mixing, and release: A comparative analysis of 16 nested catchments. Hydrol. Processes 2017, 31, 1828–1845. [Google Scholar] [CrossRef]
  93. Hahm, W.J.; Rempe, D.M.; Dralle, D.N.; Dawson, T.E.; Lovill, S.M.; Bryk, A.B.; Bish, D.L.; Schieber, J.; Dietrich, W.E. Lithologically controlled subsurface critical zone thickness and water storage capacity determine regional plant community composition. Water Resour. Res. 2019, 55, 3028–3055. [Google Scholar] [CrossRef]
  94. Veblen, T.T.; González, M.E.; Stewart, G.H.; Kitzberger, T.; Brunet, J. Tectonic ecology of the temperate forests of south America and New Zealand. N. Z. J. Bot. 2016, 54, 223–246. [Google Scholar] [CrossRef]
  95. Zhou, Y.; Li, Y.; Li, W.; Li, F.; Xin, Q. Ecological responses to climate change and human activities in the arid and semi-arid regions of Xinjiang in China. Remote Sens. 2022, 14, 3911. [Google Scholar]
Figure 1. (a) Location and spatial pattern of elevation of the Chinese Western Tianshan Mountains (CWTM), the mid-altitude zone (1000–3500 m asl.) was selected as the study area; spatial pattern of (b) land use/land cover in CWTM and (c) normalized difference vegetation index (NDVI) of mid-altitude forest in CWTM; (d) elevational distribution (in 200 m band) of forest mean NDVI (during the period of 2000–2020, with error bars indicating the standard deviation) and forest area.
Water 16 01252 g001
Figure 2. Schematic flow chart of this study. The brown numbers in the parentheses indicate the numbers of variables in each category.
Water 16 01252 g002
Figure 3. Temporal changes in evapotranspiration (ET), precipitation (P), and potential evapotranspiration (PET) in the mid-altitude zone of CWTM from 2000 to 2020. These abbreviations are the same in the following figures. The annotations indicate the slope and p-value in linear regressions.
Water 16 01252 g003
Figure 4. Altitudinal variation of multi-year (a) mean value and (b) trend (Kendall’s τ) of forest ET, P, and PET (shown in boxplot).
Water 16 01252 g004
Figure 5. Spatial patterns and frequency distribution of multi-year (2000–2020) mean ET sensitivity (a) to P and (b) to PET.
Water 16 01252 g005
Figure 6. Variation of multi-year mean ET sensitivity to P and PET with (a) elevation and (b) NDVI (error bars indicate the standard deviation).
Water 16 01252 g006
Figure 7. Spatial patterns and frequency distribution of the multi-year trend (Kendall’s τ) of ET sensitivity (a) to P and (b) to PET.
Water 16 01252 g007
Figure 8. Variation of multi-year trend (Kendall’s τ) of ET sensitivity to P and PET with (a) elevation and (b) NDVI (error bars indicate the standard deviation).
Water 16 01252 g008
Figure 9. Area and average elevation along different ET sensitivity to P and PET: (a) multi-year mean value and (b) trend. The numbers in each quadrant represent the area percentage in each quadrant of the total region.
Water 16 01252 g009
Figure 10. Relative importance of multiple factors controlling multi-year mean value and trend of ESP and EPSE calculated by eXtreme Gradient Boosting (XGBoost) model. Abbreviations of the influencing factors are provided in the Methods. Trend of ESP (or ESPE) refers to the Kendall’s τ. Abbreviations of environmental factors please see Figure 1. Note, ELE, SLP, and ASP are three topographic variables; DTF, DTB, RPO, and RPE are geological; VFCF, Sand, SOC, and SD are soil variables; and NDVI, RZWSC, and RD are vegetation variables.
Water 16 01252 g010
Figure 11. Relative importance of four groups of environmental variables: Topography (TOP), geology (GEO), soil (SOL), and vegetation (VEG). Error bars represent the standard deviation calculated from five elevation bands.
Water 16 01252 g011
Table 1. Description and sources of the environmental data.
AttributeVariableAbbreviationTemporal Range and Spatial ResolutionSource
GeologyDistance to faultsDTF500 mSpatial Database of 1:250,000 Digital Geologic Map of Xinjiang
Depth to bedrockDTB100 mDepth-to-bedrock map of China at a spatial resolution of 100 m
Regolith porosityRPO1 kmGLHYMPS
Regolith permeabilityRPE1 km
TopographyElevationElev90 mASTER Global Digital Elevation Model
SlopeSlope
AspectAspect
SoilVolumetric fraction of coarse fragments (>2 mm)VFCF250 mSoilGrids 2.0
Proportion of sand particles (>0.05 mm) in the fine earth fractionSand
Soil organic carbon content in the fine earth fractionSOC
Soil depth SDBasic soil property dataset of high-resolution China Soil Information Grids
VegetationNormalized difference vegetation index NDVI2000–2020, 500 mMOD15A2H (Terra MODIS)
Rooting zone water storage capacityRZWSC0.05° (~5 km)Global patterns of water storage in the rooting zones of vegetation
Rooting depthRD1 kmHydrologic regulation of plant rooting depth
Disclaimer/Publisher’s Note: The statements, opinions and data contained in all publications are solely those of the individual author(s) and contributor(s) and not of MDPI and/or the editor(s). MDPI and/or the editor(s) disclaim responsibility for any injury to people or property resulting from any ideas, methods, instructions or products referred to in the content.

