
Investigating the Impact of Large Lakes on Local Precipitation: Case Study of Lake Urmia, Iran
by
 , , and
Hossein Mousavi
1 ,
,
Amir Hossein Dehghanipour
2,*,
Carla S.S. Ferreira
3,4 and
and
Zahra Kalantari
5,6 1
Department of Civil and Environmental Engineering, Amirkabir University of Technology, Tehran 15875-4413, Iran
2
Water Management Group, WSP in the Netherlands, Tramsingel 2, 4814 AB Breda, The Netherlands
3
Polytechnic Institute of Coimbra, Applied Research Institute, Rua da Misericórdia, Lagar dos Cortiços—S. Martinho do Bispo, 3045-093 Coimbra, Portugal
4
Research Centre for Natural Resources, Environment and Society (CERNAS), Polytechnic Institute of Coimbra, Bencanta, 3045-601 Coimbra, Portugal
5
Department of Sustainable Development, Environmental Science and Engineering (SEED), KTH Royal Institute of Technology, 11428 Stockholm, Sweden
6
Department of Overland Communication Ways, Foundations and Cadastral Survey, Politehnica University of Timișoara, Ioan Curea 1A, 300224 Timișoara, Romania
*
Author to whom correspondence should be addressed.
Water 2024, 16(9), 1250; https://0-doi-org.brum.beds.ac.uk/10.3390/w16091250
Submission received: 19 March 2024
/
Revised: 15 April 2024
/
Accepted: 23 April 2024
/
Published: 27 April 2024
(This article belongs to the Section Hydrology)
Abstract
:Large lakes face considerable challenges due to human activities and climate change, impacting local weather conditions and ecosystem sustainability. Lake Urmia, Iran’s largest lake and the world’s second-largest saltwater lake, has undergone a substantial reduction in water levels, primarily due to drought, climate change, and excessive irrigation. This study focuses on the potential repercussions on local climate conditions, particularly investigating the impact of moisture sources, evaporation from lake surfaces, and evapotranspiration from agricultural activities, on local convection rainfall. The prevailing westerly winds in the basin suggest a hypothesis that this moisture is transported eastward within the basin, potentially leading to local precipitation as it ascends to higher altitudes near the eastern basin border. To validate this hypothesis, climate data from 1986 to 2017 from the Sarab meteorological station (east of the lake basin, influenced by local precipitation) and Saqez meteorological station (south of the basin, unaffected by local precipitation) were analyzed. The impact of lake water level reduction was assessed by categorizing data into periods of normal lake conditions (1986–1995) and water level reduction (1996–2017). Additionally, the MSWEP global precipitation product was used to examine the precipitation distribution in the entire basin over the entire period and sub-periods. The findings indicate Lake Urmia’s significant influence on convective rainfall in the eastern basin, especially during the summer. Despite decreasing lake levels from 1996 to 2017, convective rainfall in the eastern basin increased during the summer, suggesting intensified agricultural irrigation, particularly in hot seasons.
1. Introduction
The impact of climate change and drought on water resource availability, particularly on lakes, has been extensively studied [1,2,3,4,5,6,7,8]. However, lakes with a large water surface and volume (approximately 5 million km2 and 200,000 km3 [9]) can influence the local climate conditions [6,10,11]. For instance, Lake Chad in Africa, one of the largest freshwater lakes in the world, has led to an increasing convective activity in the atmosphere during the afternoon in the overall basin, driven by significant shrinkage due to frequent droughts and the expansion of irrigation in the surrounding agricultural lands [12]. In the Jordan Valley, Western Asia, the significant reduction in water level of the Dead Sea has weakened local breezes and led to a decline in relative humidity, and an increase in temperature in the southern regions [13]. These changes have intensified the speed of Mediterranean winds in the afternoon, resulting in a 15% increase in evaporation, primarily during the early spring and summer months [14,15]. Research conducted on the Aral Sea, in Asia, has revealed that the desiccation of the lake has disrupted local weather systems and atmospheric circulation patterns. The absence of a substantial water body in the Aral Sea has diminished the moderating influence it once exerted on regional climates, resulting in adverse effects on the region’s climate, including hotter summers, colder winters, and springs starting later and ending earlier than the typical timeframes. This loss of regulation has led to heightened climatic variability, with more extreme weather events such as droughts and dust storms becoming increasingly frequent [16,17]. The impact of lake desiccation on increasing regional temperature was also reported in Hamoun Lake, situated between Iran and Afghanistan [18]. This temperature rise has led to higher rates of evaporation and steeper changes in pressure and wind speed gradient [18]. Changes in temperature, as well as precipitation, were reported in the region embracing The Great Lakes, in North America, which exhibit significant fluctuations between seasons [19]. Although these studies show a clear impact of large lakes on the local/regional climate, the magnitude of the changes in water surface and volume on temperature and precipitation variations are highly variable.
Lake Urmia, the largest permanent reservoir in West Asia and the second-largest hypersaline lake in the world, is of great importance, e.g., for climate regulation, the provision of water, and supporting human and animal nourishment [20]. However, the lake’s water level decreased by approximately 35% between 2000 and 2011 [5,21]. This shrinkage resulted in a decline in local winds and relative humidity, and a decrease in the capacity of Lake Urmia to regulate the temperature of neighboring regions, leading to an increase in evapotranspiration in the surrounding areas [6]. A previous study showed that Lake Urmia has a notable influence on the local climate, especially during the warm summer months [6], but did not explore the impact on local precipitation. The current study aims to examine the influence of Lake Urmia on local precipitation, specifically investigating whether changes in the lake’s water level recorded over the last two decades correspond to shifts in precipitation patterns. We hypothesize that evaporation from the surface of Lake Urmia and evapotranspiration from vegetation, especially agricultural lands, are the main factors influencing local precipitation. Understanding how the volume of large lakes affects local precipitation is crucial for effective water resource management, especially in sectors like agriculture, which globally consumes most of the water [22]. Additionally, recognizing the role of lakes in shaping precipitation patterns is vital for preserving ecosystems reliant on these water bodies.
2. Study Area
The Lake Urmia basin (35°40′–38°30′ N, 44°07′–47°53′ E) covers approximately 3% of Iran’s land surface (Figure 1a) [23,24]. The central and lowest areas of the basin host Lake Urmia, which is Western Asia’s largest lake and the 20th largest lake globally, and the second-largest saltwater lake in the world [25]. It was designated as an international wetland in the 1970s and is one of the protected sites included in the UNESCO Biosphere Reserve (the Ramsar convention) [20,25]. The climate of the Lake Urmia basin is characterized by cold winters and mild summers, with an average annual temperature of 20 °C and an average annual precipitation of 350 mm [26]. The precipitation pattern in the basin follows a Mediterranean regime, with most of the precipitation occurring in winter and early spring. The average annual relative humidity ranges from 52% to 64% [6]. Rangeland comprises the predominant land cover type, encompassing an area of approximately 28,123 km2, equivalent to 54.69% of the total basin area (Figure 1b and Table S2). Agriculture serves as the cornerstone of the Lake Urmia basin’s economy, contributing to around 60% of its economic activities [6] and occupies 30% of the total basin area (see Table S2). Further details on various land uses in the Lake Urmia basin can be found in Table S2.
Over the past few decades, there has been a notable expansion of irrigated agriculture in the basin, marked by a growth of 68,802 ha in orchard area from 2000 to 2020 [27]. Rainfed agriculture covers approximately 6650 km2 (13% of the total area), while irrigated wheat and barley, summer crops, and orchards collectively span around 5586 km2 (11% of the total basin area). Increased irrigation has been linked to the decline in the lake’s surface area and water level, which have been recorded since 1995 [6]. This reduction can be attributed to multiple factors, including diminished precipitation, increased water diversion for agricultural use, and the construction of dams and reservoirs upstream [28,29]. These changes underscore the dynamic interaction between human activities and natural processes in shaping the ecological landscape of the Lake Urmia basin since 1996 [30].
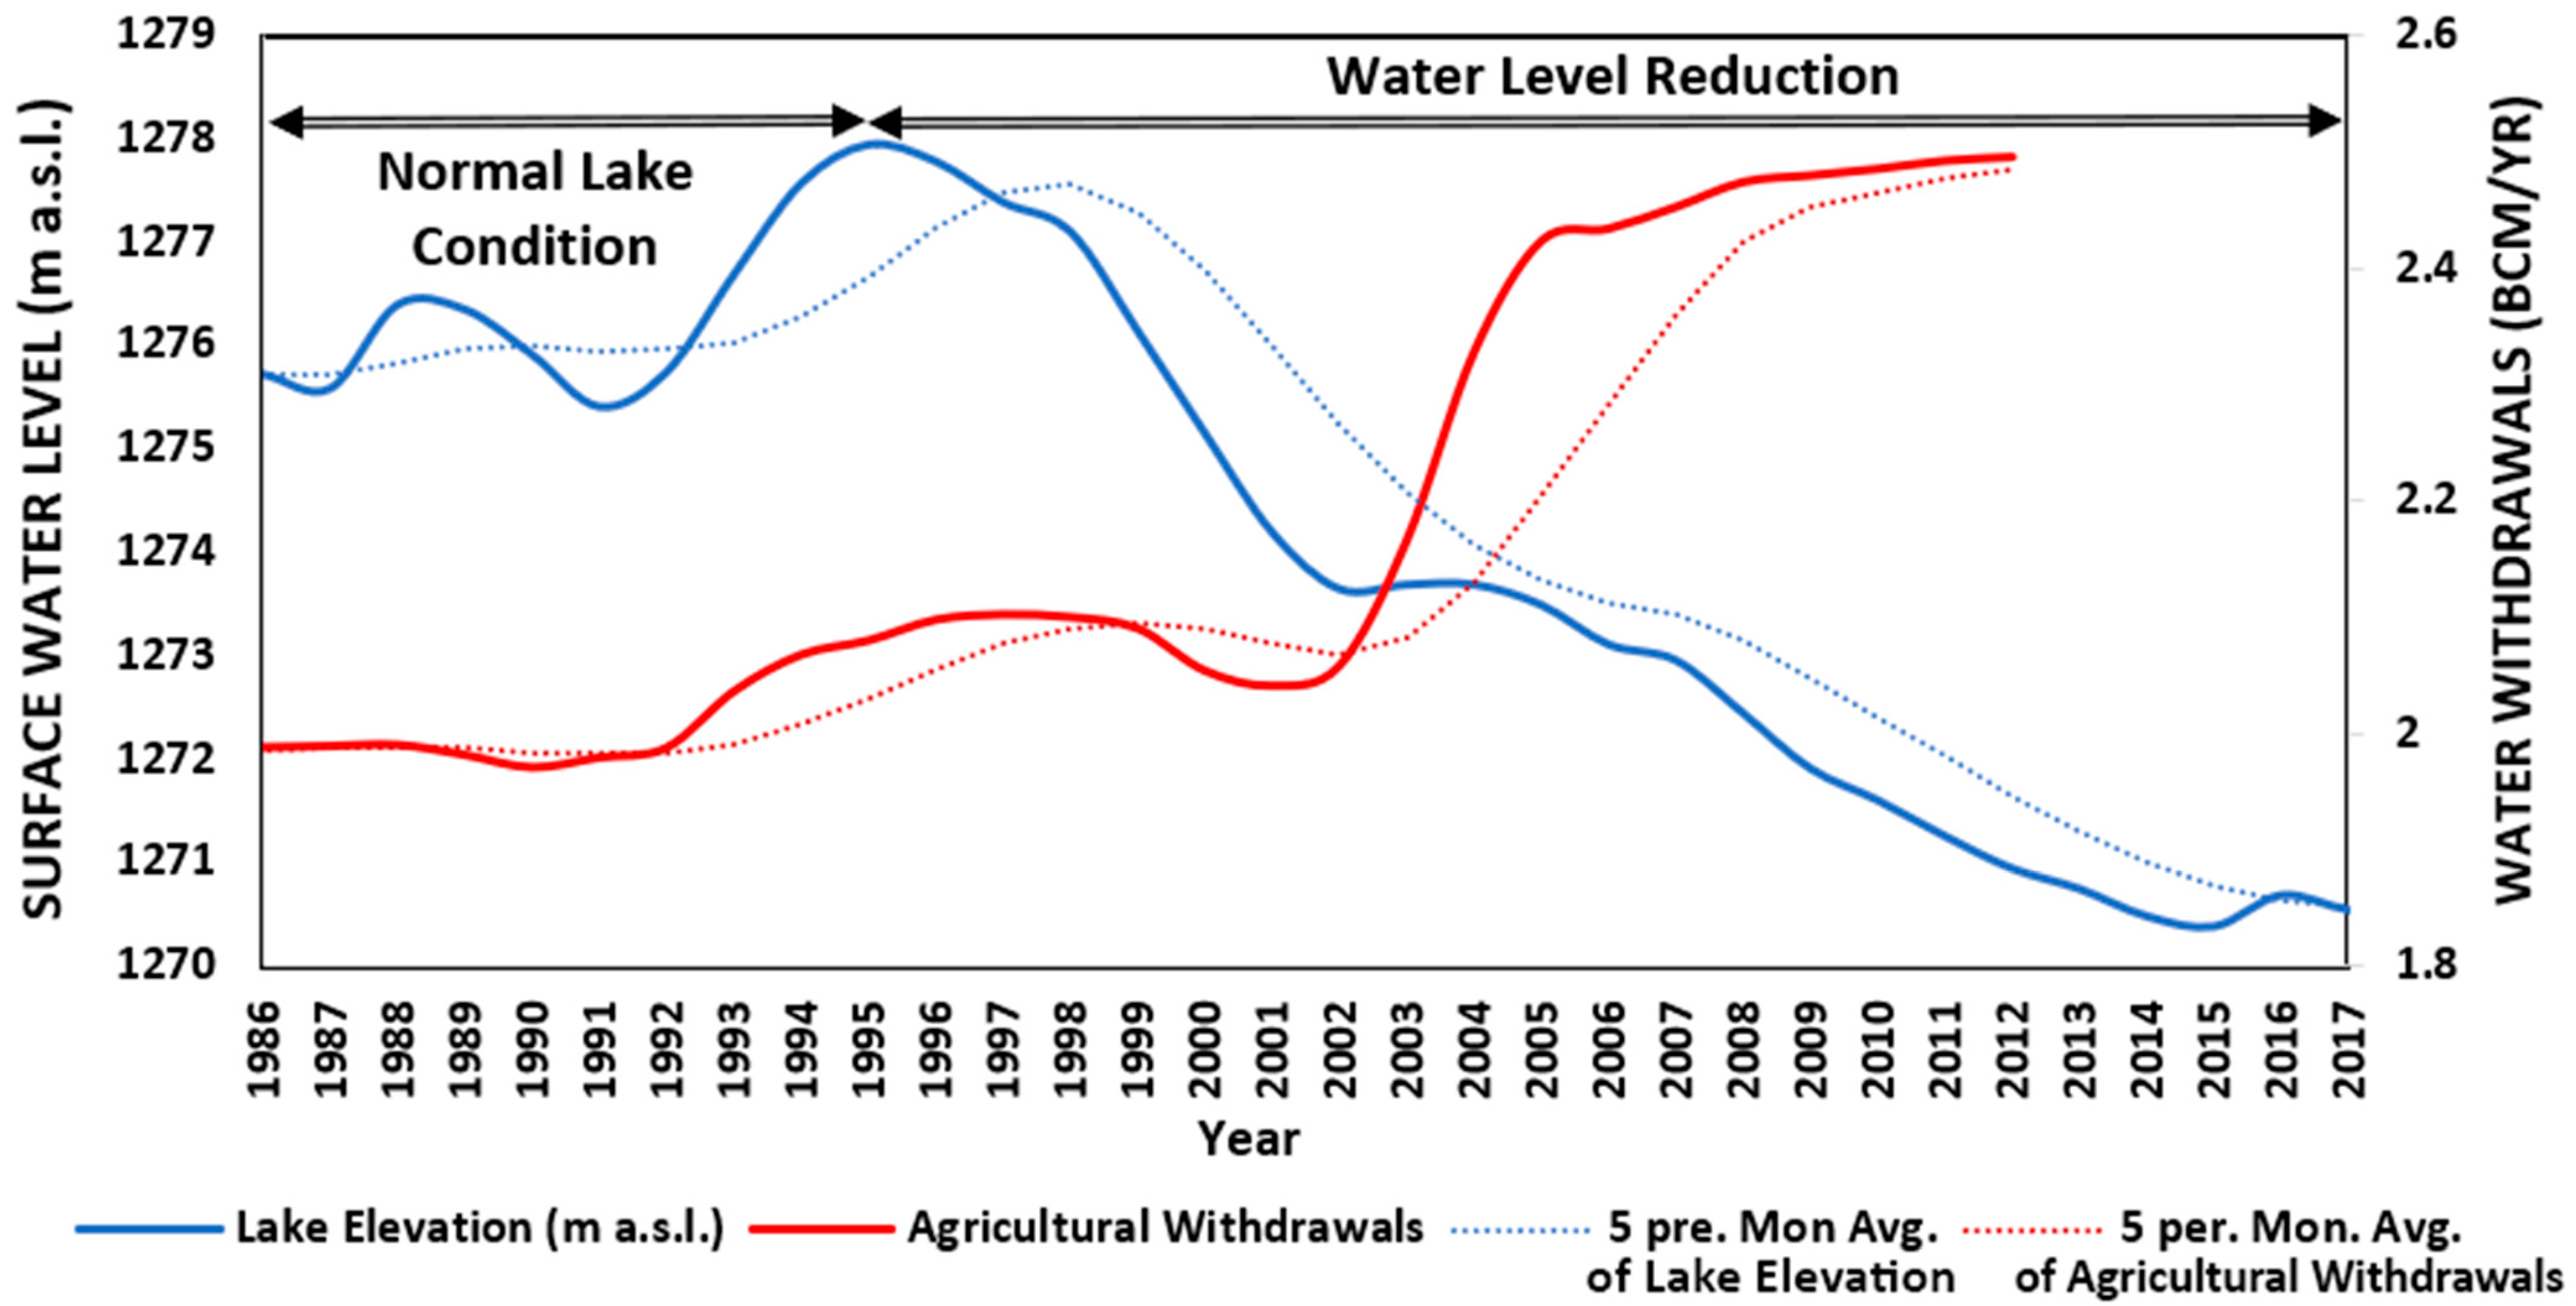
Lake Urmia is an endorheic (hydrologically landlocked) basin [31], meaning that precipitation is the primary source of water in this region. The volume of water stored in Lake Urmia, a natural reservoir located in the basin’s downslope point (Figure 1a), has suffered from a consistent decline since 1995 (Figure 2). The decreasing water level indicates the imbalance between precipitation and evaporation in the basin. Evaporation is the leading cause of water loss, occurring through two primary processes: direct evaporation from the lake’s surface and evapotranspiration within the basin, resulting, e.g., from vegetation and agricultural lands linked with irrigation activity [32,33]. Figure S1 shows the spatial variability in average annual actual evapotranspiration in the Lake Urmia basin from October 2013 to September 2015. Table S2 provides average monthly and annual actual evapotranspiration values across various land covers within the basin for the same period. Table S2 unequivocally illustrates that the average actual evapotranspiration (water consumption) from agricultural land amounted to a staggering 5110 thousand cubic meters (MCMs) between 2013 and 2015, while the combined actual evapotranspiration from water bodies, including the lake’s surface and its surrounding salt fields, accounts for approximately 3868 MCMs. This stark contrast highlights the impact of the expansion of agricultural activities and cultivated areas, compounded by the effects of climate change and successive droughts, on the reduction of Lake Urmia’s water level and volume [4,6]. This, in turn, has led to a notable increase in overall evapotranspiration from agricultural sources in recent years, surpassing the surface evaporation of Lake Urmia. Figure 2 presents the agricultural withdrawals in the Lake Urmia basin, illustrated by the red line and its accompanying 5-year moving average. The significant decrease in the lake’s water levels since 1995 aligns with a considerable increase (approximately 25%) in surface water extraction [34]. This surge is attributed to the growing demands for agricultural purposes upstream, exacerbated by the prolonged drought conditions [6,34].
3. Methodology
3.1. Background Information
3.1.1. Research Hypothesis
This study proposes a hypothesis regarding the factors influencing evaporation in the Lake Urmia basin, pinpointing two primary contributors: the evaporation from the surface of Lake Urmia and evapotranspiration from vegetation, particularly agricultural lands that encompass 30% of the basin area (Table S2). These factors hold the potential to trigger local precipitation, specifically convectional rainfall. During the summer months, when temperatures escalate, both evaporation from the lake’s surface and actual evapotranspiration from vegetation reach their peak levels. For instance, the analysis presented in Table S2 indicates that the actual evapotranspiration from agricultural land in June, July, and August totals 2300 MCMs, constituting roughly 45% of the overall annual evapotranspiration from agricultural land. Furthermore, evaporation from the lake’s surface and evapotranspiration from its surrounding areas during these months amount to 1184 MCMs, accounting for approximately 31% of the combined evaporation from the lake’s surface and its surroundings. Consequently, this heightened evapotranspiration can lead to increased local precipitation during the warm season within the Lake Urmia basin. Additionally, the prevailing west-to-east wind direction in the basin facilitates the transport of water vapor towards the eastern region of the Lake Urmia basin [35]. As this vapor ascends in the elevated mountainous areas near the basin’s eastern boundary, convectional rainfall becomes likely. A schematic representation of this hypothesis is provided in Figure 3.
3.1.2. Representative Parameters of Atmospheric Humidity and Precipitation
Humidity is a critical meteorological parameter that describes the amount of water vapor present in the atmosphere [36]. The maximum amount of moisture that air can hold at a given temperature is referred to as its moisture-holding capacity [37]. When the air is holding the maximum amount of water vapor at a specific temperature, it is said to be at its saturation point. Typically, when discussing humidity, the term relative humidity (RH) is used. The relative humidity is expressed as a percentage of the ratio of the actual amount of water vapor in the air (point A in Figure 4) to the maximum amount of water vapor that the air could hold at the same temperature (point S in Figure 4), and can be expressed as follows [6]:
where is the vapor pressure at point and is the saturation vapor pressure at a given temperature. Relative humidity is a function of temperature, as the saturation vapor pressure decreases with the decreasing temperature. This leads to an increase in relative humidity when the temperature decreases at a constant absolute humidity, and a decrease in relative humidity when the temperature increases. At a given pressure, when the air temperature drops to a specific point where the air is completely saturated with water vapor, the temperature is known as the dewpoint temperature (point DEW in Figure 4) [6]. Precipitation is the condensed moisture that falls to the Earth’s surface, and it can take various forms, such as rain, snow, or sleet. In warm and arid regions, a significant portion of rainfall occurs due to localized conditions and cannot be detected on global weather maps [38,39]. In such areas, the humid air masses, resulting from the evaporation of water bodies such as seas or lakes, gradually warm up and ascend until they reach the dewpoint and produce precipitation. This type of precipitation is known as convective rainfall, and it typically results in brief, sporadic showers during the spring and summer months [40,41].
3.2. Input Data
Local precipitation was investigated by analyzing meteorological data collected from two synoptic stations (Figure 1a): the Saqez station, located in the southern region of the Lake Urmia basin, which is influenced by the global climate, and the Sarab station, in the eastern region of the Lake Urmia basin, which is influenced by the local climate (Table S1 provides additional information about the stations). To explore the possibility of local precipitation influencing the water level in Lake Urmia, the study compared meteorological parameters, including precipitation, vapor pressure, relative humidity, and dewpoint temperature, between the two stations in two periods: normal lake conditions (1986–1995) and a sharp start on lake water level reduction (1996–2017) (Figure 2). The data from these stations were obtained from the Iran Meteorological Organization (IRIMO) (https://data.irimo.ir/ (accessed on 1 October 2023)). The results of the spatial distribution of precipitation in the basin were verified using a long-term satellite-based precipitation product from Multi-Source Weighted-Ensemble Precipitation (MSWEP) V2.8 [42,43,44]. MSWEP is a newly published worldwide precipitation dataset covering the period from 1979 to the present, featuring a spatial resolution of 0.1° and a temporal resolution of 3 h. With a resolution of 0.1°, MSWEP data are in pixel form; this translates to approximately 11.1 km on the ground. The dataset offers precipitation data at different time scales, including hourly, daily, monthly, and annual intervals [45]. The MSWEP product is unique because it merges gauge, satellite, and reanalysis data to obtain the highest quality precipitation estimates at every location. This dataset was retrieved for the entire study period (1986–2017). In addition to utilizing remote sensing data, this research incorporated official data on water levels in Lake Urmia as measured by the Urmia Lake Research Programme (https://abopa.ir/en/ulrp5/ (accessed on 1 October 2023)) (Figure 2).
3.3. Data Analysis
The time resolution for precipitation data is every six hours, while the relative humidity, vapor pressure, and dewpoint temperature data are recorded every three hours. However, when analyzing this data, the precipitation is calculated as a total for each day, whereas the remaining parameters are averaged daily. Daily data from 1986 to 2017 were analyzed using statistical indices such as mean, total, and deviation from the 1:1 line for all seasons and for the entire study period to examine the impact of Lake Urmia on local precipitation (convectional rainfall) in the basin. The correlation coefficient was employed to assess the relationship between climatic parameters and lake level. To determine the meaningfulness of the correlation findings, the p-value was also considered. The inclusion of p-values helps ascertain the statistical significance of observed correlations, providing a more comprehensive understanding of the relationships between climatic factors and lake level fluctuation. For each pair of environmental parameters, the Pearson correlation coefficient (r) was calculated [46]. The Pearson correlation coefficient is defined as follows:
where, Xi and Yi are individual data points for variables X and Y, respectively and, and are the means of variables X and Y, respectively. Additionally, a hypothesis test was conducted to assess the statistical significance of each correlation [47]. The statistic t test is given by the following:
where N is the number of observations. The degrees of freedom for the t-distribution are df = N − 2. The null hypothesis H0 posits that there is no significant correlation (r = 0), while the alternative hypothesis Ha suggests a significant correlation. The p-value is then determined from the t-distribution. The study period was divided into two periods (1986–1995 and 1996–2017) to investigate how changes in the Lake Urmia water level influence precipitation variations in the basin. The year 1995 was selected as the dividing point, as it corresponds to the highest level recorded. Selecting 1995 as the pivotal year for changes, statistical tests, including t-statistics, were employed to assess whether the identified breaking point exhibited a significant trend. This approach allowed us to rigorously examine the presence of a meaningful shift in the data and their implications on trends. For each environmental parameter, a two-sample independent t-test [48] was employed to assess the existence of a statistically significant difference in the parameter values between the two periods. The t-test formula is given by the following:
where, and are the sample means for each period, S1 and S2 are the sample standard deviations for each period, and N1 and N2 are the sample sizes for each period. The null hypothesis H0 posits that there is no significant difference in the means of the two periods ( = ), while the alternative hypothesis Ha suggests a significant difference. The degrees of freedom (df) for the t-distribution are determined by the following:
The p-value is then obtained from the t-distribution, representing the probability of observing a t-statistic as extreme as the computed value under the assumption that H0 is true [49]. Interpreting the results involves setting the significance level (α), which is set at 0.05 in our study. If the p-value is less than (α), the null hypothesis is rejected, indicating a statistically significant difference in the parameter values between the two periods. The mean difference (diff) and standard deviation difference (Sdiff) are calculated as follows:
A violin plot [50] was used to present the obtained results, as it serves as a valuable tool for visualizing data distributions, assessing their density, and facilitating the comparison of statistical information concisely, including intervals and quartiles. The violin plot combines the attributes of a box plot with those of a density plot, effectively illustrating the shape of the data distribution. To enhance the understanding of the violin plot, Figure S2 dissects its key components [51]. In this study, violin plots are used to portray meteorological parameters recorded at the Saqez and Sarab stations. These violin plots depict the distribution of relative humidity, vapor pressure, dewpoint temperature, number of rainy days, and precipitation across all seasons for the entire study period (1986–2017) and its sub-periods (1986–1995, 1996–2017).
4. Results
4.1. Spatial Differences in Meteorological Parameters across the Basin
Figure 5 presents a violin plot depicting the distribution of meteorological parameters recorded at the Saqez and Sarab stations across all seasons during the study period (1986–2017). Meanwhile, Figure 6 displays a scatter plot featuring a 1:1 line for the meteorological parameters of these stations. The notable deviation of most data points from the one-to-one line underscores substantial differences in meteorological parameters between the two stations. In conjunction with these graphical representations, Table S3 compiles statistical values that summarize seasonal meteorological parameters for both stations. Additionally, Table S4 provides the results of statistical tests, including p-values and t-tests, highlighting the significant differences in seasonal meteorological parameters between the Saqez and Sarab stations. During the period 1986–2017, the Sarab station consistently exhibited significantly higher seasonal average relative humidity values compared to the Saqez station in the spring, summer, and autumn seasons, as detailed in Table S4. The most notable difference, reaching 18.8 mm, was observed in the summer season, as outlined in Table S3. Interestingly, no significant difference in humidity between the two stations was noted during the winter season. Figure 5a visually emphasizes the marked distinction in relative humidity percentages at the Sarab station during the spring, summer, and autumn compared to the Saqez station over the 1986–2017 period. Additionally, the scatter plot with a 1:1 line in Figure 6a underscores that the Sarab station consistently maintains a significantly higher relative humidity percentage, particularly in the summer season. The Sarab and Saqez stations exhibit similar vapor pressure results during spring and autumn, but notable differences emerge during the summer and winter, as illustrated in Figure 5b and detailed in Table S4. Specifically, during the summer, the average vapor pressure at the Sarab station surpasses that of the Saqez station by approximately 2 mBar, while in winter, the Sarab station records an average vapor pressure 0.73 mBar lower than that of the Saqez station, as highlighted in Table S3. The disparity in vapor pressure between the two stations, particularly in the summer, is visually confirmed in Figure 6b, where the deviation of points from the 1:1 line denotes a significant difference. In the summer, the dewpoint temperature at the Sarab station consistently exceeds that of the Saqez station, as evident in both Figure 5c and Table S4, with further confirmation provided by the noticeable deviation of summer points from the 1:1 line in Figure 6c. Table S3 provides quantitative insights, indicating that during this season, the Sarab station records a mean dewpoint temperature 3.29 °C higher on average and 3.72 °C higher in terms of the median compared to the Saqez station. Conversely, during autumn, the dewpoint temperatures at the Sarab and Saqez stations are comparable, while in spring and winter, the Sarab station exhibits a significantly lower dewpoint temperature than the Saqez station, as outlined in Table S4. Relative humidity, dewpoint temperature, and vapor pressure are integral factors influencing precipitation. The elevated levels of relative humidity, vapor pressure, and dewpoint temperature observed during the summer at the Sarab station contribute to an increased likelihood of convection rainfall in the region. Figure 5d,e present cumulative precipitation (mm) and the number of rainy days for both the Saqez and Sarab synoptic stations during the period 1986–2017. Notably, as depicted in Figure 5d and detailed in Table S4, the Sarab station records significantly lower cumulative precipitation during autumn and winter compared to the Saqez station. Conversely, no significant difference is observed in precipitation amounts during spring, while in the summer, the Sarab station undergoes a notably higher mean and median total precipitation, measuring 28.71 mm and 25.35 mm, respectively, compared to the Saqez station, where the corresponding values are 9.41 mm and 7.15 mm. Figure 6d visually reinforces this difference in cumulative summer precipitation, with points deviating significantly from the 1:1 line. Furthermore, both Figure 5e and Figure 6e indicate a higher annual number of rainy days in the spring and summer at the Sarab station compared to the Saqez synoptic station. The findings from this section highlight a consistent pattern of significantly higher relative humidity, dew point temperature, vapor pressure, number of rainy days, and cumulative precipitation at the Sarab station compared to the Saqez station during the summer season for the period 1986–2017, supporting the hypothesis presented in Section 3.1. As discussed in Section 3.1, these observations may be attributed to the combined effects of evaporation from the lake, as well as evapotranspiration from agricultural lands, particularly influenced by the prevailing western wind direction; these factors contribute to the formation of convection rainfall in the eastern part of the Lake Urmia basin during the summer season. A correlation analysis has been employed to investigate the relationship between the Lake Urmia water level and various climatic parameters, including precipitation, air humidity, dew point temperature, and vapor pressure. The results presented in Table S5 reveal that during the summer season, the Sarab station exhibits a higher correlation between the lake level and climatic parameters, such as dew point temperature, precipitation, relative humidity, vapor pressure, and the number of rainy days, compared to the Saqez station. This suggests that, overall, the impact of the lake on climatic parameters in the summer is more pronounced at the Sarab station than at the Saqez station. Interestingly, the correlation between summer rainfall at the Saqez station and the lake level is determined to be −0.1, indicating no direct relationship between summer rainfall at the Saqez station and the lake level. In contrast, the correlation between summer rainfall at the Sarab station and the lake level is determined to be 0.14, signifying a direct relationship between summer rainfall at this station and the lake level. Moreover, a direct and significant relationship is observed between the lake level and dew point temperature, relative humidity, and air vapor pressure during the summer season at the Sarab station (Table S5).
4.2. Effect of Decreasing Lake Water Level on Fluctuations in Precipitation in the Basin
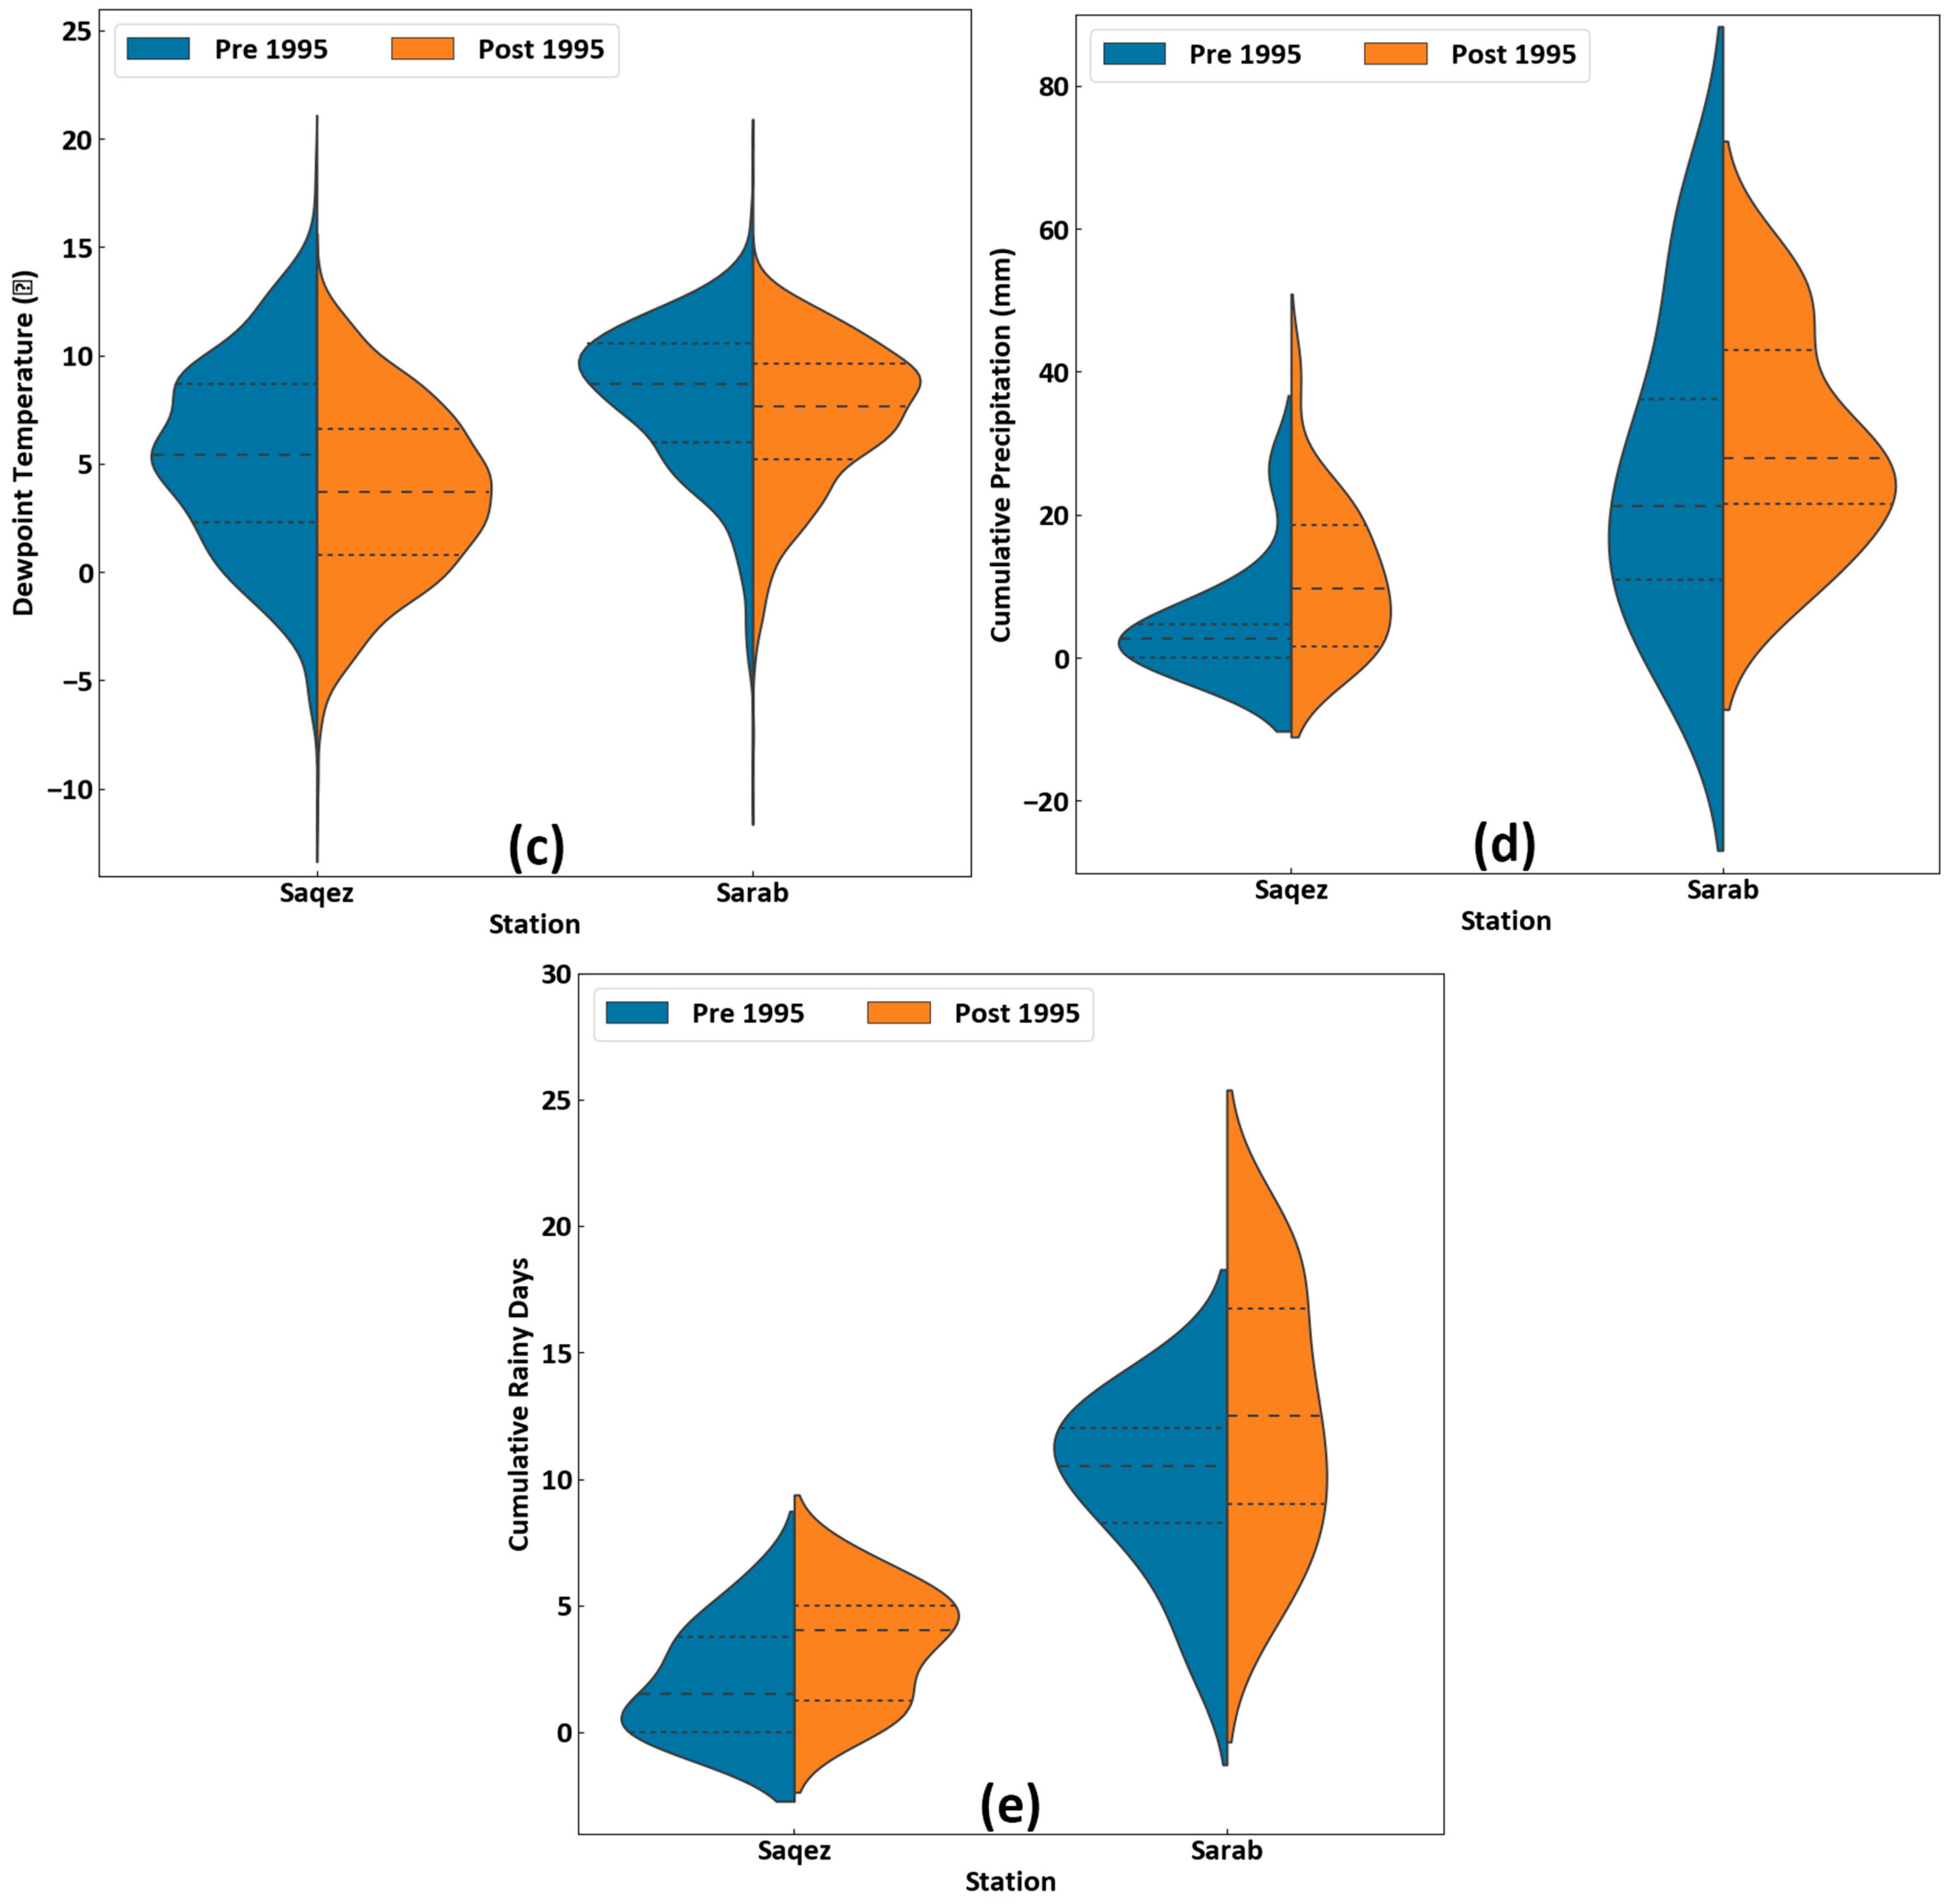
In order to comprehensively gauge the influence of declining water levels in the lake on changes in convectional rainfall, the study period was bifurcated into pre- and post-1995 intervals. This section focuses exclusively on meteorological parameters during the summer season, wherein notable differences were observed between the two stations for the period 1986–2017 (see Section 4.1). Relative humidity, vapor pressure, and dewpoint temperature at the Sarab station during the summer, both before and after 1995, significantly surpassed those at the Saqez station, owing to the impact of local climate dynamics (Figure 7a–c, and Table S4). However, these meteorological parameters underwent a marginal decline in both stations after 1995. The mean relative humidity decreased by 1.53% at the Sarab station and 4.04% at the Saqez station in the summer from 1986–1995 to 1996–2017 (Table S3). The mean changes in vapor pressure and dewpoint temperature between both periods were 0.56 mBar and −0.88 °C at the Sarab station and −1.17 mBar and −1.75 °C at the Saqez station, respectively. These variations are attributed to regional temperature increases induced by global climate changes [6]. While the reduction in these parameters at the Sarab station is comparatively moderate compared to the Saqez station, it suggests that local factors, such as evaporation from Lake Urmia or evapotranspiration from nearby vegetation, may influence humidity levels at the Sarab station. Figure 7d,e, along with Table S4, demonstrate that cumulative precipitation and the number of rainy days at the Sarab station during the summer are significantly higher than those at the Saqez station both before and after 1995. Table S3 confirms an augmentation in cumulative precipitation and the number of rainy days during the summer at the Sarab station. This result implies that despite a reduction in evaporation from the surface of Lake Urmia due to its shrinking surface, the escalated water consumption in agricultural activities and increased evaporation from agricultural land contribute to enhanced convectional rainfall. Additionally, violin plots illustrating seasonal variations in meteorological parameters for the Saqez and Sarab are presented in Figure S3 and Figure S4, respectively.
This study analyzed the distribution of precipitation in the Lake Urmia basin using the MSWEP V2.8 [43,45] dataset and explored the impact of lacking observational data on understanding changes in summer precipitation. Figure 8 illustrates the spatial distribution of summer precipitation in the Lake Urmia basin obtained from satellite-based data. Figure 8a,b depicts the distribution of cumulative summer precipitation in pre- and post-1995, respectively, while Figure 8c displays the changes of cumulative precipitation obtained from the difference between Figure 8a,b. The results suggest that precipitation levels in the western and significantly eastern part of the Lake Urmia basin are higher than those in the southern region, supporting the hypothesis of convection rainfall formation in the eastern Urmia area. Notably, Figure 8c reveals an increase in summer precipitation levels in the eastern basin despite a decrease in evaporation from the lake surface. This suggests that the increase in evaporation from agricultural land is offsetting the decrease in lake surface evaporation, leading to a rise in precipitation levels in the east of the Lake Urmia basin.
5. Discussion
This study aims to elucidate the impact of Lake Urmia on local precipitation and to examine the influence of fluctuations in the lake’s water level on local precipitation patterns. The hypothesis posited is that during the summer, evaporation from the lake and evapotranspiration in agricultural areas could heighten humidity, potentially contributing to convectional rainfall in the basin. Prevailing western winds were identified as a key factor causing the eastward shift of evaporation in the basin, leading to convection rainfall in the eastern region of Lake Urmia’s basin. To investigate this, the study analyzed observational data from the Sarab station in the east (influenced by local climate) and the Saqez station in the south (influenced by global climate) of the Lake Urmia basin for the period 1986–2017. Limitations in data availability from the Iran Meteorological Organization and the unreliability of data from the Iranian Ministry of Energy hindered the creation of a comprehensive distribution map for meteorological parameters. Therefore, we focused on two strategically chosen stations, with appropriate time intervals, to represent different climatic influences within the Lake Urmia basin. The findings revealed that during the summer, the eastern part of the basin, influenced by the local climate, exhibited higher values for cumulative precipitation, number of rainy days, relative humidity, vapor pressure, and dewpoint temperature compared to the southern region influenced by global climate. However, during spring and autumn, most parameters showed similarities between the two stations, while in winter, the Saqez station had higher values, indicating the local climate’s impact on the eastern basin during the summer. The study further examined the impact of changes in Lake Urmia’s water level on local precipitation. Surprisingly, despite a decline in relative humidity, dewpoint temperature, and vapor pressure in both stations during the summer in the post-1995 period, the Sarab station underwent an increase in precipitation and the number of rainy days. This result suggests that factors such as extensive irrigation, heightened water consumption in agriculture, and increased evaporation from agricultural land contribute to enhanced convectional rainfall, compensating for the reduction in evaporation from the shrinking surface of Lake Urmia. Additionally, the study employed satellite-based global precipitation data (MSWEP V2.8) to assess changes in the distribution of summer precipitation. The findings indicated an increase in summer precipitation in the eastern part of the Lake Urmia basin after 1995, as opposed to the southern region. While this study provides valuable insights into the complex relationship between Lake Urmia and local precipitation, it is essential to acknowledge its limitations, primarily arising from the scarcity of available synoptic stations for precipitation analysis. Furthermore, there is no soil moisture data available that could be used to develop reliable simulation models to account for its impact on local precipitation changes.
A comprehensive investigation into atmospheric moisture flow and precipitation origins is imperative to fully comprehend the intricate dynamics between Lake Urmia and local precipitation patterns. While our study primarily focuses on understanding how Lake Urmia influences local precipitation, it is crucial to consider broader research on how water bodies affect regional climate dynamics. While studies have extensively explored the impact of water bodies on temperature, evaporation, and humidity (see, for example, [31,52,53]), there is a noticeable gap in understanding their influence on precipitation patterns. This gap is particularly significant given the pressing concerns surrounding water management, especially in arid and semi-arid regions facing heightened water stress due to factors like climate change. Our findings highlight the urgent need for further research to unravel the complex relationship between surface water bodies and local precipitation dynamics. This understanding is pivotal for devising effective water management strategies, especially in regions like the Lake Urmia basin, where a mix of natural and human-induced factors significantly shape water availability and distribution. Future research should be focused on complementing the analysis of the current study with data on soil moisture and water balance components in the region, which can help identify the source(s) of precipitation and the fate of evaporation. For this purpose, developing a hydrological model and calibrating it using different sources of observed data for surface water and groundwater systems is necessary.
6. Conclusions
The presence of lakes can affect the local climate and contribute to regional climate change. This study investigates the effect of Lake Urmia, Iran, on the local precipitation of the surrounding area within its basin. The study analyzes climatic parameters such as relative humidity, dew point temperature, vapor pressure, cumulative precipitation, and number of rainy days at two weather stations. The study shows that the cumulative precipitation, the number of rainy days, as well as relative humidity, vapor pressure, and dew point temperature in the summer in the eastern part of the Lake Urmia basin are higher than south of the basin, and this shows the effect of the lake in the summer. By dividing the summer data into two periods (before and after 1995, since this is when a consistent decline in surface water in the lake was noticed), it was observed that relative humidity, vapor pressure, and dew point temperature decreased after 1995 and this could be caused by global climate change. It should be noted that the amount of precipitation and the number of rainy days has increased in the eastern part of the basin after 1995. In addition, baseline satellite data showed that the eastern region of the lake undergoes more summer precipitation compared to the southern region. This can be attributed to factors such as increased evapotranspiration due to intensive irrigation for agricultural purposes.
Supplementary Materials
The following supporting information can be downloaded at: https://0-www-mdpi-com.brum.beds.ac.uk/article/10.3390/w16091250/s1, Table S1: Geographical location of synoptic stations utilized in this study, Table S2: Monthly average and annual actual evapotranspiration (AET) from October 2013 to September 2015 for various land covers in the Lake Urmia basin (Data source: Urmia Lake Research Programme, https://www.ulrp.ir/en), Table S3: Summary statistics (mean, median, and standard deviation) for precipitation, relative humidity, vapor pressure, and dewpoint temperature during the entire study period (1986–2017) and its sub-periods (1986–1995, 1996–2017), also highlights percentage changes in these metrics from 1986–1995 to 1996–2017, Table S4: Comparative analysis of meteorological parameters between Saqez and Sarab stations using statistical indicators, p-values, and T-statistics, Table S5: Correlation coefficient matrix illustrating the relationships between climate variables and Urmia Lake water level. Green indicates a positive correlation, while red signifies a lack of correlation. (Abbreviations explained: ULWL—Urmia Lake Water Level, DEW—Dewpoint Temperature, P—Precipitation, HU—Humidity, VP—Vapor Pressure, and Rainy Day—Number of Rainy Days), Table S6: Comparative analysis of meteorological parameters before and after the identified change point in 1995 using statistical indicators, p-values, and T-Statistics. (Abbreviations explained: ULWL—Urmia Lake Water Level, DEW—Dewpoint Temperature, P—Precipitation, HU—Humidity, VP—Vapor Pressure, and Rainy Day—Number of Rainy Days), Figure S1: Annual average actual evapotranspiration (mm) for the years 2013–2015 (Data source: Urmia Lake Research Programme, https://www.ulrp.ir/en), Figure S2: Illustration depicting the violin plot along with its relevant details, Figure S3: Violin plots illustrating seasonal variations in (a) seasonal average relative humidity, (b) seasonal average vapor pressure, (c) seasonal average dewpoint temperature, (d) cumulative precipitation, and (e) cumulative rainy days at the Saqez synoptic station, contrasting the periods before and after 1995, Figure S4: Violin plots illustrating seasonal variations in (a) seasonal average relative humidity, (b) seasonal average vapor pressure, (c) seasonal average dewpoint temperature, (d) cumulative precipitation, and (e) cumulative rainy days at the Sarab synoptic station, contrasting the periods before and after 1995.
Author Contributions
Conceptualization, H.M. and A.H.D.; methodology, H.M., A.H.D. and C.S.S.F.; software, H.M. and A.H.D.; validation, H.M., A.H.D. and C.S.S.F.; formal analysis, H.M. and A.H.D.; investigation, H.M. and A.H.D.; resources, H.M. and A.H.D.; data curation, H.M.; writing—original draft preparation, H.M., A.H.D. and C.S.S.F.; writing—review and editing, A.H.D., C.S.S.F. and Z.K.; visualization, H.M.; supervision, Z.K.; project administration, A.H.D. All authors have read and agreed to the published version of the manuscript.
Funding
This research received no external funding.
Data Availability Statement
Data will be made available on request to H.M.
Acknowledgments
The authors of this article humbly dedicate their work to the memory of Mahshad Karimi (1996–2021), a courageous Iranian environmental journalist. Unfortunately, she lost her life in a tragic bus crash while en route to report on the lake’s environmental issues. Her sacrifice will always be remembered and appreciated by all those who share her vision of a sustainable future for our planet. Also, Carla Ferreira thanks the Portuguese Foundation for Science and Technology, P.I., through funding by the institutional scientific employment program-contract (CEECINST/00077/2021).
Conflicts of Interest
The authors declare no conflict of interest.
References
- Delju, A.H.; Ceylan, A.; Piguet, E.; Rebetez, M. Observed Climate Variability and Change in Urmia Lake Basin, Iran. Theor. Appl. Climatol. 2013, 111, 285–296. [Google Scholar] [CrossRef]
- Alizadeh-Choobari, O.; Ahmadi-Givi, F.; Mirzaei, N.; Owlad, E. Climate Change and Anthropogenic Impacts on the Rapid Shrinkage of Lake Urmia. Int. J. Climatol. 2016, 36, 4276–4286. [Google Scholar] [CrossRef]
- Hossein Mardi, A.; Khaghani, A.; MacDonald, A.B.; Nguyen, P.; Karimi, N.; Heidary, P.; Karimi, N.; Saemian, P.; Sehatkashani, S.; Tajrishy, M.; et al. The Lake Urmia Environmental Disaster in Iran: A Look at Aerosol Pollution. Sci. Total Environ. 2018, 633, 42–49. [Google Scholar] [CrossRef]
- Dehghanipour, A.H.; Zahabiyoun, B.; Schoups, G.; Babazadeh, H. A WEAP-MODFLOW Surface Water-Groundwater Model for the Irrigated Miyandoab Plain, Urmia Lake Basin, Iran: Multi-Objective Calibration and Quantification of Historical Drought Impacts. Agric. Water Manag. 2019, 223, 105704. [Google Scholar] [CrossRef]
- Khazaei, B.; Khatami, S.; Alemohammad, S.H.; Rashidi, L.; Wu, C.; Madani, K.; Kalantari, Z.; Destouni, G.; Aghakouchak, A. Climatic or Regionally Induced by Humans? Tracing Hydro-Climatic and Land-Use Changes to Better Understand the Lake Urmia Tragedy. J. Hydrol. 2019, 569, 203–217. [Google Scholar] [CrossRef]
- Dehghanipour, A.H.; Moshir Panahi, D.; Mousavi, H.; Kalantari, Z.; Tajrishy, M. Effects of Water Level Decline in Lake Urmia, Iran, on Local Climate Conditions. Water 2020, 12, 2153. [Google Scholar] [CrossRef]
- Schulz, S.; Darehshouri, S.; Hassanzadeh, E.; Tajrishy, M.; Schüth, C. Climate Change or Irrigated Agriculture—What Drives the Water Level Decline of Lake Urmia. Sci. Rep. 2020, 10, 236. [Google Scholar] [CrossRef] [PubMed]
- Meydani, A.; Dehghanipour, A.; Schoups, G.; Tajrishy, M. Daily Reservoir Inflow Forecasting Using Weather Forecast Downscaling and Rainfall-Runoff Modeling: Application to Urmia Lake Basin, Iran. J. Hydrol. Reg. Stud. 2022, 44, 101228. [Google Scholar] [CrossRef]
- Herdendorf, C.E. Large Lakes of the World. J. Great Lakes Res. 1982, 8, 379–412. [Google Scholar] [CrossRef]
- Bai, J.; Lu, Q.; Zhao, Q.; Wang, J.; Ouyang, H. Effects of Alpine Wetland Landscapes on Regional Climate on the Zoige Plateau of China. Adv. Meteorol. 2013, 2013, e972430. [Google Scholar] [CrossRef]
- Kuşçu Şimşek, Ç.; Ödül, H. Investigation of the Effects of Wetlands on Micro-Climate. Appl. Geogr. 2018, 97, 48–60. [Google Scholar] [CrossRef]
- Zhao, S.; Cook, K.H.; Vizy, E.K. How Shrinkage of Lake Chad Affects the Local Climate. Clim. Dyn. 2022, 61, 595–619. [Google Scholar] [CrossRef]
- Shafir, H.; Alpert, P. Regional and Local Climatic Effects on the Dead-Sea Evaporation. Clim. Chang. 2011, 105, 455–468. [Google Scholar] [CrossRef]
- Ashbel, D.; Brooks, C.E.P. The Influence of the Dead Sea on the Climate of Its Neighbourhood. Q. J. R. Meteorol. Soc. 1939, 65, 185–194. [Google Scholar] [CrossRef]
- Alpert, P.; Shafir, H. Separating Regional vs. Local Climatic Effects: Example with the Dead-Sea Evaporation. In Proceedings of the 12th Plinius Conference on Mediterranean Storms, Corfu Island, Greece, 1–4 September 2010; p. 81. [Google Scholar]
- Glantz, M.H. Aral Sea Basin: A Sea Dies, a Sea Also Rises. Ambi 2007, 36, 323–327. [Google Scholar] [CrossRef]
- Micklin, P. The Past, Present, and Future Aral Sea. Lakes Res. Sci. Policy Manag. Sustain. Use 2010, 15, 193–213. [Google Scholar] [CrossRef]
- Saligheh et al. The Impacts of Hamoon Lake Level Changes on the Local Climate of Sistan. 2010. Available online: https://civilica.com/doc/82832/ (accessed on 1 October 2023). (In Persian).
- Scott, R.W.; Huff, F.A. Impacts of the Great Lakes on Regional Climate Conditions. J. Great Lakes Res. 1996, 22, 845–863. [Google Scholar] [CrossRef]
- Eimanifar, A.; Mohebbi, F. Urmia Lake (Northwest Iran): A Brief Review. Aquat. Biosyst. 2007, 3, 5. [Google Scholar] [CrossRef]
- Sima, S.; Ahmadalipour, A.; Shafiee Jood, M.; Tajrishy, M.; Abrishamchi, A. Monitoring Urmia Lake Area Variations Using MODIS Satellite Data. In Proceedings of the World Environmental and Water Resources Congress 2012: Crossing Boundaries, Albuquerque, NM, USA, 20–24 May 2012; pp. 1917–1926. [Google Scholar] [CrossRef]
- Huang, J.; Zhang, Y.; Arhonditsis, G.B.; Gao, J.; Chen, Q.; Wu, N.; Dong, F.; Shi, W. How Successful Are the Restoration Efforts of China’s Lakes and Reservoirs? Environ. Int. 2019, 123, 96–103. [Google Scholar] [CrossRef]
- Ghaheri, M.; Baghal-Vayjooee, M.H.; Naziri, J. Lake Urmia, Iran: A Summary Review. Int. J. Salt Lake Res. 1999, 8, 19–22. [Google Scholar] [CrossRef]
- Yapiyev, V.; Sagintayev, Z.; Inglezakis, V.J.; Samarkhanov, K.; Verhoef, A. Essentials of Endorheic Basins and Lakes: A Review in the Context of Current and Future Water Resource Management and Mitigation Activities in Central Asia. Water 2017, 9, 798. [Google Scholar] [CrossRef]
- Asem, A.; Eimanifar, A.; Djamali, M.; De los Rios, P.; Wink, M. Biodiversity of the Hypersaline Urmia Lake National Park (NW Iran). Diversity 2014, 6, 102–132. [Google Scholar] [CrossRef]
- Parsinejad, M.; Rosenberg, D.E.; Ghale, Y.A.G.; Khazaei, B.; Null, S.E.; Raja, O.; Safaie, A.; Sima, S.; Sorooshian, A.; Wurtsbaugh, W.A. 40-Years of Lake Urmia Restoration Research: Review, Synthesis and next Steps. Sci. Total Environ. 2022, 832, 155055. [Google Scholar] [CrossRef] [PubMed]
- Roushangar, K.; Alami, M.T.; Golmohammadi, H. Modeling the Effects of Land Use/Land Cover Changes on Water Requirements of Urmia Lake Basin Using CA-Markov and NETWAT Models. Model. Earth Syst. Environ. 2023, 9, 2569–2581. [Google Scholar] [CrossRef]
- Ahmadaali, J.; Barani, G.-A.; Qaderi, K.; Hessari, B. Analysis of the Effects of Water Management Strategies and Climate Change on the Environmental and Agricultural Sustainability of Urmia Lake Basin, Iran. Water 2018, 10, 160. [Google Scholar] [CrossRef]
- Alizade Govarchin Ghale, Y.; Baykara, M.; Unal, A. Investigating the Interaction between Agricultural Lands and Urmia Lake Ecosystem Using Remote Sensing Techniques and Hydro-Climatic Data Analysis. Agric. Water Manag. 2019, 221, 566–579. [Google Scholar] [CrossRef]
- Esmailzadeh, S.; Rizi, A.P.; Mianabadi, H. Evaluation of the Water Policies of the Urmia Lake Basin: Has the Government Accurately Identified the Problem? Environ. Sci. Policy Sustain. Dev. 2023, 65, 18–34. [Google Scholar] [CrossRef]
- Wang, J.; Song, C.; Reager, J.T.; Yao, F.; Famiglietti, J.S.; Sheng, Y.; MacDonald, G.M.; Brun, F.; Schmied, H.M.; Marston, R.A.; et al. Recent Global Decline in Endorheic Basin Water Storages. Nat. Geosci. 2018, 11, 926–932. [Google Scholar] [CrossRef] [PubMed]
- Malek, K.; Adam, J.C.; Stöckle, C.O.; Peters, R.T. Climate Change Reduces Water Availability for Agriculture by Decreasing Non-Evaporative Irrigation Losses. J. Hydrol. 2018, 561, 444–460. [Google Scholar] [CrossRef]
- Xiao, K.; Griffis, T.J.; Baker, J.M.; Bolstad, P.V.; Erickson, M.D.; Lee, X.; Wood, J.D.; Hu, C.; Nieber, J.L. Evaporation from a Temperate Closed-Basin Lake and Its Impact on Present, Past, and Future Water Level. J. Hydrol. 2018, 561, 59–75. [Google Scholar] [CrossRef]
- Alborzi, A.; Mirchi, A.; Moftakhari, H.; Mallakpour, I.; Alian, S.; Nazemi, A.; Hassanzadeh, E.; Mazdiyasni, O.; Ashraf, S.; Madani, K.; et al. Climate-Informed Environmental Inflows to Revive a Drying Lake Facing Meteorological and Anthropogenic Droughts. Environ. Res. Lett. 2018, 13, 084010. [Google Scholar] [CrossRef]
- Delfi, S.; Mosaferi, M.; Hassanvand, M.S.; Maleki, S. Investigation of Aerosols Pollution across the Eastern Basin of Urmia Lake Using Satellite Remote Sensing Data and HYSPLIT Model. J. Environ. Health Sci. Eng. 2019, 17, 1107–1120. [Google Scholar] [CrossRef]
- Castellví, F.; Perez, P.J.; Villar, J.M.; Rosell, J.I. Analysis of Methods for Estimating Vapor Pressure Deficits and Relative Humidity. Agric. For. Meteorol. 1996, 82, 29–45. [Google Scholar] [CrossRef]
- Davie, T. Fundamentals of Hydrology; Routledge: London, UK, 2019; ISBN 978-1-135-10675-1. [Google Scholar]
- Modarres, R.; de Paulo Rodrigues da Silva, V. Rainfall Trends in Arid and Semi-Arid Regions of Iran. J. Arid Environ. 2007, 70, 344–355. [Google Scholar] [CrossRef]
- Miranda, J.D.; Armas, C.; Padilla, F.M.; Pugnaire, F.I. Climatic Change and Rainfall Patterns: Effects on Semi-Arid Plant Communities of the Iberian Southeast. J. Arid Environ. 2011, 75, 1302–1309. [Google Scholar] [CrossRef]
- Berg, P.; Moseley, C.; Haerter, J.O. Strong Increase in Convective Precipitation in Response to Higher Temperatures. Nat. Geosci. 2013, 6, 181–185. [Google Scholar] [CrossRef]
- Larsen, M.A.D.; Christensen, J.H.; Drews, M.; Butts, M.B.; Refsgaard, J.C. Local Control on Precipitation in a Fully Coupled Climate-Hydrology Model. Sci. Rep. 2016, 6, 22927. [Google Scholar] [CrossRef]
- Beck, H.E.; van Dijk, A.I.J.M.; Levizzani, V.; Schellekens, J.; Miralles, D.G.; Martens, B.; de Roo, A. MSWEP: 3-Hourly 0.25° Global Gridded Precipitation (1979–2015) by Merging Gauge, Satellite, and Reanalysis Data. Hydrol. Earth Syst. Sci. 2017, 21, 589–615. [Google Scholar] [CrossRef]
- Beck, H.E.; Wood, E.F.; Pan, M.; Fisher, C.K.; Miralles, D.M.; van Dijk, A.I.J.M.; McVicar, T.R.; Adler, R.F. MSWEP V2.8 Technical Documentation. 2021. Available online: http://www.gloh2o.org/mswep (accessed on 1 December 2023).
- Mousavi, H.; Moshir Panahi, D.; Kalantari, Z. Dust and Climate Interactions in the Middle East: Spatio-Temporal Analysis of Aerosol Optical Depth and Climatic Variables. Sci. Total Environ. 2024, 927, 172176. [Google Scholar] [CrossRef] [PubMed]
- Beck, H.E.; Wood, E.F.; Pan, M.; Fisher, C.K.; Miralles, D.G.; van Dijk, A.I.J.M.; McVicar, T.R.; Adler, R.F. MSWEP V2 Global 3-Hourly 0.1° Precipitation: Methodology and Quantitative Assessment. Bull. Am. Meteorol. Soc. 2019, 100, 473–500. [Google Scholar] [CrossRef]
- Benesty, J.; Chen, J.; Huang, Y.; Cohen, I. Pearson Correlation Coefficient. In Noise Reduction in Speech Processing; Cohen, I., Huang, Y., Chen, J., Benesty, J., Eds.; Springer Topics in Signal Processing; Springer: Berlin/Heidelberg, Germany, 2009; pp. 1–4. ISBN 978-3-642-00296-0. [Google Scholar]
- Rice, W.R. Analyzing Tables of Statistical Tests. Evolution 1989, 43, 223–225. [Google Scholar] [CrossRef]
- Kim, T.K. T Test as a Parametric Statistic. Korean J. Anesthesiol. 2015, 68, 540–546. [Google Scholar] [CrossRef]
- Hubbard, R. P–Values. In International Encyclopedia of Statistical Science; Lovric, M., Ed.; Springer: Berlin/Heidelberg, Germany, 2011; pp. 1144–1145. ISBN 978-3-642-04898-2. [Google Scholar]
- Waskom, M.L. Seaborn: Statistical Data Visualization. J. Open Source Softw. 2021, 6, 3021. [Google Scholar] [CrossRef]
- Hintze, J.L.; Nelson, R.D. Violin Plots: A Box Plot-Density Trace Synergism. Am. Stat. 1998, 52, 181–184. [Google Scholar] [CrossRef]
- Cheng, Y.; Liu, X.; Zeng, Z.; Liu, S.; Wang, Z.; Tang, X.; He, B.-J. Impacts of Water Bodies on Microclimates and Outdoor Thermal Comfort: Implications for Sustainable Rural Revitalization. Front. Environ. Sci. 2022, 10, 940482. [Google Scholar] [CrossRef]
- Xu, H.; Lin, X.; Lin, Y.; Zheng, G.; Dong, J.; Wang, M. Study on the Microclimate Effect of Water Body Layout Factors on Campus Squares. Int. J. Environ. Res. Public Health 2022, 19, 14846. [Google Scholar] [CrossRef]
Figure 1.
(a) Location of the Lake Urmia basin study site within Iran and location of Lake Urmia and two synoptic weather stations, and (b) land cover map derived from 2015 Landsat 8 imagery.
Figure 1.
(a) Location of the Lake Urmia basin study site within Iran and location of Lake Urmia and two synoptic weather stations, and (b) land cover map derived from 2015 Landsat 8 imagery.


Figure 2.
Annual time series depicting the water level of Lake Urmia spanning from 1986 to 2017 (Data source: Urmia Lake Research Programme, https://abopa..ir/en/ulrp5/ (accessed on 1 October 2023)), alongside agricultural withdrawals in the Lake Urmia basin [34] and the related 5-year moving averages.

Figure 3.
Schematic diagram illustrating the generation of convectional rainfall in the eastern area of the Lake Urmia basin, hypothesized in the current study.
Figure 3.
Schematic diagram illustrating the generation of convectional rainfall in the eastern area of the Lake Urmia basin, hypothesized in the current study.

Figure 4.
Schematic diagram illustrating the relationship between atmospheric vapor pressure (eA) at point A, saturation vapor pressure (eS) at a given temperature (θA), and dewpoint temperature (θDEW). Symbols A and S represent the desired and saturated points respectively, while DEW denotes the dewpoint.

Figure 5.
Seasonal violin plots for (a) seasonal average relative humidity, (b) seasonal average vapor pressure, (c) seasonal average dewpoint temperature, (d) cumulative precipitation, and (e) cumulative rainy days for both Saqez and Sarab synoptic stations during the study period (1986–2017). (See Figure S2 for better understanding of violin plot).


Figure 6.
Seasonal pattern based on deviation from the 1:1 line for (a) seasonal average relative humidity, (b) seasonal average vapor pressure, (c) seasonal average dewpoint temperature, (d) cumulative precipitation, and (e) cumulative rainy days for the study period (1986–2017).
Figure 6.
Seasonal pattern based on deviation from the 1:1 line for (a) seasonal average relative humidity, (b) seasonal average vapor pressure, (c) seasonal average dewpoint temperature, (d) cumulative precipitation, and (e) cumulative rainy days for the study period (1986–2017).


Figure 7.
Violin plots depicting summer variations in (a) average relative humidity, (b) average vapor pressure, (c) average dewpoint temperature, (d) cumulative precipitation, and (e) cumulative rainy days for both 1986–1995 and 1996–2017 periods for Saqez and Sarab synoptic stations. (See Figure S2 for better understanding of violin plot).


Figure 8.
Summer cumulative precipitation in the period (a) pre change (1986–1995), (b) post change (1996–2017), and (c) change between both periods (post change–pre change).
Figure 8.
Summer cumulative precipitation in the period (a) pre change (1986–1995), (b) post change (1996–2017), and (c) change between both periods (post change–pre change).

Disclaimer/Publisher’s Note: The statements, opinions and data contained in all publications are solely those of the individual author(s) and contributor(s) and not of MDPI and/or the editor(s). MDPI and/or the editor(s) disclaim responsibility for any injury to people or property resulting from any ideas, methods, instructions or products referred to in the content. |
© 2024 by the authors. Licensee MDPI, Basel, Switzerland. This article is an open access article distributed under the terms and conditions of the Creative Commons Attribution (CC BY) license (https://creativecommons.org/licenses/by/4.0/).
Share and Cite
MDPI and ACS Style
Mousavi, H.; Dehghanipour, A.H.; Ferreira, C.S.S.; Kalantari, Z. Investigating the Impact of Large Lakes on Local Precipitation: Case Study of Lake Urmia, Iran. Water 2024, 16, 1250. https://0-doi-org.brum.beds.ac.uk/10.3390/w16091250
AMA Style
Mousavi H, Dehghanipour AH, Ferreira CSS, Kalantari Z. Investigating the Impact of Large Lakes on Local Precipitation: Case Study of Lake Urmia, Iran. Water. 2024; 16(9):1250. https://0-doi-org.brum.beds.ac.uk/10.3390/w16091250
Chicago/Turabian StyleMousavi, Hossein, Amir Hossein Dehghanipour, Carla S.S. Ferreira, and Zahra Kalantari. 2024. "Investigating the Impact of Large Lakes on Local Precipitation: Case Study of Lake Urmia, Iran" Water 16, no. 9: 1250. https://0-doi-org.brum.beds.ac.uk/10.3390/w16091250
Note that from the first issue of 2016, this journal uses article numbers instead of page numbers. See further details here.