
Reduction of Subsidence and Large-Scale Rebound in the Beijing Plain after Anthropogenic Water Transfer and Ecological Recharge of Groundwater: Evidence from Long Time-Series Satellites InSAR

 , , ,
, , , 
Abstract
:
1. Introduction
2. Study Area and Datasets
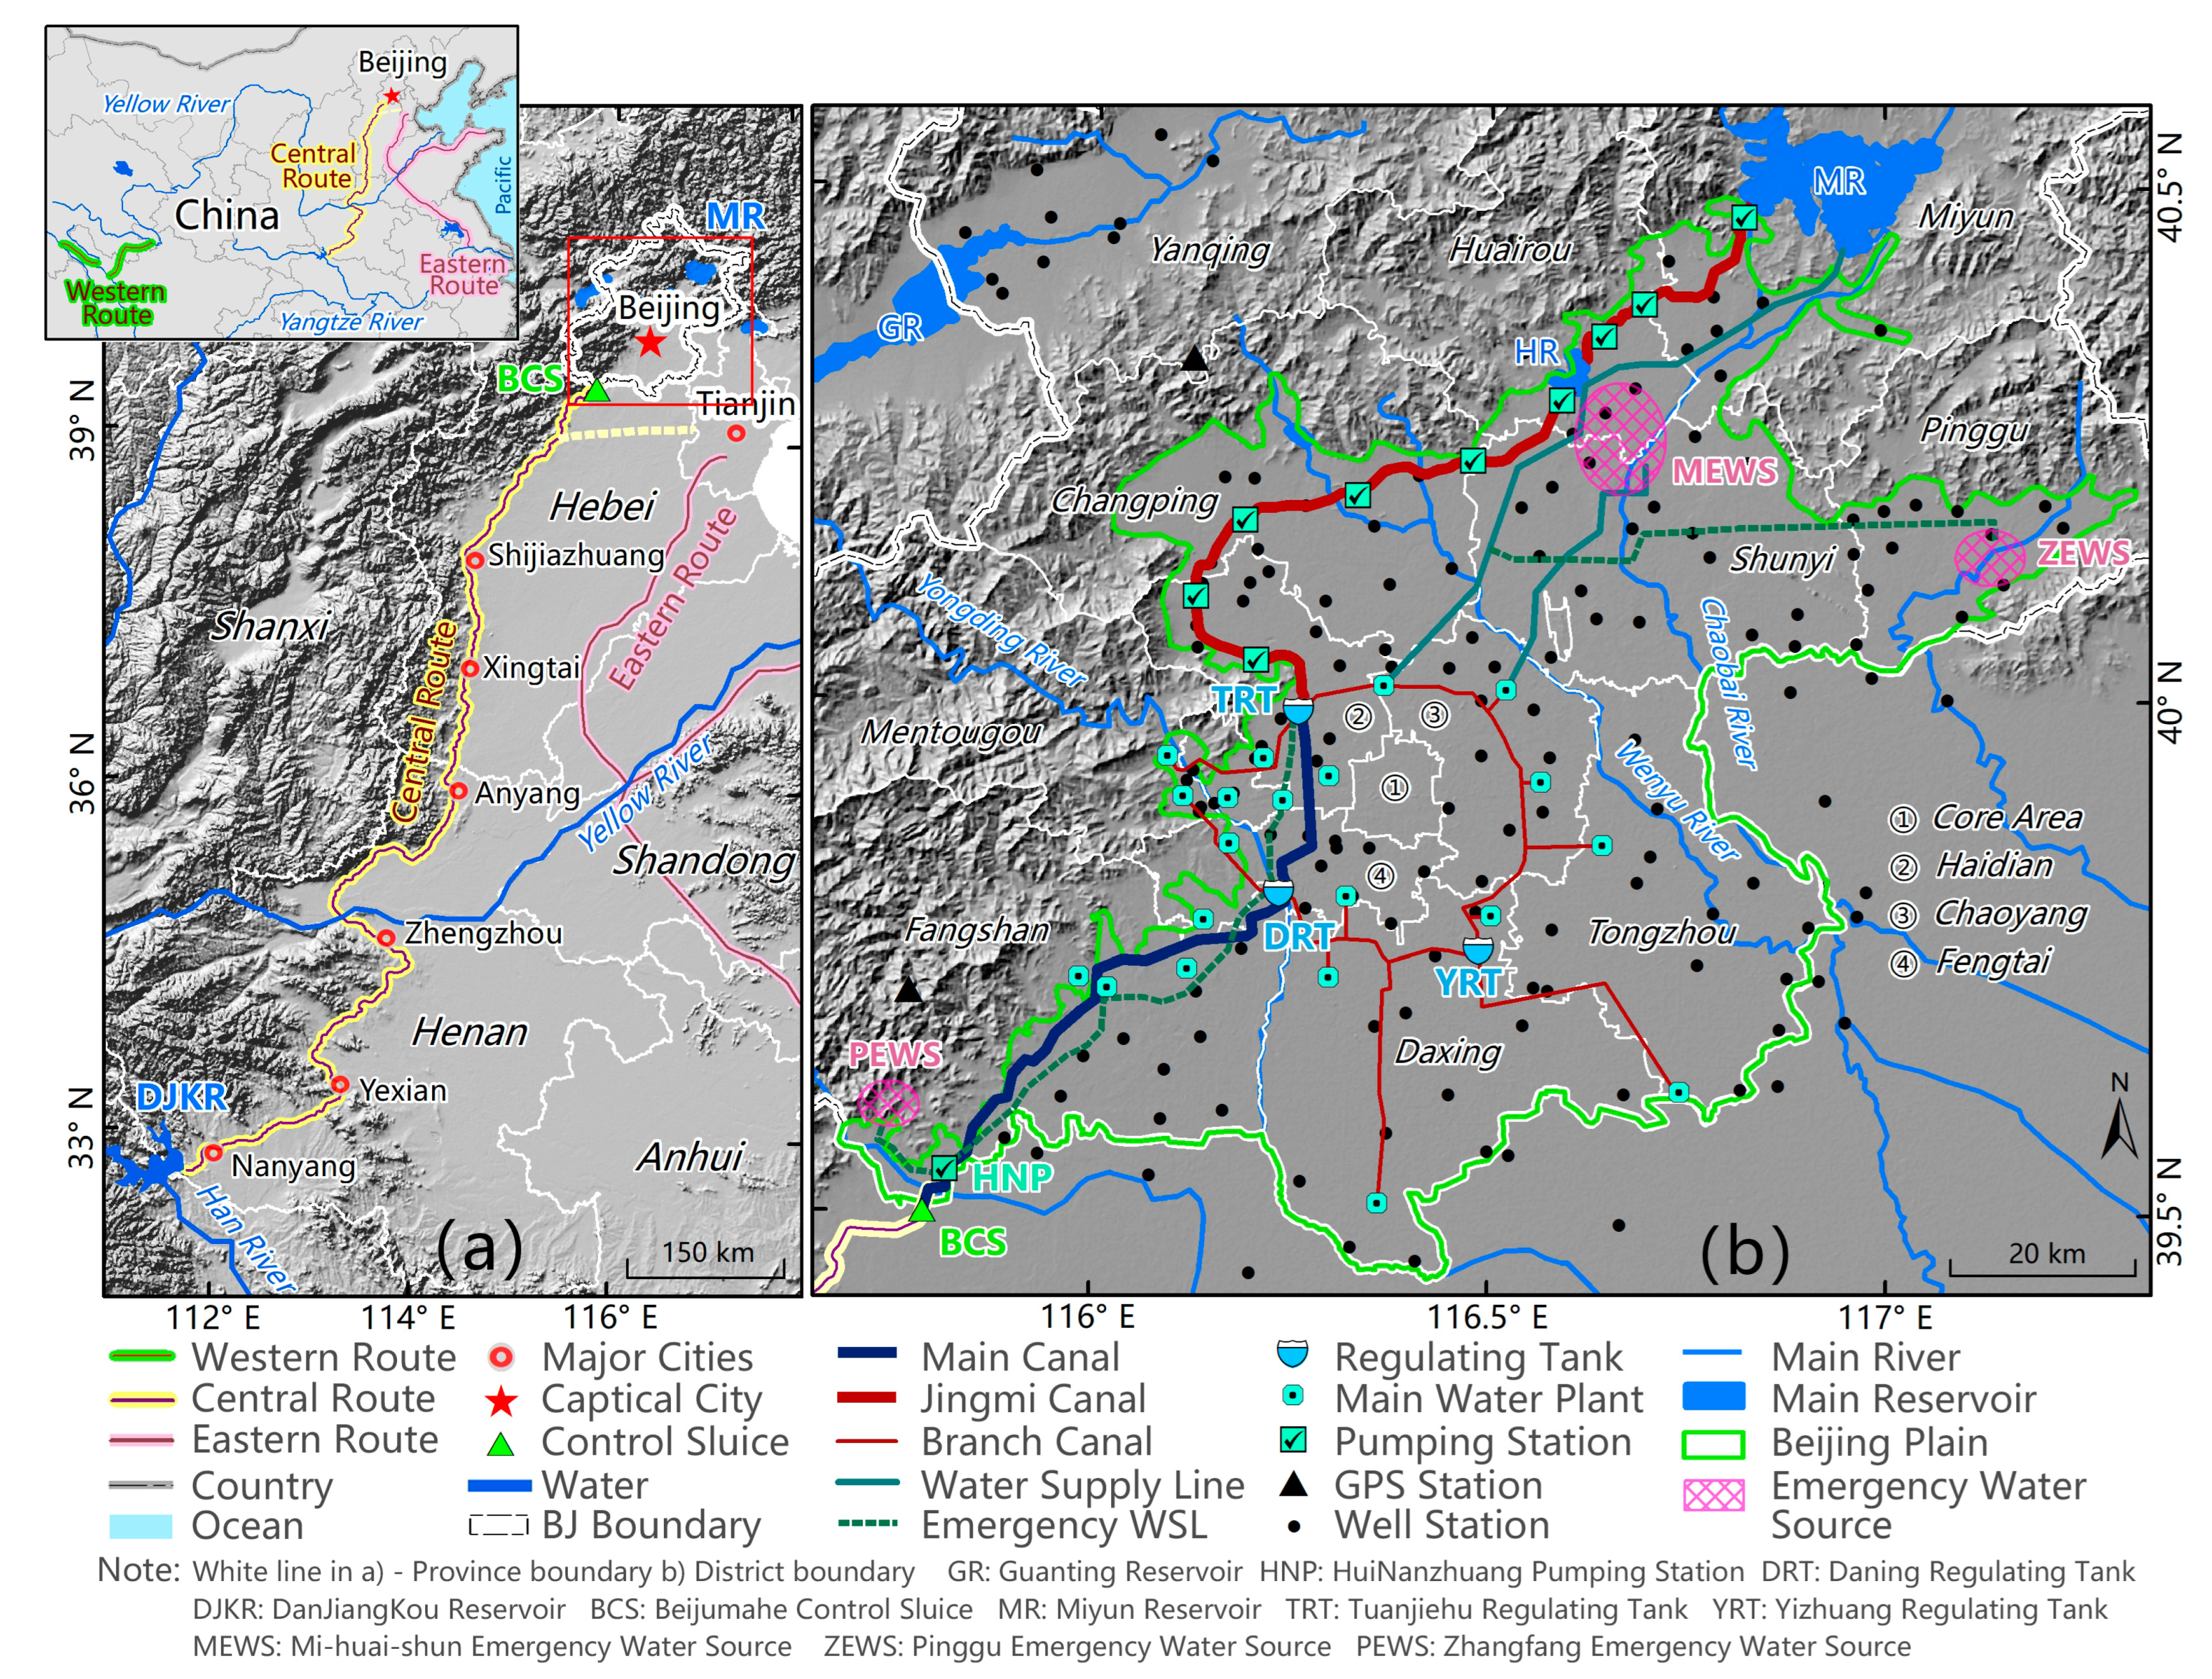
2.1. Geography and Hydrogeology of the Study Area
2.2. Background of SNWDP and Beijing’s New Water Management Strategy
2.3. Datasets
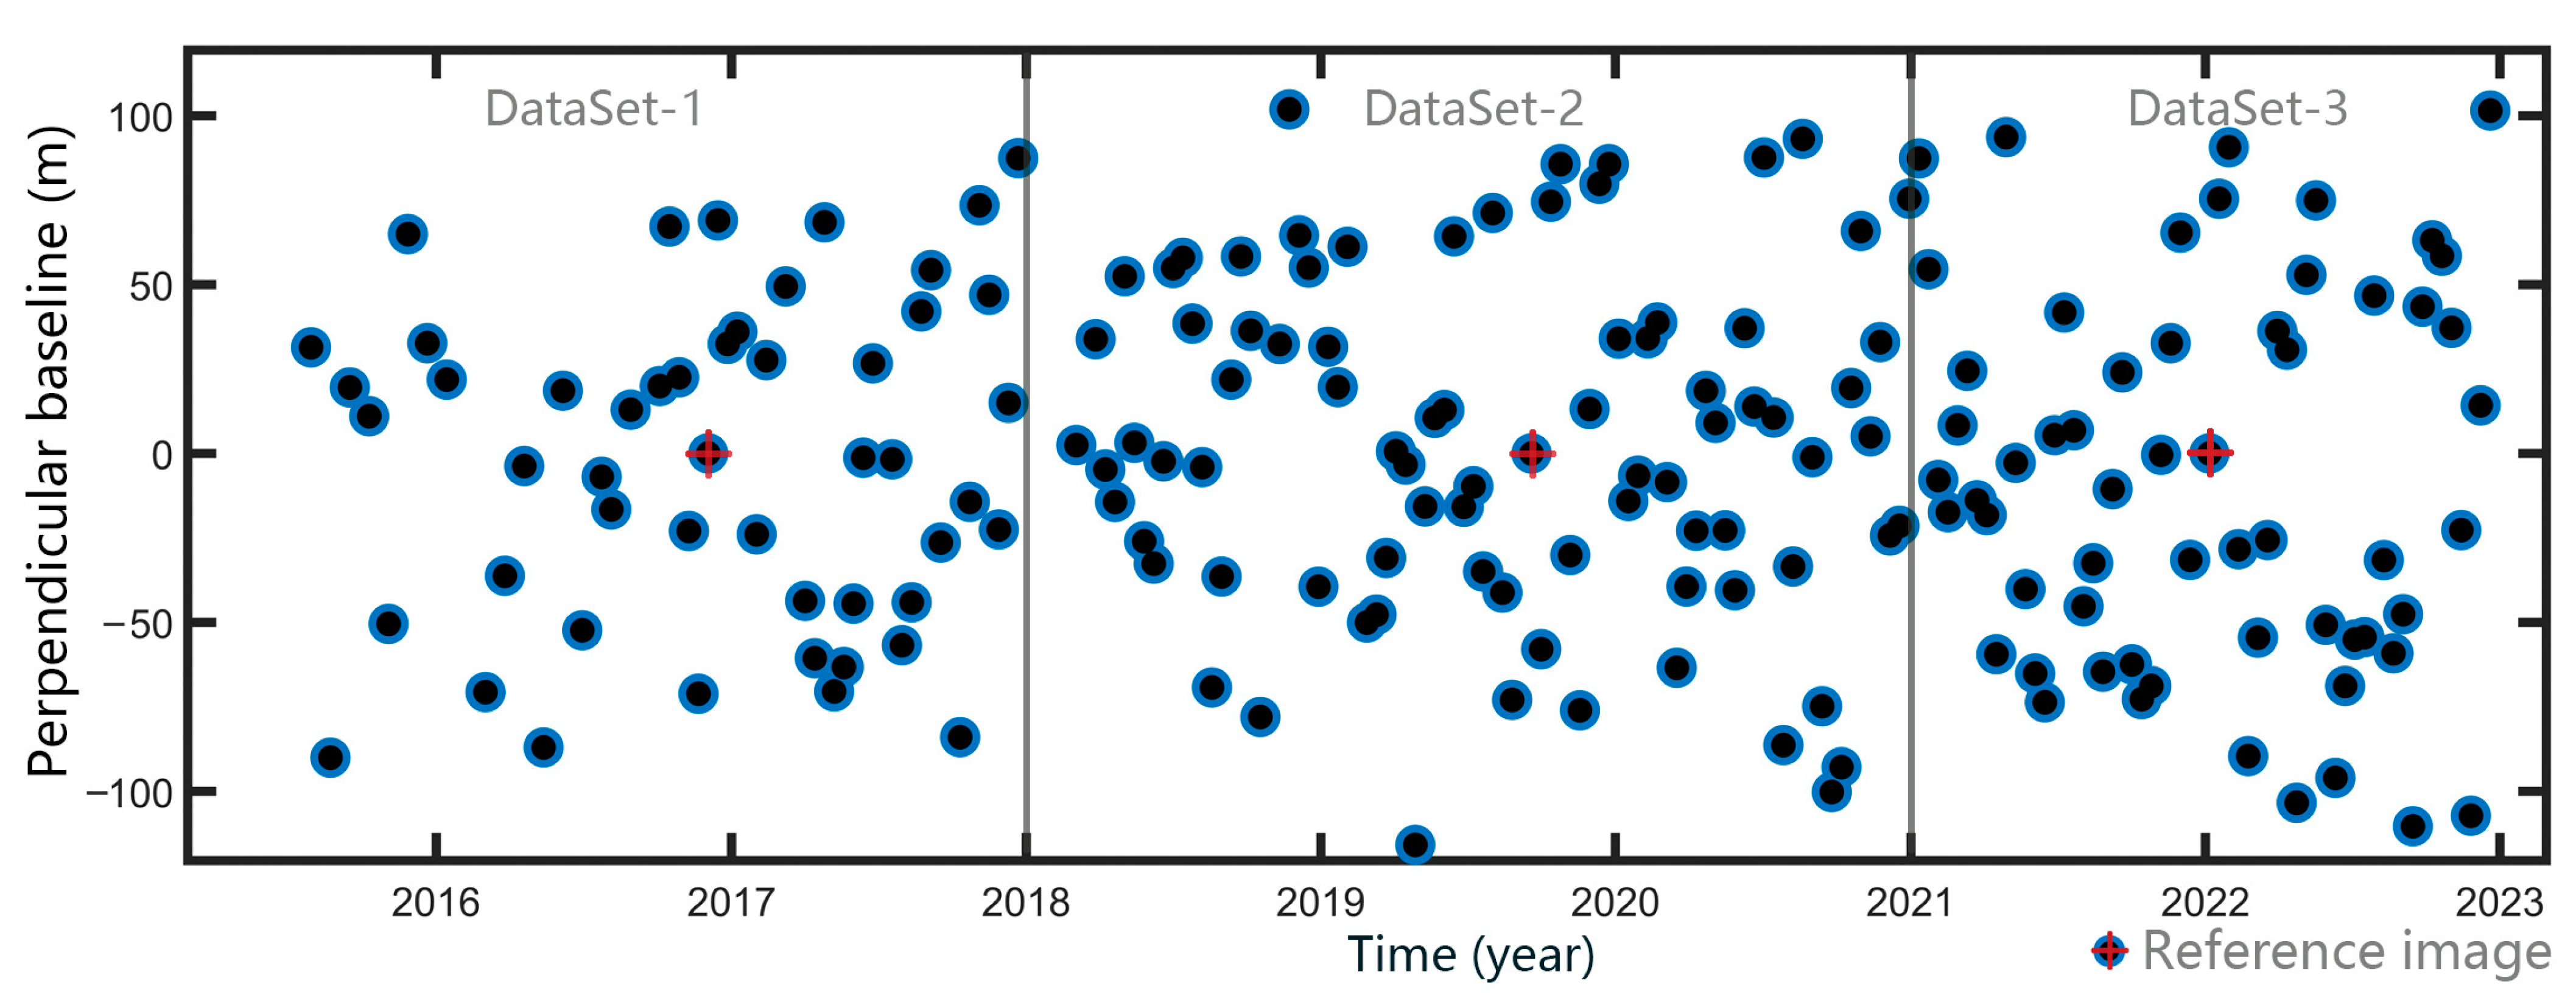
2.3.1. SAR Images
2.3.2. Auxiliary Datasets
3. Methods and Data Processing
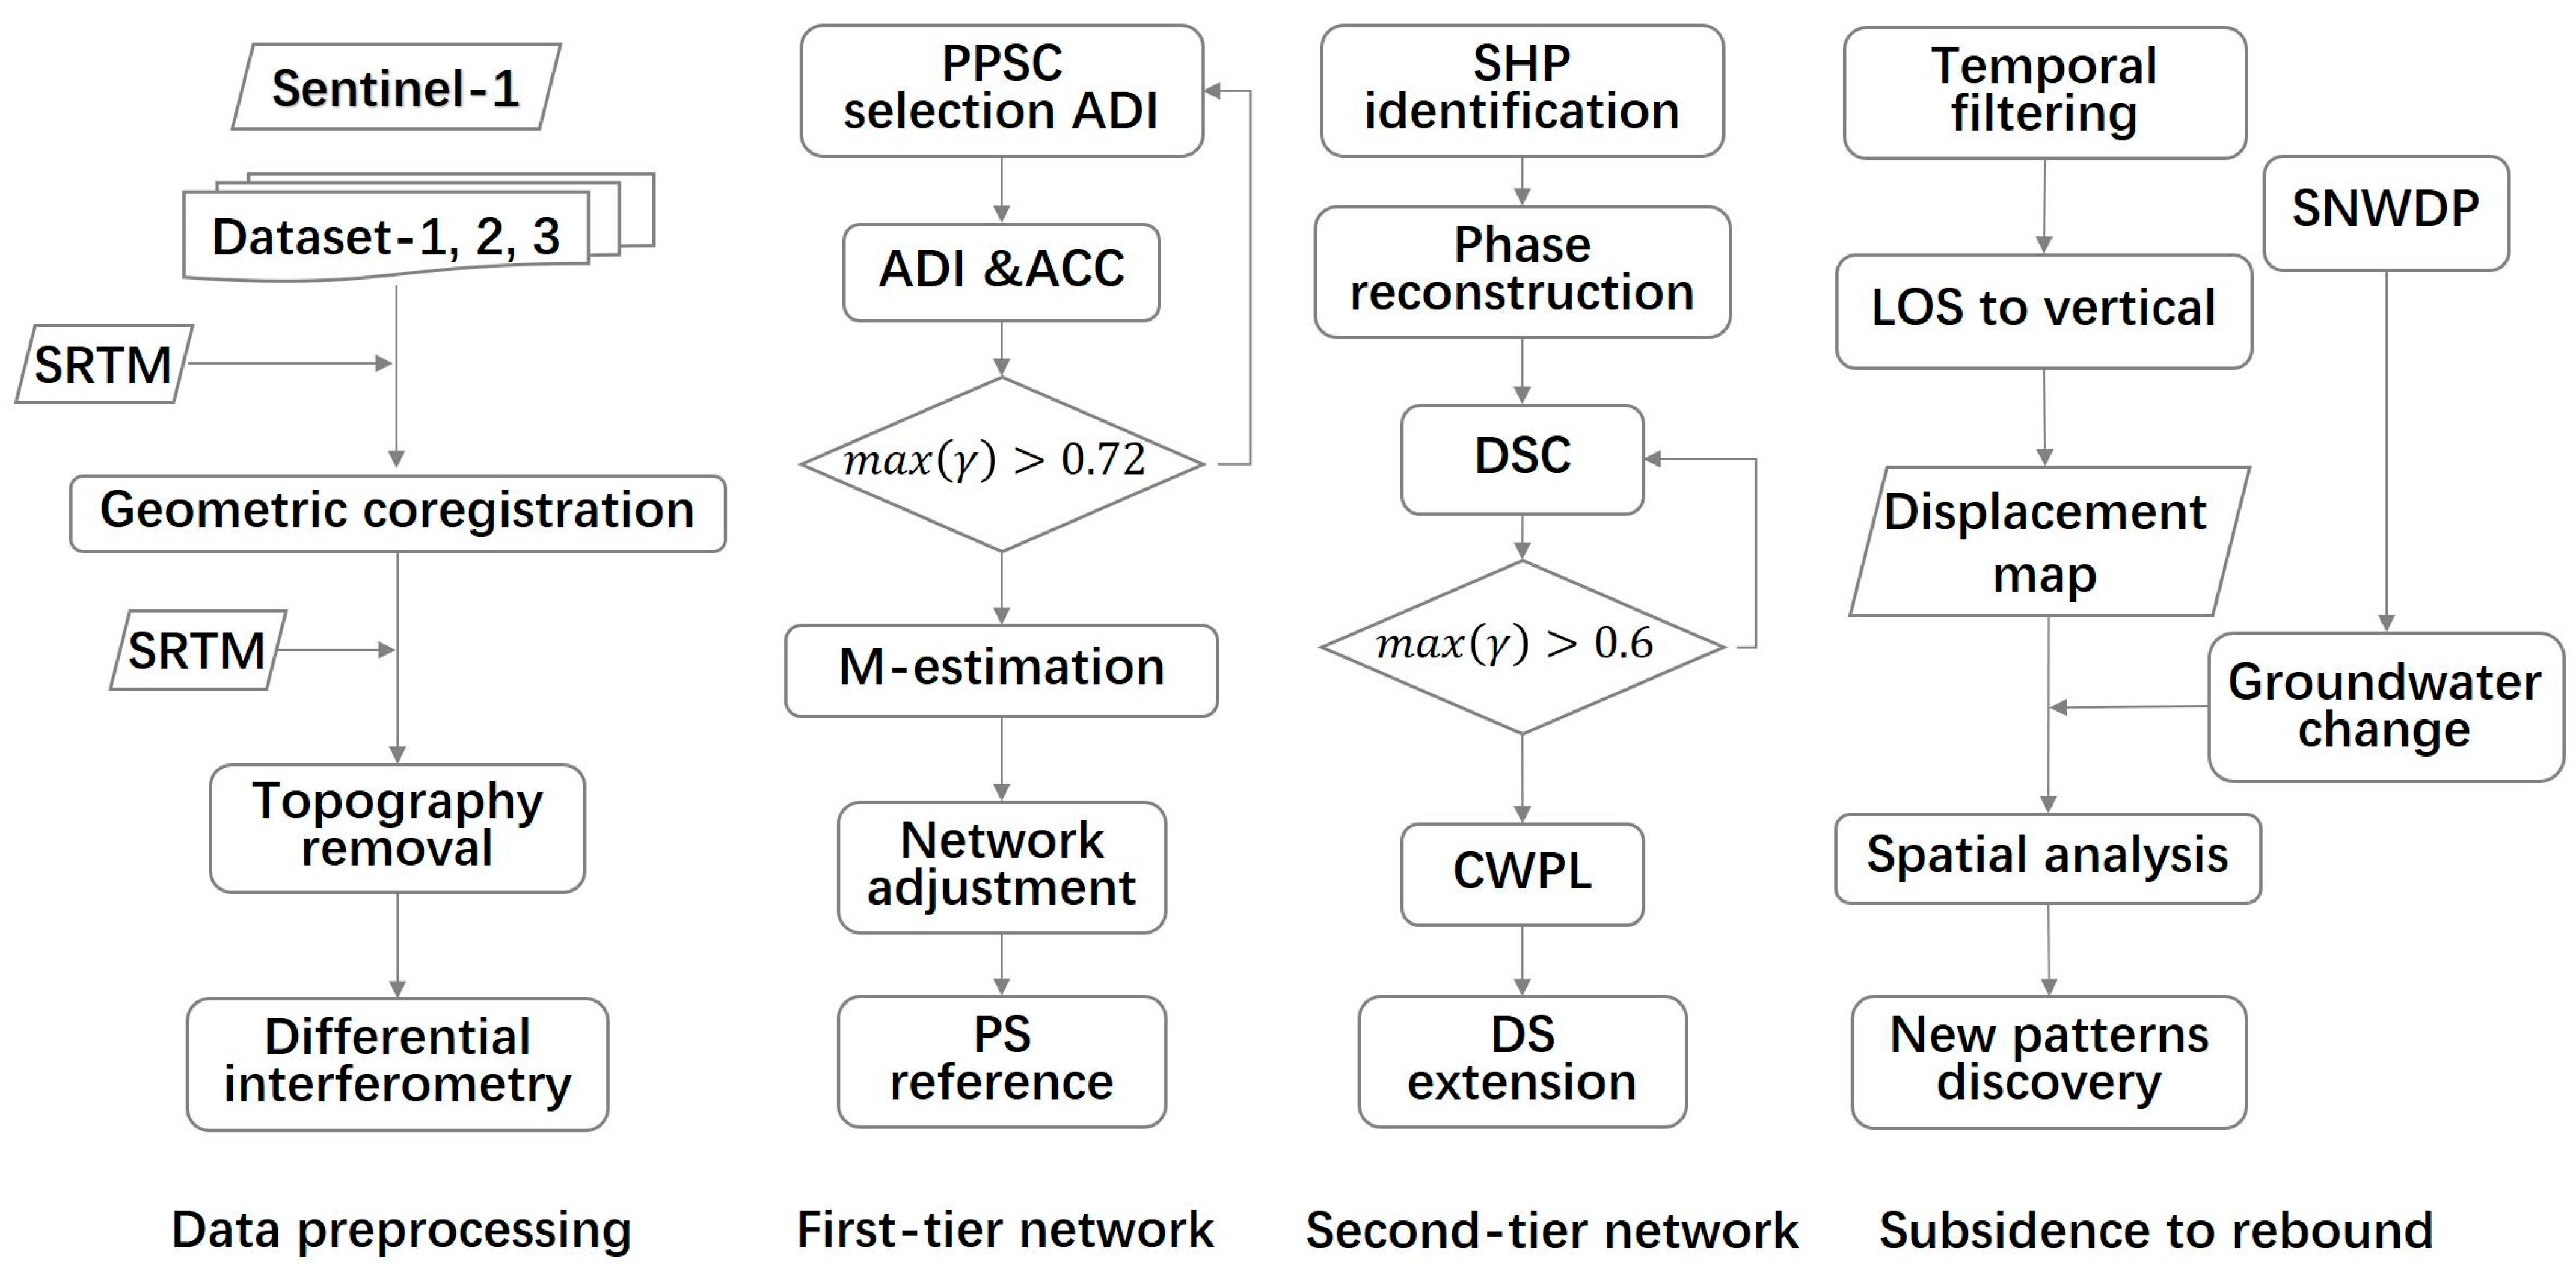
3.1. SAR Data Preprocessing and Interferogram Generation
3.2. Data Processing Flowchart of Joint Detection of PS and DS
4. Results and Discussion
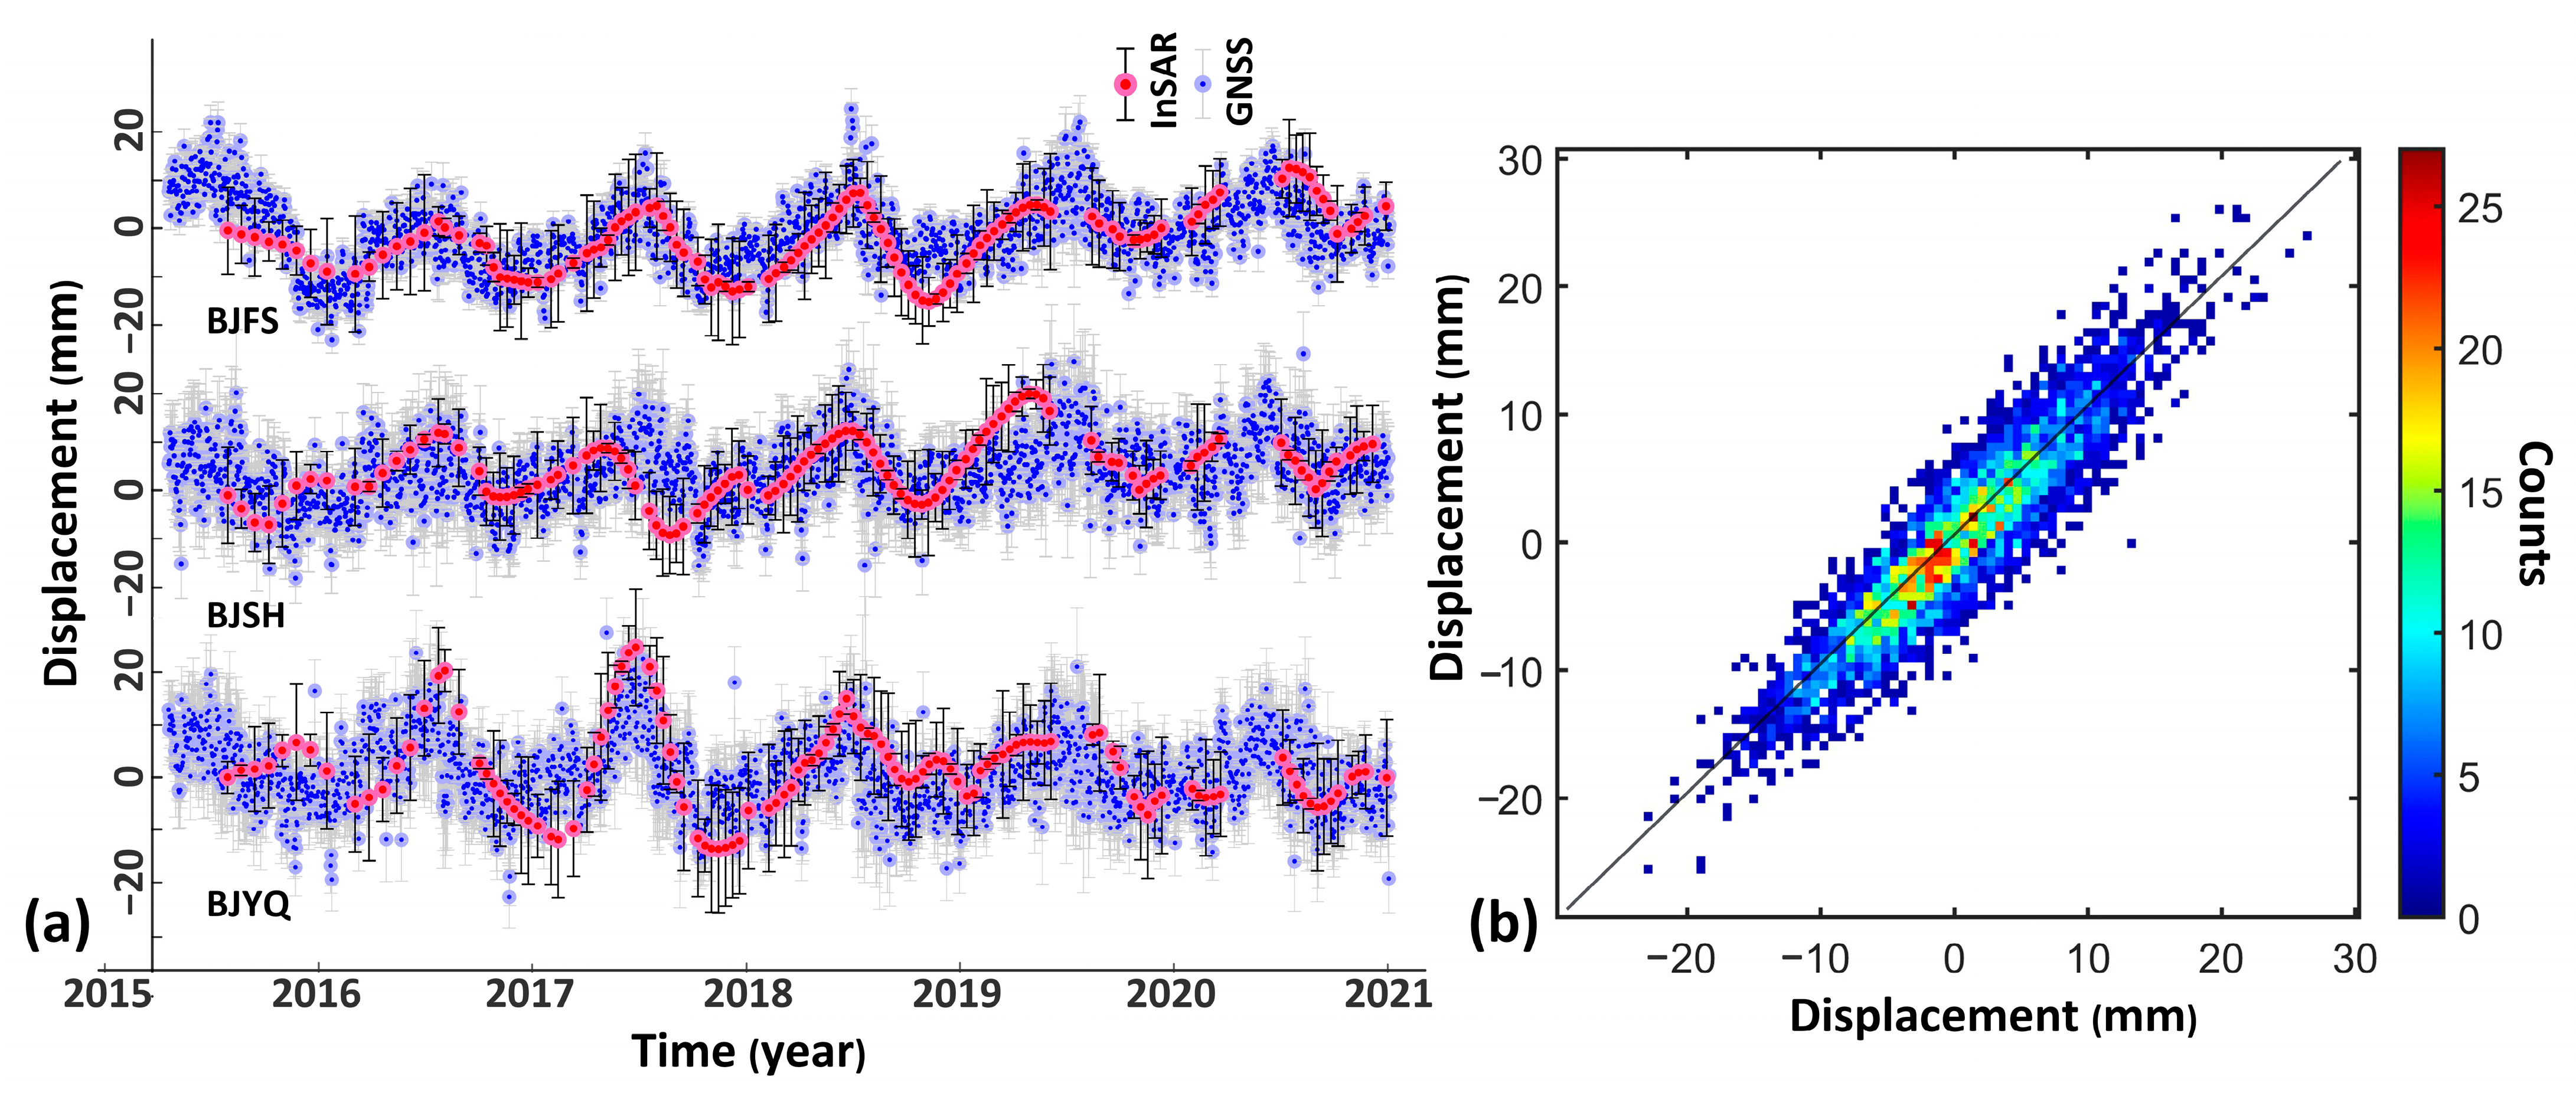
4.1. InSAR-Derived Deformation Results and Validation
4.2. Comparison between Improved PS-DS to Conventional PSI Methods
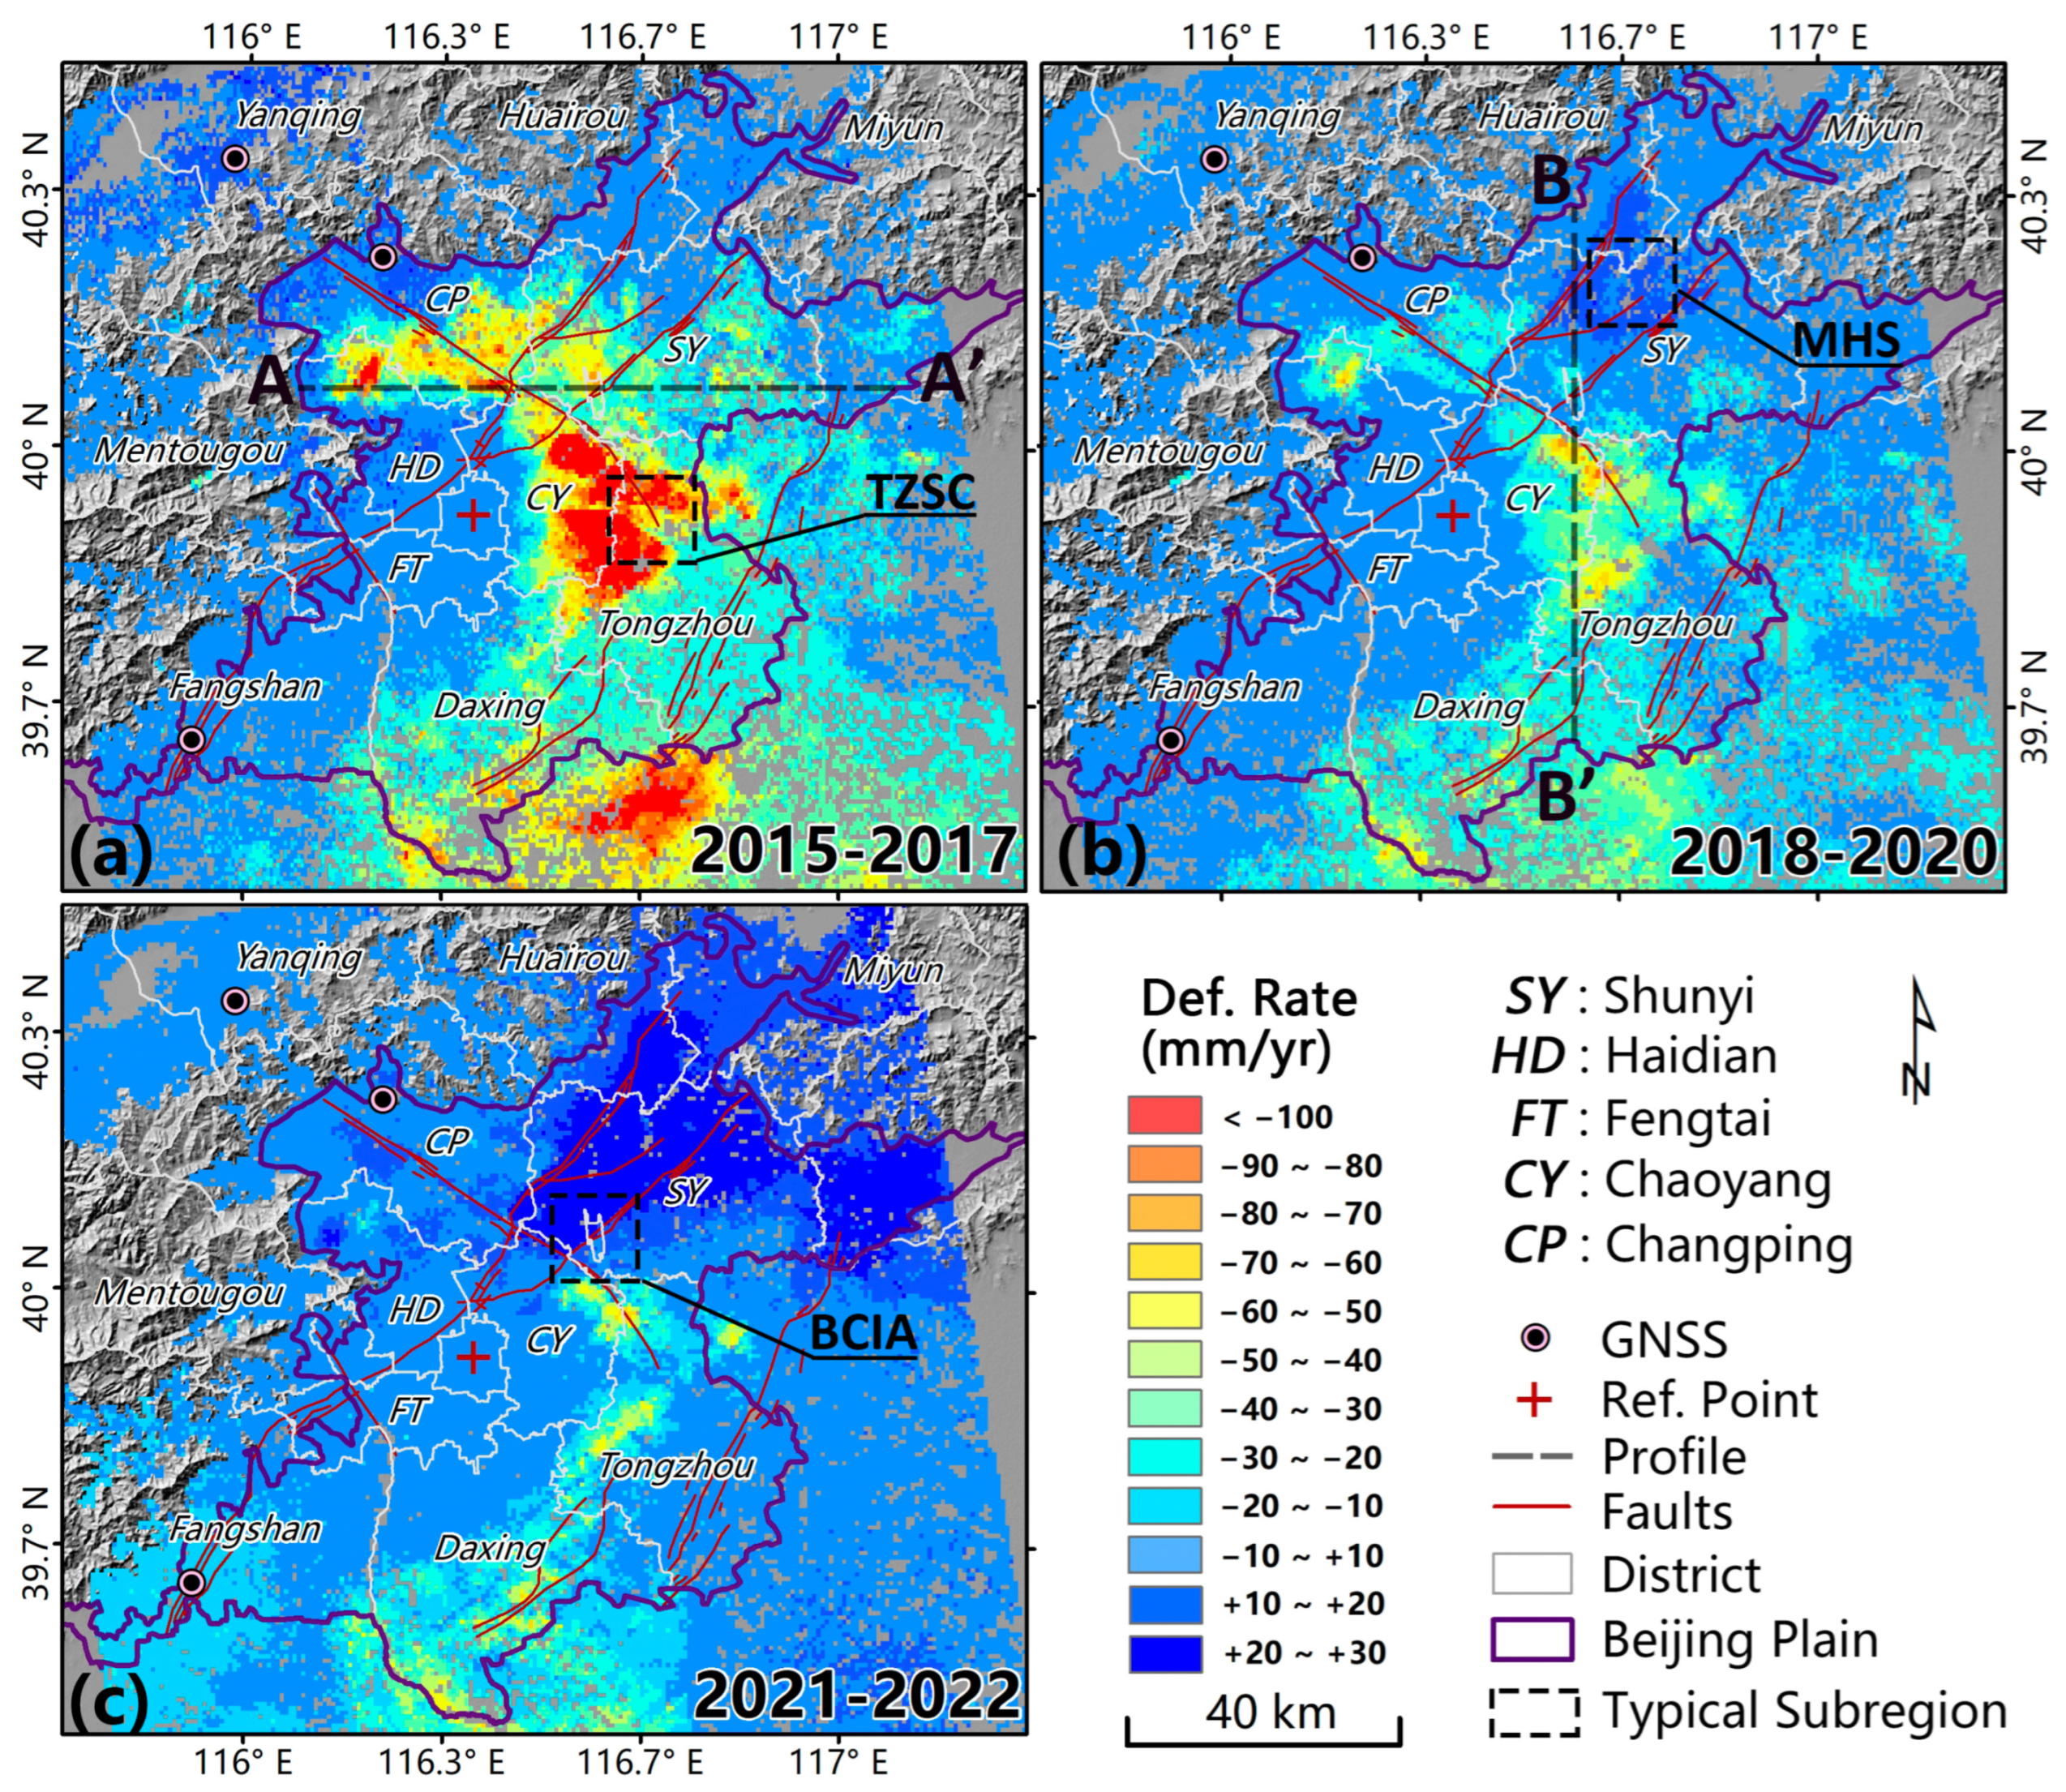
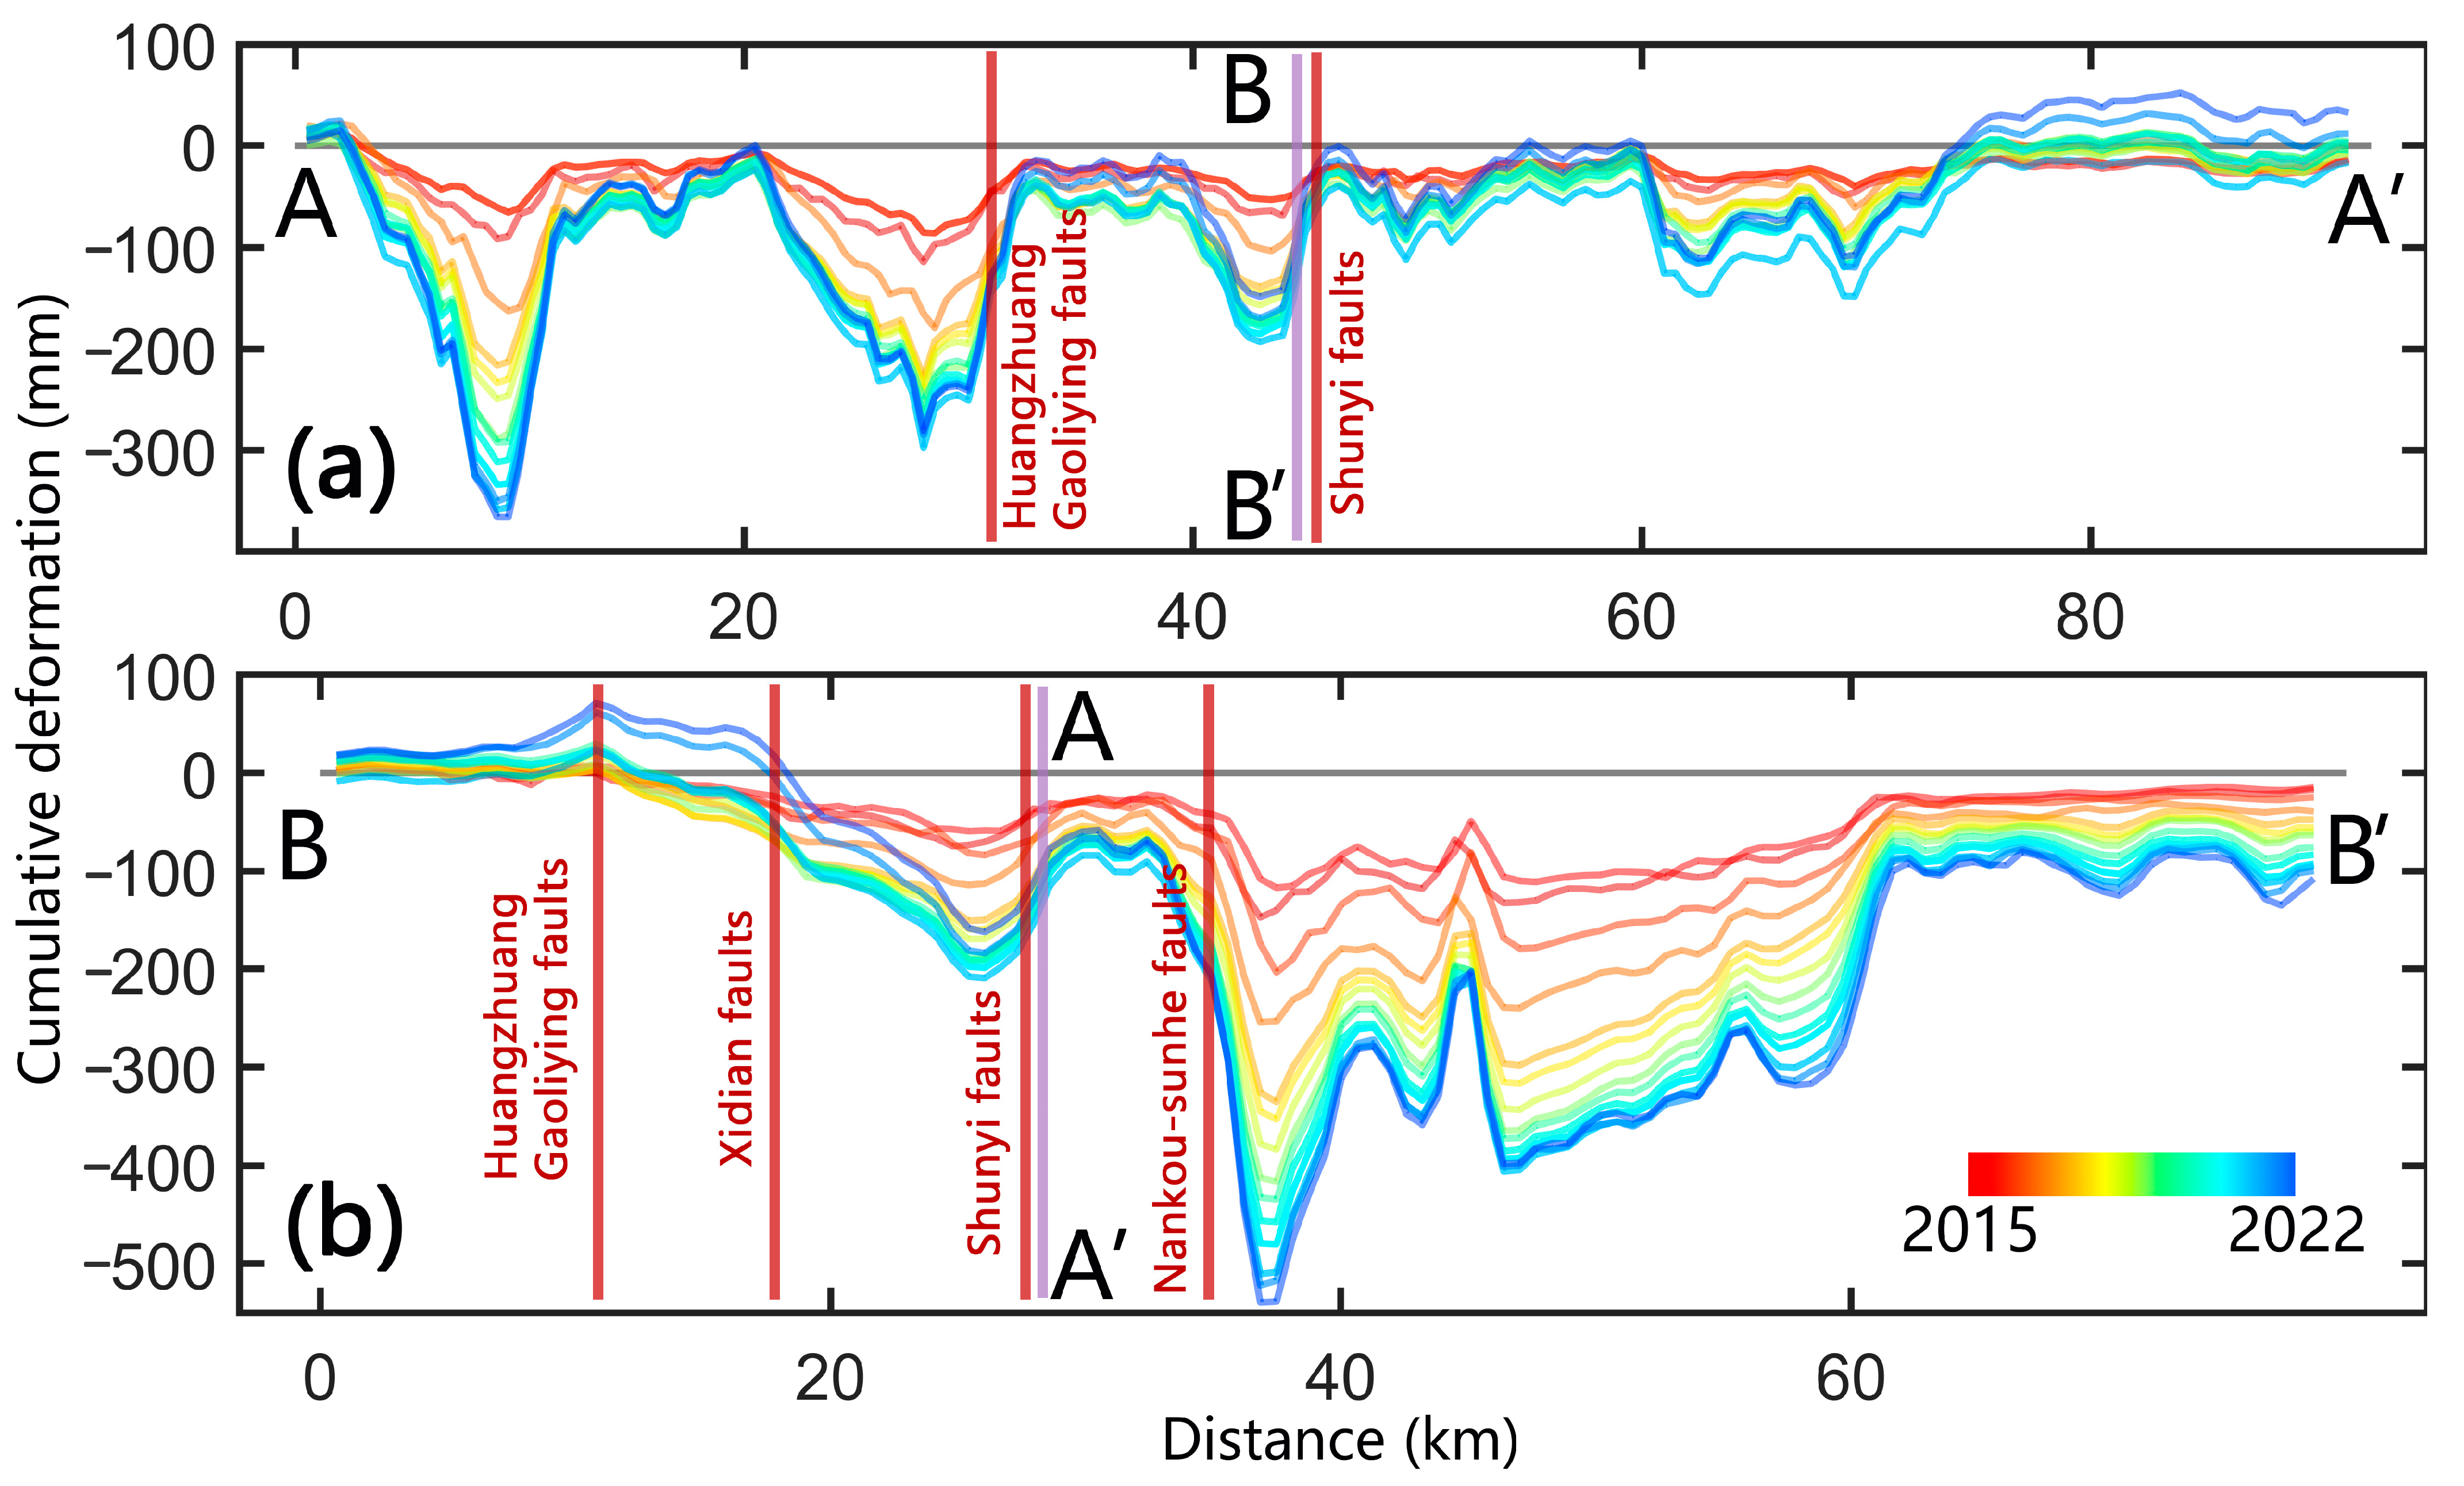
4.3. Annual Deformation Trends in the Beijing Plain
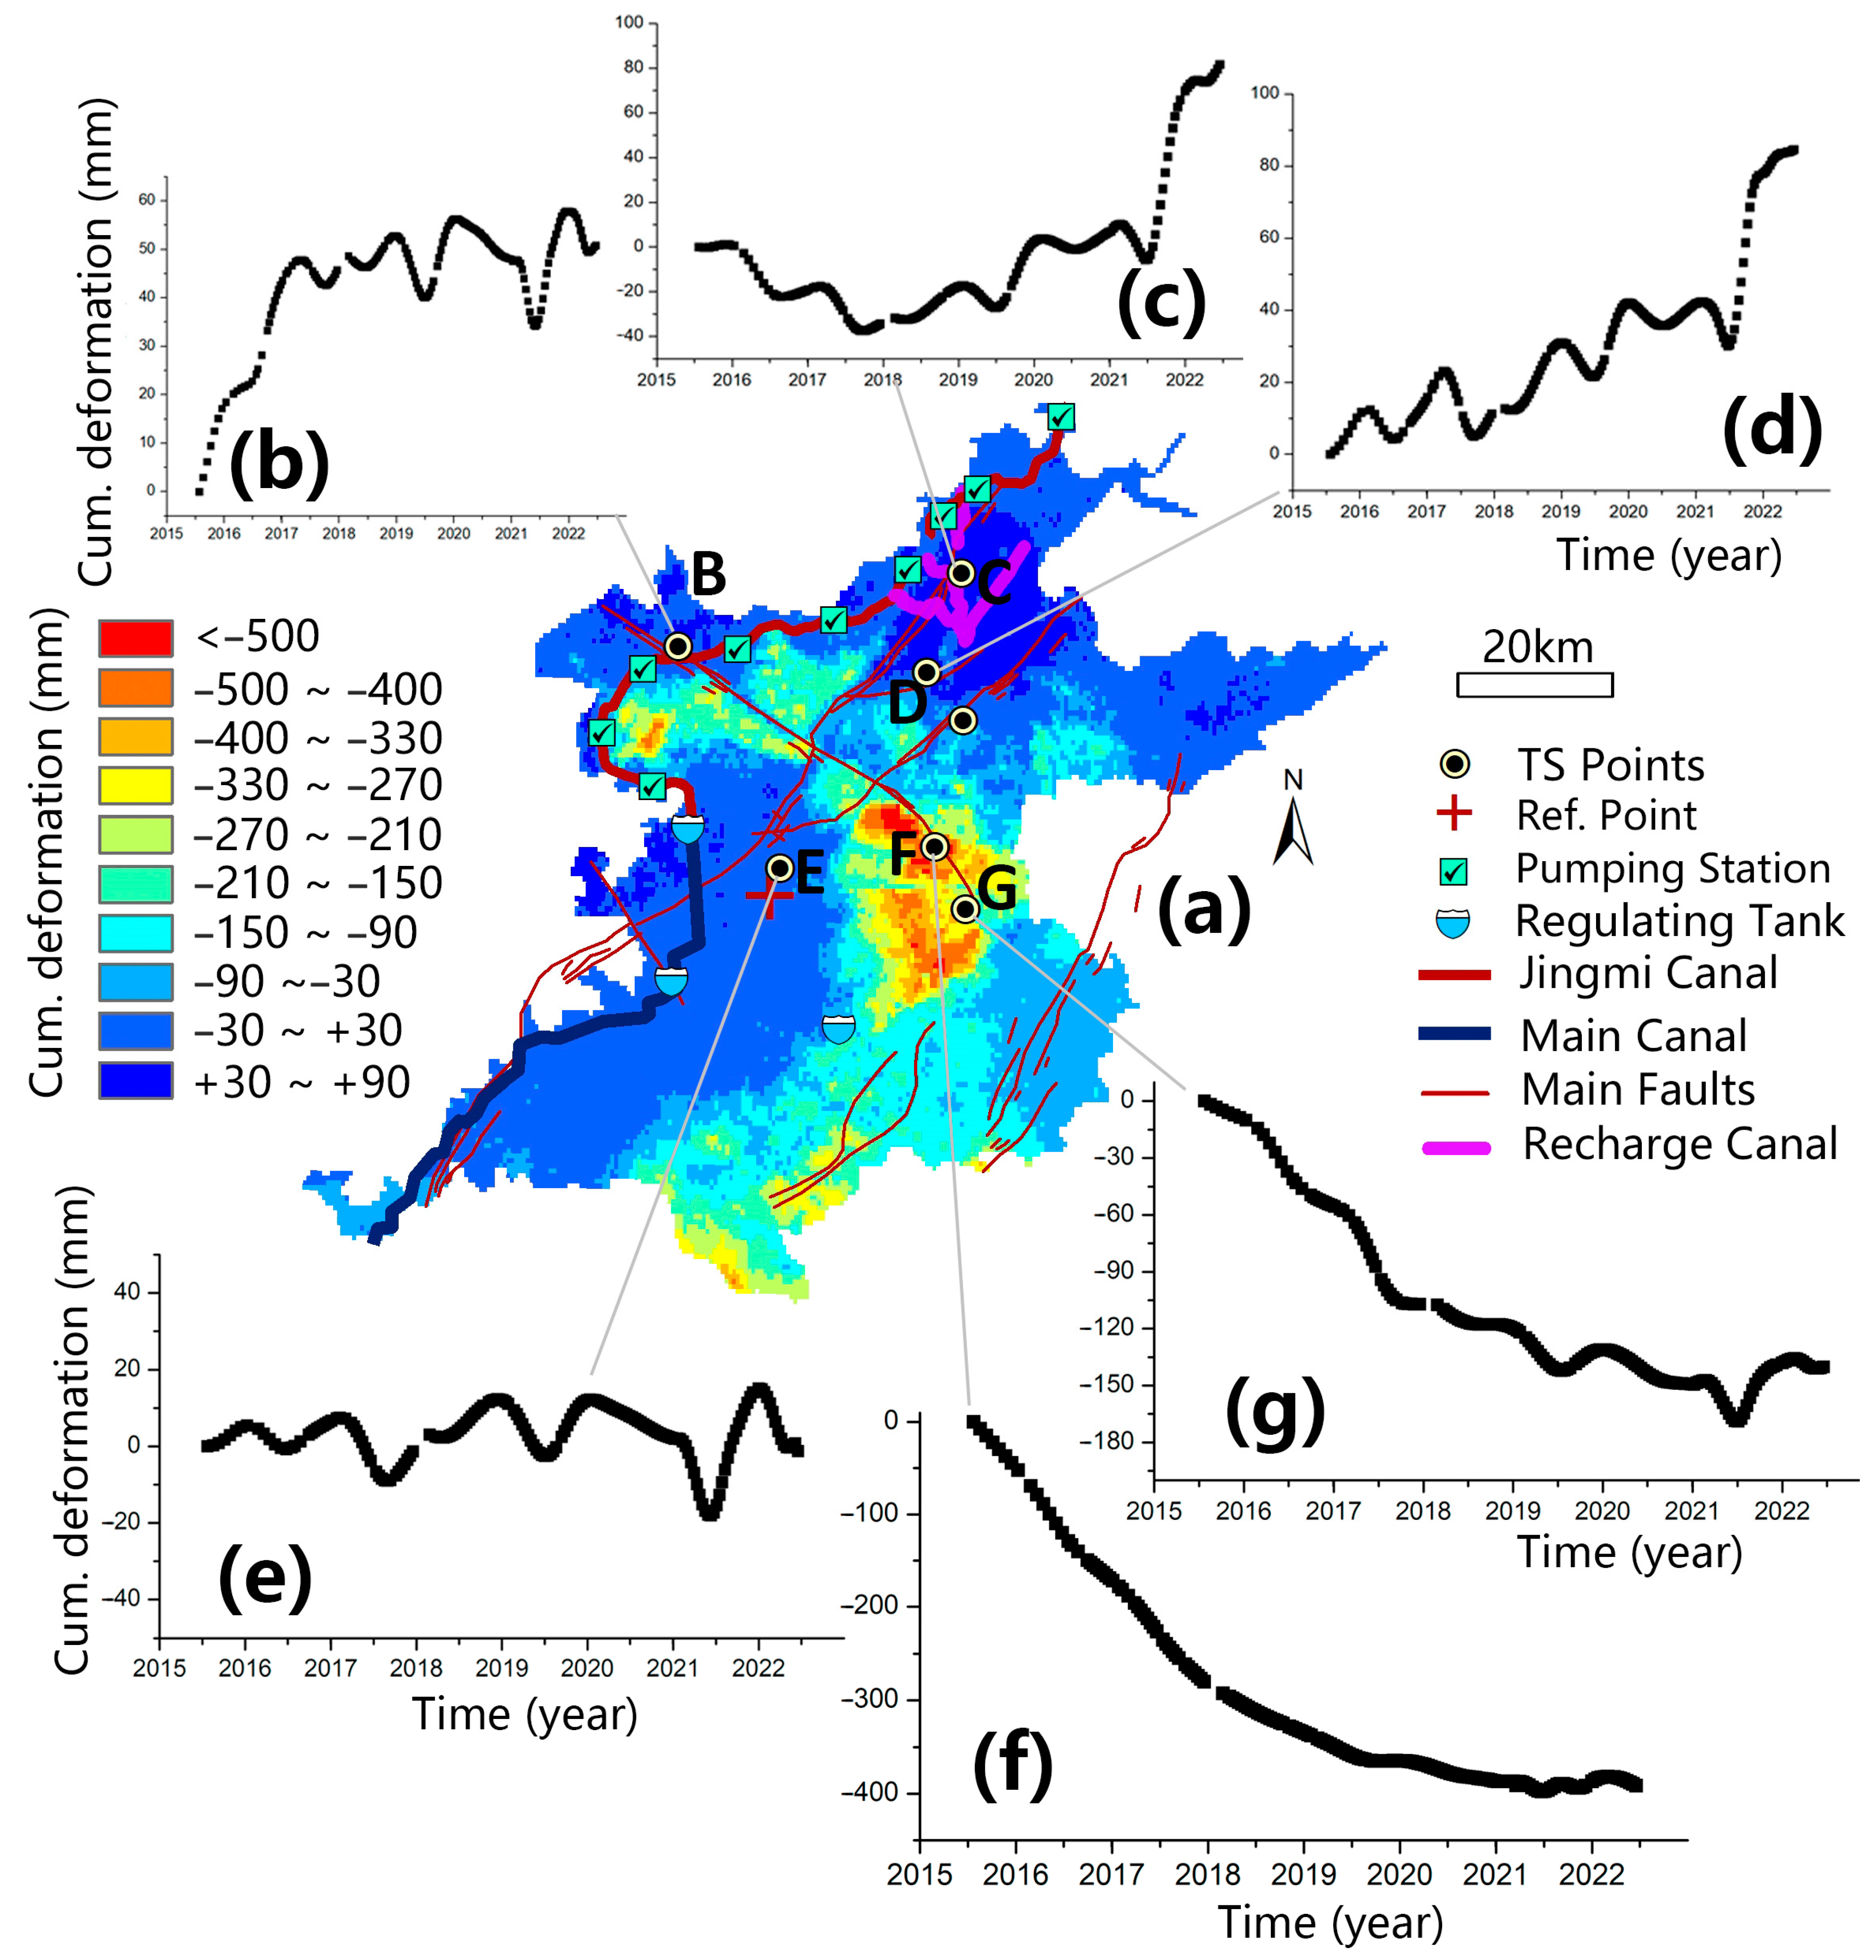
4.4. Different Time-Series Patterns in Typical Regions
4.5. The Relationship between Surface Deformation and Groundwater Change
5. Conclusions
Author Contributions
Funding
Data Availability Statement
Acknowledgments
Conflicts of Interest
References
- Herrera-García, G.; Ezquerro, P.; Tomás, R.; Béjar-Pizarro, M.; López-Vinielles, J.; Rossi, M.; Mateos, R.M.; Carreón-Freyre, D.; Lambert, J.; Teatini, P.; et al. Mapping the global threat of land subsidence. Science 2021, 371, 34–36. [Google Scholar] [CrossRef] [PubMed]
- Bagheri-Gavkosh, M.; Hosseini, S.M.; Ataie-Ashtiani, B.; Sohani, Y.; Ebrahimian, H.; Morovat, F.; Ashrafi, S. Land subsidence: A global challenge. Sci. Total Environ. 2021, 778, 146193. [Google Scholar] [CrossRef]
- Galloway, D.L.; Jones, D.R.; Ingebritsen, S.E. Land Subsidence in the United States; US Geological Survey: Reston, VA, USA, 1999; Volume 1182.
- Shirzaei, M.; Freymueller, J.; Törnqvist, T.E.; Galloway, D.L.; Dura, T.; Minderhoud, P.S.J. Measuring, modelling and projecting coastal land subsidence. Nat. Rev. Earth Environ. 2020, 2, 40–58. [Google Scholar] [CrossRef]
- Sato, C.; Haga, M.; Nishino, J. Land subsidence and groundwater management in Tokyo. Int. Rev. Environ. Strateg. 2006, 6, 403–424. [Google Scholar]
- Aimaiti, Y.; Yamazaki, F.; Liu, W. Multi-sensor InSAR analysis of progressive land subsidence over the Coastal City of Urayasu, Japan. Remote Sens. 2018, 10, 1304. [Google Scholar] [CrossRef]
- Malik, K.; Kumar, D.; Perissin, D. Assessment of subsidence in Delhi NCR due to groundwater depletion using TerraSAR-X and persistent scatterers interferometry. Imaging Sci. J. 2018, 67, 1–7. [Google Scholar] [CrossRef]
- Agarwal, V.; Kumar, A.; Gee, D.; Grebby, S.; Gomes, R.L.; Marsh, S. Comparative Study of Groundwater-Induced Subsidence for London and Delhi Using PSInSAR. Remote Sens. 2021, 13, 4741. [Google Scholar] [CrossRef]
- Malik, K.; Kumar, D.; Perissin, D.; Pradhan, B. Estimation of ground subsidence of New Delhi, India using PS-InSAR technique and Multi-sensor Radar data. Adv. Space Res. 2022, 69, 1863–1882. [Google Scholar] [CrossRef]
- Mendonça, B.; Sandwell, D. Satellite Interferometric Investigations of Subsidence Events Associated with Groundwater Extraction in Sao Paulo, Brazil. Int. J. Geol. Environ. Eng. 2016, 10, 127–133. [Google Scholar]
- Chaussard, E.; Wdowinski, S.; Cabral-Cano, E.; Amelung, F. Land subsidence in central Mexico detected by ALOS InSAR time-series. Remote Sens. Environ. 2014, 140, 94–106. [Google Scholar] [CrossRef]
- Cigna, F.; Tapete, D. Urban growth and land subsidence: Multi-decadal investigation using human settlement data and satellite InSAR in Morelia, Mexico. Sci. Total Environ. 2022, 811, 152211. [Google Scholar] [CrossRef] [PubMed]
- Saleh, M.; Becker, M. New estimation of Nile Delta subsidence rates from InSAR and GPS analysis. Environ. Earth Sci. 2018, 78, 6. [Google Scholar] [CrossRef]
- Rateb, A.; Abotalib, A.Z. Inferencing the land subsidence in the Nile Delta using Sentinel-1 satellites and GPS between 2015 and 2019. Sci. Total Environ. 2020, 729, 138868. [Google Scholar] [CrossRef] [PubMed]
- Higgins, S.A.; Overeem, I.; Steckler, M.S.; Syvitski, J.P.M.; Seeber, L.; Akhter, S.H. InSAR measurements of compaction and subsidence in the Ganges-Brahmaputra Delta, Bangladesh. J. Geophys. Res. Earth Surf. 2014, 119, 1768–1781. [Google Scholar] [CrossRef]
- Enamul Haque, D.M.; Hayat, T.; Tasnim, S. Time Series Analysis of Subsidence in Dhaka City, Bangladesh Using Insar. Malays. J. Geosci. 2019, 3, 32–44. [Google Scholar] [CrossRef]
- Chen, M.; Tomás, R.; Li, Z.; Motagh, M.; Li, T.; Hu, L.; Gong, H.; Li, X.; Yu, J.; Gong, X. Imaging Land Subsidence Induced by Groundwater Extraction in Beijing (China) Using Satellite Radar Interferometry. Remote Sens. 2016, 8, 468. [Google Scholar] [CrossRef]
- McKirdy, E. That Sinking Feeling: Beijing Dropping by up to 4 Inches a Year, Study Shows. Available online: https://edition.cnn.com/2016/06/26/asia/beijing-sinking-study/index.html (accessed on 23 April 2024).
- Ji, Y. A preliminary discussion of the genesis of land subsidence in the city preper and outskirts of Beijing. Geol. Beijing 1996, 15–19. (In Chinese) [Google Scholar]
- Lei, K.; Ma, F.; Chen, B.; Luo, Y.; Cui, W.; Zhou, Y.; Tian, F.; Sha, T. Characteristics of land-subsidence evolution and soil deformation before and after the Water Diversion Project in Beijing, China. Hydrogeol. J. 2022, 30, 1111–1134. [Google Scholar] [CrossRef]
- Zhou, C.; Gong, H.; Zhang, Y.; Warner, T.A.; Wang, C. Spatiotemporal Evolution of Land Subsidence in the Beijing Plain 2003–2015 Using Persistent Scatterer Interferometry (PSI) with Multi-Source SAR Data. Remote Sens. 2018, 10, 552. [Google Scholar] [CrossRef]
- Zhang, Y.; Wu, H.A.; Kang, Y.; Zhu, C. Ground Subsidence in the Beijing-Tianjin-Hebei Region from 1992 to 2014 Revealed by Multiple SAR Stacks. Remote Sens. 2016, 8, 675. [Google Scholar] [CrossRef]
- Huang, H.; Jiang, S.; Gao, X.; Zhao, Y.; Lin, L.; Wang, J.; Han, X. The Temporal Evolution of Physical Water Consumption and Virtual Water Flow in Beijing, China. Sustainability 2022, 14, 9596. [Google Scholar] [CrossRef]
- News, B.J. Seven Years Rise 9.71 Meters, Beijing Groundwater Increase behind. Available online: https://baijiahao.baidu.com/s?id=1751522688018893553&wfr=spider&for=pc (accessed on 23 April 2024).
- Lade, P.; De Boer, R. The concept of effective stress for soil, concrete and rock. Geotechnique 1997, 47, 61–78. [Google Scholar] [CrossRef]
- Lu, D.; Li, X.; Du, X.; Lin, Q.; Gong, Q. Numerical simulation and analysis on the mechanical responses of the urban existing subway tunnel during the rising groundwater. Tunn. Undergr. Space Technol. 2020, 98, 103297. [Google Scholar] [CrossRef]
- Wu, H.; Zhang, Y.; Kang, Y.; Wei, J.; Lu, Z.; Yan, W.; Wang, H.; Liu, Z.; Lv, X.; Zhou, M.; et al. SAR interferometry on full scatterers: Mapping ground deformation with ultra-high density from space. Remote Sens. Environ. 2024, 302, 113965. [Google Scholar] [CrossRef]
- Chen, B.; Gong, H.; Li, X.; Lei, K.; Zhang, Y.; Li, J.; Gu, Z.; Dang, Y. Spatial-temporal characteristics of land subsidence corresponding to dynamic groundwater funnel in Beijing Municipality, China. Chin. Geogr. Sci. 2011, 21, 753–764. [Google Scholar] [CrossRef]
- Gao, M.L.; Gong, H.L.; Chen, B.B.; Zhou, C.F.; Liu, K.S.; Shi, M. Mapping and characterization of land subsidence in Beijing Plain caused by groundwater pumping using the Small Baseline Subset (SBAS) InSAR technique. Proc. Int. Assoc. Hydrol. Sci. 2015, 372, 347–349. [Google Scholar] [CrossRef]
- Ge, D.; Zhang, L.; Li, M.; Liu, B.; Wang, Y. Beijing subway tunnelings and high-speed railway subsidence monitoring with PSInSAR and TerraSAR-X data. In Proceedings of the 2016 IEEE International Geoscience and Remote Sensing Symposium (IGARSS), Beijing, China, 10–15 July 2016; pp. 6883–6886. [Google Scholar]
- Du, Z.; Ge, L.; Ng, A.H.-M.; Xiaojing, L.; Li, L. Mapping land subsidence over the eastern Beijing city using satellite radar interferometry. Int. J. Digit. Earth 2017, 11, 504–519. [Google Scholar] [CrossRef]
- Hu, L.; Dai, K.; Xing, C.; Li, Z.; Tomás, R.; Clark, B.; Shi, X.; Chen, M.; Zhang, R.; Qiu, Q.; et al. Land subsidence in Beijing and its relationship with geological faults revealed by Sentinel-1 InSAR observations. Int. J. Appl. Earth Obs. Geoinf. 2019, 82, 101886. [Google Scholar] [CrossRef]
- Zhou, C.; Lan, H.; Gong, H.; Zhang, Y.; Warner, T.A.; Clague, J.J.; Wu, Y. Reduced rate of land subsidence since 2016 in Beijing, China: Evidence from Tomo-PSInSAR using RadarSAT-2 and Sentinel-1 datasets. Int. J. Remote Sens. 2019, 41, 1259–1285. [Google Scholar] [CrossRef]
- Lyu, M.; Ke, Y.; Guo, L.; Li, X.; Zhu, L.; Gong, H.; Constantinos, C. Change in regional land subsidence in Beijing after south-to-north water diversion project observed using satellite radar interferometry. GISci. Remote Sens. 2019, 57, 140–156. [Google Scholar] [CrossRef]
- Chen, B.; Gong, H.; Chen, Y.; Li, X.; Zhou, C.; Lei, K.; Zhu, L.; Duan, L.; Zhao, X. Land subsidence and its relation with groundwater aquifers in Beijing Plain of China. Sci. Total Environ. 2020, 735, 139111. [Google Scholar] [CrossRef]
- Du, Z.; Ge, L.; Ng, A.H.-M.; Lian, X.; Zhu, Q.; Horgan, F.G.; Zhang, Q. Analysis of the impact of the South-to-North water diversion project on water balance and land subsidence in Beijing, China between 2007 and 2020. J. Hydrol. 2021, 603, 126990. [Google Scholar] [CrossRef]
- Bai, Z.; Wang, Y.; Balz, T. Beijing Land Subsidence Revealed Using PS-InSAR with Long Time Series TerraSAR-X SAR Data. Remote Sens. 2022, 14, 2529. [Google Scholar] [CrossRef]
- Zhang, S.; Zhang, Y.; Yu, J.; Fan, Q.; Si, J.; Zhu, W.; Song, M. Interpretation of the Spatiotemporal Evolution Characteristics of Land Deformation in Beijing during 2003–2020 Using Sentinel, ENVISAT, and Landsat Data. Remote Sens. 2022, 14, 2242. [Google Scholar] [CrossRef]
- Zheng, Y.; Peng, J.; Chen, X.; Huang, C.; Chen, P.; Li, S.; Su, Y. Spatial and Temporal Evolution of Ground Subsidence in the Beijing Plain Area Using Long Time Series Interferometry. IEEE J. Sel. Top. Appl. Earth Obs. Remote Sens. 2023, 16, 153–165. [Google Scholar] [CrossRef]
- Yague-Martinez, N.; Zan, F.D.; Prats-Iraola, P. Coregistration of Interferometric Stacks of Sentinel-1 TOPS Data. IEEE Geosci. Remote Sens. Lett. 2017, 14, 1002–1006. [Google Scholar] [CrossRef]
- Sandwell, D.; Mellors, R.; Tong, X.; Wei, M.; Wessel, P. GMTSAR: An InSAR Processing System Based on Generic Mapping Tools; UC San Diego: La Jolla, CA, USA, 2011. [Google Scholar]
- Huber, P.J. Robust Estimation of a Location Parameter. In Breakthroughs in Statistics: Methodology and Distribution; Kotz, S., Johnson, N.L., Eds.; Springer: New York, NY, USA, 1992; pp. 492–518. [Google Scholar]
- Parizzi, A.; Brcic, R. Adaptive InSAR stack multilooking exploiting amplitude statistics: A comparison between different techniques and practical results. IEEE Geosci. Remote Sens. Lett. 2010, 8, 441–445. [Google Scholar] [CrossRef]
- Zhou, C.; Lan, H.; Bürgmann, R.; Warner, T.A.; Clague, J.J.; Li, L.; Wu, Y.; Zhao, X.; Zhang, Y.; Yao, J. Application of an improved multi-temporal InSAR method and forward geophysical model to document subsidence and rebound of the Chinese Loess Plateau following land reclamation in the Yan’an New District. Remote Sens. Environ. 2022, 279, 113102. [Google Scholar] [CrossRef]
- Hanssen, R.F. Radar Interferometry: Data Interpretation and Error Analysis; Springer Science & Business Media: Berlin, Germany, 2001; Volume 2. [Google Scholar]
- Zheng, Y.; Peng, J.; Li, C.; Chen, X.; Peng, Y.; Ma, X.; Huang, M. Long-Term SAR Data Analysis for Subsidence Monitoring and Correlation Study at Beijing Capital Airport. Remote Sens. 2024, 16, 445. [Google Scholar] [CrossRef]
- Zhu, L.; Gong, H.; Li, X.; Wang, R.; Chen, B.; Dai, Z.; Teatini, P. Land subsidence due to groundwater withdrawal in the northern Beijing plain, China. Eng. Geol. 2015, 193, 243–255. [Google Scholar] [CrossRef]


| Global Megacities | Deformation | Causes |
|---|---|---|
| Tokyo (Japan) [5,6], Shanghai (China) [7,8,9], São Paulo (Brazil) [10], Mexico City (Mexico) [11,12], Cairo (Egypt) [13,14], … | Subsidence | Groundwater overexploitation, urban building loading, natural sediment compaction, tectonic activity |
| Delhi (India) [7,8,9], Dhaka (Bangladesh) [15,16] | Both subsidence and uplift (or rebound) | Groundwater overexploitation, aquifer recharge |
| Data and Methods | Subsidence and Main Reasons | Ref. |
|---|---|---|
| ASAR (2003–2010), PSI. | −41 mm/y (2003–2010); Groundwater overexploitation. | [28] |
| TerraSAR (2012–2013), SBAS. | −97 mm/y (2012–2013); Groundwater pumping. | [29] |
| TerraSAR (2011–2015), PSI. | −163 mm/y (2011–2015); Groundwater pumping. | [30] |
| ASAR (2003–2010) and TerraSAR (2010–2011), PSI. | −110 mm/y (2003–2011); Groundwater level change and geological structure. | [17] |
| ASAR (2003–2010), RADARSAT (2011–2015) | −110 mm/y (2003–2011), −148 mm/y (2011–2015), Groundwater pumping, faults. | [21] |
| ALOS (2007–2011), Sentinel-1 (2015–2016), ALOS-2 (2014–2017), PSI. | −120 mm/y (2007–2011); −125 mm/y (2014–2017), Groundwater usage. | [31] |
| Sentinel-1 (2015–2017), SBAS. | −140 mm/y (2015–2017), Geological faults. | [32] |
| RADARSAT (2012–2015), Sentinel-1 (2016–2018), Tomo-PSInSAR | −176 mm/y (2012–2015); −119 mm/y (2016–2018); Groundwater level rise. | [33] |
| ASAR (2004–2010), RADARSAT (2011–2014) and Sentinel-1 (2015–2017), PSI | −108 mm/y (2004–2010); −145 mm/y (2011–2014); −122 mm/y (2015–2017); SNWDP. | [34] |
| RadarSAT-2 (2011–2015), Sentinel-1 (2016–2018), PSI. | −141 mm/y (2011–2015), −135 mm/y (2016–2018), SNWDP. | [35] |
| ALOS (2007–2011), RADARSAT (2011–2014), Sentinel-1 (2014–2020), PSI. | −120 mm/y (2007–2011); −140 mm/y (2011–2014); −80 mm/y (2014–2020); SNWDP and precipitation | [36] |
| TerraSAR (2010–2019), PSI. | −117 mm/y (2010–2019); Reduction exploitation | [37] |
| ASAR (2003–2010), Sentinel-1 (2015–2020), GPS (2009–2020), SBAS. | −128 mm/y (2003–2010); −135 mm/y (2015–2020); Slowing subsidence trend from 2015, Land use type, precipitation, and groundwater change. | [38] |
| ASAR (2003–2010), Cosmo-SkyMed (2013–2015), Sentinel-1 (2015–2020), SBAS | −100 mm/y (2003–2010); −144 mm/y (2013–2015); −152 mm/y (2015–2020); SNWDP | [39] |
| Parameter | Sentinel-1 |
|---|---|
| Band | C |
| Wavelength (cm) | 5.5 |
| Polarization | VV |
| Orbit directions | Ascending |
| Track No. | 142 |
| Incidence angle (degrees) | 39 |
| Spatial resolution (m) | 20 × 5 |
| No. of images | 178 |
| Data Set | Method | Pixel Number | Density (per km2) |
|---|---|---|---|
| 2015–2017 | Conventional PSI | 351,233 | 56.47 |
| Improved PS + DS | 5,215,367 | 838.48 | |
| 2018–2020 | Conventional PSI | 443,904 | 74.04 |
| Improved PS + DS | 5,361,839 | 862.03 | |
| 2021–2022 | Conventional PSI | 460,528 | 71.37 |
| Improved PS + DS | 5,136,442 | 825.79 |
Disclaimer/Publisher’s Note: The statements, opinions and data contained in all publications are solely those of the individual author(s) and contributor(s) and not of MDPI and/or the editor(s). MDPI and/or the editor(s) disclaim responsibility for any injury to people or property resulting from any ideas, methods, instructions or products referred to in the content. |
© 2024 by the authors. Licensee MDPI, Basel, Switzerland. This article is an open access article distributed under the terms and conditions of the Creative Commons Attribution (CC BY) license (https://creativecommons.org/licenses/by/4.0/).
Share and Cite
Zhou, C.; Tang, Q.; Zhao, Y.; Warner, T.A.; Liu, H.; Clague, J.J. Reduction of Subsidence and Large-Scale Rebound in the Beijing Plain after Anthropogenic Water Transfer and Ecological Recharge of Groundwater: Evidence from Long Time-Series Satellites InSAR. Remote Sens. 2024, 16, 1528. https://0-doi-org.brum.beds.ac.uk/10.3390/rs16091528
Zhou C, Tang Q, Zhao Y, Warner TA, Liu H, Clague JJ. Reduction of Subsidence and Large-Scale Rebound in the Beijing Plain after Anthropogenic Water Transfer and Ecological Recharge of Groundwater: Evidence from Long Time-Series Satellites InSAR. Remote Sensing. 2024; 16(9):1528. https://0-doi-org.brum.beds.ac.uk/10.3390/rs16091528
Chicago/Turabian StyleZhou, Chaodong, Qiuhong Tang, Yanhui Zhao, Timothy A. Warner, Hongjiang Liu, and John J. Clague. 2024. "Reduction of Subsidence and Large-Scale Rebound in the Beijing Plain after Anthropogenic Water Transfer and Ecological Recharge of Groundwater: Evidence from Long Time-Series Satellites InSAR" Remote Sensing 16, no. 9: 1528. https://0-doi-org.brum.beds.ac.uk/10.3390/rs16091528