Article

Evaluation of Daily and Hourly Performance of Multi-Source Satellite Precipitation Products in China’s Nine Water Resource Regions

1
Key Laboratory for Geographical Process Analysis & Simulation of Hubei Province, Central China Normal University, Wuhan 430079, China
2
College of Urban and Environmental Sciences, Central China Normal University, Wuhan 430079, China
3
School of Information Engineering, China University of Geosciences in Beijing, Beijing 100083, China
4
Changjiang Water Resources Protection Institute, Changjiang Water Resources Commission, Wuhan 430051, China
*
Author to whom correspondence should be addressed.
Submission received: 9 March 2024 / Revised: 20 April 2024 / Accepted: 21 April 2024 / Published: 25 April 2024
(This article belongs to the Special Issue Applications of Remotely Sensed Data in Hydrology and Climatology II)

Abstract

:
Satellite precipitation products (SPPs) are of great significance for water resource management and utilization in China; however, they suffer from considerable uncertainty. While numerous researchers have evaluated the accuracy of various SPPs, further investigation is needed to assess their performance across China’s nine major water resource regions. This study used the latest precipitation dataset of the China Meteorological Administration’s Land Surface Data Assimilation System (CLDAS-V2.0) as the benchmark and evaluated the performance of six SPPs—GSMaP, PERSIANN, CMORPH, CHIRPS, GPM IMERG, and TRMM—using six indices: correlation coefficient (CC), root mean square error (RMSE), mean absolute error (MAE), probability of detection (POD), false alarm rate (FAR), and critical success index (CSI), at both daily and hourly scales across China’s nine water resource regions. The conclusions of this study are as follows: (1) The performance of the six SPPs was generally weaker in the west than in the east, with the Continental Basin (CB) exhibiting the poorest performance, followed by the Southwest Basin (SB). (2) At the hourly scale, the performance of the six SPPs was weaker compared to the daily scale, particularly in the high-altitude CB and the high-latitude Songhua and Liaohe River Basin (SLRB), where observing light precipitation and snowfall presents significant challenges. (3) GSMaP, CMORPH, and GPM IMERG demonstrated superior overall performance compared to CHIRPS, PERISANN, and TRMM. (4) CMORPH was found to be better suited for application in drought-prone areas, showcasing optimal performance in the CB and SB. GSMaP excelled in humid regions, displaying the best overall performance in the remaining seven basins. GPM IMERG serves as a complementary precipitation data source for the first two.

1. Introduction

Precipitation data serve as an indispensable foundation for flood forecasting, drought prediction, and climate change research [1], while also finding extensive applications in various fields such as agricultural production, water resource management, and ecological environment governance. Presently, the primary methods for acquiring precipitation data involve measurements from ground meteorological stations and observations from meteorological radars. Ground meteorological stations offer direct measurements of rainfall, ensuring the highest level of accuracy. However, they are not without limitations, as precipitation data obtained is point-based rather than surface-based, and thus regional precipitation monitoring accuracy is significantly influenced by station distribution. Despite a global increase in the number of meteorological stations in recent years [2], distribution remains inadequate in remote regions with complex terrain, such as deserts and mountains, and is notably absent over oceanic areas [3]. Meteorological radar, on the other hand, utilizes microwave sensors to acquire high-precision precipitation data within its observation radius. However, it faces two main limitations: firstly, microwave propagation is hindered in complex terrain, leading to varying degrees of data accuracy decline [4]; secondly, the high cost associated with weather radar infrastructure impedes the establishment of comprehensive radar networks in many countries.
In recent years, the continuous advancement of remote sensing technology has led to the development of numerous satellite precipitation products (SPPs), including Global Satellite Mapping of Precipitation (GSMaP) [5], Precipitation Estimation from Remotely Sensed Information using Artificial Neural Networks (PERSIANN) [6], The Climate Prediction Center morphing method (CMORPH) [7], Climate Hazards Group InfraRed Precipitation with Station data (CHIRPS) [8], The Tropical Rainfall Measuring Mission (TRMM) [9], and Integrated Multi-satellite Retrievals for GPM (GPM IMERG) [10]. Satellite remote sensing offers significant advantages for large-scale, long-term, and remote measurements, with SPPs emerging as vital sources of precipitation data. Several studies have already utilized SPPs for hydrological modeling, flood forecasting, and other research endeavors [11,12]. However, the accuracy of SPPs is influenced by various factors, including season, climate, terrain, and time scale. Moreover, different SPPs employ sensors and algorithms with their own sets of advantages and limitations [13,14].
Researchers have conducted accuracy evaluations and comparative analyses of various SPPs. In terms of accuracy evaluation of a single SPP, Paredes-Trejo et al. [15] assessed the accuracy of CHIRPS precipitation data in northeastern Brazil, finding that CHIRPS accuracy was higher in the inland region than the coastal region, being higher in months with heavier rainfall than those with lighter rainfall. Sunilkumar et al. [16] separately evaluated the accuracy of GPM IMERG precipitation data in Japan, Nepal, and the Philippines, showing that in the warm season (June to September) and cold season (January to May, October to December), the CC between GPM IMERG precipitation data and ground-based station data were around 0.6, with low levels of BIAS and RMSE. In other studies, researchers compared the accuracy of various SPPs. For instance, Roy et al. [17] evaluated the precipitation observation accuracy of tropical cyclone “FANI” in Bangladesh in 2019 using four satellite precipitation datasets: TRMM-3B42RT, CMORPH-V1.0, GSMaP, and PERSIANN-CDR. The results indicate that TRMM-3B42RT exhibits the highest correlation, followed by CMORPH-V1.0, while PERSIANN-CDR has the lowest. Hussain et al. [18] discovered in their research in Pakistan that the accuracy of CMORPH-Adj exceeded that of TRMM-Adj and PERSIANN-Adj datasets. Moreover, CMORPH, TRMM, and PERSIANN encountered challenges in distinguishing between snow, glaciers, and rainfall, leading to overestimated rainfall in glacier areas. Furthermore, Anjum et al. [19] found in their research in Saudi Arabia that GPM IMERG V6 demonstrated the highest CC at the monthly scale, while CMORPH exhibited the best performance at this scale.
China has a vast territory, diverse topography, and a complex and variable climate. In recent years, the flood season has shortened, the dry season has prolonged, and extreme weather events have become more frequent [20]. Numerous researchers have evaluated the performance of satellite precipitation data across China. These studies typically exhibit several key characteristics: (1) Research areas are typically based on geographical or climatic divisions [13,21]. However, in applications such as hydrological modeling, flood prevention, and water resources management, the basin is considered as the fundamental unit [11,12,22], emphasizing the importance of basin-based research to advance the application of SPPs. (2) Ground meteorological station data serve as the primary benchmark [21,23,24]. However, the data integrity of ground meteorological stations remains poor, with less than 900 stations providing daily precipitation data publicly available for download, and scarce sources providing hourly precipitation data. (3) Most studies focus on one or two SPPs, with GSMaP and GPM IMERG being the most prevalent choices [20,21]. (4) These studies primarily focus on annual, seasonal, monthly, and daily time scales [25,26,27,28,29], lacking evaluations of hourly precipitation accuracy. However, hourly scale is of significant importance for applications such as flood forecasting.
Furthermore, due to the discrepancy between ground meteorological stations and SPPs being grid-based, previous studies have employed various methods to ensure temporal and spatial consistency: (1) Some studies solely compared precipitation values between ground station locations and the grid cells of SPPs [13,28,30,31,32,33,34], ensuring precise evaluation results but underutilizing satellite precipitation data, particularly in representing SPP accuracy spatially. (2) Others interpolated ground meteorological station precipitation data onto grids [35] and assessed the accuracy of all SPP pixels. While this approach can yield accurate grid-based evaluations, the interpolation process itself introduces uncertainties that may distort ground precipitation data to different extents. (3) Some studies aggregated rainfall data from all stations in the study area [12], resulting in a single index value for the entire region, overlooking spatial variations in the evaluation index.
This study employed the latest CLDAS-V2.0 dataset developed by the China Meteorological Administration (CMA) as a substitute for ground meteorological stations as benchmark data. Despite its slightly lower accuracy than ground meteorological station data, CLDAS offers several advantages: (1) CLDAS integrates data from over 2400 national-level ground stations. According to the CMA report, CLDAS exhibits a higher quality compared to other similar data products, with more accurate spatiotemporal distribution characteristics [36,37]. (2) CLDAS can provide hourly data, whereas currently available ground station data for public download lack hourly data. (3) The data integrity of CLDAS surpasses that of ground meteorological station data. The ground station data currently available for public download contain significant local omissions, which affects the integrity of the data. (4) CLDAS is a fusion data product with a grid data structure, facilitating for the comprehensive utilization of satellite precipitation data. Considering these factors, this study selected six SPPs (GSMaP, PERSIANN, CMORPH, CHIRPS, GPM IMERG, TRMM) and utilized CLDAS as benchmark data to evaluate the data quality of multi-source SPPs across nine water resource regions in China, encompassing both daily and hourly scales.

2. Study Area and Dataset
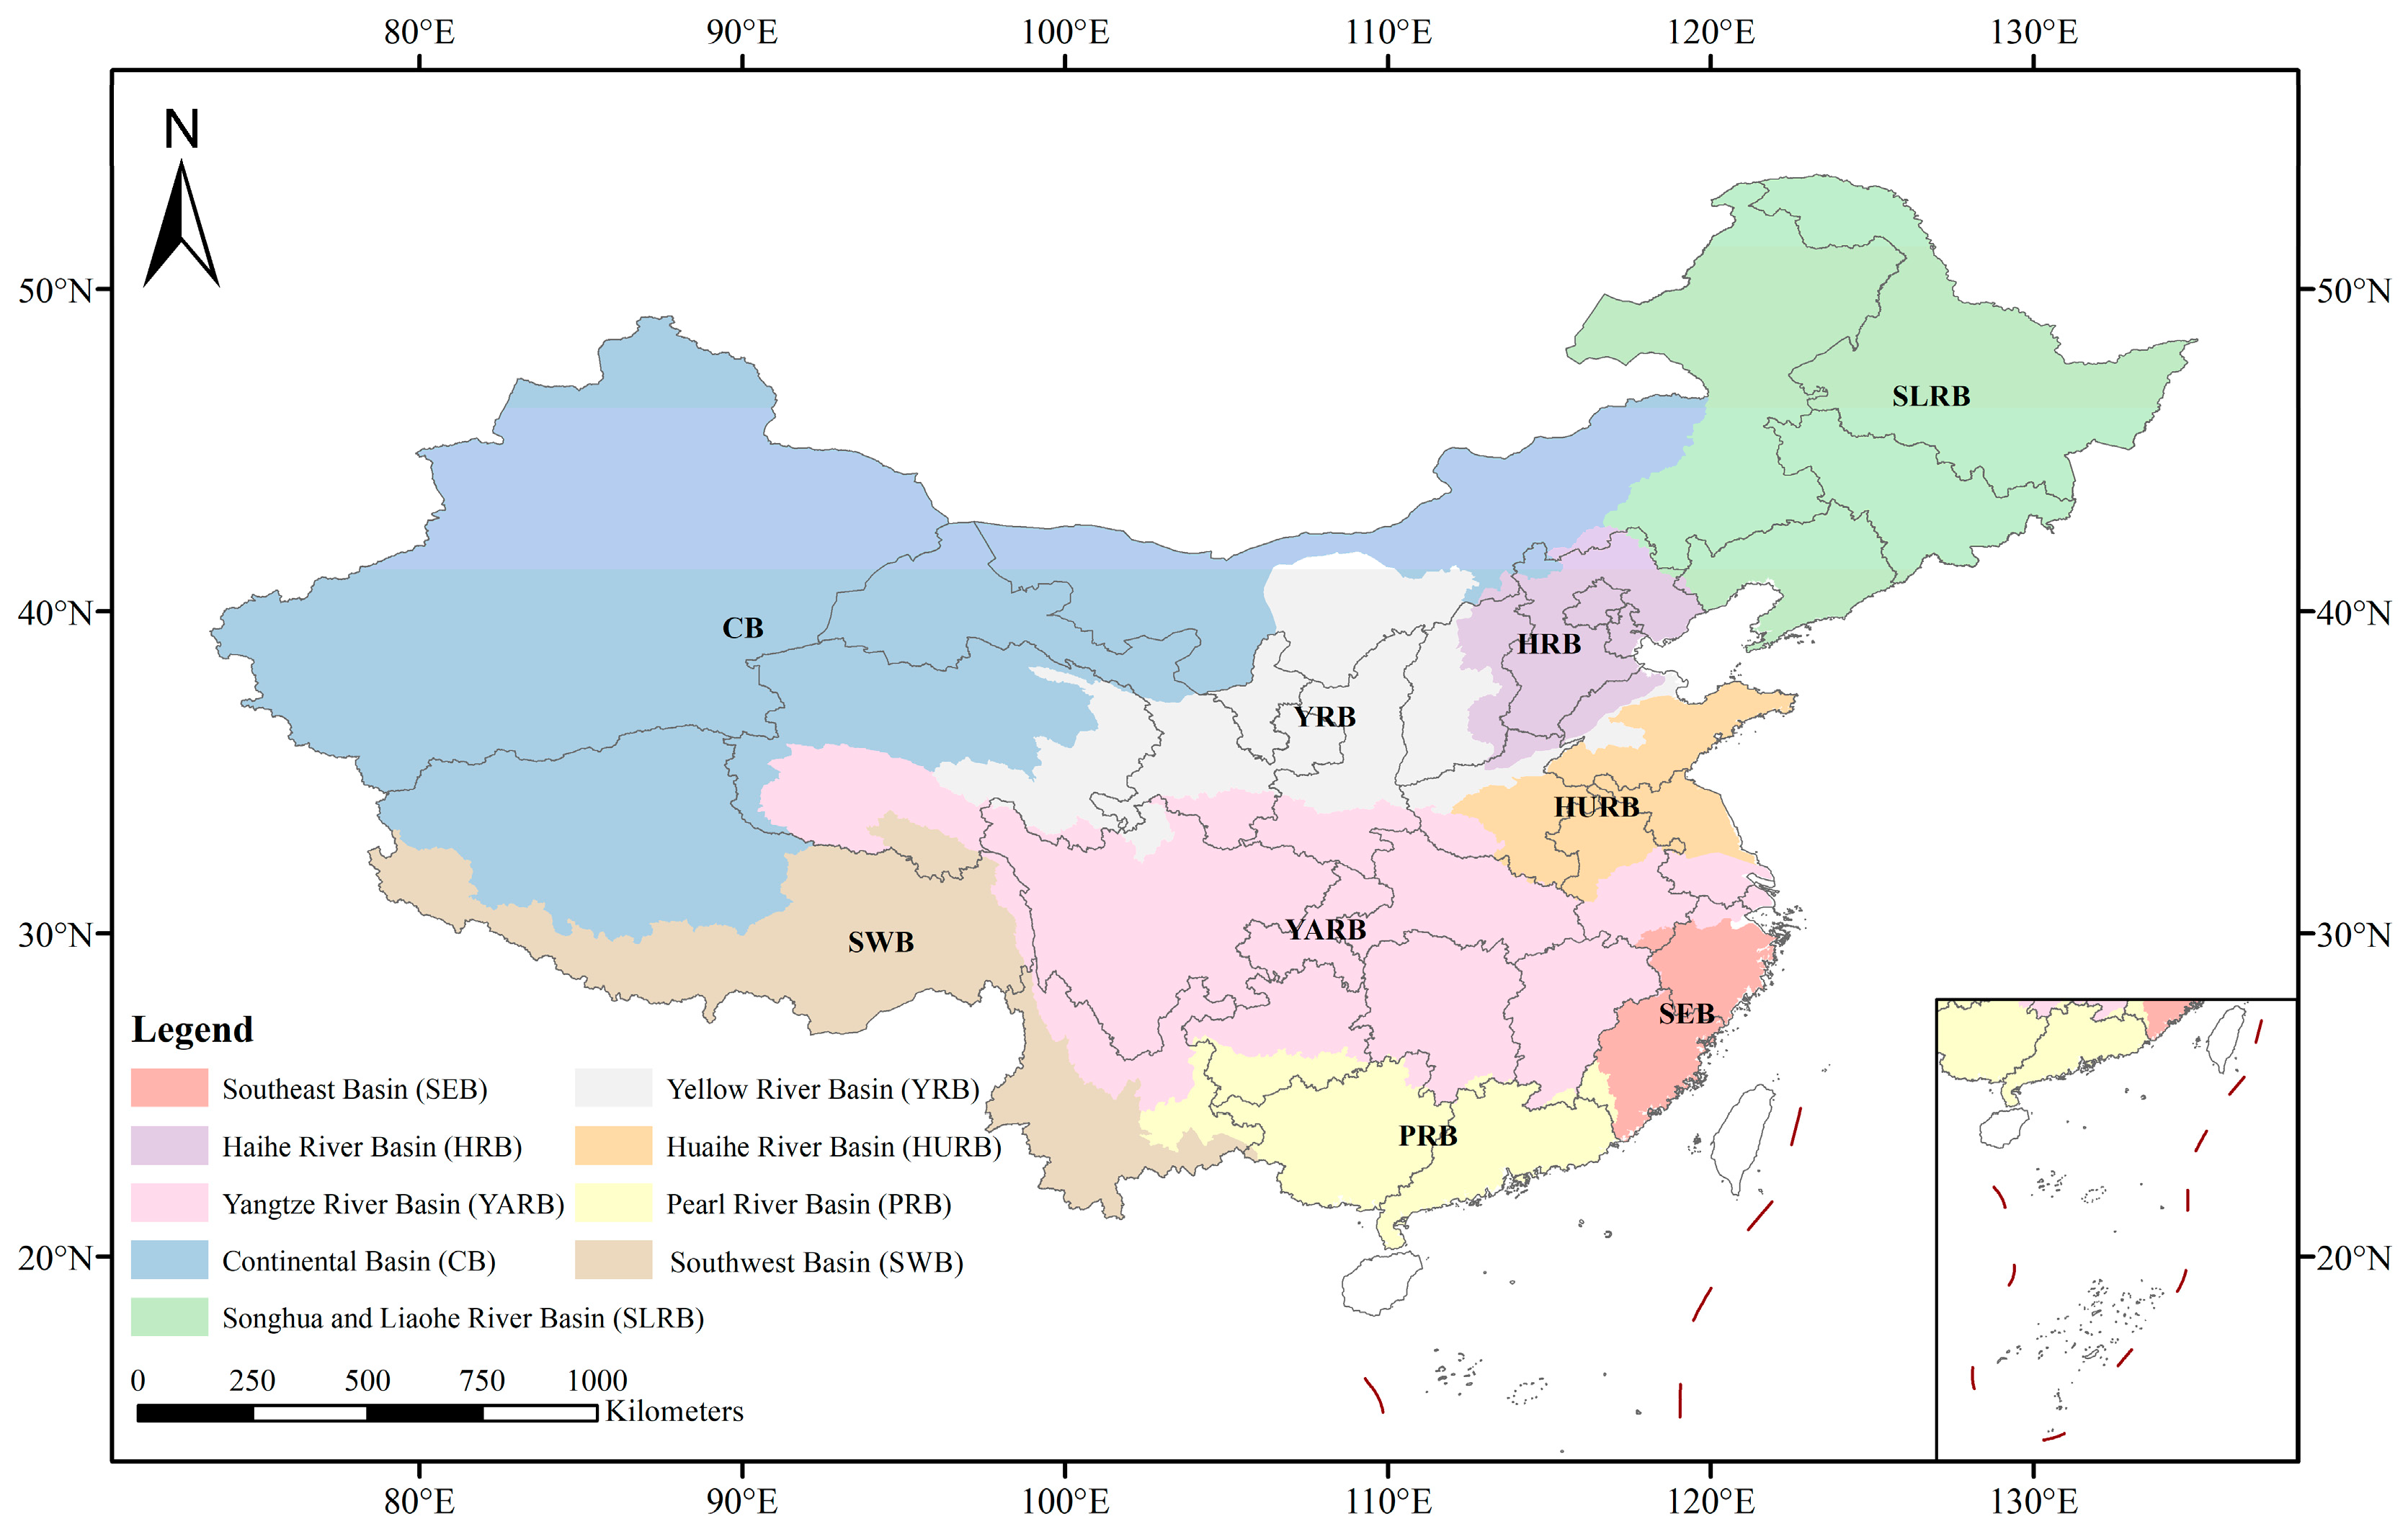
2.1. Study Area

The complex climate and diverse terrain of China lead to a highly uneven distribution of water resources. From the southeast to the northwest, there is a gradual decrease in water availability. The southeastern regions experience an average annual precipitation exceeding 2000 mm, whereas in the northwest, it ranges merely between 200 and 400 mm. Moreover, the runoff in the southeast during the rainy season (summer and autumn) is approximately five times higher than that during the dry season (spring and winter), while in the northwest, the runoff during the rainy season is about ten times that of the dry season [20,38]. According to statistics, China’s total water resources in 2020 were 3160.52 trillion m3, of which 47.2% came from precipitation. The annual precipitation amount was 706.5 mm, an increase of 8.5% compared to 2019 [39]. Considering China’s diverse geographical features and river systems, the country is segmented into nine major water resource regions: Yangtze River Basin (YARB), Yellow River Basin (YRB), Pearl River Basin (PRB), Huaihe River Basin (HURB), Haihe River Basin (HRB), Songhua and Liaohe River Basin (SLRB), Southeast Basin (SEB), Southwest Basin (SWB), and Continental Basin (CB). These water resource regions have distinct geographical, hydrological, and climatic characteristics, with some experiencing persistent droughts and others abundant rainfall, resulting in different water resources conditions. This study focuses on nine major water resource regions as the study area. To ensure the integrity of the watershed scope, Hainan Island, Taiwan Island, and coastal reefs were excluded, focusing instead on the water resource regions on the inland areas of China. The location of the nine major water resource regions in China is shown in Figure 1.

2.2. Dataset

2.2.1. Satellite Precipitation Data

CHIRPS is a high-resolution satellite rainfall product developed for the International Development Famine Early Warning Systems Network (FEWS NET) [8].
CMORPH is a satellite-based rainfall product released by the National Oceanographic and Atmospheric Administration (NOAA) and the Climate Prediction Center (CPC), utilizing infrared sensors and passive microwave sensors to estimate rainfall [7].
Global Precipitation Measurement (GPM) is a global rainfall observation program implemented in 2014 by the National Aeronautics and Space Administration (NASA) and the Japan Aerospace Exploration Agency (JAXA). As a successor to the TRMM rainfall observation program, GPM has a broader observation range, a shorter observation period (0.5 h), and higher spatial resolution (0.1° × 0.1°) than TRMM. IMERG provides three versions of SPPs: IMERG-Early, IMERG-Late, and IMERG-Final. IMERG-Early offers near-real-time rainfall data (6 h), IMERG-Late provides post-real-time rainfall data (18 h), and IMERG-Final provides rainfall data corrected for biases using the Global Precipitation Climatology Centre (GPCC) [10,34].
GSMaP is a SPP released by the Japan Aerospace Exploration Agency (JAXA) in 2002. It provides three versions: GSMaP-NRT, GSMaP-MVK, and GSMaP-Gauge. GSMaP-MVK is the earliest released precipitation product, serving as the basis for subsequent GSMaP-NRT and GSMaP-Gauge precipitation products. GSMaP-NRT is a near real-time SPP adjusted based on GSMaP-MVK. GSMaP-Gauge is a precipitation product obtained by correcting GSMaP-MVK using global gauge analysis data (CPC) [5,34].
PERSIANN, developed by the Hydrometeorology and Remote Sensing Research Center at California State University, Central Coast [17], is a comprehensive dataset of multi-satellite rainfall estimates obtained using an artificial neural network algorithm. It estimates precipitation by employing the PERSIANN algorithm on GridSat-B1 infrared satellite data and trains the artificial neural network using hourly precipitation data from the National Centers for Environmental Prediction (NCEP) Phase IV. Presently, there are multiple datasets available, such as PERSIANN-CCS and PERSIANN-CDR, with the latter being adjusted using the Global Precipitation Climatology Project (GPCP) monthly product version 2.2 (GPCPv2.2).
TRMM is the world’s first satellite equipped with a precipitation radar, also encompassing a microwave imager, visible and infrared scanner, cloud and earth radiation energy system, lightning imager sensor, etc. [9]. Notably, the fusion of the precipitation radar and microwave imager enables the provision of three-dimensional precipitation distribution information for the first time. Furthermore, the integration of visible and infrared scanning data significantly enhances precipitation inversion accuracy. Despite the cessation of its primary mission in 2015, TRMM’s data remained accessible for utilization, with official data updates continuing until 2019.

2.2.2. Benchmark Precipitation Data

Currently, there are fewer than 900 meteorological stations in China with publicly available downloadable data, and only daily precipitation data is accessible, resulting in a serious insufficiency in spatial and temporal scales. Therefore, this study opted to utilize the precipitation dataset of the CLDAS-V2.0 launched by the China Meteorological Administration (http://data.cma.cn/ (accessed on 19 April 2024)) as the benchmark.
The CLDAS-V2.0 dataset is a grid fusion product covering the Asian region, featuring uniform latitude and longitude grids with a spatial resolution of 0.0625° × 0.0625°. It provides precipitation data at both hourly and daily temporal resolutions. CLDAS-V2.0 integrates data from over 2400 national-level ground stations. It employs various techniques including grid variational assimilation (STMAS), optimal interpolation (OI), cumulative distribution function matching (CDF), physical inversion, and terrain correction for multi-source data fusion. The precipitation observation accuracy of CLDAS-V2.0 in China surpasses that of other multi-source meteorological data fusion products, with more accurate spatiotemporal distribution characteristics [36,37].

3. Method

3.1. Data Preprocessing

As shown in Table 1, these datasets differ in file format, temporal and spatial resolution, and numerical units, necessitating the adoption of different strategies for processing them accordingly.
(1)
CHIRPS. The data format for CHIRPS is TIFF, which can be directly used.
(2)
CMORPH. The data format for CMORPH is NC, and we have written a program to convert the NC format to TIFF format.
(3)
GPM IMERG. The data format for GPM IMERG is NC. The same program is used to convert the NC format to TIFF format. Additionally, the GPM IMERG does not provide hourly precipitation data, but only half-hourly data, and the unit for the half-hourly data is mm/h. Therefore, it is necessary to add the two sets of data from the same hour together and then divide by 2 to obtain the hourly precipitation data.
(4)
GSMaP. The data format for GSMaP is DAT, and we used Arcpy to convert it to TIFF format. Additionally, the unit of the GSMaP daily-scale data is in mm/h. To obtain the actual daily precipitation, the data need to be multiplied by 24.
(5)
PERISANN. The data format for PERISANN is TIFF, which can be directly used.
(6)
TRMM. The data format for TRMM is NC. The same program is used to convert the NC format to TIFF.
In order to avoid the uncertainties caused by spatial interpolation, we did not unify the spatial resolution of the SPPs. During the evaluation process, we used the center of the pixels in the CLDAS grid data as the reference point. Subsequently, we identified the grid in the SPPs that is closest to these pixels for comparative analysis.

3.2. Evaluation Metrics

This study employed three statistical indicators: correlation coefficient (CC), root mean square error (RMSE), and absolute mean error (MAE), as well as three classification indicators: probability of detection (POD), false alarm rate (FAR), and critical success index (CSI) to assess the accuracy of multi-source SPPs at both daily and hourly time scales.
CC denotes the correlation degree between SPPs and CLDAS. The closer the CC value is to 1, the higher the positive correlation degree; the closer it is to −1, the higher the negative correlation degree; and the closer it is to 0, the weaker the correlation degree. RMSE represents the observation accuracy of satellite precipitation data relative to ground precipitation data. The closer the value is to 0, the smaller the error and the higher the observation accuracy. MAE is used to measure the average difference degree between satellite precipitation data and ground precipitation data. The closer the value is to 0, the smaller the average difference. POD represents the probability of correctly observing precipitation in rainfall events by SPPs, while FAR represents the probability of incorrectly observing precipitation by SPPs; moreover, CSI denotes the probability of successfully observing precipitation by SPPs among all precipitation events observed by both SPPs and CLDAS. The calculation formulas and optimal values of the six evaluation indices are shown in Table 2.
The evaluation metrics utilized in this study are based on all records of individual grid cells in the time series of satellite precipitation data. In the formulas provided, Si represents the precipitation value of a single grid cell in the satellite precipitation data at a specific time; Ci represents the precipitation value of a single grid cell in the CLDAS precipitation data at a specific time; S ¯ represents the average value of individual grid cells in the time series of satellite precipitation data; C ¯ represents the average value of CLDAS precipitation data in the time series; n represents the number of records of individual grid cells in the time series of satellite precipitation data; H represents the number of records where both the satellite and CLDAS show precipitation; M represents the number of records where CLDAS shows precipitation but the satellite does not; F represents the number of records where the satellite shows precipitation but CLDAS does not. In this study, the precipitation threshold was set at 0.1 mm/h, and data records with precipitation amounts below this threshold were considered as no precipitation.

4. Results

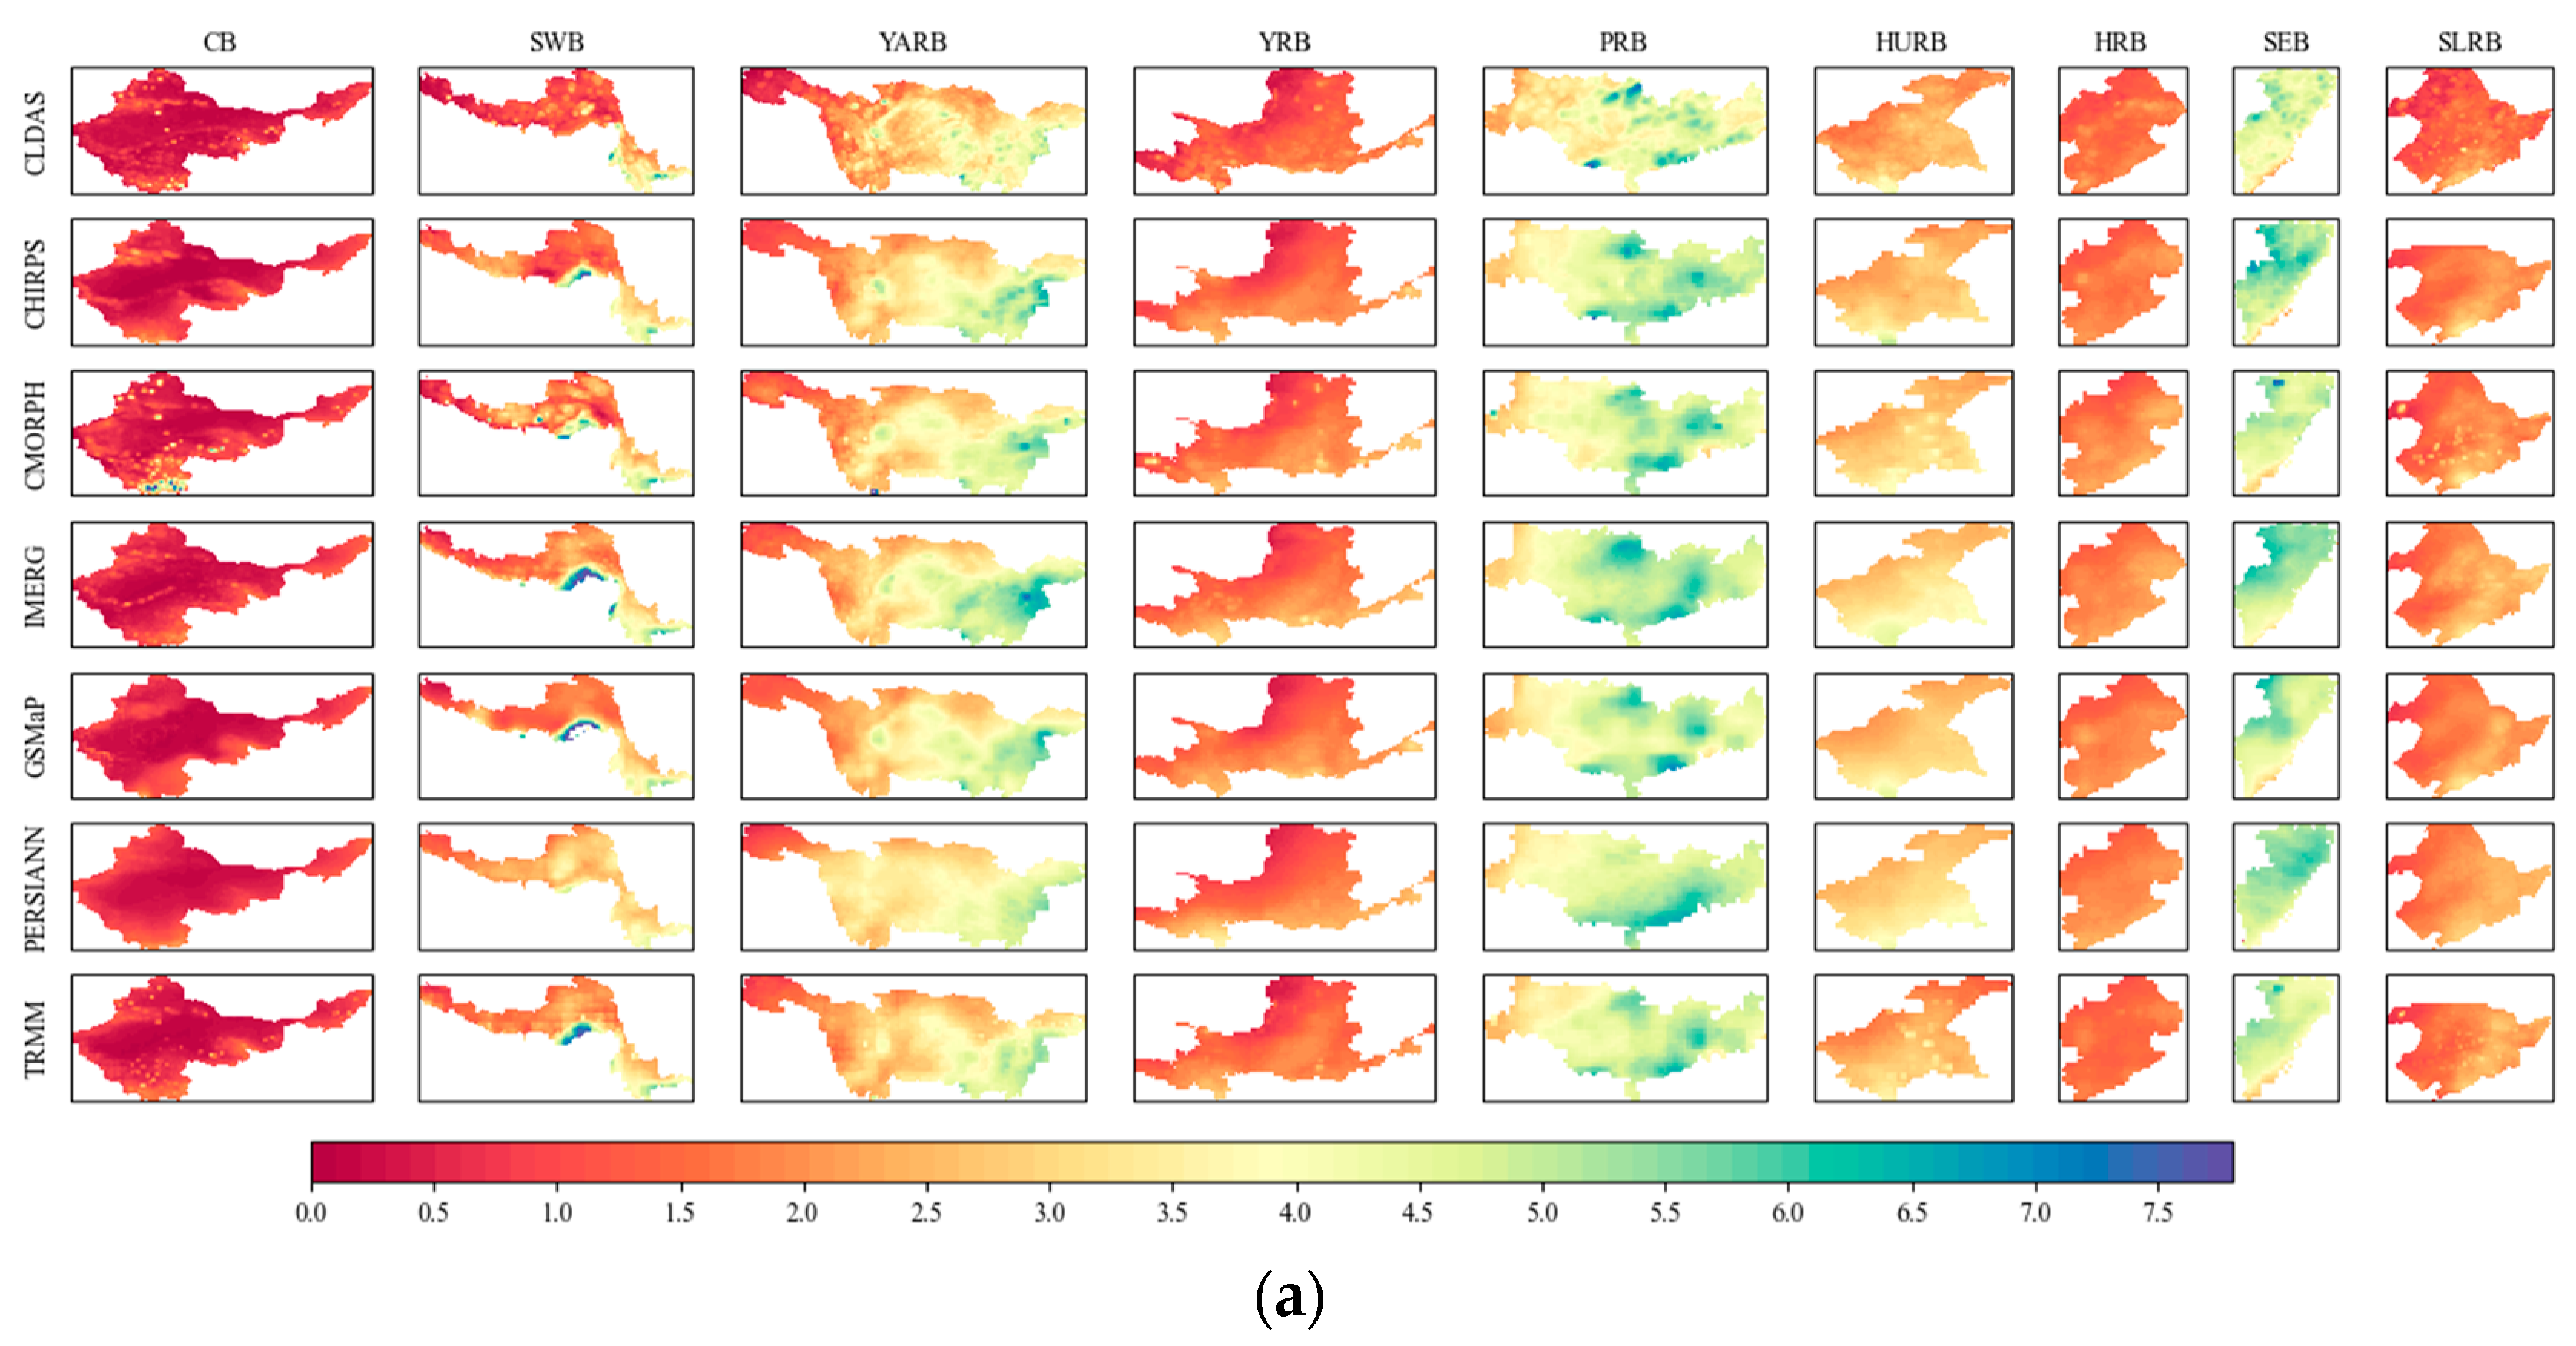
4.1. Daily and Hourly Average Precipitation

This study initially computed the daily and hourly average precipitation amounts for six SPPs across nine water resource regions. As shown in Figure 2, the spatial distribution of average precipitation at both daily and hourly scales was almost identical: (1) Higher average precipitation was observed in the YARB, PRB, and SEB compared to the other six basins. According to the study by Xu et al. [40], moderate, heavy, and torrential rains predominantly occur in the YARB, PRB, and SEB, while light rain is primarily concentrated in the YARB and SWB, with the CB having the lowest rainfall intensity and frequency. (2) Across the eight basins, with the exception of the CB region, precipitation was consistently overestimated to varying degrees. This trend is corroborated by the conclusions drawn in the studies by Zhang et al. [41]. (3) In the CB, CMORPH significantly overestimated the precipitation, whereas the other five SPPs underestimated it. On the daily scale, the average precipitation in the CLDAS and CMORPH ranged from 0 to 5 mm and 0 to 10.7 mm, respectively. The average precipitation in the other five data products ranged from 0 to 2.5 mm. On the hourly scale, the average precipitation in the CLDAS and CMORPH ranged from 0 to 0.2 mm and 0 to 0.4 mm, respectively. The hourly precipitation in GSMaP and GPM IMERG was lower than 0.1 mm.

4.2. Performance Evaluation on Daily Scale

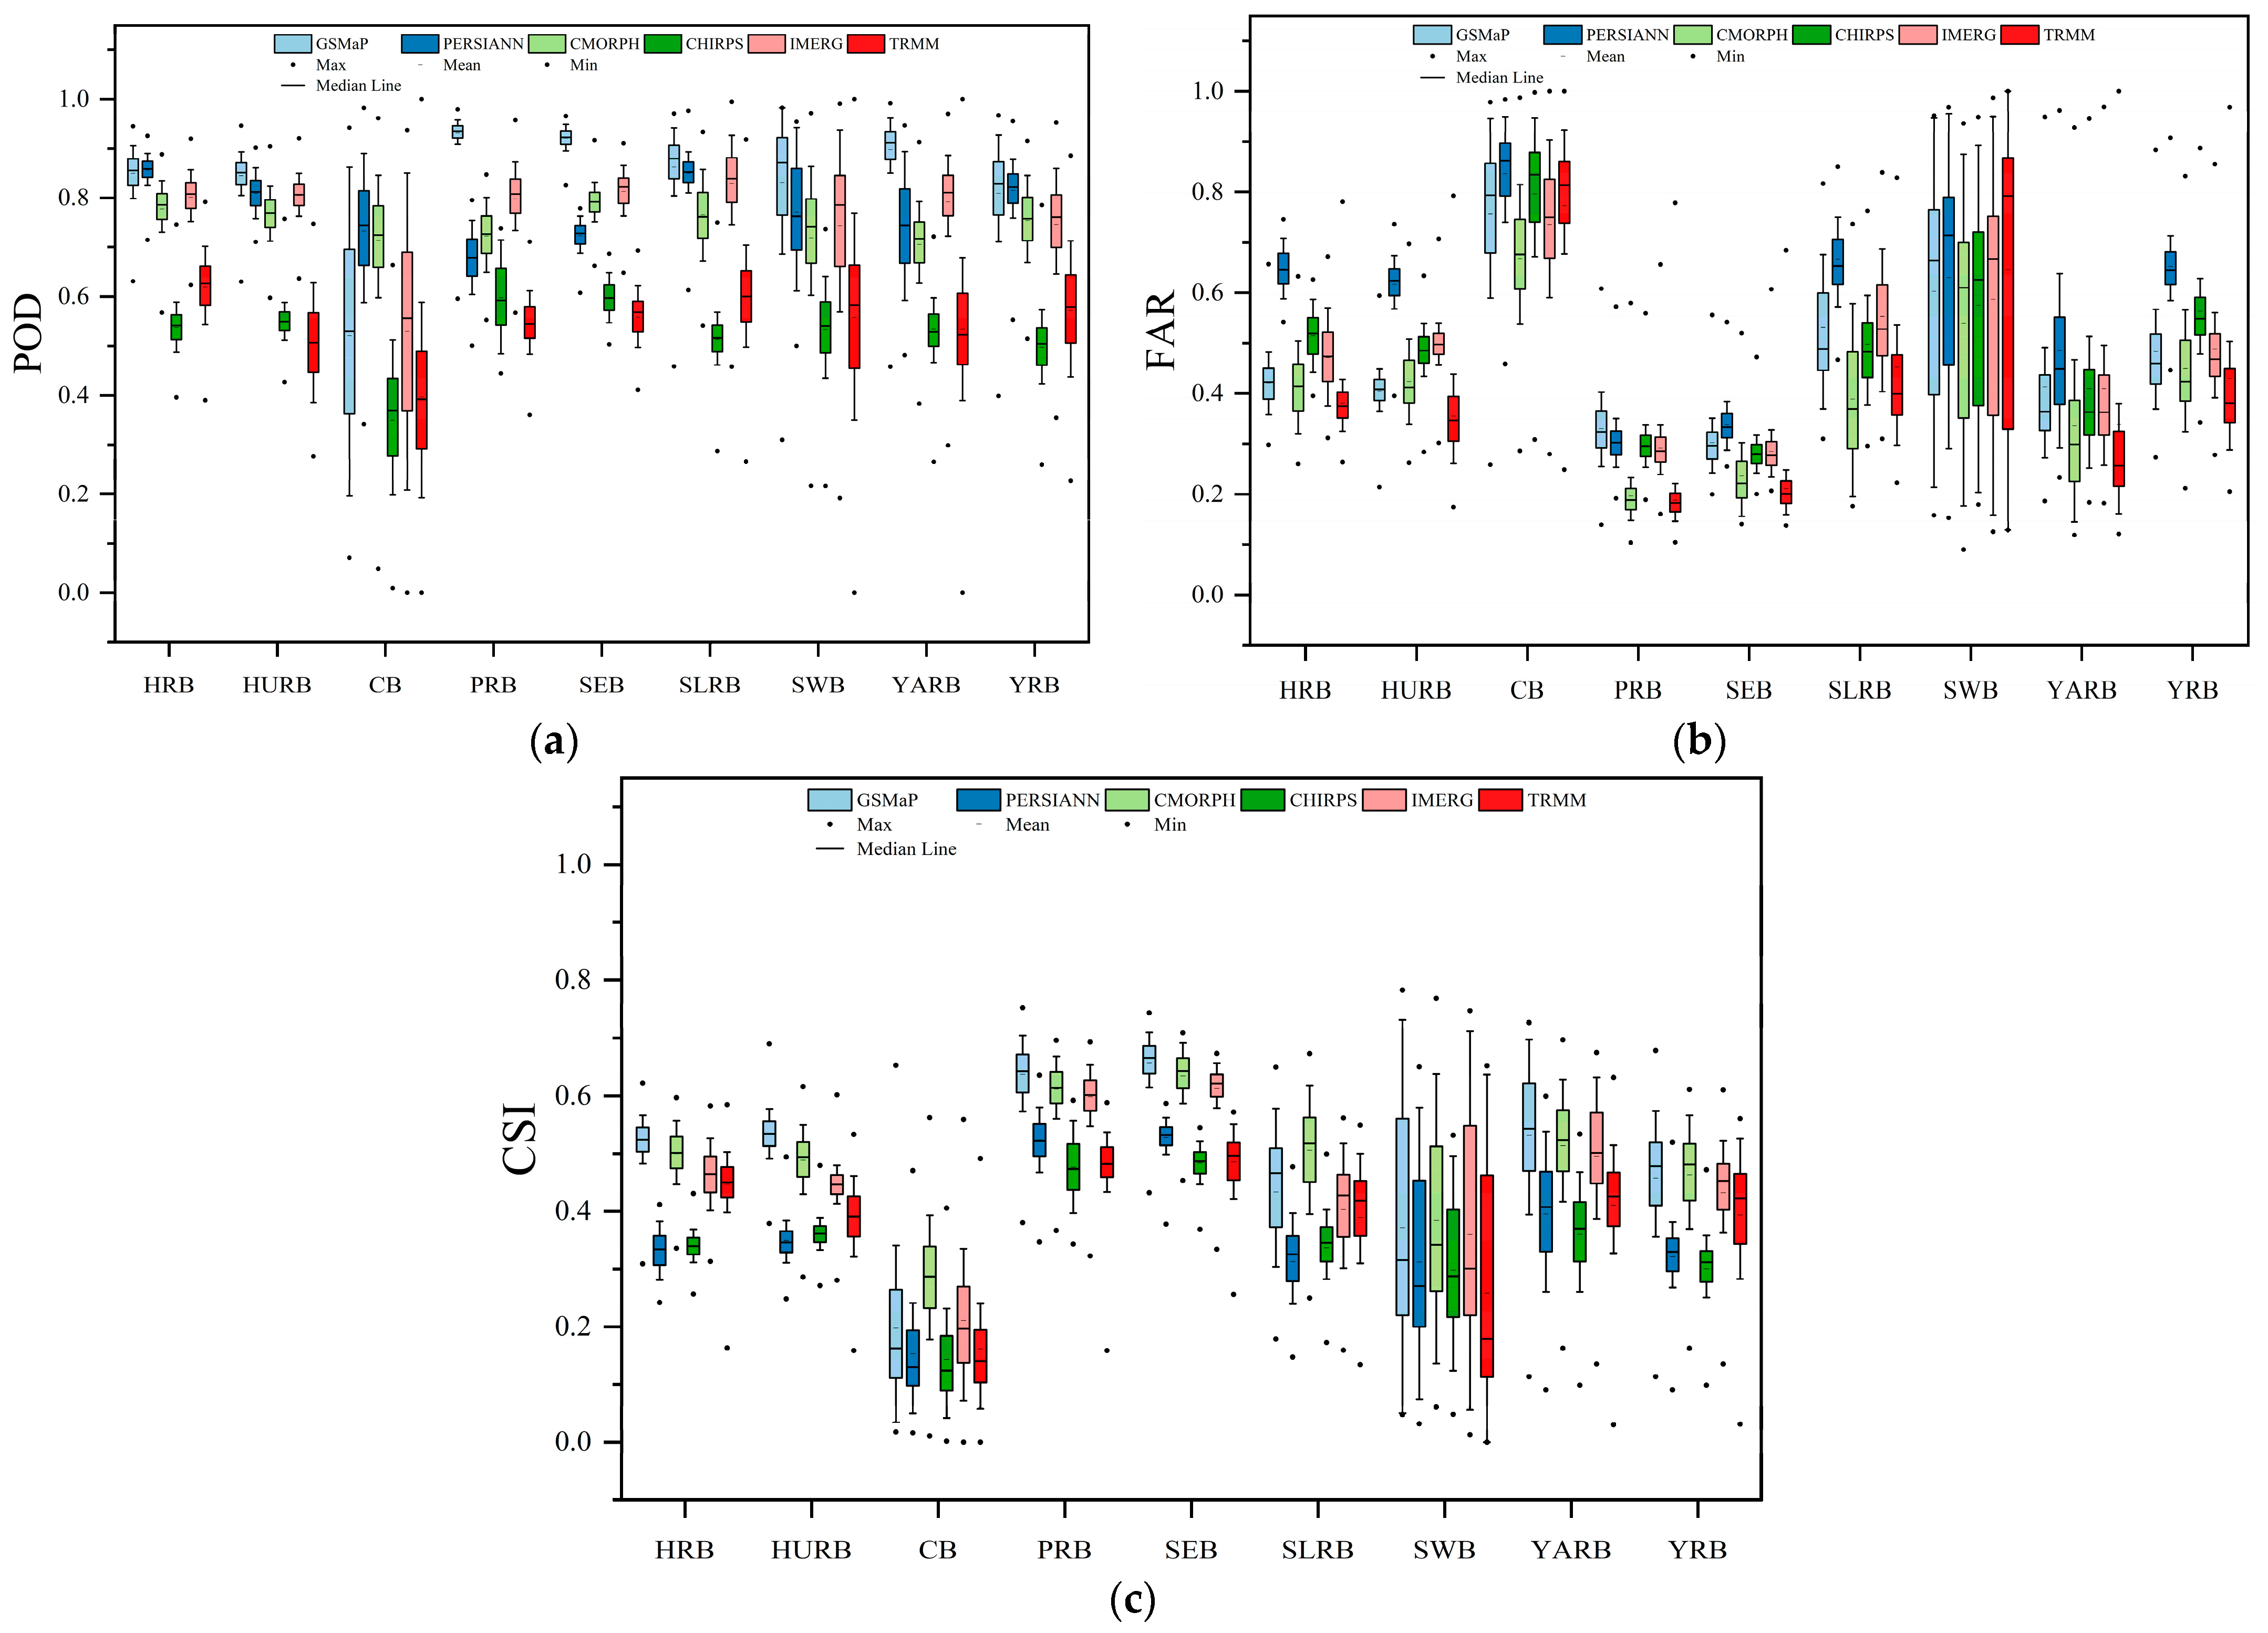
4.2.1. Daily Scale Index Evaluation and Statistical Analysis

As shown in Figure 3, the CC indicators in the CB and SWB performed worst, with the lowest overall values and the highest degree of dispersion. Situated in western China, the CB and SWB regions predominantly experience arid climates, with precipitation primarily comprising light rain and drizzle [40]. The annual average precipitation in CB stands at a mere 152 mm (1960–2019) [42]. However, satellite observations of light rain and drizzle entail notable uncertainties [19,24,29,43]. Among the remaining seven basins, the median CC indicators of GSMaP, CMORPH, and GPM IMERG exceeded 0.7, while the median CC of TRMM ranged between 0.6 and 0.7, and those of PERISANN and CHIRPS fell below 0.6. CMORPH demonstrated a superior capability in addressing inaccuracies in low precipitation observations, with its CC indicator in the CB and SWB surpassing that of the other five SPPs. GSMaP performed best in the remaining seven basins, but in the SLRB and the YARB, the dispersion of GSMaP’s CC index dispersion notably exceeded that of other SPPs.
In terms of the RMSE evaluation metric, the CB exhibited the lowest overall RMSE values, with a median RMSE below 4 mm. In contrast, the PRB and the SEB presented the highest overall RMSE values, typically exceeding 8 mm. However, it is crucial to note that concluding that SPPs had superior RMSE performance in the CB would be premature, as the region experiences the lowest annual precipitation, thereby minimizing errors. Conversely, the PRB and SEB, with their higher annual precipitation levels, experienced increased error rates. Within the SEB, there was notable divergence in the RMSE value distribution across various SPPs. Overall, CHIRPS demonstrated the highest RMSE value distribution and worst performance among the nine basins, while GSMaP consistently exhibited the smallest median RMSE values across all nine basins.
The evaluation results revealed a notable similarity between the MAE index and the RMSE index: the CB consistently exhibited the lowest MAE values, while the PRB and SEB exhibited the highest MAE values. Additionally, the CB displayed the smallest discrepancies between SPPs, whereas the SEB showed the largest variations among them. Given that the SWB and YARB encompass both wet and semi-arid climates, internal precipitation variations were substantial, leading to a significantly elevated degree of MAE dispersion compared to other basins.
In terms of classification indicators, as depicted in Figure 4a, the performance of the POD index in CB was the worst, with a higher degree of dispersion in POD values observed in both the CB and SWB compared to other basins. This indicates that there are significant differences in SPP observations in drought and semi-drought regions. In CB and HRB, the POD indicators of PERSIANN and CMORPH performed best. A study conducted by Heimi et al. [44] in arid areas of Arabia showed that the overall performance of POD indicators for PERISANN and GPM IMERG was superior, with CMORPH slightly trailing behind. Among the remaining seven basins, excluding CB and SWB, GSMaP exhibited the highest POD, indicating its suitability for wet climate regions. CHIRPS and TRMM exhibited the poorest POD index performance among the nine basins. It is worth noting that the degree of dispersion in the POD index for GSMaP and GPM IMERG in the CB was significantly higher compared to other SPPs, suggesting substantial fluctuations in the observation performance of these two SPPs in drought-prone regions.
The performance of the FAR index in the CB was the worst, as shown in Figure 4b. The dispersion of the FAR index in the SWB was significantly higher than in other basins, with minimal variation in performance among the six SPPs. In the PRB, GSMaP exhibited the highest FAR index, while in the remaining eight basins, PERISANN had the highest FAR index, indicating poor performance. Across all basins excluding the SWB, TRMM displayed the best FAR index performance, with the majority of values ranging from 0.1 to 0.4, consistent with the study by Ma et al. [13]. Furthermore, in the SWB, CMORPH showcased the best FAR index performance, ranking second only to TRMM in the remaining basins.
The CSI box plot is similar to the FAR box plot: the overall performance of the CSI index in CB was the poorest, and the CSI index in the SWB exhibited the highest degree of dispersion. GSMaP and CMORPH generally demonstrated the best overall performance in terms of the CSI index, while PERSIANN, CHIRPS, and TRMM tended to perform less favorably, as illustrated in Figure 4c.

4.2.2. Spatial Distribution of Daily Scale Evaluation Index

As shown in Figure 5, the overall performance of the CC index across the nine water resource regions exhibited a gradually increasing trend from west to east. Eastern regions, such as the PRB, HURB, HRB, SEB, and SLRB, exhibited higher CC values compared to central regions like the YARB and YRB. The CC values in the YARB and YRB were notably superior to those in the CB and SWB in the west. However, in the central and southern areas of the CB, the western portion of the SWB, and the northwest segment of the YARB, the CC index generally remained low and even negative in some localized areas. Notably, CMORPH demonstrated significantly higher CC indices than other SPPs in these regions.
The spatial distribution of the RMSE of six SPPs exhibited strong similarity. Lower RMSE values were observed in regions with drier climates such as CB, YRB, HRB, and SLRB, consistent with findings from Zhou et al. [21]. However, in areas like the YARB and SLRB, localized errors were evident, with maximum RMSE values primarily concentrated in these specific regions (Figure 5b). Regarding the MAE index, localized maximum values were concentrated in the SWB, with GSMaP precipitation data contributing to the largest errors in this region (Figure 5c).
In terms of classification indicators, there was a significant boundary between the Tarim Basin and the Tianshan Mountains within the CB. Among the five SPPs, namely, CHIRPS, GPM IMERG, GSMaP, PERSIANN, and TRMM, the POD index performance was notably poor in the southern region of the Tarim Basin. However, in the rainfall-rich Tianshan Mountains area, there was a significant enhancement in the POD index (Figure 6a). In the CB, the spatial distribution of the POD index of CMORPH was relatively consistent, exhibiting notably higher values compared to other SPPs. Overall, the CHIRPS and TRMM displayed the weakest performance in the POD index, while GSMaP exhibited the best performance in the POD index across eight other basins, excluding the CB.
The PRB and the SEB exhibited higher precipitation and a significantly lower FAR index than other basins. Within the SWB, there was a clear division based on semi-arid and wet climates, resulting in a substantial disparity in the FAR index between the two regions. In the small semi-arid areas of the YARB and the YRB, the FAR index was notably elevated compared to other areas. Moreover, in the northwest part of the SLRB, namely, the Greater Khingan Mountains, the FAR index was higher. This area is in a high-latitude region with a long winter and heavy snowfall, which may have a certain impact on satellite precipitation observation. Additionally, in the Himalayan Mountains area on the southwest border of the CB, the FAR index was higher. The spatial distribution pattern of the CSI index showed a strong negative correlation with the FAR index (Figure 6c).

4.3. Performance Evaluation on Hourly Scale

4.3.1. Hourly Scale Index Evaluation and Statistical Analysis

This study selected hourly scale data of three SPPs: GSMaP, CMORPH, and GPM IMERG. As shown in Figure 7, there was a strong similarity between the hourly evaluation index and the daily scale: (1) The CB exhibited the lowest CC, RMSE, and MAE indices, while the SWB showed the highest CC index dispersion, and the PRB and the SEB had the highest RMSE and MAE values. (2) In the CB and SLRB, the maximum RMSE values exceeded the overall value distribution. (3) CMORPH performed best in the CC index in the CB and SWB, while GSMaP performed best in the CC index in the remaining seven basins.
At the hourly scale, there was a noticeable decrease in the accuracy of statistical indicators compared to the daily scale. The main differences included the following: (1) At the hourly scale, the CC index was mostly between 0.2 and 0.6 (Figure 7a), whereas at the daily scale, the CC index ranged from 0.6 to 0.8 (Figure 3a). This indicates that satellite precipitation observations face greater challenges in capturing precipitation events at the hourly scale. (2) At the hourly scale, the RMSE index was generally below 1 mm (Figure 7b), and the MAE index was below 0.3 mm (Figure 7c). However, at the daily scale, the RMSE index ranged from 2 to 10 mm (Figure 3b), and the MAE was mainly distributed between 1 and 5 mm (Figure 3c). (3) Among the nine basins, the RMSE index of GSMaP was lower than those of CMORPH and GPM IMERG, and there was a relatively high consistency in the MAE indices of the three SPPs.
In terms of classification evaluation indicators, the POD index was the lowest in CB, and the highest dispersion degree of the POD index was found in the SWB (value range of 0.1~0.9). CMORPH exhibited the highest concentration of POD in CB, demonstrating the best overall performance. Among the remaining eight basins, GSMaP showed the overall best performance in the POD index (Figure 8a). The box plots of hourly scale FAR and CSI indices exhibited high similarity with daily scale ones (Figure 8b,c), but the FAR index values notably increased, generally exceeding 0.6, while CSI decreased below 0.3. In terms of basin comparison, the FAR index was highest in CB and SWB and lowest in PRB and SEB. Among the nine basins, the FAR index of CMORPH was lower than GSMaP and GPM IMERG, and the CSI index of GSMaP was lower than CMORPH and GPM IMERG. Compared to the daily scale, the hourly scale exhibited weaker advantages in CSI indices in PRB and SEB.

4.3.2. Spatial Distribution of Hourly Scale Evaluation Index

At the hourly scale, poor performance in the CC index was observed in the CB, western parts of the SWB, western parts of the YARB, and the northwest part of the YRB (Figure 9a). The highest values of RMSE and MAE in the SLRB were concentrated in the central point-like region, while the maximum MAE values in the SWB were concentrated in the central edge areas (Figure 9b,c). The research results of Helmi et al. [44] indicate that hourly SPPs still lack reliability in drought areas, which is consistent with the evaluation results of this study.
In terms of classification indicators, except for the CB, the POD index of GSMaP was significantly higher than that of CMORPH and GPM IMERG. In the central region of the CB, the POD index of CMORPH was significantly higher than that of GSMaP and GPM IMERG (Figure 10a). Compared to the daily scale, the hourly scale FAR index showed a significant increase, while the CSI index showed a significant decrease. Additionally, there was no significant difference in the spatial distribution pattern of these two indices compared to the daily scale (Figure 10b,c). Unlike in this study, Gao et al. [45] found that the POD index of IMERG in the PRB was slightly lower than that of GSMaP, while the FAR index was significantly lower than that of GSMaP.

5. Discussions

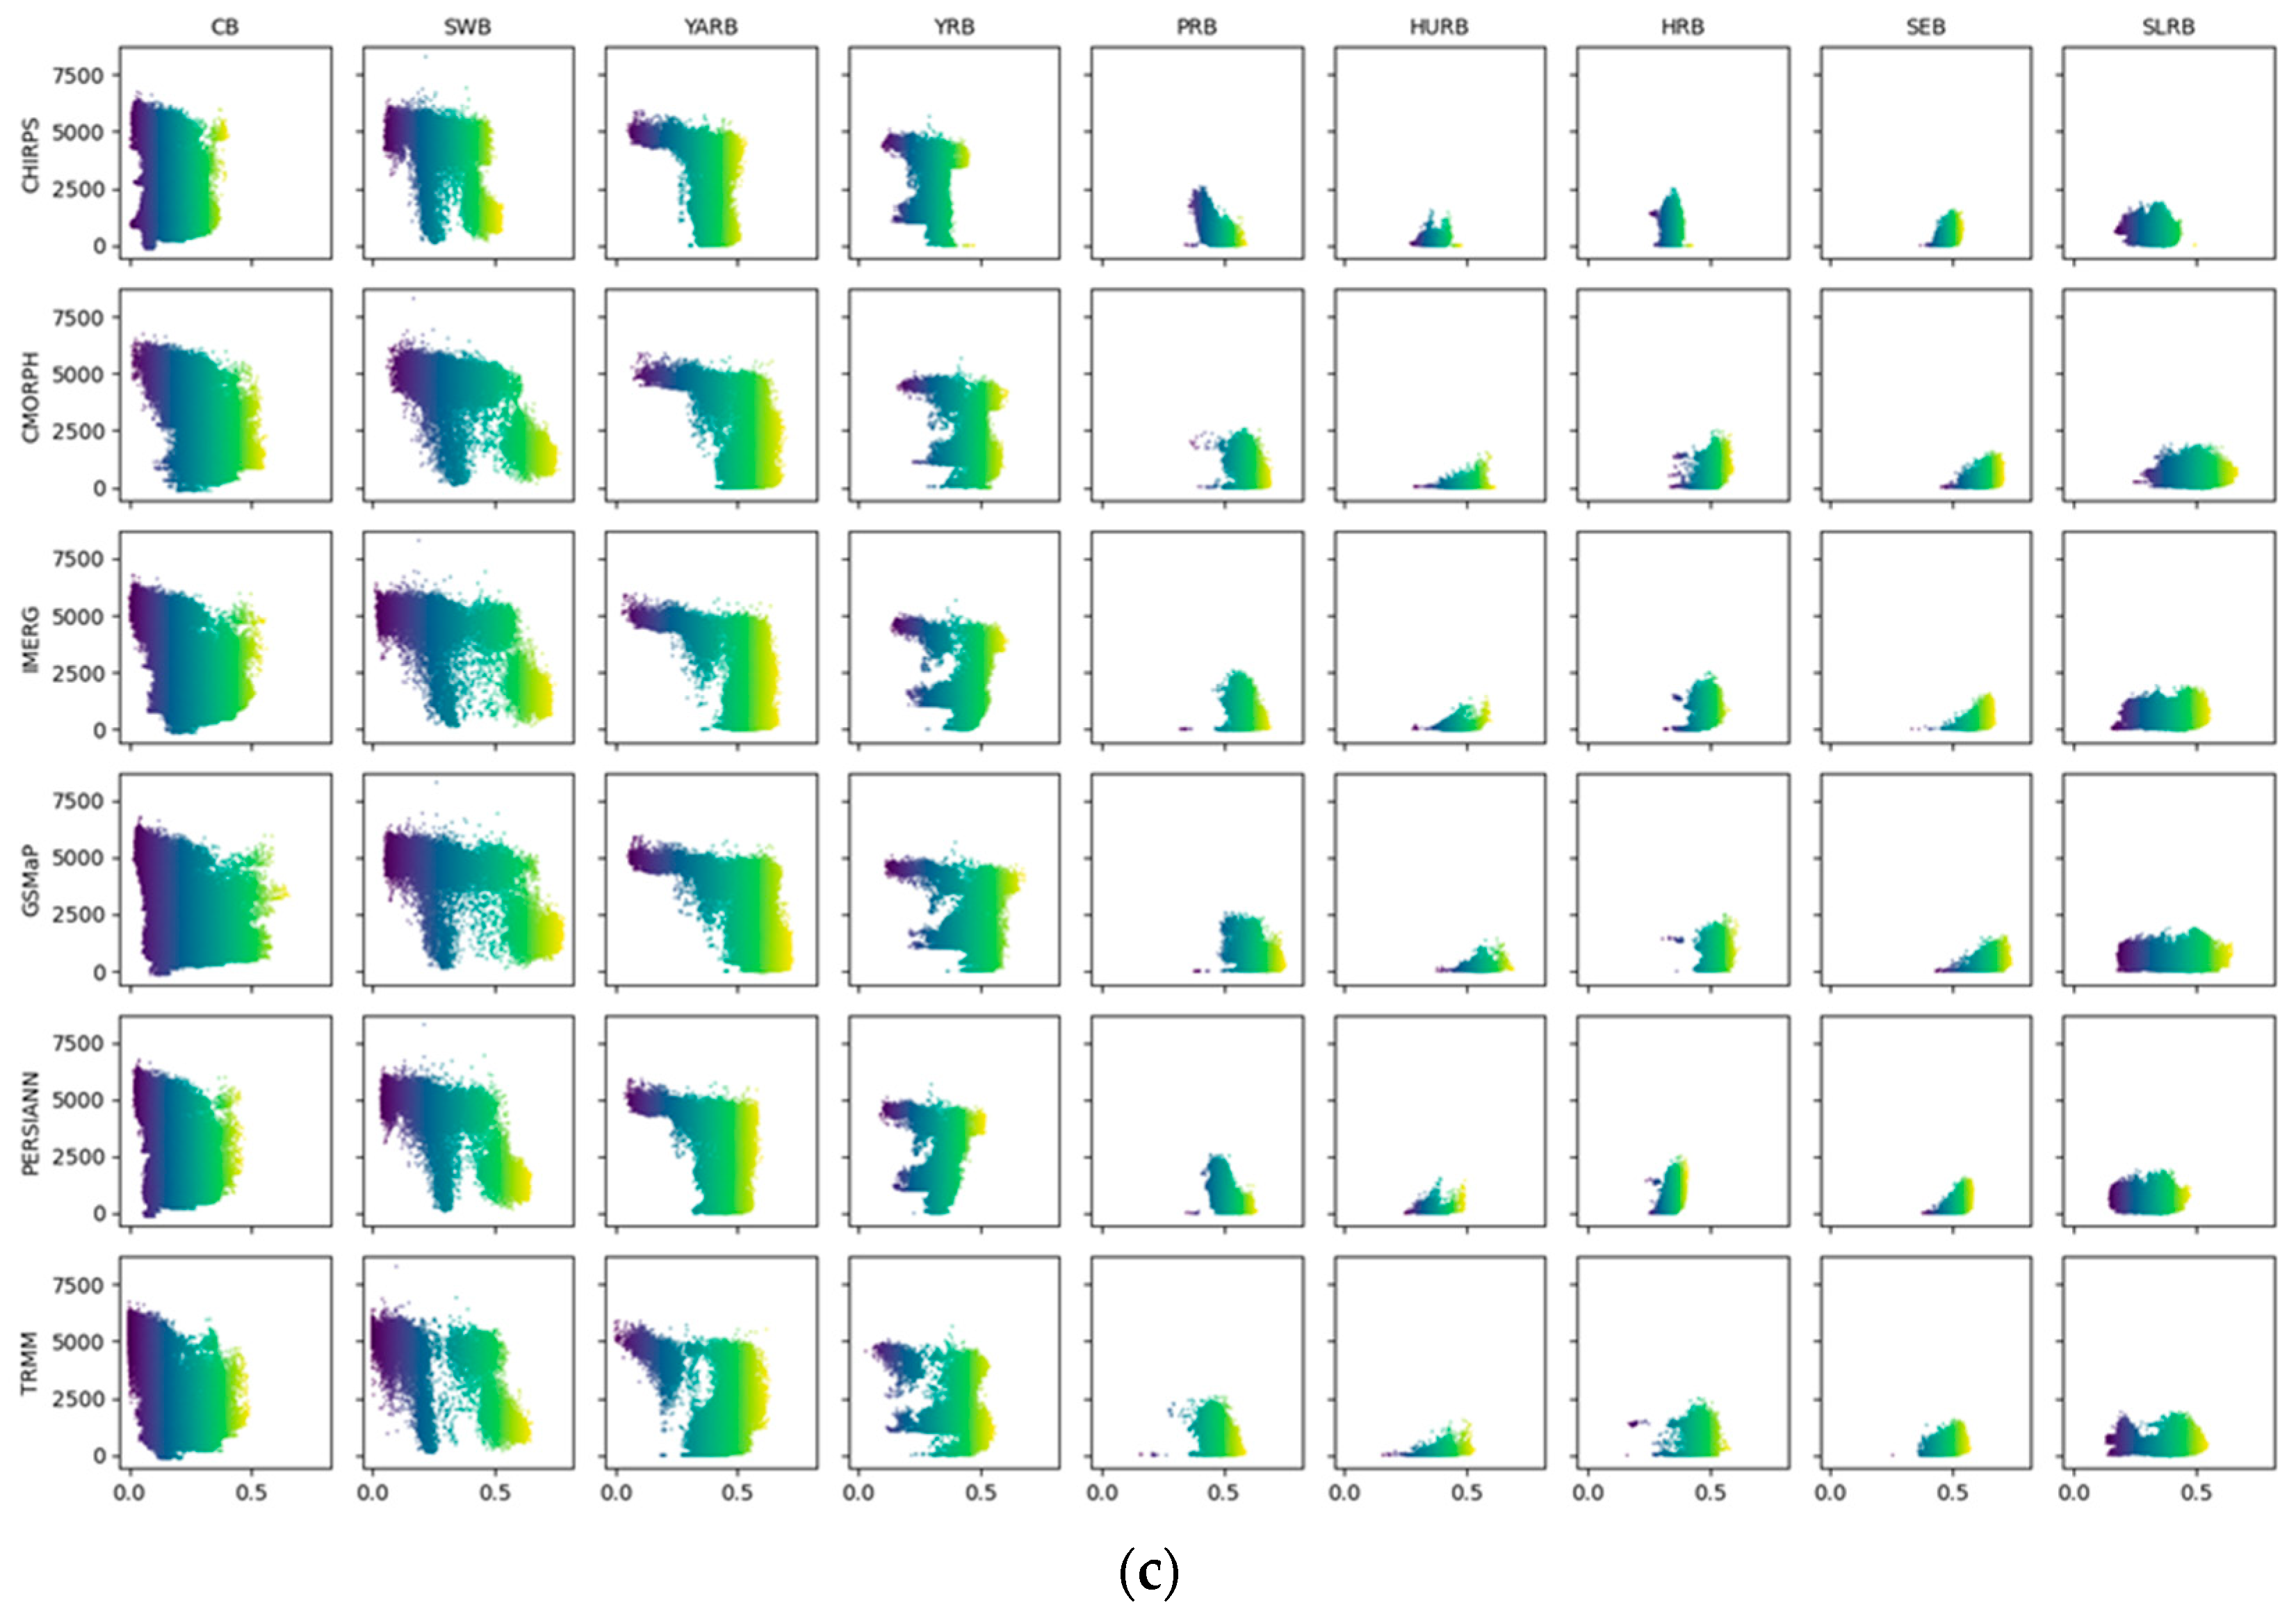
5.1. Influence of Elevation on SPPs

Researchers widely acknowledge the profound influence of topographical features on satellite precipitation observations [29,36,46,47]. In this study, scatter plots were generated to analyze three key indicators—CC, MAE, and CSI—in relation to elevation. The Tibetan Plateau in China typically ranges between 4000 and 5000 m, with elevations above 5000 m predominantly comprising mountain peaks. Kenawy et al. [48] concluded that microwave sensors exhibit greater accuracy in detecting precipitation over flat terrain compared to complex landscapes. Xu et al. [49] also pointed out that passive microwave algorithms have a strong dependence on ice content in the atmosphere. However, precipitation in high mountain regions predominantly results from the lifting of cold air, which typically lacks substantial ice content. Therefore, in Figure 11 and Figure 12, it can be observed that the CC and CSI of SPPs decreased rapidly above 5000 m elevation. Furthermore, Yu et al. [28] suggest that the diminishing number of rain gauges at higher elevations contributes to the reduction in evaluation indices of SPPs. Liu et al. [47] conducted an evaluation of TRMM at various elevations in southwestern China and similarly observed that TRMM struggles to accurately capture orographic rainfall due to complex terrain. Furthermore, the presence of cold surfaces and ice cover on mountaintops may be erroneously classified as rain clouds, leading to an overestimation of precipitation in mountainous regions. We maintain that this perspective still remains relevant to satellite rainfall products employing infrared sensors.

5.2. Uncertainties and Errors in SPPs

5.2.1. Observation of Light Rain and Drizzle in Continental Basin

In precipitation observation, light rain and drizzle have a high occurrence frequency, which is crucial for the Earth’s ecosystems, especially in arid and semi-arid areas, as light rain and drizzle can directly penetrate into the soil, ensuring a certain degree of moisture [50]. However, there is no unified definition of light rain and drizzle. In China’s meteorological observation operations, ground station precipitation measurements are only accurate to 0.1 mm. Rainfall within 0.1 and 10 mm/d is generally referred to as light rain, while rainfall within 0 and 0.1 mm/d is called drizzle. For drizzle, ground stations generally do not record it (treating it as 0) and consider it equivalent to no rain. Most previous studies referred to rainfall between 0.1 mm/d and 10 mm/d as light rain [35], while Hamada and Takayabu [51] consider rainfall at 0.1 mm/h as light rain (light precipitation). To facilitate statistics and analysis, we classify rainfall between 0.1 mm and 10 mm as light rain and rainfall between 0 and 0.1 mm as drizzle, following the prevailing practice in the meteorological observation field.
As can be inferred from the results and analysis presented above (Figure 5, Figure 6, Figure 9 and Figure 10), the CB exhibited the worst performance among the nine water resource regions in terms of all evaluation indicators, both at the daily and hourly scales. Almost all SPPs failed to demonstrate satisfactory performance in this basin. This can be attributed to the CB’s classification as an arid and semi-arid area, hosting the expansive Taklimakan Desert, the largest desert in China. The CB experiences minimal precipitation throughout the year, mostly in the form of light rain and drizzle. The observation errors and uncertainties of light rain and drizzle directly affect six of the evaluation indicator values shown in Table 2. We statistically analyzed the daily and hourly precipitation data of each grid in the CB from 2017 to 2022, calculating the frequency of light rain and drizzle occurrences at the daily and hourly scales. The results are presented in Table 3 and Table 4.
From Table 3 and Table 4, it can be seen that if the statistical unit was grid-based, the overall frequency of appearing non-rain, light rain, and light drizzle in CB reached over 98%, while the frequency of moderate rain and heavier precipitation events was less than 2%. Compared with the CLDAS, six SPPs generally overestimated the occurrence frequency of light rain and drizzle in CB. On the daily scale, TRMM and CLDAS had the best consistency in observing light rain and drizzle, but the frequency of light rain reached over 15.56%, while PERSIANN had the largest observation error, with a frequency of 48.19% for light rain. As representatives of the new generation of SPPs, GPM IMERG and GSMaP had observation frequencies of over 20% for light rain in CB, indicating that current satellite precipitation observation algorithms for detecting light rain and drizzle in arid regions still need to be improved. The study by Li et al. [52] indicates that the GPM IMERG precipitation product has a higher FAR in desert regions compared to mountainous areas, posing a challenge to GPM IMERGE. On an hourly scale, GSMaP and CLDAS showed more significant differences compared to CMORPH and GPM IMERG, with the frequency of non-rain periods decreasing to 73.09%, and the frequency of light drizzle periods increasing to 22.10%.

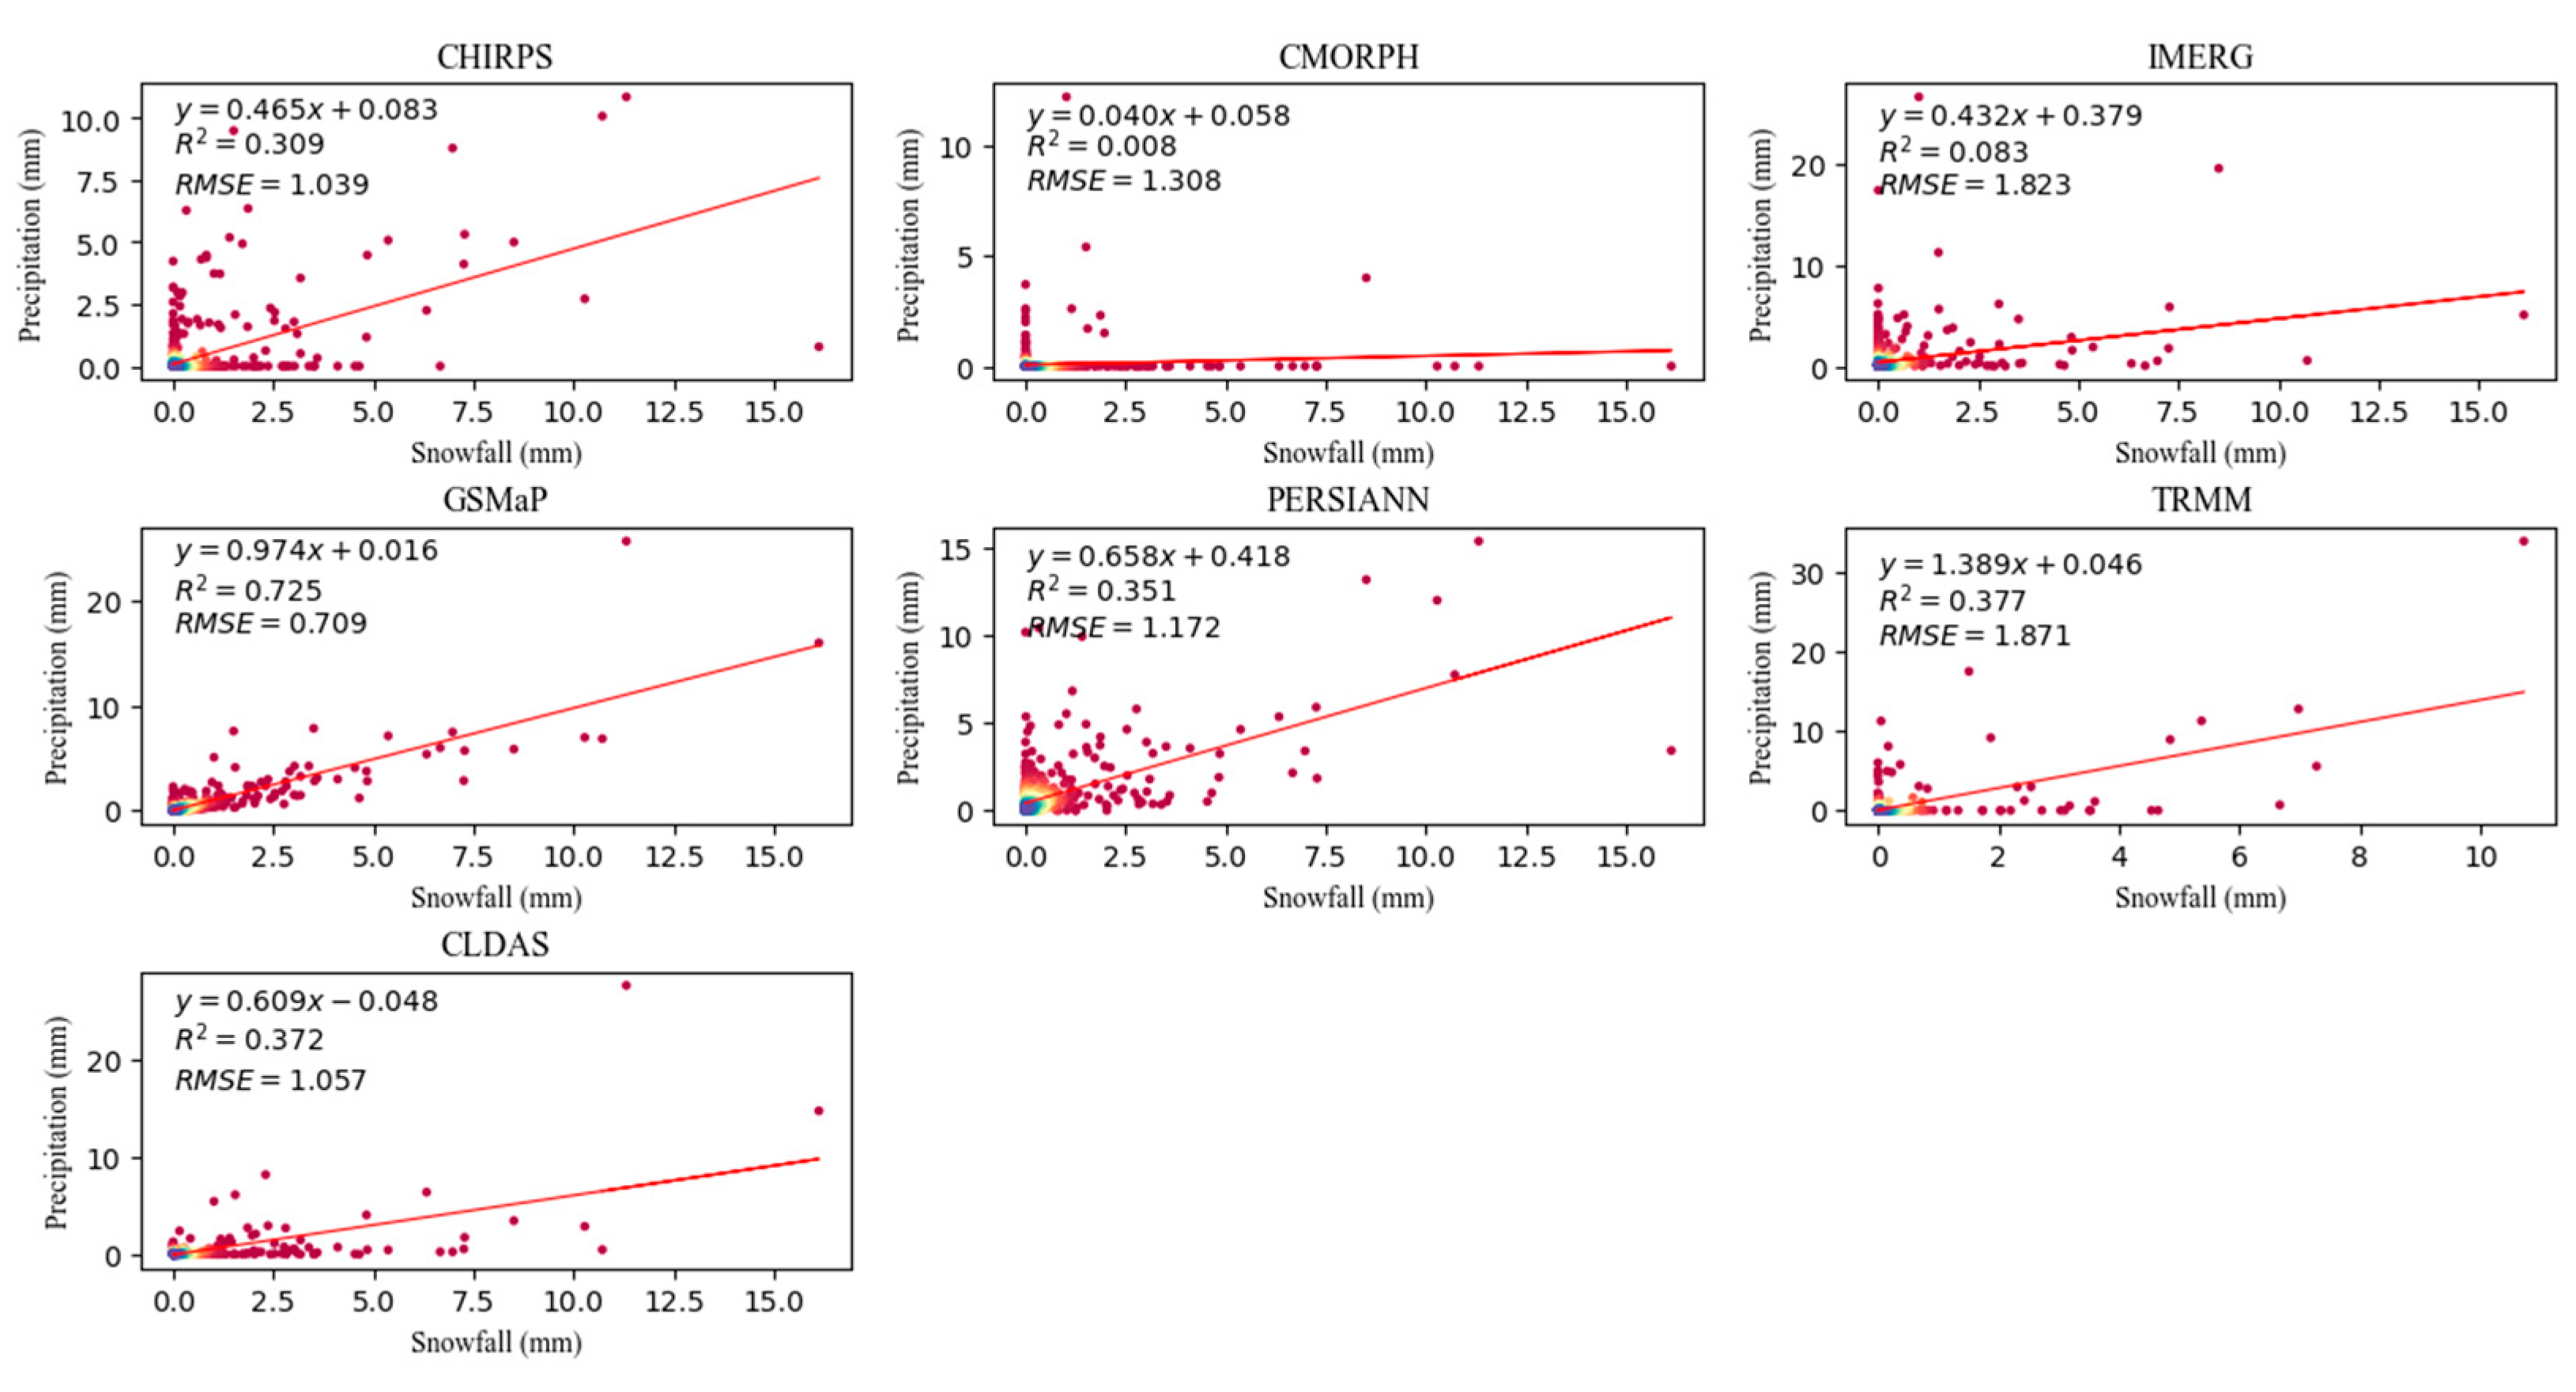
5.2.2. Observation of Snowfall in the Songhua and Liaohe River Basin

In the analysis of the impact of elevation on the performance of SPPs in Section 5.1 (Figure 11 and Figure 12), it can be observed that the performance of most basins gradually decreases with the increase in elevation. However, the SLRB exhibits an opposite pattern. Situated in a high-latitude region, the SLRB has unique climate characteristics, with a long winter and a short summer. During winter, precipitation predominantly manifests as snow. In contrast to the warm and humid winters experienced in southern China, where temperatures hover around 0 °C and rainfall and snowfall coexist, the SLRB endures frigid temperatures plummeting below −10 °C throughout the winter months (November to March). Such extreme cold renders conditions inhospitable for effective rainfall, transforming precipitation observation into essentially snowfall observation in this region.
As one of the three most important provincial capitals in the SLRB, Harbin has typical climate characteristics of high-latitude areas and boasts commendable records of snowfall events. This study downloaded daily and hourly snowfall data from January to March and November to December in Harbin from 2017 to 2022 from the WheatA agricultural meteorological big data software (http://www.wheata.cn/ (accessed on 19 April 2024)), aiming to compare and analyze the differences between ground snowfall monitoring data and satellite precipitation observation data within this high-latitude area of the SLRB.
Figure 13 shows the scatter plots of ground snow observation and satellite precipitation observation at the daily scale. It can be intuitively observed from the figure that the detection capabilities of CMORPH and IMERG for daily snowfall were the worst, and there was almost no correlation between rainfall data and snowfall data. In particular, CMORPH had serious false alarms (ground does not observe snowfall, but satellite observes rainfall) and missed alarms (ground observes snowfall, but satellite does not observe rainfall). CHIRPS, TRMM, PERSIANN, and CLDAS have similar detection capabilities for daily snowfall. However, TRMM exhibited larger RMSE errors compared to the other three precipitation products. Among the six SPPs, GSMaP demonstrated excellent snowfall detection capabilities, with better performance than CLDAS, an R2 value of 0.725, and an RMSE error of only 0.709.
We also compared the performance of three SPPs and CLDAS against ground snowfall observation data at the hourly scale (Figure 14). Unfortunately, none of the precipitation product’s hourly data met the criteria for detecting snowfall. The most obvious observation is that false and missed alarms are severe, with precipitation and snowfall data scattered widely along the horizontal and vertical axes. This indicates the inadequacy of satellite precipitation observation in detecting snowfall at the hourly scale, as well as there being a substantial gap from practical implementation. Indeed, determining the precipitation type (rain or snow) through satellite observation remains an immensely challenging task [53]. Li et al. [52] conducted an analysis of GPM IMERG data in Guizhou Province, situated in the Southwest Basin. Their findings revealed considerable errors, particularly in December, January, and February, with a staggering 80% of precipitation events going undetected during winter. During these three months, the precipitation characteristics in Guizhou Province are particularly complex, mainly consisting of freezing rain and snow mixed with rain [54].

6. Conclusions

This study evaluated and compared the performance of six SPPs (GSMaP, CHIRPS, CMORPH, PERISANN, GPM IMERG, and TRMM) in China’s nine water resource regions at both daily and hourly scales using six evaluation indices: CC, RMSE, MAE, POD, FAR, and CSI. By employing the fusion data product CLDAS-V2.0, the study conducted a meticulous grid-by-grid evaluation of the SPPs, providing a more intuitive visualization of the spatial distribution of observation accuracy. This study is of significant importance for the application of satellite rainfall products in flood forecasting, hydrological modeling, and water resource management. The study’s conclusions are as follows:
  • At the daily scale, GSMaP performed best overall in basins such as the HRB, HURB, PRB, SEB, YARB, and YRB, while CMORPH demonstrated the best overall performance in the CB, SLB, and SWB. At the hourly scale, CMORPH exhibited the strongest rainfall detection performance, while GSMaP demonstrated the best correlation in seven basins excluding the CB and SWB. This suggests that CMORPH is preferable for applications involving the statistical counting of precipitation occurrences, while GSMaP is suitable for hydrological model construction and similar applications in basins such as the HRB, HURB, PRB, SEB, SLRB, YARB, and YRB, whereas CMORPH is suitable for the CB and SWB.
  • The temporal scale effect was also an important factor affecting the accuracy of SPPs, manifested as follows: at the daily scale, SPPs exhibited stronger correlation and better monitoring performance, whereas at the hourly scale, the error level of SPPs was much lower than that at the daily scale. From our perspective, there were two reasons for this: (1) Observing precipitation accurately at smaller time scales is much more challenging than at larger time scales. (2) Errors accumulate over time at larger time scales. Helmi et al. [44] have thoroughly demonstrated this point through their comparison and analysis of RMSE values at daily, monthly, and annual scales.
  • The evaluation indices showed a gradient trend from southwest to southeast regions, mainly influenced by the spatial distribution of climate and terrain. Specifically, (1) although the error levels of six SPPs were relatively low in the arid climate of the CB, SWB, and YASB, their correlation was poor and reliability was low; (2) in the humid PRB and SEB, SPPs demonstrated stronger correlation but higher error levels; (3) the performance of SPPs decreased with increasing altitude, with a significantly higher reduction rate above 5000 m compared to regions below 5000 m. Among them, CMORPH effectively alleviated this downward trend.
  • The six SPPs generally exhibited a tendency to underestimate the frequency of no rainfall while overestimating the frequency of light rain and drizzle. At the daily scale, TRMM exhibited the closest observation frequency to CLDAS for light rain, drizzle, and no rainfall, while at the hourly scale, it was CMORPH. PERSIANN exhibited the poorest consistency with CLDAS at the daily scale, while at the hourly scale, it was GSMaP. Although GSMaP’s performance in observing light rain, drizzle, and no rainfall was relatively poor, its advantage lies in snowfall observation, surpassing other SPPs.
Future research endeavors should prioritize conducting more in-depth and comprehensive evaluations of satellite rainfall products. Observing extreme precipitation remains a significant challenge for SPPs. In terms of drought monitoring, although CMORPH has shown clear superiority over other SPPs, its accuracy still does not meet the demands of practical applications. This leads to a contradiction in the accuracy of drought and storm monitoring within basins covering various climatic zones such as the YARB, YRB, and SWB. Additionally, the accuracy of satellite precipitation products fluctuates significantly across different climatic zones, which can introduce unpredictable errors in the construction of hydrological models within these basins. Integrating ground-based monitoring and satellite-based observation precipitation data for hydrological simulation studies is currently a feasible approach. Moreover, beyond rainfall, there are many other forms of precipitation, such as snowfall, dew, frost, and rime. The observation of these forms of precipitation by SPPs is still very lacking. Although GSMaP has certain advantages in monitoring snowfall, further research is needed to validate its accuracy.

Author Contributions

H.G. conducted the primary experiments and cartography, as well as analyzing the results. D.S. provided the original idea for this paper. S.X., C.Z., F.B. and F.Y. actively participated throughout the research process and offered data support for this work. All authors have read and agreed to the published version of the manuscript.

Funding

This research was funded by the National Key Research and Development Program of China (grant number 2021YFC3200304), the National Natural Science Foundation of China (grant numbers 42077438 and 42371425), and the Fundamental Research Funds for the Central Universities (grant number CCNU22QN019).

Data Availability Statement

The data download sources used in this paper are shown in Table 1. Due to privacy and ethical concerns, the results data in this paper cannot be made available.

Acknowledgments

We would like to express appreciations to colleagues in the laboratory for their constructive suggestions. Also, we thank the anonymous reviewers and members of the editorial team for their constructive comments.

Conflicts of Interest

The authors declare no conflicts of interest.

References

  1. Sarojini, B.; Stott, P.; Black, E. Detection and attribution of human influence on regional precipitation. Nat. Clim. Chang. 2016, 6, 669–675. [Google Scholar] [CrossRef]
  2. Kidd, C.; Becker, A.; Huffman, G.; Muller, C.; Joe, P.; Jackson, G.; Kirschbaum, D. So, How Much of the Earth’s Surface Is Covered by Rain Gauges? Bull. Am. Meteorol. Soc. 2016, 98, 69–78. [Google Scholar] [CrossRef] [PubMed]
  3. Huffman, G.; Adler, R.; Morrissey, M.; Bolvin, D.; Curtis, S.; Joyce, R.; McGavock, B.; Susskind, J. Global Precipitation at One-Degree Daily Resolution from Multisatellite Observations. J. Hydrometeorol. 2001, 2, 36–50. [Google Scholar] [CrossRef]
  4. Zhang, J.; Howard, K.; Langston, C.; Vasiloff, S.; Kaney, B.; Arthur, A.; Van Cooten, S.; Kelleher, K.; Kitzmiller, D.; Ding, F.; et al. National Mosaic and Multi-sensor QPE (NMQ) System-Description, Results and Future Plans. Bull. Am. Meteorol. Soc. 2011, 92, 1321–1338. [Google Scholar] [CrossRef]
  5. Kubota, T.; Shige, S.; Hashizume, H.; Ushio, T.; Aonashi, K.; Kachi, M.; Okamoto, K. Global Precipitation Map using Satelliteborne Microwave Radiometers by the GSMaP Project: Production and Validation. IEEE Int. Symp. Geosci. Remote Sens. 2006, 45, 2584–2587. [Google Scholar] [CrossRef]
  6. Ashouri, H.; Hsu, K.; Sorooshian, S.; Braithwaite, D.K.; Knapp, K.R.; Cecil, L.D.; Nelson, B.R.; Prat, O.P. PERSIANN-CDR: Daily Precipitation Climate Data Record from Multisatellite Observations for Hydrological and Climate Studies. Bull. Am. Meteorol. Soc. 2015, 96, 69–83. [Google Scholar] [CrossRef]
  7. Joyce, R.; Janowiak, J.; Arkin, P.; Xie, P. CMORPH: A Method That Produces Global Precipitation Estimates from Passive Microwave and Infrared Data at High Spatial and Temporal Resolution. J. Hydrometeorol. 2004, 5, 487–503. [Google Scholar] [CrossRef]
  8. Funk, C.; Peterson, P.; Landsfeld, M.; Pedreros, D.; Verdin, J.; Shulka, S.; Husak, G.; Rowland, J.; Harrison, L.; Hoell, A.; et al. The climate hazards infrared precipitation with stations—A new environmental record for monitoring extremes. Sci. Data 2015, 2, 150066. [Google Scholar] [CrossRef] [PubMed]
  9. Huffman, G.J.; Bolvin, D.T.; Nelkin, E.J.; Wolff, D.B.; Adler, R.F.; Gu, G.; Hong, Y.; Bowman, K.P.; Stocker, E.F. The TRMM Multisatellite Precipitation Analysis (TMPA): Quasi-Global, Multiyear, Combined-Sensor Precipitation Estimates at Fine Scales. J. Hydrometeorol. 2007, 8, 38–55. [Google Scholar] [CrossRef]
  10. Hou, A.Y.; Kakar, R.K.; Neeck, S.; Azarbarzin, A.A.; Kummerow, C.D.; Kojima, M.; Oki, R.; Nakamura, K.; Iguchi, T. The Global Precipitation Measurement Mission. Bull. Am. Meteorol. Soc. 2014, 95, 701–722. [Google Scholar] [CrossRef]
  11. Mekonnen, K.; Melesse, A.; Woldesenbet, T.A. How suitable are satellite rainfall estimates in simulating high flows and actual evapotranspiration in MelkaKunitre catchment, Upper Awash Basin, Ethiopia? Sci. Total Environ. 2021, 806, 150443. [Google Scholar] [CrossRef] [PubMed]
  12. Jiang, S.; Ding, Y.; Liu, R.; Wei, L.; Liu, Y.; Ren, M.; Ren, J. Assessing the Potential of IMERG and TMPA Satellite Precipitation Products for Flood Simulations and Frequency Analyses over a Typical Humid Basin in South China. Remote Sens. 2022, 14, 4406. [Google Scholar] [CrossRef]
  13. Ma, Q.; Li, Y.; Feng, H.; Yu, Q.; Zou, Y.; Liu, F.; Pulatov, B. Performance evaluation and correction of precipitation data using the 20-year IMERG and TMPA precipitation products in diverse subregions of China. Atmos. Res. 2021, 249, 105304. [Google Scholar] [CrossRef]
  14. Sun, Q.; Miao, C.; Duan, Q.; Ashouri, H.; Sorooshian, S.; Hsu, K. A Review of Global Precipitation Data Sets: Data Sources, Estimation, and Intercomparisons. Rev. Geophys. 2017, 56, 79–107. [Google Scholar] [CrossRef]
  15. Paredes, F.; Barbosa, H.; Kumar, T.; Thakur, M.; Buriti, C. Assessment of the CHIRPS-Based Satellite Precipitation Estimates. In Inland Waters-Dynamics and Ecology; IntechOpen: London, UK, 2020. [Google Scholar] [CrossRef]
  16. Sunilkumar, K.; Yatagai, A.; Masuda, M. Preliminary evaluation of GPM-IMERG rainfall estimates over three distinct climate zones with APHRODITE. Earth Space Sci. 2019, 6, 1321–1335. [Google Scholar] [CrossRef]
  17. Roy, D.; Hassan, S.M.Q.; Sultana, S.S. An Assessment of Spatial Distribution of Four Different Satellite-Derived Rainfall Estimations and Observed Precipitation over Bangladesh. J. Agric. Chem. Environ. 2020, 9, 195–205. [Google Scholar] [CrossRef]
  18. Hussain, Y.; Satge, F.; Hussain, M.B.; Martínez-Carvajal, H.; Bonnet, M.; Cárdenas-Soto, M.; Roig, H.; Akhter, G. Performance of CMORPH, TMPA and PERSIANN rainfall datasets over plain, mountainous and glacial regions of Pakistan. Theor. Appl. Climatol. 2018, 131, 1119–1132. [Google Scholar] [CrossRef]
  19. Anjum, M.N.; Irfan, M.; Waseem, M.; Leta, M.K.; Niazi, U.; Rahman, S.; Ghanim, A.; Mukhtar, M.; Nadeem, M. Assessment of PERSIANN-CCS, PERSIANN-CDR, SM2RAIN-ASCAT, and CHIRPS-2.0 Rainfall Products over a Semi-Arid Subtropical Climatic Region. Water 2022, 14, 147. [Google Scholar] [CrossRef]
  20. Sarpong, K.; Xu, W.; Mensah-Akoto, J.; Neequaye, J.; Dadzie, A.; Frimpong, O. Waterscape, State and Situation of China’s Water Resources. J. Geosci. Environ. Prot. 2020, 8, 26–51. [Google Scholar] [CrossRef]
  21. Zhou, H.; Ning, S.; Li, D.; Pan, X.; Li, Q.; Zhao, M.; Tang, X. Assessing the Applicability of Three Precipitation Products, IMERG, GSMaP, and ERA5, in China over the Last Two Decades. Remote Sens. 2023, 15, 4154. [Google Scholar] [CrossRef]
  22. Yuan, F.; Wang, B.; Shi, C.; Cui, W.; Zhao, C.; Liu, Y.; Ren, L.; Zhang, L.; Zhu, Y.; Chen, T.; et al. Evaluation of hydrological utility of IMERG Final Run V05 and TMPA 3B42V7 satellite precipitation products in the Yellow River source region, China. J. Hydrol. 2018, 567, 696–711. [Google Scholar] [CrossRef]
  23. Zhang, L.; Chen, X.; Lai, R.; Zhu, Z. Performance of satellite-based and reanalysis precipitation products under multi-temporal scales and extremes weather in mainland China. J. Hydrol. 2022, 605, 127389. [Google Scholar] [CrossRef]
  24. Su, J.; Lü, H.; Zhu, Y.; Wang, X.; Wei, G. Component Analysis of Errors in Four GPM-Based Precipitation Estimations over Mainland China. Remote Sens. 2018, 10, 1420. [Google Scholar] [CrossRef]
  25. Jiang, S.; Ren, L.; Xu, C.; Yong, B.; Yuan, F.; Liu, Y.; Yang, X.; Zeng, X. Statistical and hydrological evaluation of the latest Integrated Multi-satellitE Retrievals for GPM (IMERG) over a midlatitude humid basin in South China. Atmos. Res. 2018, 214, 418–429. [Google Scholar] [CrossRef]
  26. Xiao, S.; Xia, J.; Zou, L. Evaluation of Multi-Satellite Precipitation Products and Their Ability in Capturing the Characteristics of Extreme Climate Events over the Yangtze River Basin, China. Water 2020, 12, 1179. [Google Scholar] [CrossRef]
  27. Xu, J.; Ma, Z.; Yan, S.; Peng, J. Do ERA5 and ERA5-land precipitation estimates outperform satellite-based precipitation products? A comprehensive comparison between state-of-the-art model-based and satellite-based precipitation products over mainland China. J. Hydrol. 2022, 605, 127353. [Google Scholar] [CrossRef]
  28. Yu, C.; Hu, D.; Liu, M.; Wang, S.; Di, Y. Spatio-temporal accuracy evaluation of three high-resolution satellite precipitation products in China area. Atmos. Res. 2020, 241, 104952. [Google Scholar] [CrossRef]
  29. Zhang, L.; Li, X.; Cao, Y.; Nan, Z.; Wang, W.; Ge, Y.; Wang, P.; Yu, W. Evaluation and integration of the top-down and bottom-up satellite precipitation products over mainland China. J. Hydrol. 2020, 581, 124456. [Google Scholar] [CrossRef]
  30. Tang, G.; Clark, M.P.; Papalexiou, S.M.; Ma, Z.; Hong, Y. Have satellite precipitation products improved over last two decades? A comprehensive comparison of GPM IMERG with nine satellite and reanalysis datasets. Remote Sens. Environ. 2020, 240, 111697. [Google Scholar] [CrossRef]
  31. Xu, W.; Lei, X.; Chen, S.; Yu, T.; Hu, Z.; Zhang, M.; Jiang, L.; Bao, R.; Guan, X.; Ma, M.; et al. How Well Does the ERA5 Reanalysis Capture the Extreme Climate Events Over China? Part II: Extreme Temperature. Front. Environ. Sci. 2022, 10, 921659. [Google Scholar] [CrossRef]
  32. Ma, L.; Zhao, L.; Tian, L.; Yuan, L.; Xiao, Y.; Zhang, L.; Zou, D.; Qiao, Y. Evaluation of the integrated multi-satellite retrievals for global precipitation measurement over the Tibetan Plateau. J. Mt. Sci. 2019, 16, 1500–1514. [Google Scholar] [CrossRef]
  33. Zhang, T.; Yang, Y.; Dong, Z.; Gui, S. A Multiscale Assessment of Three Satellite Precipitation Products (TRMM, CMORPH, and PERSIANN) in the Three Gorges Reservoir Area in China. Adv. Meteorol. 2021, 2021, 9979216. [Google Scholar] [CrossRef]
  34. Zhou, Z.; Guo, B.; Xing, W.; Zhou, J.; Xu, F.; Xu, Y. Comprehensive evaluation of latest GPM era IMERG and GSMaP precipitation products over mainland China. Atmos. Res. 2020, 246, 105132. [Google Scholar] [CrossRef]
  35. Meng, C.; Mo, X.; Liu, S.; Hu, S. Extensive evaluation of IMERGE precipitation for both liquid and solid in Yellow River source region. Atmos. Res. 2021, 256, 105570. [Google Scholar] [CrossRef]
  36. Yang, F.; Lu, H.; Yang, K.; He, J.; Wang, W.; Wright, J.S.; Li, C.; Han, M.; Li, Y. Evaluation of multiple forcing data sets for precipitation and shortwave radiation over major land areas of China. Hydrol. Earth Syst. Sci. 2017, 21, 5805–5821. [Google Scholar] [CrossRef]
  37. CMA (The China Meteorological Administration). China Meteorological Administration Land Surface Data Assimilation System (CLDAS-V2.0) Near Real-Time Product Dataset. 2024. Available online: https://data.cma.cn/data/cdcdetail/dataCode/NAFP_CLDAS2.0_NRT.html (accessed on 19 April 2024).
  38. Bai, B.; Cheng, Y.-P.; Jiang, Z.-C.; Zhang, C. Climate change and groundwater resources in China. J. Groundw. Sci. Eng. 2017, 5, 44–52. [Google Scholar] [CrossRef]
  39. Chen, X.; Wang, L.; Jia, L.; Jia, T. China’s water resources in 2020. China Geol. 2021, 4, 536–538. [Google Scholar] [CrossRef]
  40. Xu, X.; Zhang, F.; Deng, H.; He, B.; Tian, H.; Fang, Y. Changes in Precipitation Grades in China from 1961–2020. Res. Soil Water Conserv. 2024, 31, 181–189. [Google Scholar] [CrossRef]
  41. Zhang, Y.; Wu, C.; Yeh, P.J.-F.; Li, J.; Hu, B.X.; Feng, P. Evaluation and comparison of precipitation estimates and hydrologic utility of CHIRPS, TRMM 3B42 V7 and PERSIANN-CDR products in various climate regimes. Atmos. Res. 2022, 265, 105881. [Google Scholar] [CrossRef]
  42. Yin, L.; Zhang, J.; Wang, Z.; Dong, J.; Chang, L.; Li, C.; Zhang, P.; Gu, X.; Nie, Z. Groundwater circulation patterns and its resources assessment of inland river catchments in northwestern China. Geol. China 2021, 48, 1094–1111. [Google Scholar]
  43. Yang, X.; Lu, Y.; Tan, M.L.; Li, X.; Wang, G.; He, R. Nine-Year Systematic Evaluation of the GPM and TRMM Precipitation Products in the Shuaishui River Basin in East-Central China. Remote Sens. 2020, 12, 1042. [Google Scholar] [CrossRef]
  44. Helmi, A.M.; Abdelhamed, M.S. Evaluation of CMORPH, PERSIANN-CDR, CHIRPS V2.0, TMPA 3B42 V7, and GPM IMERG V6 Satellite Precipitation Datasets in Arabian Arid Regions. Water 2023, 15, 92. [Google Scholar] [CrossRef]
  45. Gao, Z.; Huang, B.; Ma, Z.; Chen, X.; Qiu, J.; Liu, D. Comprehensive Comparisons of State-of-the-Art Gridded Precipitation Estimates for Hydrological Applications over Southern China. Remote Sens. 2020, 12, 3997. [Google Scholar] [CrossRef]
  46. Yong, B.; Hong, Y.; Ren, L.; Gourley, J.; Huffman, G.; Chen, X.; Wang, W.; Khan, S. Assessment of evolving TRMM-based multisatellite real-time precipitation estimation methods and their impacts on hydrologic prediction in a high latitude basin. J. Geophys. Res. Atmos. 2012, 117, 9108. [Google Scholar] [CrossRef]
  47. Liu, M.; Xu, X.; Sun, A.; Wang, K.; Yue, Y.; Tong, X.; Liu, W. Evaluation of high-resolution satellite rainfall products using rain gauge data over complex terrain in southwest China. Theor. Appl. Climatol. 2014, 119, 203–219. [Google Scholar] [CrossRef]
  48. Kenawy, A.; López-Moreno, J.I.; McCabe, M.; Vicente-Serrano, S. Evaluation of the TMPA-3B42 precipitation product using a high-density rain gauge network over complex terrain in northeastern Iberia. Glob. Planet. Chang. 2015, 133, 188–200. [Google Scholar] [CrossRef]
  49. Xu, R.; Tian, F.; Yang, L.; Hu, H.; Lu, H.; Hou, A. Ground validation of GPM IMERG and TRMM 3B42V7 rainfall products over southern Tibetan Plateau based on a high-density rain gauge network. J. Geophys. Res. Atmos. 2017, 122, 910–924. [Google Scholar] [CrossRef]
  50. Trenberth, K.E. Changes in precipitation with climate change. Clim. Res. 2011, 47, 123–138. [Google Scholar] [CrossRef]
  51. Hamada, A.; Takayabu, Y. Improvements in Detection of Light Precipitation with the Global Precipitation Measurement Dual-Frequency Precipitation Radar (GPM DPR). J. Atmos. Ocean. Technol. 2016, 33, 653–667. [Google Scholar] [CrossRef]
  52. Li, X.; Sungmin, O.; Wang, N.; Huang, Y. Evaluation of the GPM IMERG V06 products for light rain over Mainland China. Atmos. Res. 2021, 253, 105510. [Google Scholar] [CrossRef]
  53. Jennings, K.S.; Winchell, T.S.; Livneh, B.; Molotch, N.P. Spatial variation of the rain-snow temperature threshold across the Northern Hemisphere. Nat. Commun. 2018, 9, 1148. [Google Scholar] [CrossRef] [PubMed]
  54. Liao, Z.; Zhai, P.M.; Chen, Y.; Lu, H. Differing mechenisms for the 2008 and 2016 wintertime cold events in southern China. Int. J. Climatol. 2020, 40, 4944–4955. [Google Scholar] [CrossRef]
Figure 1. Location of the nine major water resource regions in China.
Remotesensing 16 01516 g001
Figure 2. Spatial distribution of average precipitation in nine water resource regions for SPPs: (a) daily scale; (b) hourly scale.
Remotesensing 16 01516 g002aRemotesensing 16 01516 g002b
Figure 3. Daily scale statistical indicator box plots for nine water resource regions: (a) CC; (b) RMSE; (c) MAE.
Remotesensing 16 01516 g003
Figure 4. Daily scale classification indicator box plots for nine water resource regions: (a) POD; (b) FAR; (c) CSI.
Remotesensing 16 01516 g004
Figure 5. Spatial distribution of daily scale statistical indicators for the nine water resource regions: (a) CC; (b) RMSE; (c) MAE.
Remotesensing 16 01516 g005
Figure 6. Spatial distribution of daily scale classification indicators for the nine water resource regions: (a) POD; (b) FAR; (c) CSI.
Remotesensing 16 01516 g006
Figure 7. Hourly scale statistical indicator box plots for nine water resource regions: (a) CC; (b) RMSE; (c) MAE.
Remotesensing 16 01516 g007
Figure 8. Hourly scale classification indicator box plots for nine water resource regions: (a) POD; (b) FAR; (c) CSI.
Remotesensing 16 01516 g008
Figure 9. Spatial distribution of hourly scale statistical indicators for the nine water resource regions: (a) CC; (b) RMSE; (c) MAE.
Remotesensing 16 01516 g009
Figure 10. Spatial distribution of hourly scale classification indicators for the nine water resource regions: (a) POD; (b) FAR; (c) CSI.
Remotesensing 16 01516 g010aRemotesensing 16 01516 g010b
Figure 11. Daily scale indicators and elevation scatter plots of the nine water resource regions: (a) CC; (b) MAE; (c) CSI. In these figures, the color transitions from blue to yellow, representing an increase in the index.
Remotesensing 16 01516 g011aRemotesensing 16 01516 g011b
Figure 12. Hourly scale indicators and elevation scatter plots of the nine water resource regions: (a) CC; (b) MAE; (c) CSI. In these figures, the color transitions from blue to yellow, representing an increase in the index.
Remotesensing 16 01516 g012aRemotesensing 16 01516 g012b
Figure 13. Scatter plots of winter daily scale snowfall monitoring data and satellite precipitation data in Harbin City, 2017–2022. In the figure, the straight line represents the fitted line of the scatter plot; the color transitions from red to blue, indicating an increasing point density.
Remotesensing 16 01516 g013
Figure 14. Scatter plots of winter hourly scale snowfall monitoring data and satellite precipitation data in Harbin City, 2017–2022. In the figure, the straight line represents the fitted line of the scatter plot; the color transitions from red to blue, indicating an increasing point density.
Remotesensing 16 01516 g014
Table 1. Parameters of six SPPs and data sources.
SPPTemporal ResolutionSpatial ResolutionDate RangeData SourceFormat
CHIRPS-2.01 d0.25° × 0.25°2017~2022https://data.chc.ucsb.edu (accessed on 19 April 2024)TIFF
CMORPH1 h/1 d0.25° × 0.25°2017~2022https://www.ncei.noaa.gov (accessed on 19 April 2024)NC
GPM IMERG Final0.5 h/1 d0.1° × 0.1°2017~2021https://search.earthdata.nasa.gov (accessed on 19 April 2024)NC
GSMaP_Guage V61 h/1 d0.1° × 0.1°2017~2022https://sharaku.eorc.jaxa.jp (accessed on 19 April 2024)DAT
PERSIANN-CDR1 d0.25° × 0.25°2017~2022https://chrsdata.eng.uci.edu (accessed on 19 April 2024)TIFF
TRMM 3B42V71 d0.25° × 0.25°2017~2019https://search.earthdata.nasa.gov/search (accessed on 19 April 2024)NC
Table 2. Calculation formulas and optimal values of six evaluation indices.
Accuracy Evaluation IndicatorFormulaOptimal Value
CC C C = i = 1 n ( C i     C ¯ ) ( S i     S ¯ ) i = 1 n ( C i     C ¯ ) 2 × i = 1 n ( S i     S ¯ ) 2 1
RMSE R M S E = 1 n × i = 1 n ( S i C i ) 2 0
MAE MAE = i = 1 n S i     C i n 0
POD P O D = H H   +   M 1
FAR F A R = F H   +   F 0
CSI C S I = H H   +   M   +   F 1
Table 3. Daily rainfall frequency of light rain and drizzle in CB.
Rainfall (mm/d)BenchmarkSatellite Precipitation Products (SPPs)
CLDASCHIRPSCMORPHIMERGGSMaPPERSIANNTRMM
Non-rain: [0]88.75%73.96%75.89%61.18%66.64%39.68%81.94%
Light drizzle: (0, 0.1]0.36%6.58%3.73%15.77%8.68%11.67%1.38%
Light rain: (0.1, 10]9.99%18.47%18.84%22.14%23.93%48.19%15.56%
Total99.10%99.01%98.46%99.09%99.25%99.54%98.88%
Table 4. Hourly rainfall frequency of light rain and drizzle in CB.
Rainfall (mm/h)BenchmarkSatellite Precipitation Products (SPPs)
CLDASCMORPHIMERGGSMaP
Non-rain: [0]98.19%94.39%91.75%73.09%
Light drizzle: (0, 0.1]0.09%2.36%4.99%22.10%
Light rain: (0.1, 10]1.70%3.22%3.24%4.80%
Total99.98%99.97%99.98%99.99%
Disclaimer/Publisher’s Note: The statements, opinions and data contained in all publications are solely those of the individual author(s) and contributor(s) and not of MDPI and/or the editor(s). MDPI and/or the editor(s) disclaim responsibility for any injury to people or property resulting from any ideas, methods, instructions or products referred to in the content.

