
Spatiotemporal Evolution and Causal Analysis of Rural Tourism Popularity in Jilin Province Based on Multiple Data

1
School of Geographical Sciences, Northeast Normal University, Changchun 130024, China
2
School of Tourism and Geographical Sciences, Baicheng Normal University, Baicheng 137000, China
3
Institute of Tourism Planning and Development, Beijing Union University, Beijing 100101, China
*
Author to whom correspondence should be addressed.
Sustainability 2024, 16(9), 3637; https://0-doi-org.brum.beds.ac.uk/10.3390/su16093637
Submission received: 19 March 2024
/
Revised: 21 April 2024
/
Accepted: 24 April 2024
/
Published: 26 April 2024
Abstract
:The digital age provides greater possibilities for quantitative research on rural tourism. This article examines Jilin Province as a case and analyzes the interannual, monthly, and holiday characteristics of rural tourism heat using big data. Using A-level rural tourism operating units as research samples, a mathematical model is constructed to evaluate the rural tourism heat from 2016 to 2021. Through a trend surface analysis and kernel density analysis, the spatiotemporal differentiation characteristics are explored; additionally, the spatial evolution law of the rural tourism hot and cold pattern is analyzed using counties as units. The research results show the following: (1) As an important component of the Jilin tourism industry, temporally, rural tourism has an overall trend of increasing popularity, with clear seasonal and holiday distribution patterns. Simultaneously, the periodic sporadic occurrence of the COVID-19 epidemic caused an obvious vulnerability in rural tourism fever. (2) Spatially, the structure of rural tourism shows an evolutionary process of “single core → multi core” and a diffusion trend of “central → eastern” and “central → western”. (3) Regarding the influencing factors, transportation conditions and resource endowments are dominant, and the impact of the economic development level is gradually weakening, while the impact of the ecological environment and industrial foundation is gradually increasing.
1. Introduction
The essence of tourism is for tourists to enjoy a leisure experience in a different place for pleasure. Therefore, rural tourism based on local content and context has become an important product for urban residents to pursue as differentiated tourism experiences in the era of mass tourism [1]. China’s 14th Five-Year Plan period is an important node for consolidating and expanding poverty alleviation, and effectively connecting with rural revitalization [2]. Promoting rural revitalization through rural tourism is an important breakthrough in the traditional concept of linear development driven by urbanization and industrialization in rural areas. It is a key path to achieving the ecological and industrial development of rural industries under the “three new ideas” policy and has important theoretical value and practical significance for the co-ordinated development of urban and rural areas, as well as rural industry reconstruction in the new era [3,4]. In the early stage of the 2019 epidemic, the total number of rural tourists in China exceeded 3 billion, accounting for more than half of the total number of tourists nationally. In 2020, owing to COVID-19, the number of tourists across the country dropped sharply, and the number of domestic tourists was 2.879 billion, only 47.9% of that in 2019. Affected by national policies, economic forms, social environment, travel motivation and other factors, rural tourism with a short travel radius, a low per capita consumption, and a positive ecological environment impact maintained high growth despite adversity. This still accounted for nearly 50% of the total number of tourists nationwide, indicating an agricultural transformation, and the increase in farmers’ income and rural development provided diversified development momentum.
Since the 1980s, rural tourism has attracted the attention of international scholars. It has not only become a focus of government decision-making departments, but also a hot topic of research for domestic and foreign scholars and rural tourism enterprises. The research on rural tourism in foreign countries is gradually shifting from macro- to micro-level analysis, with clear targeting [5]. The research mainly focuses on the concept of rural tourism [6], rural tourism scenarios [7], tourist behavior characteristics [8], and rural tourism strategies and management [9]. The research methods mainly include speculative methods [10,11], exploratory methods [12], and comprehensive methods [13]. The research on rural tourism in China has a clear policy orientation, with research content mainly focusing on rural tourism resources [14], rural tourism poverty alleviation [15], industrial integration and sustainable development [16], and timely rural revitalization. The research methods mainly include the Delphi method [17], economic model [18], and big data analysis method [19]. A literature review showed that, due to the wide spatial distribution, large quantity, and small scale of rural tourism sites, it is difficult to obtain quantitative statistical data. Therefore, qualitative methods such as survey questionnaires and interviews are mainly used. With the continuous development of China’s digital economy, the arrival of the big data era has brought more possibilities for quantitative research on rural tourism, effectively compensating for the problems of a limited sample size and insufficient information in traditional rural tourism research [20]. Currently, research on big data in the tourism industry mainly focuses on the following aspects: first, exploring the attention of tourism networks through Ordered Target Area (OTA) platforms such as Weibo, Qunar, Ctrip, Dianping, and Mafengwo through index analysis [21], word frequency analysis [22,23], and popularity analysis. The second is the study of the spatiotemporal flow characteristics and spatial distribution of tourists based on geographic marker images [24,25]. Thirdly, through a keyword and word frequency analysis on search engines, more accurate predictions can be made on the number of tourists in a certain period of time in the future [26]. The existing research on big data mining and analysis mainly focuses on high-level scenic spots (resorts) in hot tourist areas, with a small sample size selected for research, a short research time limit, and the inability to objectively evaluate their spatial evolution process. How to define the scale, accuracy, and reliability of big data, as well as the integration and utilization of multi-source data, has become a focus of research for scholars.
Based on the above analysis, this article primarily takes A-level rural tourism operating units within Jilin Province as research samples, using multiple online data platforms such as Baidu Index and Sina Weibo to evaluate their rural tourism popularity from 2016 to 2021, and analyzes its spatial evolution process, and explore its influencing factors and formation mechanisms, to further optimize the spatial structure of rural tourism in Jilin Province, highlight its characteristics, leverage its advantages, and promote the healthy development of rural tourism.
2. Materials and Methods
2.1. Overview of the Research Area
Jilin Province is located at the geographical center of Northeast Asia. To the east lies the vast forests of Changbai Mountain; toward the central region stretches the fertile Songliao Plain; and to the west lie grasslands and wetlands dotted with lakes and marshes. With a sound ecological foundation and abundant rural resources, it provides a favorable basis for rural tourism development. By the end of 2021, there were over 2000 rural tourism enterprises in the province, including 509 A-level rural tourism spots, 128 rural tourism villages, and 16 graded rural guesthouses. The number of rural tourism visitors in the province exceeded 50 million, accounting for nearly 30% of the total tourism in the province and receiving a rural tourism income of over 30 billion yuan. Both the number of rural tourism visitors and income exceeded the pre-epidemic level of the same period in 2019. Rural tourism has gradually moved from the periphery of the tourism industry to the core, becoming an important method and key lever for rural revitalization in Jilin Province. It enhances the intrinsic momentum of expanding farmer employment and increasing rural income. It supports the important growth pole of cultural and tourism industry development. Jilin Province has a high proportion of agricultural industries, and the urban–rural dual structure is obvious. Rural tourism development is greatly affected by seasonality. We use Jilin Province as a case study, using an in-depth investigation and analysis of big data. This study explores how the special development laws and influencing factors of rural tourism can better activate rural tourism consumption from the demand side and form a tourism industry ecology with complete elements and chains. This is of great theoretical significance for guiding rural revitalization through tourism.
2.2. Data Source and Processing
2.2.1. Data Source Description
The data required for this study are of three types: (1) Search engine data, derived from Baidu Index and Baidu search, is used to analyze the temporal characteristics of rural tourism popularity in the annual, monthly, and holiday periods. (2) OTA platform data, derived from Sina Weibo, are used to evaluate the popularity of rural tourism and explore its spatial differentiation characteristics. (3) The statistical data, derived from the official website of the Jilin Provincial Department of Culture and Tourism, local statistical yearbooks, and the national economic and social development statistical bulletin, are used to analyze the causes of rural tourism fever.
2.2.2. Data Collection and Processing
- Sample selection and visualization. The survey of rural tourism in Jilin Province began in 2016, and the A-level rural tourism business units best represent the typicality of rural tourism data. Therefore, this study selects the provincial A-level rural tourism business units released by the Department of Culture and Tourism at the end of 2021 as the research sample. The longitude and latitude co-ordinates are from the Baidu open platform mapLocation. Taking the county as the unit, the visualization of rural tourism business units is realized by ArcGis10.7 software.
- Data acquisition and processing. We first capture Baidu Index data through Python 3.10 software; obtain the rural tourism network data of Jilin Province from 2016 to 2021; analyze the interannual and monthly characteristics of rural tourism in Jilin Province; and focus on analyzing “Qingming”, “May Day”, “Dragon Boat Festival”, and “November” holidays through the skewness index of weekly distribution [27]. Second, we obtain the data of microblog comments, forwarding, and likes of rural tourism business units above the A level from 2016 to 2021; establish a mathematical model to evaluate the rural tourism popularity; analyze the temporal and spatial evolution pattern of rural tourism through trend surface and kernel density analysis; identify the cold and hot spots with the county as a unit; and, finally, analyze the influencing factors and mechanism of the formation of spatial differences in rural tourism popularity.
2.2.3. Research Method
- 1.
- Evaluation of Rural Tourism Popularity
Generally, the evaluation of scenic spot (spot) popularity mainly occurs using high-grade scenic spots or resorts in a metropolis. The Baidu Index is used as the search platform. However, rural tourism business units are small in both quantity and scale. Considering the comprehensiveness and objectivity of network data acquisition, based on relevant research, using Sina Weibo as the source data, this study constructs an evaluation model of rural tourism popularity in Jilin Province [28]. The measurement formula is:
where is the heat value of the ith rural tourism business unit; is the level of rural tourism management unit; is the realistic popularity presented by the ith rural tourism business unit, expressed in the number of comments and forwarding; is the potential popularity of the jth rural tourism business unit, expressed in likes; and and are the corresponding weights, respectively. Considering that the actual influence effect of the real heat is much greater than the potential heat, is taken as 0.7 and is taken as 0.3.
- 2.
- Analysis on the temporal and spatial evolution of rural tourism
(1) Trend surface analysis
The trend surface analysis method uses the global polynomial to fit the values of spatial sampling points with mathematical functions; converts the data of sampling points in two-dimensional space into three-dimensional visual smooth curves; and displays the change trend of geographical elements in space. We use trend surface to express the spatial differentiation trend of rural tourism heat in Jilin Province. Let be the real observation value of the ith geographical element, and be the trend surface fitting value. The calculation formula is:
where are geographical co-ordinates; and is the residual error, that is, the deviation between the true value and the fitted value.
(2) Nuclear density analysis
The kernel density estimation method is not limited by any assumptions regarding the data distribution. Our method is to study the data distribution characteristics from the data sample itself. This has the advantages of intuitive expression, concise concept, and easy calculation; which has become the most widely used nonparametric estimation method in spatial analysis. Its general form is:
where is the density of position s; N is the number of samples; the distance from point i to s (m); k is the kernel function of the ratio of and r; and r is the bandwidth (m). It should be noted that the selection of bandwidth r will have a great impact on the estimation results. It is necessary to select different bandwidth values for comparison according to the actual situation until a nuclear density surface that is more consistent with the actual situation is obtained.
3. Results
3.1. Time Characteristic Analysis
3.1.1. Interannual Characteristics
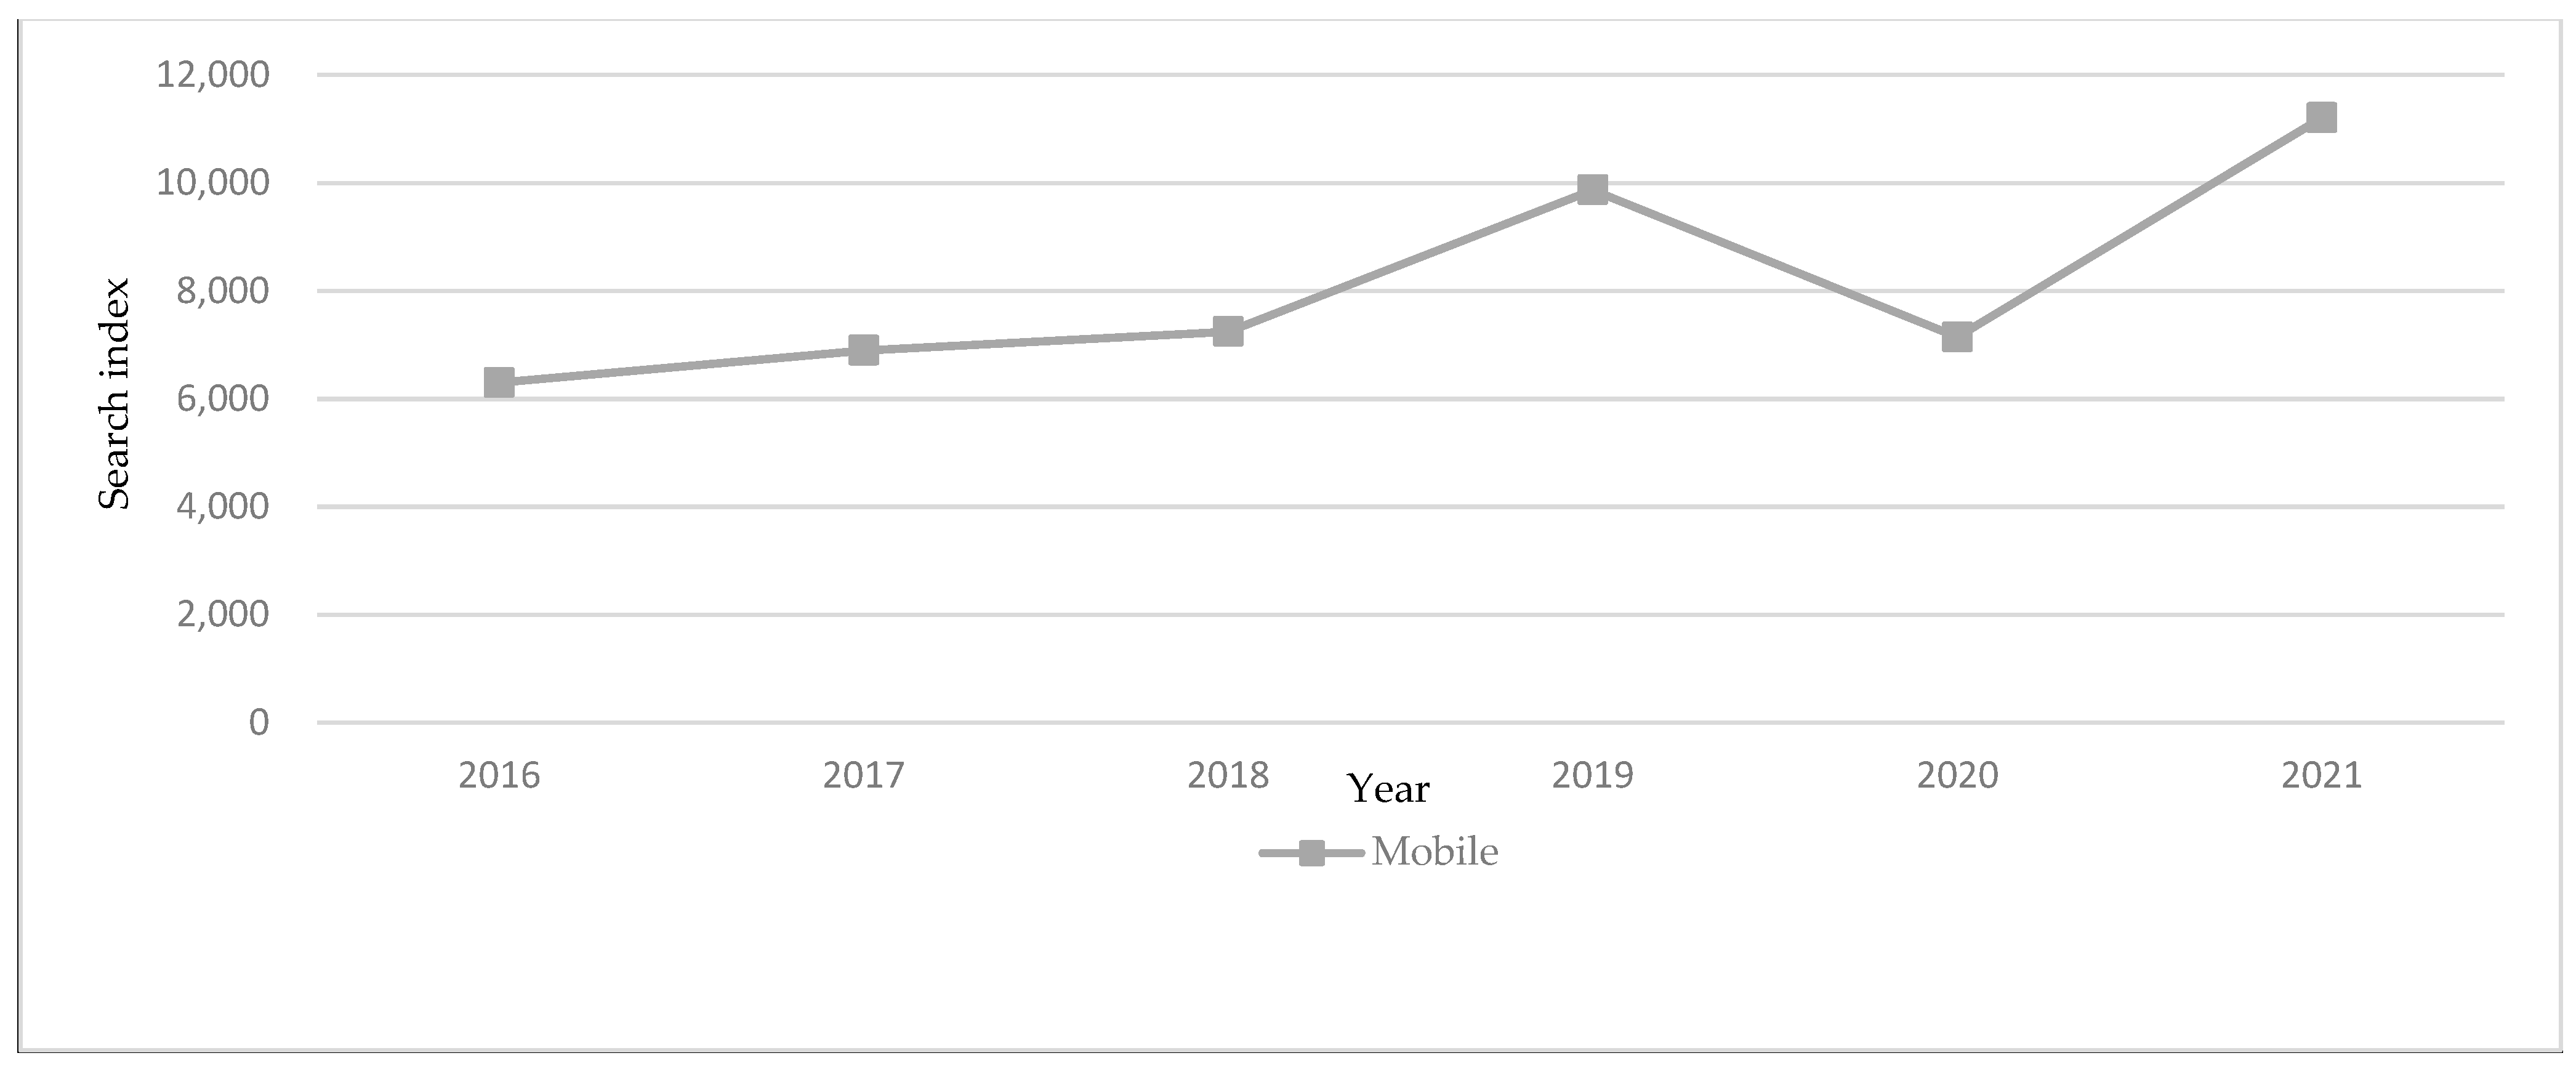
Since 2016, Jilin Province has taken rural tourism as an important part of the tourism industry. The interannual change trend is obtained (Figure 1) by summing the search volume of the average daily attention of rural tourism from 2016 to 2021. Since 2016, the overall popularity of rural tourism in Jilin Province showed an upward trend. However, the COVID-19 epidemic caused a significant downward trend from 2020. In 2021, with the stabilization of the epidemic, “explosive” recovery characteristics became prominent, and rural tourism’s popularity has since increased. On the one hand, affected by the increasing willingness of tourists to travel and the increasing work pressure of urban residents, rural tourism characterized by a short travel radius, low per capita consumption, and green health has gradually become the primary choice of tourists for weekend leisure and holiday vacations. On the other hand, Jilin governments at all levels have vigorously implemented a series of measures, such as poverty alleviation and rural revitalization, increased investment and support for rural tourism through in-depth resource use, infrastructure improvement, greater traffic accessibility, and strengthened talent training. This provides a wide space for the rural tourism market.
3.1.2. Monthly Characteristics
Regarding monthly changes (Figure 2), from 2016 to 2021, the popularity of rural tourism showed a trend of “single peak” to “double peak”. In the early stage of 2016–2017, interest increased significantly from July to September; it began to decline after October. From 2018 to 2021, there were obvious “double peaks” around the “May Day” and “November” holidays, and a low value for rural tourism appeared in January each year. In 2021, in response to the Rural Revitalization Strategy and to promote high-quality rural tourism development, the Jilin provincial government issued a series of policies and measures. It simultaneously carried out evaluations regarding rural tourism boutique villages, key rural tourism villages, A-level rural tourism business units, and tourism grade accommodation. This significantly increased the search index of rural tourism. There were two low points from December 2019 to February 2020 and from January to March 2021. These coincided with the shutdown of the tourism industry caused by the periodic occurrence of the epidemic.
3.1.3. Holiday Features
Usually, short and long holidays constitute the peak periods of rural tourism travel. This paper uses Python3.10 software to obtain the average daily search index for the four holidays of “Qingming”, “May Day”, “Dragon Boat Festival”, and “November” from 2016 to 2021 (Figure 3). Considering that the search index is affected by the precursory effect and the dual willingness of urban residents to take holidays in lieu of pay, we include the pre- and post-holiday days in the statistical range. During the holidays from 2016 to 2021, the change of rural tourism heat in Jilin Province tended to be consistent; that is, it maintained a high heat level 2–3 days before the start of a holiday, and then showed a gradual downward trend, followed by relative stability. During “May Day” and “National Day”, which are the peak travel periods, rural tourism is significantly more popular than during the “Qingming” and “Dragon Boat Festival” holidays, showing an obvious inverted “S” trend.
The 2020 Qingming Festival occurred during the epidemic’s outbreak period; the tourism industry was in a state of suspension. To better investigate the micro time scale changes during the holidays, this study selected the “Dragon Boat Festival” and “National Day” for research. The results show that the distribution regularity of the g-index during the “Dragon Boat Festival” holiday is not obvious. In 2016, 2020, and 2021, the heat is concentrated in the late stage of the small and long holidays. In 2017 and 2019, the heat is symmetrically distributed. In 2018, it is concentrated in the early stage of the small and long holidays, indicating that, for the three-day holiday, people tend to make last-minute decisions rather than early decisions. Unlike the “Dragon Boat Festival” holiday, the g value of the “National Day” holiday is less than 0 (Table 1). This indicates that the heat is generally concentrated in the early stage of the small and long holidays. It generally shows an annual increasing trend; that is, people tend to make decisions in advance during the “National day” holiday.
3.2. Spatial Feature Analysis
3.2.1. Overall Spatial Characteristics
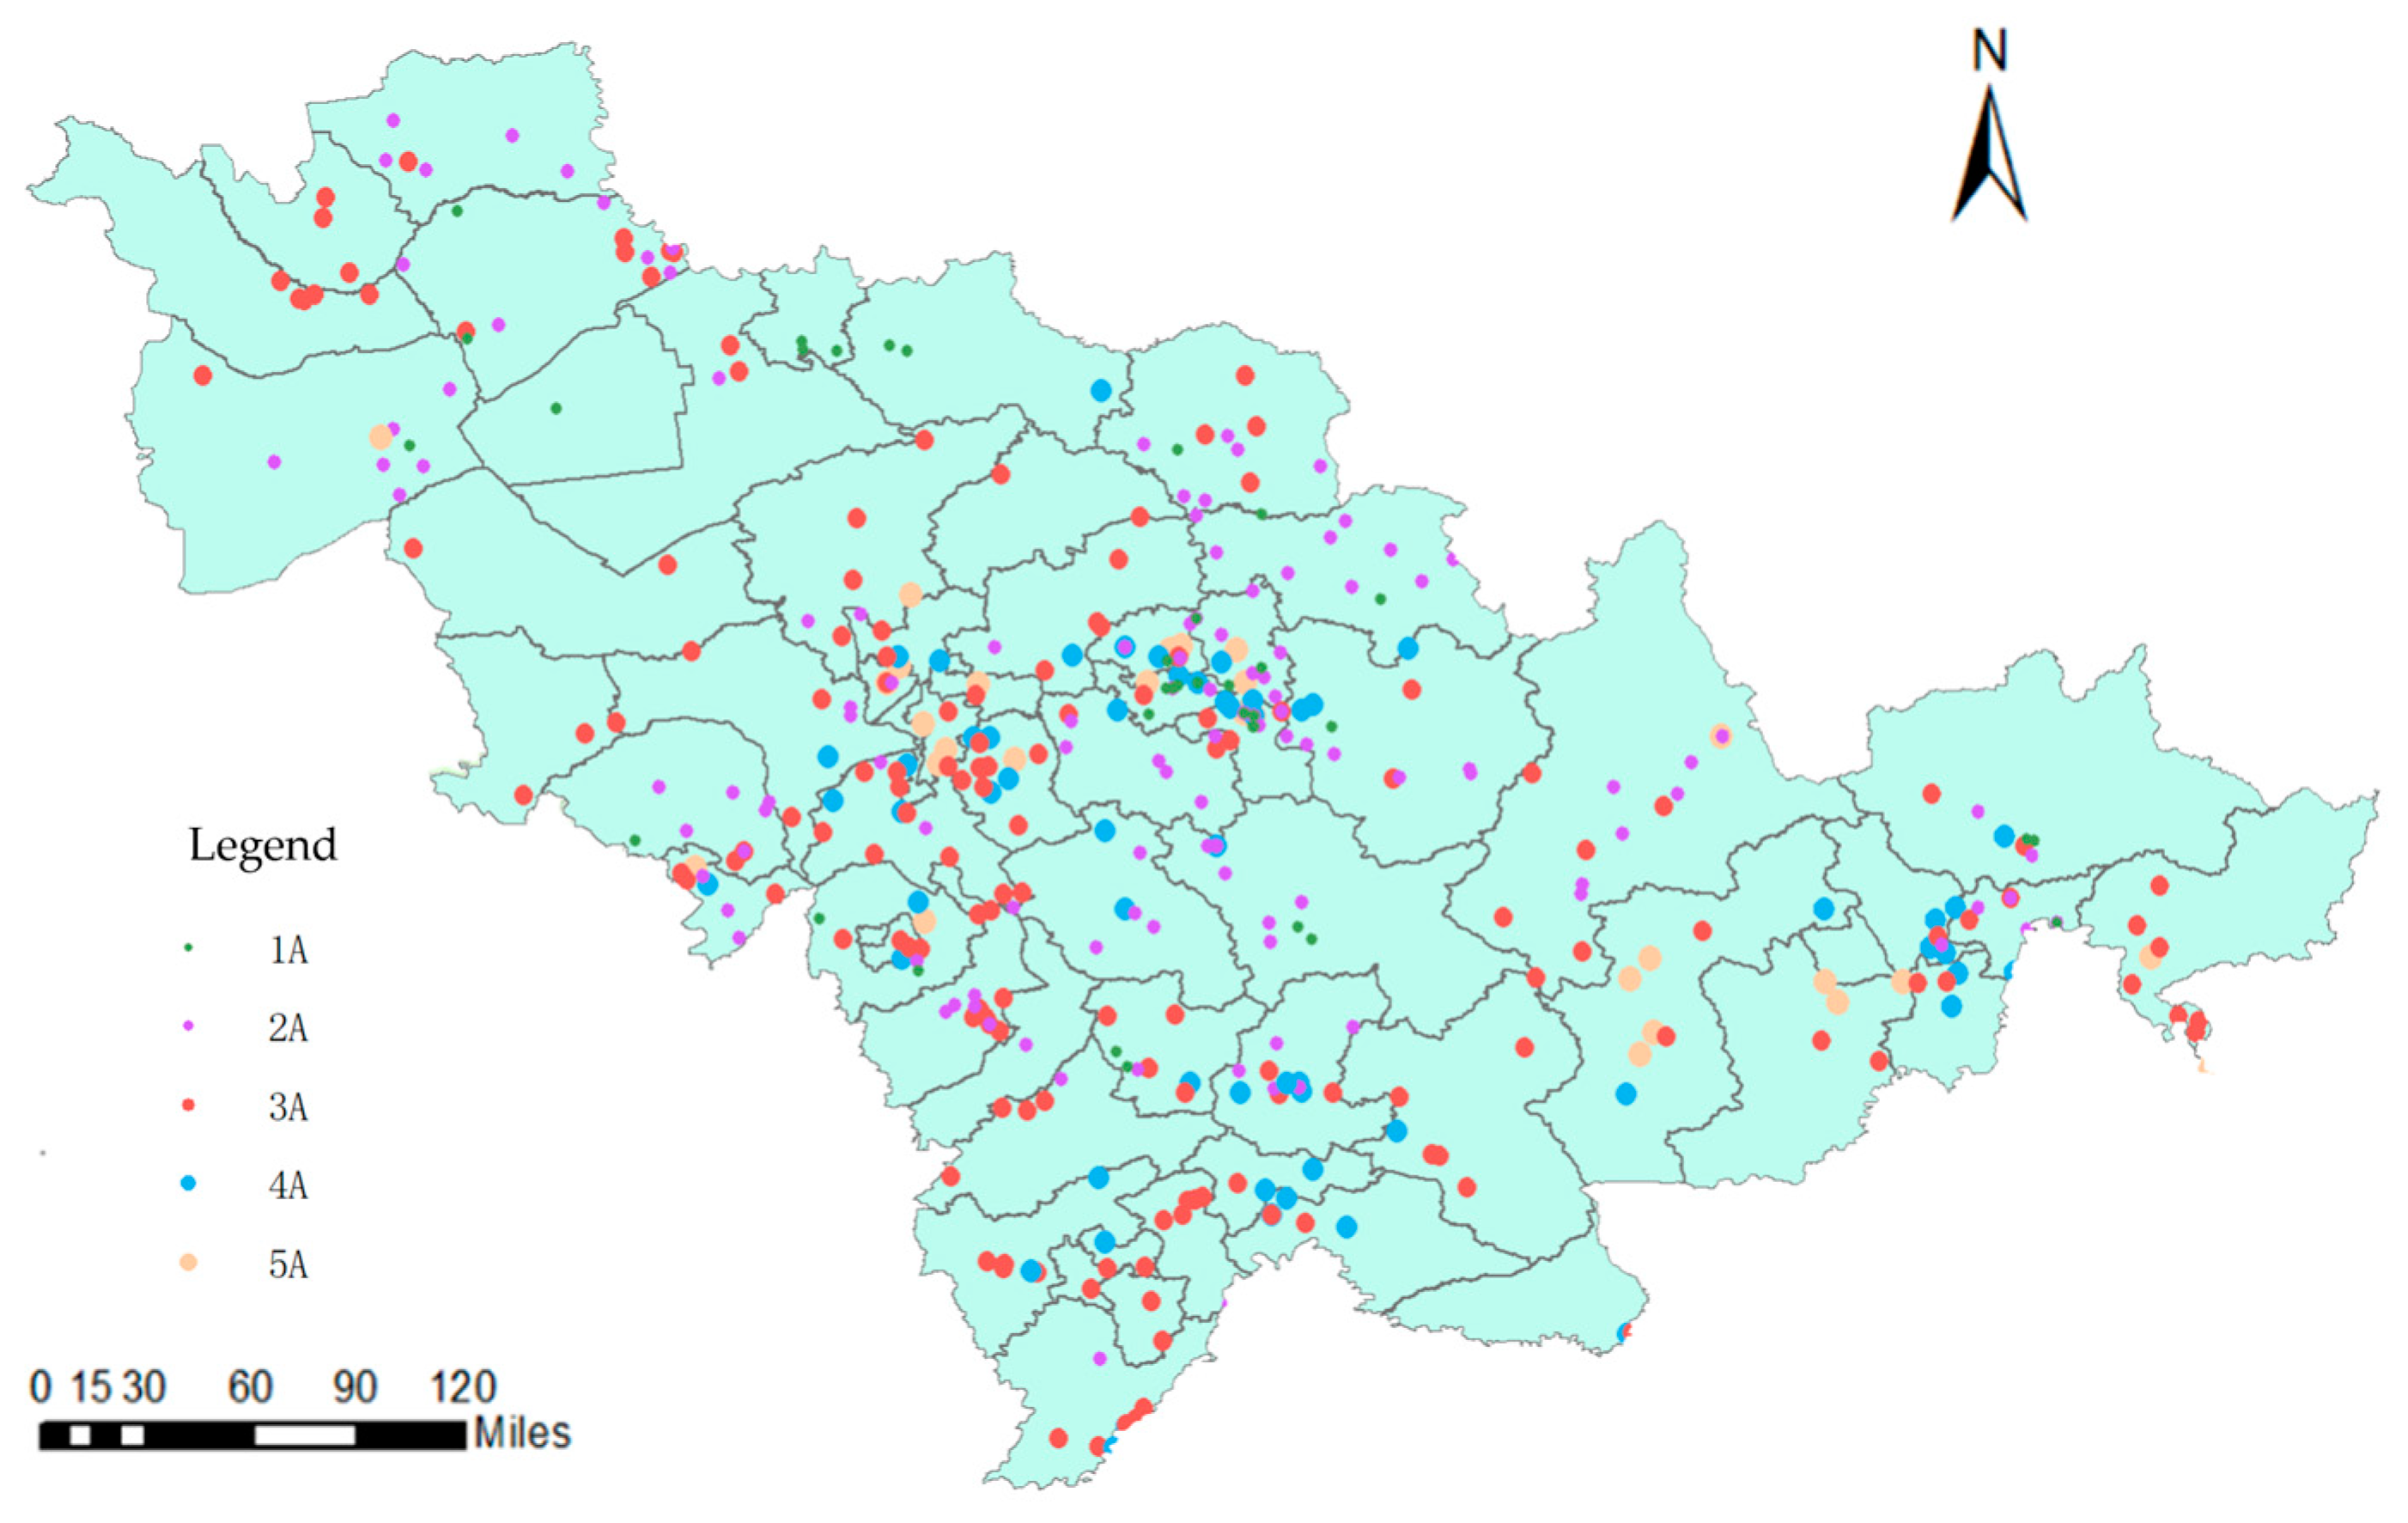
Figure 4 shows the overall spatial characteristics through the visual expression of A-level rural tourism business units. Nine cities (prefectures) are distributed, and are concentrated in Changchun, Jilin, Tonghua, Yanji, and other regions. The overall situation is characterized by a large dispersion and small concentration. Most A-level rural tourism business units are distributed around the main traffic trunk lines or urban areas, or adjacent to high-level A-level scenic spots (resorts). Regarding quantity, the number of rural tourism business units in the eastern region is nearly three times that in the western region. Regarding scale, the number of high-level (4A and 5A) rural tourism business units is small, accounting for less than 20% of the total number of A-level rural tourism business units in the province. There are more high-level units in Changchun, Jilin, and Yanbian, and more low-level units in the western and southern regions such as Songyuan, Baicheng, and Baishan.
3.2.2. Evolution of Spatial Structure
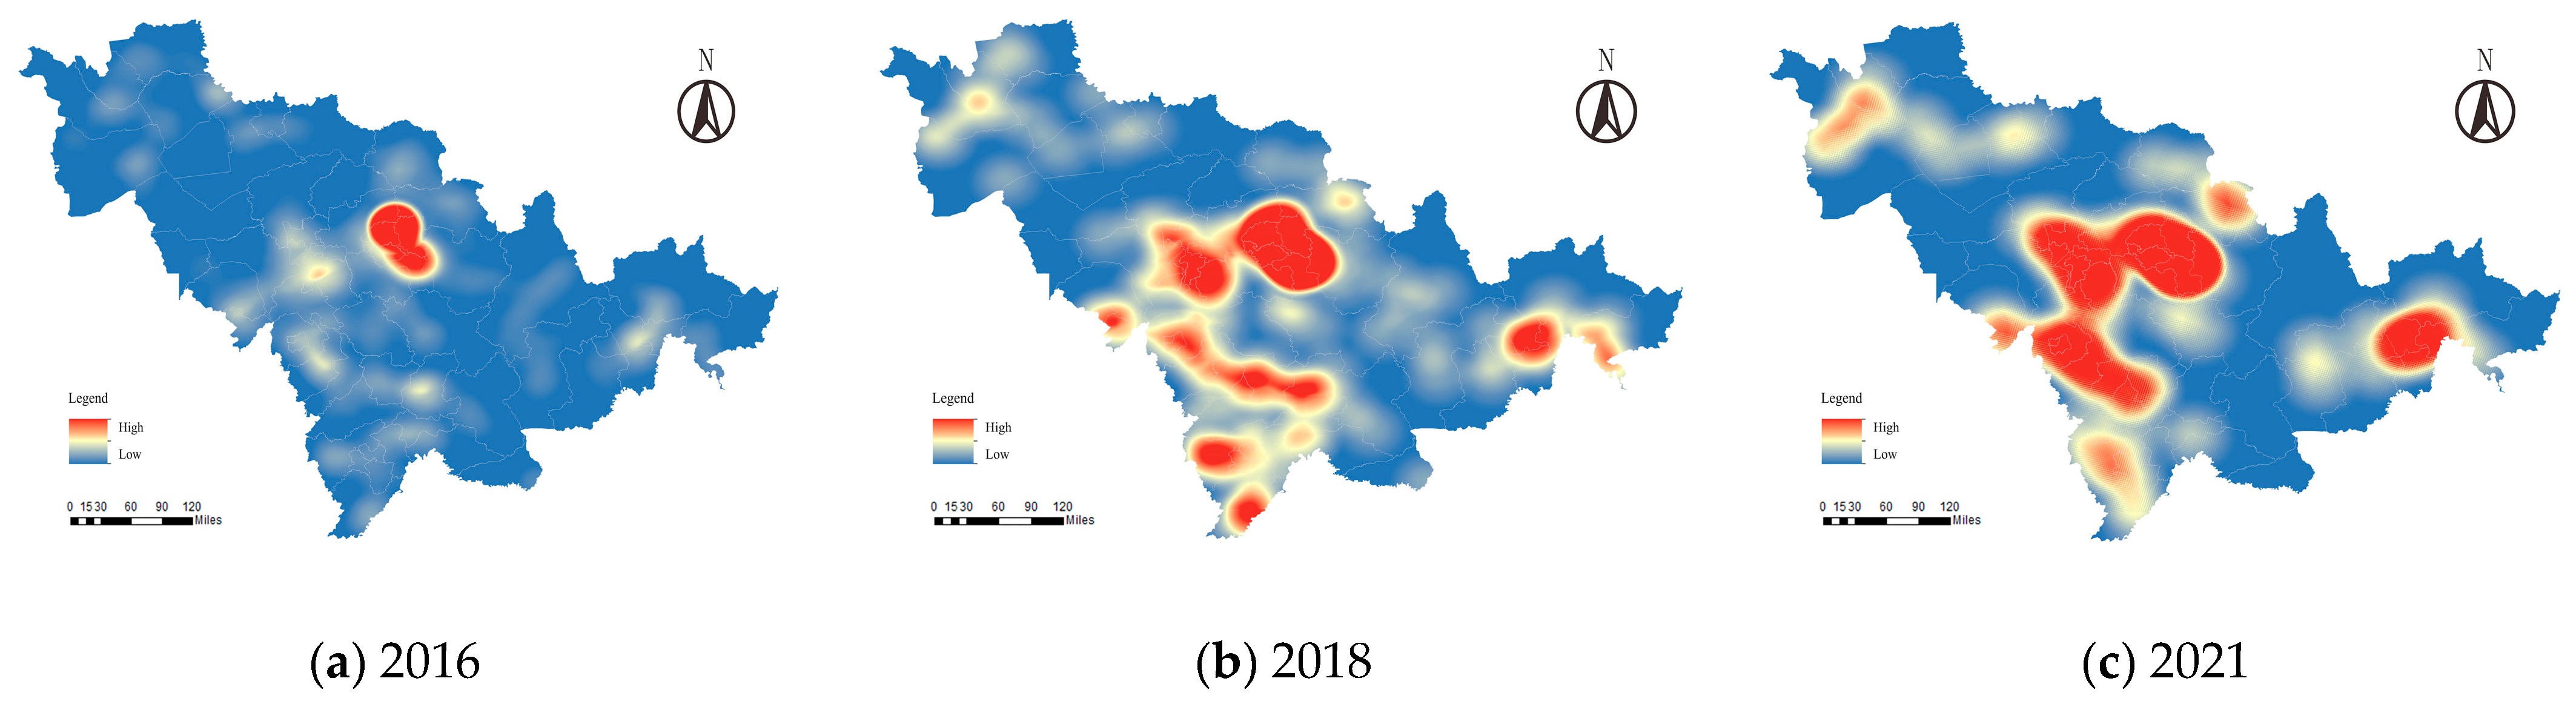
The spatial trend analysis reflects rural tourism heat’s spatial distribution trend in Jilin. To further explore the spatial agglomeration and spatial structure evolution, we apply a core density analysis of the heat value from 2016 to 2021 (Figure 5). The research results show the following:
- The spatial distribution features are hierarchical. During 2016–2021, the rural tourism heat in Jilin Province has shown an obvious evolution of “single core → multi-core”. In 2016, rural tourism hotspots were primarily concentrated in the suburban areas around Changchun, with rural tourism products consisting of simple farmhouses and resorts. In 2018, the popularity of rural tourism gradually spread to the southeast. Jilin, Tonghua, Yanbian, and other regions have significant rural tourism concentrations. These areas gradually developed diversified products such as folk culture, health, and vacation, leisure, and entertainment. In 2021, rural tourism showed a trend of “large dispersion, small concentration” and multi-point agglomeration. This trend involves multi-point diffusion in Changchun, Jilin, Yanji, and Baicheng within the provincial scope. Simultaneously, with major cities as the center, they became characterized as point agglomeration.
- During this period, the expansion of space diffusion is prominent. From the perspective of a diffusion trend, the rural tourism heat in Jilin Province reveals the diffusion trend of “central → Eastern” and “central → western”. On the one hand, this is because of the impact of the regional economic level, road traffic conditions, and infrastructure allocation. The central region—represented by Changchun, Jilin, and other regions—had better early basic conditions, which provided substantial market potential for rural tourism development. On the other hand, Jilin Province implemented the “one main, six double” high-quality development strategy and the preferential policies of all government levels. To a certain extent, this also affected the diffusion trend of rural tourism heat in Jilin Province.
3.2.3. Evolution of County-Level Patterns
The county is an important carrier for rural tourism development. To further study the evolution of Jilin’s hot and cold pattern of rural tourism at the county level, 60 county units in Jilin Province were divided into four categories from high to low using Jenks’ “natural discontinuity grading method”. This uses the hot spot analysis method. Figure 6 shows the evolution map of the hot and cold pattern of rural tourism. The results show the following:
- The evolution trend of hot and cold pattern. From 2016 to 2021, the number of rural tourism hot spots in Jilin Province increased continuously, from 1 in 2016 to 3 in 2021. The number of sub hot spots increased from 4 in 2016 to 13 in 2021, accounting for 21.67% of the counties in the province. By contrast, the number of cold spots gradually decreased. The number of cold spot areas has decreased from 31 in 2016 to 18 in 2021; the proportion has decreased from 51.67% to 30%. Spatially, the hot spots in 2016 were mainly concentrated in Fengman District of Jilin City and the surrounding counties of Changchun. Over time, the hot spots gradually moved to the east and south. Yanbian Prefecture and Tonghua City gradually became the rural tourism hot spots. In 2021, the hot spots further spread to the city periphery in circles, and the agglomeration of rural tourism became more obvious. The hot spots in Changchun and Jilin City accounted for half of the rural tourism in Jilin Province.
- The evolution trend of county units. Regarding the distribution of county units, first, most county units with a high economic development level gradually increased their rural tourism development heat. This includes Jiutai District and Shuangyang District in Changchun, Jiaohe City and Shulan City in Jilin, and Dunhua City in Yanbian Prefecture. These have changed from the cold spots in 2016 to sub hot spots in 2021. Traffic accessibility has also become one of the important factors in rural tourism’s transformation. Figure 6 shows most of the sub hot spots and sub cold spots are concentrated in the county units around the central urban area of each region, while most of the cold spots are concentrated in the peripheral units of each city (state). In comparison, Baicheng and Songyuan in the western region of Jilin Province have more cold spots in county units, while the eastern region has fewer cold spots.
4. Influencing Factors
4.1. Indicator Selection
The previous analysis shows that rural tourism development and the spatial distribution of rural tourism business units are primarily affected by the level of regional economic development, road traffic accessibility, and resource endowment conditions. We considered the relevant research results, the actual development stage of Jilin’s rural tourism, and data availability. We then chose six indicators from five aspects: the ecological environment, economic development, resource endowment, traffic conditions, and industrial base. This allows the investigation and analysis of factors influencing the spatial differences in the popularity of rural tourism business units (Table 2).
4.2. Impact Factor Analysis
The analysis of impact factors takes the rural tourism heat value of each county unit in 2016, 2018, and 2021 as the dependent variable., and the precipitation, per capita GDP, urbanization rate, number of A-level tourist attractions, highway mileage, and the proportion of the tertiary industry in GDP as the independent variables. The geographical detection analysis is performed using GeoDetector (Excel) software [29]. The results are as follows.
4.2.1. Strength Analysis
The factor detection results in Table 3 show the explanatory power of each influencing factor on the spatial differentiation of rural tourism heat. These are in the order of highway mileage (X5), the number of class A scenic spots (X4), the proportion of tertiary industry in GDP (X6), per capita GDP (X2), urbanization rate (X3), and precipitation (X1). According to the value of Q, this is divided into three categories by using the natural breakpoint method, namely, the important influencing factors: the number of highway mileage (0.704), and the number of class A scenic spots (0.684). The secondary influencing factors include the proportion of tertiary industry in GDP (0.656), and per capita GDP (0.646). The general influencing factors are the urbanization rate (0.619) and precipitation (0.580).
Table 3 shows the factor interaction detection analysis. After the interaction of two different factors, the factor interpretation of the tourism heat’s spatial differentiation shows a two-factor enhancement relationship. There is no nonlinear weakening, independent, and nonlinear enhancement relationship. This indicates that the interaction between any two factors is greater than the influence of each single factor. Among them, the interactive detection results of the number of A-level scenic spots and the proportion of the tertiary industry in GDP were 0.937; the interactive detection results of the urbanization rate and the proportion of the tertiary industry in GDP were 0.923, indicating that the resource endowment conditions, industrial base, and economic development level are the primary factors affecting rural tourism popularity.
4.2.2. Mechanism Analysis
- Ecological environment. The changes in q values show that the average impact of the ecological environment on the popularity of Jilin rural tourism is relatively low, but, overall, it shows an increasing trend.
- Economic development. The per capita GDP and urbanization rate are important indicators for measuring the level of economic development in a region. They are also key factors affecting the development of rural tourism. The q value of per capita GDP increased from 0.595 in 2016 to 0.708 in 2018; it then decreased to 0.638 in 2021, showing a trend of first increasing, and then weakening. The q value of the urbanization rate shows an overall increasing trend. On the one hand, this indicates that the level of economic development is an important condition affecting rural tourism development. The higher the urbanization rate in an area, the more tourists engaging in rural tourism. The higher the per capita GDP, the stronger the consumption capacity of rural tourism. On the other hand, this also indicates that, when the economic level reaches a certain level, the impact of the increase in resident income on rural tourism travel weakens, and people pursue additional diversified tourism needs.
- Resource endowment. The average impact of resource endowment on the popularity of rural tourism in Jilin Province also shows a trend of first weakening, and then increasing; but the average is 0.684, which is an important factor. Overall, resource endowment remains one of the important influencing factors. With the advent of the global tourism era, the concept of tourism resources is constantly expanding and extending. Traditional tourism resources tend to weaken rural tourism development; however, the continuous enhancement of emerging tourism resources and formats has gradually strengthened their impact on rural tourism.
- Transportation conditions. We use transportation conditions as an important indicator to measure supporting facilities. The results show that, from 2016 to 2021, transportation accessibility had a significant impact on the popularity of rural tourism in Jilin Province, with an average impact of 0.704. In May 2022, the Jilin Provincial Department of Transportation and the Jilin Provincial Department of Culture and Tourism jointly issued a notice on further promoting the integrated development of road passenger transportation and tourism. They proposed the enhanced leveraging of provincial resource advantages—such as ice and snow, ecology, red, and rural areas—to innovate new products integrating transportation and tourism, actively explored the construction of passenger boarding and landing stations in key scenic areas, and connected the last mile of tourist travel. This will promote the deep integration and development of road passenger transportation and the tourism industry.
- Industrial foundation. The tourism industry has become an important strategic pillar industry in the development of most counties in Jilin Province. The research results show that the impact of the industrial foundation on rural tourism has increased from 0.307 in 2016 to 0.865 in 2021. Its degree of influence is gradually increasing. Achieving high-quality rural tourism development requires further promoting product innovation, enhancing the added value of rural tourism products, promoting industrial upgrading, expanding the rural tourism industry chain, strengthening industrial integration, and promoting the integration of rural tourism with the primary, secondary, and tertiary industries (Table 4).
5. Discussion
5.1. Response to Previous Studies
At the methodological level, the spatiotemporal evolution analysis of rural tourism popularity based on multi-source data aims to provide a new perspective for the quantitative analysis of rural tourism. In related fields, scholars such as Fu et al. [30] and Hoffmann et al. [31] have also evaluated the attention to rural tourism. However, it should be emphasized that, based on previous research, this article further conducts a quantitative analysis on lagging areas where big data are difficult to obtain, expanding the breadth and depth of rural tourism research. In the study’s time scale, scholars such as Sun et al. [23] and Rong et al. [20] conducted research with a time limit of less than one year. Based on this, this study selected continuous data from multiple years and conducted a comparative analysis. At the spatial scale of the study, it fills the gap in quantitative research on rural tourism heat at the mesoscale and provides more detailed methodological references for areas with lagging rural tourism development. The above will provide certain reference value for the sustainable development of rural tourism.
5.2. Revelations and Recommendations
Rural tourism, as a new product, is gradually moving from the periphery of the tourism industry to the core. From the perspective of the spatial evolution pattern, the development trend of rural tourism in the central and eastern regions is good, while the development of rural tourism in the western region still faces challenges. The western region has a good ecological environment and abundant tourism resources. Due to the limitations of environmental protection, the development of its rural tourism industry is somewhat restricted. In future development, we should strengthen the construction of infrastructure and consider how to moderately develop rural tourism while protecting the ecological environment. The eastern region has abundant rural tourism resources, but a small population, which can be fully integrated with ice and snow, health preservation, and urban resources to attract tourists. The development advantages of rural tourism in the central region are obvious, and, at the same time, it is necessary to increase the promotion and marketing of big data to further promote the quality improvement of rural tourism. From the perspective of influencing factors, infrastructure conditions remain a key constraint on the development of rural tourism. In addition, empowering through technological elements and extending the industrial chain are also effective ways to promote the development of rural tourism.
6. Conclusions
A correct understanding of the spatiotemporal evolution characteristics and influencing factors of rural tourism popularity is the foundation for further promoting rural tourism development and co-ordinating regional economic development. This article comprehensively uses multi-source data to analyze the spatiotemporal characteristics and influencing factors of key rural tourism scenic spots in Jilin Province. The research results show the following:
- Regarding the temporal dimension, from 2016 to 2021, the annual popularity of rural tourism in Jilin Province showed a rising trend. Affected by the periodic occurrence of COVID-19, the popularity of rural tourism reached a low point in 2020, but, then, increased substantially in 2021. Regarding monthly changes, the popularity of rural tourism is distinct during the peak and off-peak seasons, showing a clear “peak” feature before and after the May Day and National Day holidays. The popularity of rural tourism before and after National Day shows a clear precursor effect.
- From a spatial perspective, there are significant differences in rural tourism popularity. Regarding layout, there exists a trend of “single core → multi core”, and, for diffusion, a trend of “central → eastern” and “central → western”. With the evolution of the spatial structure, the types of rural tourism products have gradually developed from a single product to a combination of multiple formats. Analyzing county-level units shows that, although the trend of rural tourism changing from cold spots to hot spots is obvious, this is mostly a sub hot area. The increase in the number of hot county-level units is not significant.
- Regarding influencing factors, transportation conditions and resource endowments remain the key factors impacting rural tourism development. Road connectivity promotes the prosperity of all industries. The rapid development of road transportation in rural areas can effectively achieve the flow of logistics, funds, and people between urban and rural areas, rapidly transform rural poverty and less developed area, and create conditions for rural tourism development. With the continuous development of the pan-tourism industry, the depth and breadth of traditional tourism resources have been expanded. The tourism industry chain has been continuously extended. This increases the impact on rural tourism. With the implementation of the “Two Mountains” concept and the promotion of an ecologically strong province, an ecological countryside has gradually become a desired goal. The impact of the ecological environment has gradually increased.
Quantitative research on rural tourism through big data has, to some extent, solved the problems faced by traditional statistical survey methods in rural tourism data statistics, such as a small sample size or high statistical difficulty. It offers a certain guiding significance for future quantitative research on rural tourism. The research on the spatiotemporal characteristics of rural tourism at the provincial level has guiding significance for understanding the development layout of regional rural tourism and helping underdeveloped rural areas accelerate development. Based on the above research, Jilin Province should further strengthen transportation connections, achieve the effective allocation of rural tourism resources, enhance the level of regional development synergy, and promote common development in the future development of rural tourism.
Author Contributions
Conceptualization, J.Y. and Y.F.; methodology, J.Y.; validation, J.Y.; writing—original draft preparation, J.Y.; writing—review and editing, X.Z.; funding acquisition, Y.F. All authors have read and agreed to the published version of the manuscript.
Funding
This research was funded by the National Natural Science Foundation of China project (Project Code:NSFC-4207122); the Jilin Province Higher Education Research Project (Project Code:JGJX2020C76); the Key Projects of Jilin Provincial Department of Culture and Tourism (Project Code:LYKT202306); and the Jilin Provincial Science and Technology Department Project (Project Code:20240701063FG).
Institutional Review Board Statement
Not applicable.
Informed Consent Statement
Not applicable.
Data Availability Statement
All data and models that support the findings of this study are available from the corresponding author upon reasonable request.
Conflicts of Interest
The authors declare no conflicts of interest.
References
- Yanjun, X. Take care of the “Mupi House” and reshape the new concept of sustainable development of rural tourism. Tour. Trib. 2017, 32, 8–10. [Google Scholar]
- Lu, L.; Ren, Y.S.; Zhu, D.C.; Cheng, J.M.; Yang, X.Z.; Yang, Z.; Yao, G.R. The research framework and prospect of rural revitalization led by rural tourism. Geogr. Res. 2019, 38, 102–118. [Google Scholar]
- Long, H.; Tu, S.S. Rural restructuring: Theory, approach and research prospect. Acta Geogr. Sin. 2017, 72, 563–576. [Google Scholar]
- Liu, Y. Research on the geography of rural revitalization in the new era. Geogr. Res. 2019, 38, 461–466. [Google Scholar]
- Sharpley, R. Rural tourism and the challenge of tourism diversification: The case of Cyprus. Tour. Manag. 2002, 23, 233–244. [Google Scholar] [CrossRef]
- Rosalina, P.D.; Dupre, K.; Wang, Y. Rural tourism: A systematic literature review on definitions and challenges. J. Hosp. Tour. Manag. 2021, 47, 134–149. [Google Scholar] [CrossRef]
- Salvatore, R.; Chiodo, E.; Fantini, A. Tourism transition in peripheral rural areas: Theories, issues and strategies. Ann. Tour. Res. 2018, 68, 41–51. [Google Scholar] [CrossRef]
- Kastenholz, E.; Carneiro, M.J.; Marques, C.P.; Loureiro, S.M.C. The dimensions of rural tourism experience: Impacts on arousal, memory, and satisfaction. J. Travel Tour. Mark. 2018, 35, 189–201. [Google Scholar] [CrossRef]
- Lewis, C.; D’Alessandro, S. Understanding why: Push-factors that drive rural tourism amongst senior travelers. Tour. Manag. Perspect. 2019, 32, 100574. [Google Scholar] [CrossRef]
- Song, H.; Qiu, R.T.; Park, J. A review of research on tourism demand forecasting. Ann. Tour. Res. 2019, 75, 338–362. [Google Scholar] [CrossRef]
- Li, X.; Pan, B.; Law, R.; Huang, X. Forecasting tourism demand with composite search index. Tour. Manag. 2017, 59, 57–66. [Google Scholar] [CrossRef]
- Wan, S.; Song, H. Forecasting turning points in tourism growth. Ann. Tour. Res. 2018, 72, 156–167. [Google Scholar] [CrossRef]
- Díaz, M.Á.; Sbert, J.M. Forecasting daily air arrivals in Mallorca Island using nearest neighbour methods. Tour. Econ. 2011, 17, 191–208. [Google Scholar] [CrossRef]
- Bing, W. Viewing the prospect of China’s agrotourism by contrasting agrotourism in foreign countries with that in our country. Tour. Trib. 1999, 14, 38–42. [Google Scholar]
- Fengshou, Y.; Wenpeng, M.A.N. A review of domestic academia’s research on rural tourism poverty alleviation. J. HeBei Tour. Vocat. Coll. 2021, 26, 1–5. [Google Scholar]
- Zhou, L.Q.; Huang, Z.H. Sustainable development of rural tourism in China: Challenges and policies. Econ. Geogr. 2004, 24, 572–576. [Google Scholar]
- Li, G.; Song, H.; Witt, S.F. Recent developments in econometric modeling and forecasting. J. Travel Res. 2005, 44, 82–99. [Google Scholar] [CrossRef]
- Song, H.; Li, G. Tourism demand modelling and forecasting-A review of recent research. Tour. Manag. 2008, 29, 203–220. [Google Scholar] [CrossRef]
- Xiang, Z.; Schwartz, Z.; Gerdes, J.H., Jr.; Uysal, M. What can big data and text analytics tell us about hotel guest experience and satisfaction? Int. J. Hosp. Manag. 2015, 44, 120–130. [Google Scholar] [CrossRef]
- Rong, H.F.; Tao, Z.M. Hotspot identification and cause analysis of rural tourism based on website data: Take Jiangsu Province as an example. J. Nat. Resour. 2020, 35, 2848–2861. [Google Scholar]
- Zhang, Z.A.; Huang, Z.F.; Jin, C.; Guan, J.; Cao, F.D. Research on spatial-temporal characteristics of scenic tourist activity based on Sina microblog: A case study of Nanjing Zhongshan mountain national park. Geogr. Geo-Inf. Sci. 2015, 31, 121–126. [Google Scholar]
- Ma, L.J.; Guo, L.L. Spatial and temporal distribution characteristics of Beijing residents’ demand for 5A class scenic spots. J. Arid Land Resour. Environ. 2017, 31, 203–208. [Google Scholar]
- Sun, Y.; Zhang, H.; Liu, P.; Zhang, J. Forecast of tourism flow volume of tourist attraction based on degree of tourist attention of travel network: A case study of Baidu index of different clients. Hum. Geogr. 2017, 32, 152–160. [Google Scholar]
- Ning, C.; Xia, P.; Zhou, H. Popularity analysis of tourist attraction based on geotagged social media big data. Mapp. Sci. 2016, 41, 167–171. [Google Scholar]
- Fan, M.Y.; Chen, Y.N.; Zhang, H. Tourist market structure and destination image perception in Hunan Province based on geotagged photos. Econ. Geogr. 2021, 41, 223–232. [Google Scholar]
- Zheng, Y.L.; Lu, L.; Zhao, H.R. Distribution features of network attention in Wuhu Fantawild and its correlation with the tourist flow A case of Baidu index of PC client and mobile client. Resour. Dev. Mark. 2018, 34, 1315–1320. [Google Scholar]
- Liu, Z.H.; Li, H.; Shi, C.; Wang, X.; Zhang, H. The response of short term tourist flows to spatial structure of regional tourism: A case study of tourist flows of Yunnan in golden weeks. Acta Geogr. Sin. 2010, 65, 1624–1632. [Google Scholar]
- Xia, Z.; Weidan, Z.; WenPing, J. Land scape evaluation and most beautiful route planning from big website data. J. Tongji Univ. (Nat. Sci.) 2016, 44, 383–388. [Google Scholar]
- Wang, J.F.; Xu, C.D. Geodetector: Principle and prospective. Acta Geogr. Sin. 2017, 72, 116–134. [Google Scholar]
- Fu, Y.; Cai, Z.; Fang, C. Hotspot Identification and Causal Analysis of Chinese Rural Tourism at Different Spatial and Temporal Scales Based on Tourism Big Data. Sustainability 2024, 16, 1165. [Google Scholar] [CrossRef]
- Hoffmann, F.J.; Braesemann, F.; Teubner, T. Measuring sustainable tourism with online platform data. EPJ Data Sci. 2022, 11, 41. [Google Scholar] [CrossRef] [PubMed]
Figure 1.
Annual trend of rural tourism in Jilin Province.

Figure 2.
Monthly trend of rural tourism in Jilin Province.

Figure 3.
Trends of rural tourism holidays in Jilin Province.

Figure 4.
Statistical map of the distribution of Grade A rural tourism business units.

Figure 5.
Spatial structure evolution of rural tourism in Jilin Province.

Figure 6.
The pattern of hot and cold rural tourism in Jilin Province.


Table 1.
Results of intra-week distribution skewness index G analysis.
| 2016 | 2017 | 2018 | 2019 | 2020 | 2021 | |
|---|---|---|---|---|---|---|
| Dragon Boat Festival | 3.741 | 0 | −5.201 | 0 | 16.023 | 0.766 |
| National Day holiday | −14.481 | −2.709 | −13.108 | −16.445 | −11.923 | −3.013 |
Table 2.
Jilin Province rural tourism heat cause index system.
| Influencing Factors | Metric Selection | Metric Interpretation |
|---|---|---|
| Ecological Environment | Precipitation (X1) | This study selected precipitation to characterize the impact of ecological environment on the popularity of rural tourism. |
| Economic Development | Per capita GDP (X2) | Per capita GDP is an important indicator for measuring the economic development of a region; it is used to characterize the impact of economic development level on rural tourism. |
| Urbanization rate (X3) | The urbanization development of per capita GDP is an important prerequisite for rural revitalization, a significant indicator of regional economic development, and a significant influencing factor on the source of rural tourism. | |
| Resource Conditions | Number of A-level tourist attractions (X4) | The agglomeration of rural tourism resources is an important factor in the development of rural tourism. The number of A-level scenic spots represents the degree of regional resource enrichment. Therefore, this study uses the number of A-level scenic spots to characterize resource endowment. |
| Traffic Conditions | Highway mileage (X5) | The number of A-level tourist attractions and transportation conditions directly affect the accessibility and accessibility of rural tourism, which, in turn, affects the number of tourists received and the income of rural tourism operating units. Therefore, highway mileage characterizes the impact of transportation conditions on rural tourism. |
| Industrial Base | The proportion of the tertiary industry to GDP (X6) | All county-level departments in Jilin Province have not included tourism revenue and number of tourists in their statistical data. The tourism industry has become an important tertiary industry. To indirectly reflect the role of rural tourism in the county-level economy, this study uses the proportion of the tertiary industry to GDP. |
Table 3.
Interactive detection results of rural tourism heat influencing factors in Jilin Province.
| X1 | X2 | X3 | X4 | X5 | X6 | X1 | X2 | X3 | X4 | X5 | X6 | X1 | X2 | X3 | X4 | X5 | X6 | |||
|---|---|---|---|---|---|---|---|---|---|---|---|---|---|---|---|---|---|---|---|---|
| X1 | 0.502 | X1 | 0.615 | X1 | 0.627 | |||||||||||||||
| X2 | 0.762 | 0.595 | X2 | 0.874 | 0.708 | X2 | 0.853 | 0.638 | ||||||||||||
| X3 | 0.725 | 0.736 | 0.553 | X3 | 0.821 | 0.832 | 0.642 | X3 | 0.822 | 0.831 | 0.667 | |||||||||
| X4 | 0.850 | 0.826 | 0.817 | 0.689 | X4 | 0.773 | 0.859 | 0.760 | 0.654 | X4 | 0.876 | 0.873 | 0.872 | 0.711 | ||||||
| X5 | 0.707 | 0.792 | 0.713 | 0.827 | 0.517 | X5 | 0.886 | 0.841 | 0.873 | 0.875 | 0.793 | X5 | 0.880 | 0.889 | 0.916 | 0.915 | 0.804 | |||
| X6 | 0.666 | 0.849 | 0.760 | 0.798 | 0.713 | 0.307 | X6 | 0.854 | 0.858 | 0.923 | 0.888 | 0.872 | 0.800 | X6 | 0.913 | 0.919 | 0.906 | 0.937 | 0.911 | 0.865 |
| a.2016 | b.2018 | c.2021 | ||||||||||||||||||
Table 4.
Detection results.
| Influencing Factors | Metric Selection | 2016 | 2018 | 2021 | Average |
|---|---|---|---|---|---|
| Ecological Environment | Precipitation | 0.502 | 0.615 | 0.627 | 0.580 |
| Economic Development | Per capita GDP | 0.595 | 0.708 | 0.638 | 0.646 |
| Urbanization rate | 0.553 | 0.642 | 0.667 | 0.619 | |
| Resource Conditions | Number of A-level tourist attractions | 0.689 | 0.654 | 0.711 | 0.684 |
| Traffic Conditions | Highway mileage | 0.517 | 0.793 | 0.804 | 0.704 |
| Industrial Base | The proportion of the tertiary industry to GDP | 0.307 | 0.800 | 0.865 | 0.656 |
Note: The significance level of F-test is 0.05.
Disclaimer/Publisher’s Note: The statements, opinions and data contained in all publications are solely those of the individual author(s) and contributor(s) and not of MDPI and/or the editor(s). MDPI and/or the editor(s) disclaim responsibility for any injury to people or property resulting from any ideas, methods, instructions or products referred to in the content. |
© 2024 by the authors. Licensee MDPI, Basel, Switzerland. This article is an open access article distributed under the terms and conditions of the Creative Commons Attribution (CC BY) license (https://creativecommons.org/licenses/by/4.0/).
Share and Cite
MDPI and ACS Style
Yang, J.; Fang, Y.; Zhang, X. Spatiotemporal Evolution and Causal Analysis of Rural Tourism Popularity in Jilin Province Based on Multiple Data. Sustainability 2024, 16, 3637. https://0-doi-org.brum.beds.ac.uk/10.3390/su16093637
AMA Style
Yang J, Fang Y, Zhang X. Spatiotemporal Evolution and Causal Analysis of Rural Tourism Popularity in Jilin Province Based on Multiple Data. Sustainability. 2024; 16(9):3637. https://0-doi-org.brum.beds.ac.uk/10.3390/su16093637
Chicago/Turabian StyleYang, Jia, Yangang Fang, and Xianyu Zhang. 2024. "Spatiotemporal Evolution and Causal Analysis of Rural Tourism Popularity in Jilin Province Based on Multiple Data" Sustainability 16, no. 9: 3637. https://0-doi-org.brum.beds.ac.uk/10.3390/su16093637
Note that from the first issue of 2016, this journal uses article numbers instead of page numbers. See further details here.